Wiktionary edits (hsb)
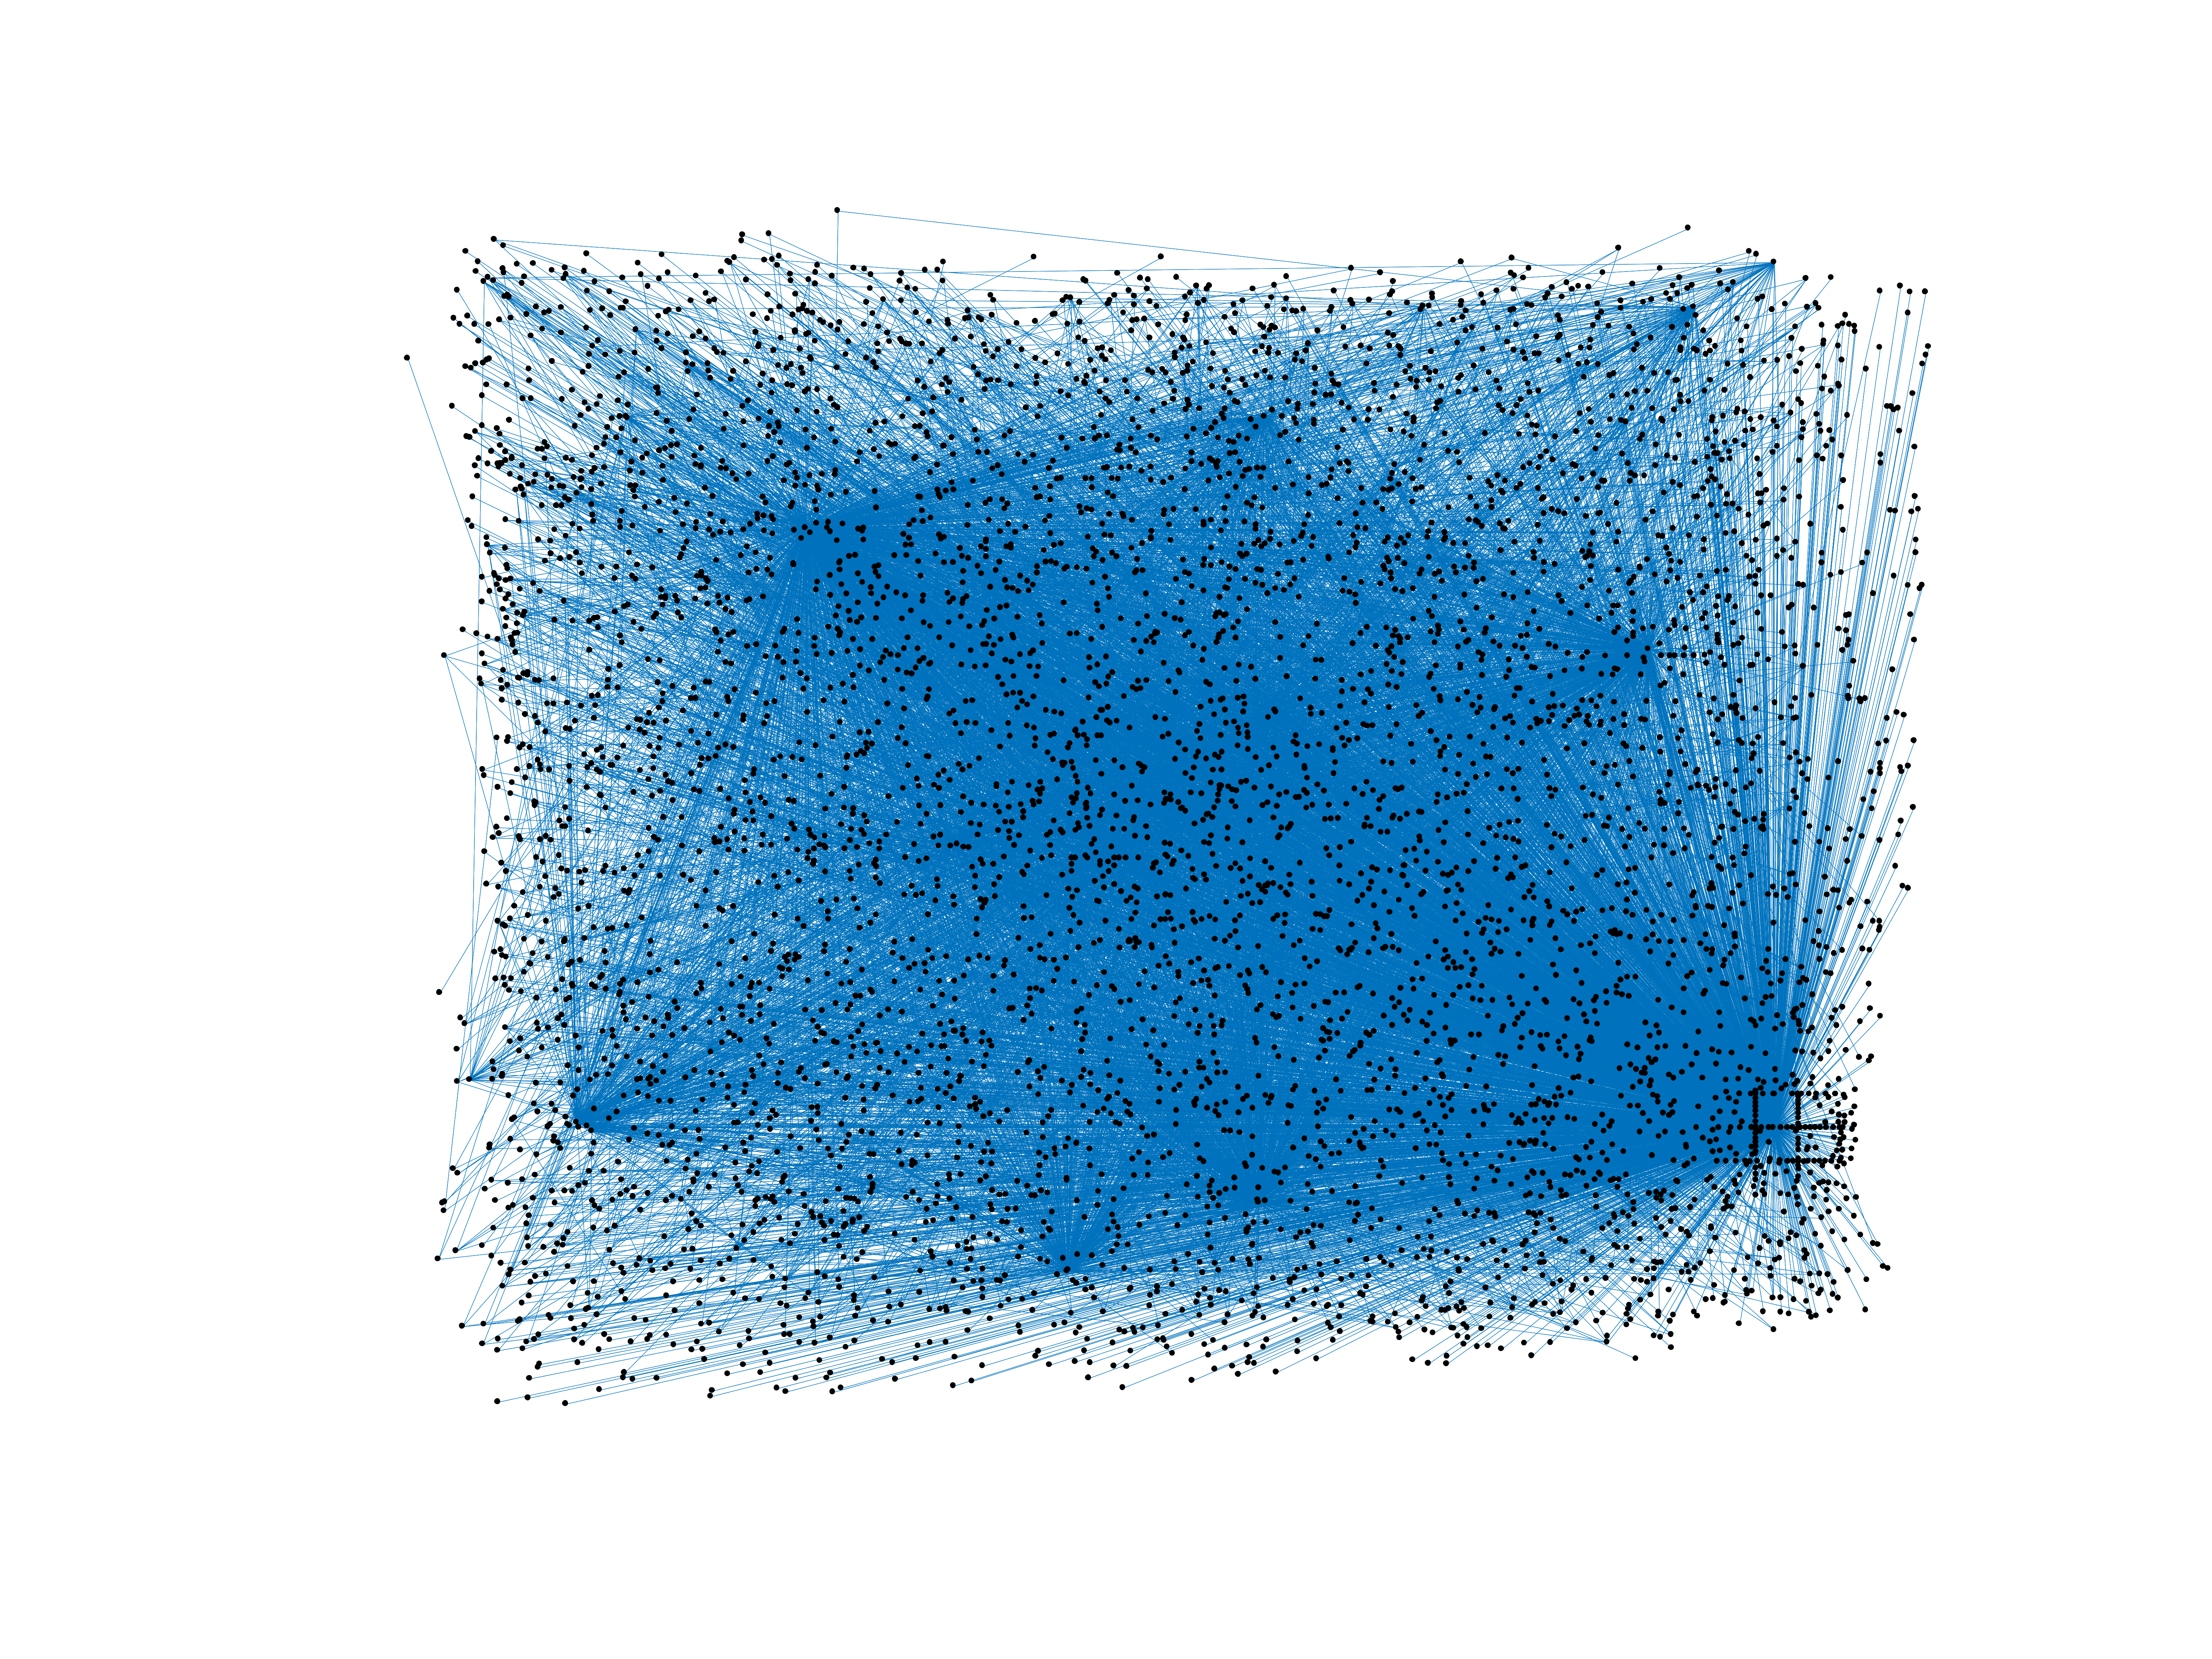
This is the bipartite edit network of the Upper Sorbian Wiktionary. It contains
users and pages from the Upper Sorbian Wiktionary, connected by edit events.
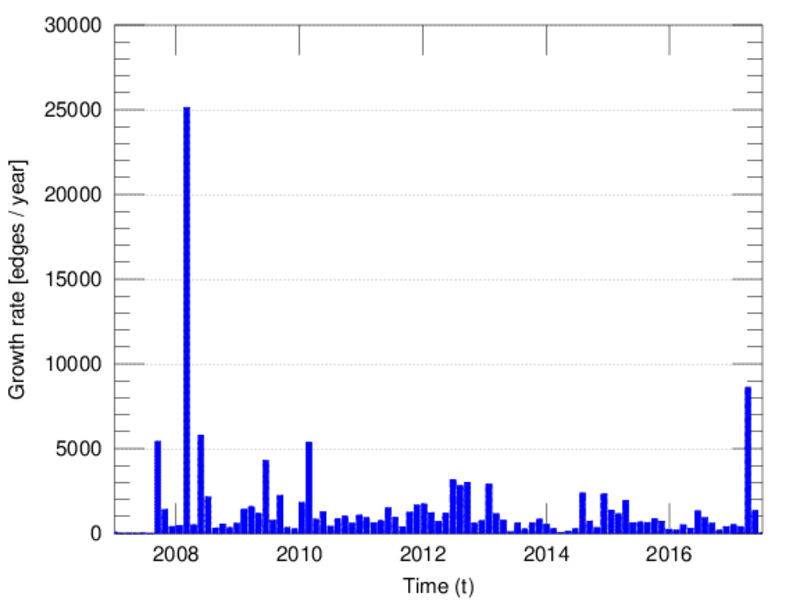
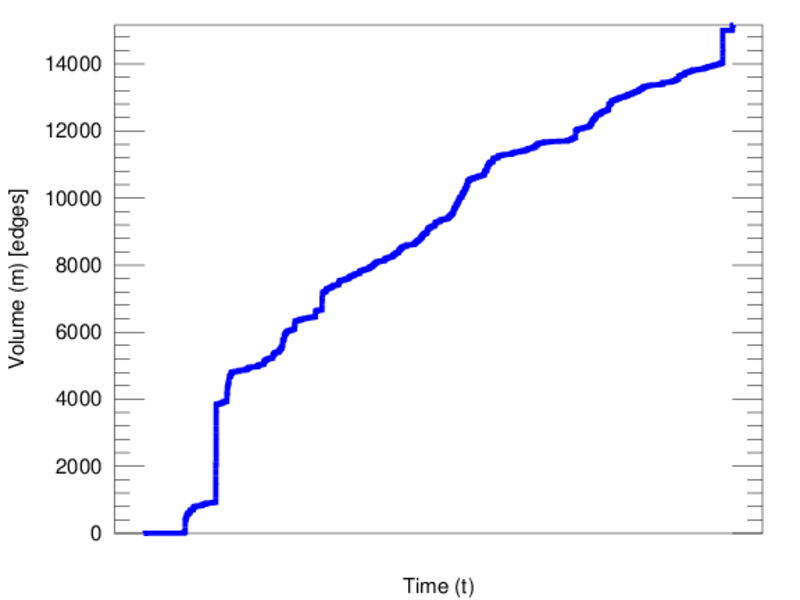
Each edge represents an edit. The dataset includes the timestamp of each edit.
Metadata
Statistics
| Size | n = | 5,591
|
| Left size | n1 = | 230
|
| Right size | n2 = | 5,361
|
| Volume | m = | 15,161
|
| Unique edge count | m̿ = | 9,573
|
| Wedge count | s = | 7,357,334
|
| Claw count | z = | 7,184,717,300
|
| Cross count | x = | 5,959,008,992,645
|
| Square count | q = | 974,841
|
| 4-Tour count | T4 = | 37,248,574
|
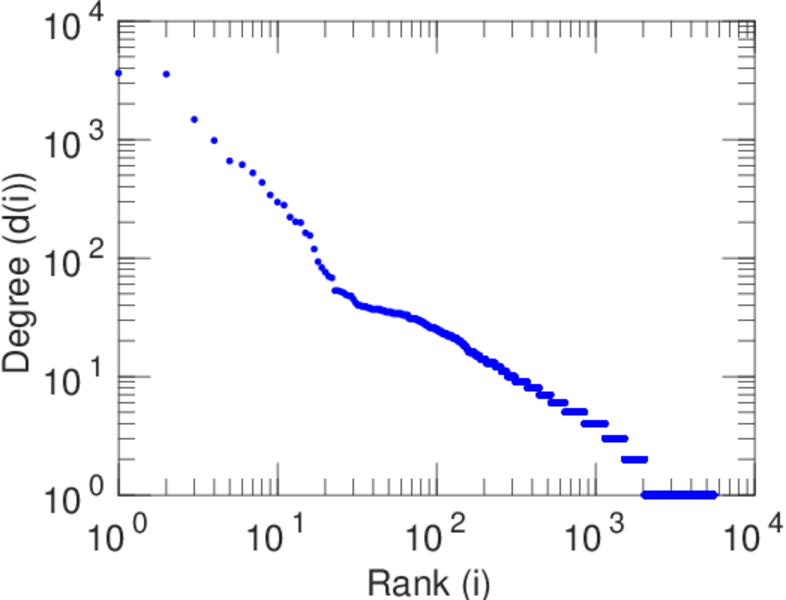
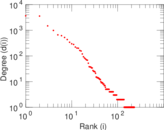
| Maximum degree | dmax = | 3,639
|
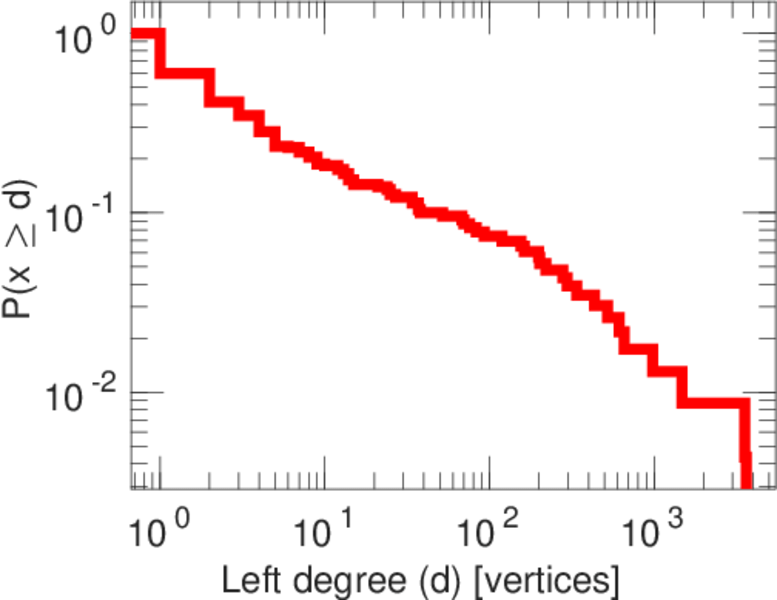
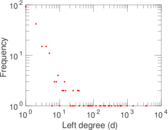
| Maximum left degree | d1max = | 3,639
|
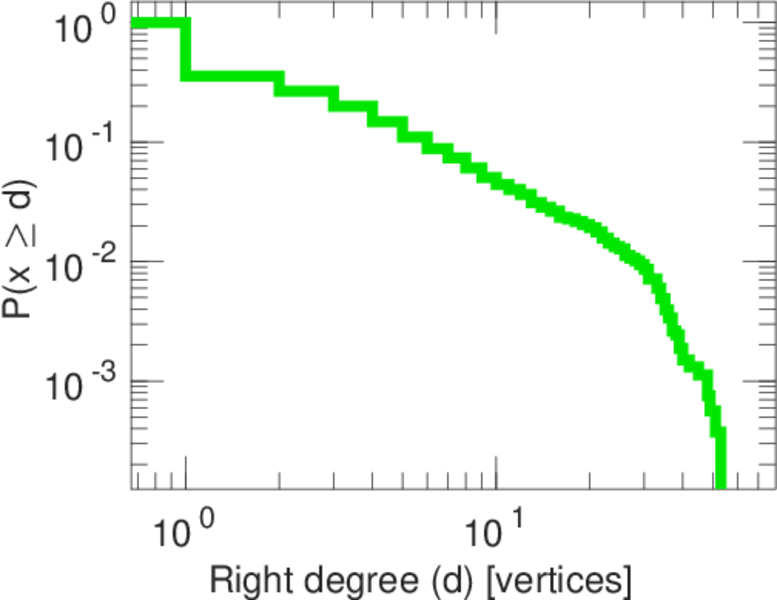
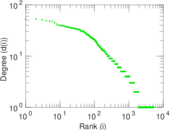
| Maximum right degree | d2max = | 53
|
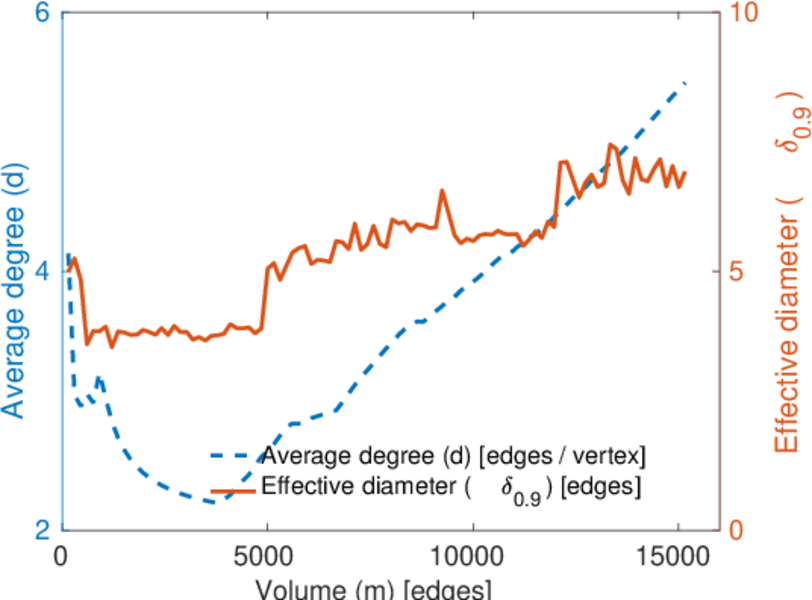
| Average degree | d = | 5.423 36
|
| Average left degree | d1 = | 65.917 4
|
| Average right degree | d2 = | 2.828 02
|
| Fill | p = | 0.007 763 80
|
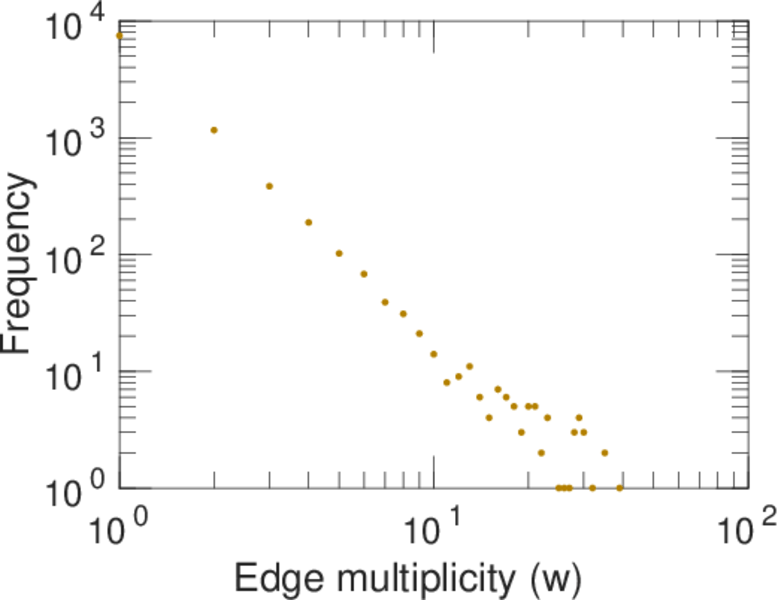
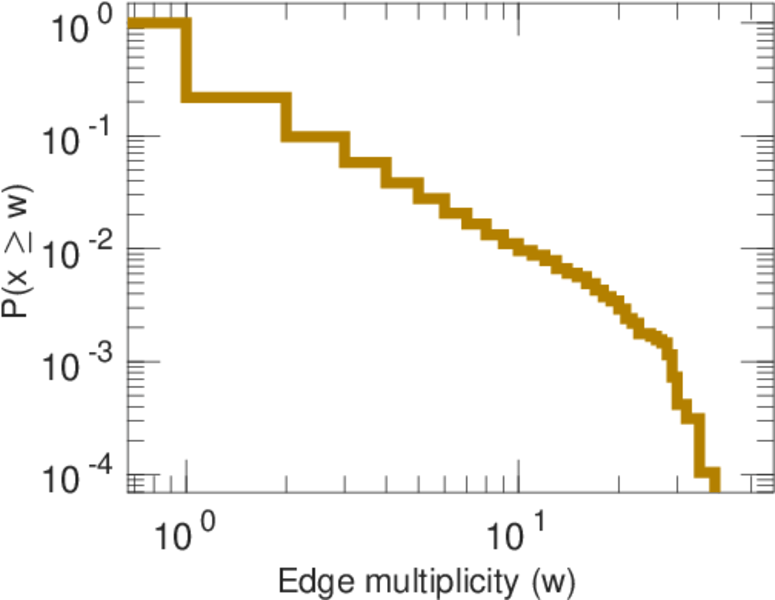
| Average edge multiplicity | m̃ = | 1.583 73
|
| Size of LCC | N = | 5,353
|
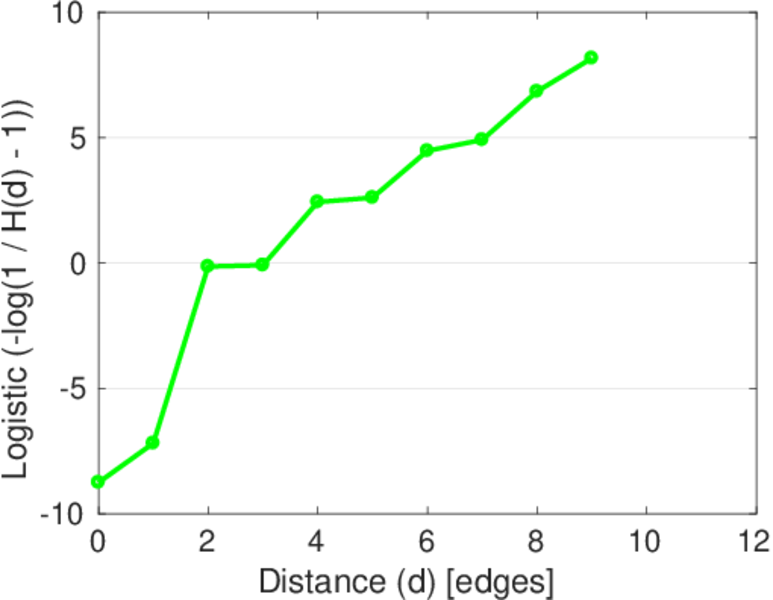
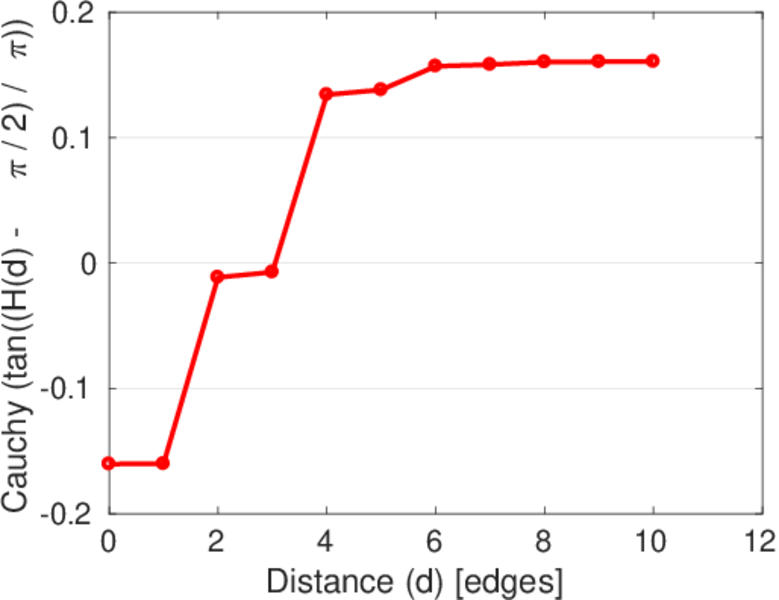
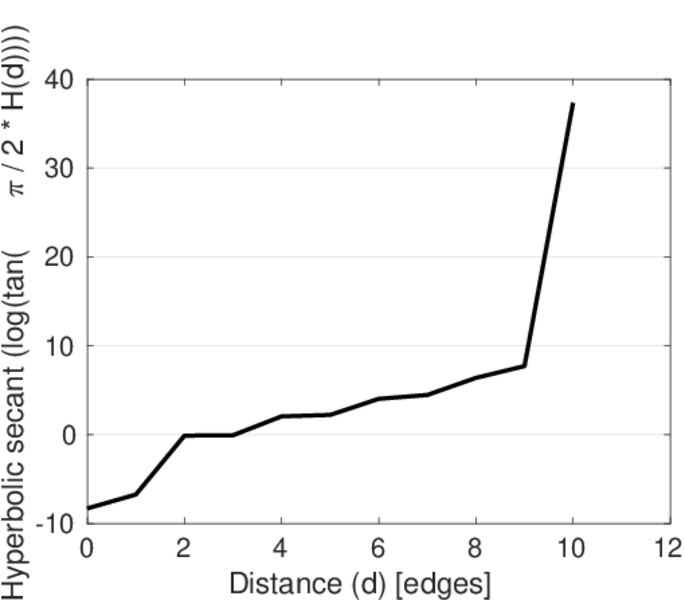
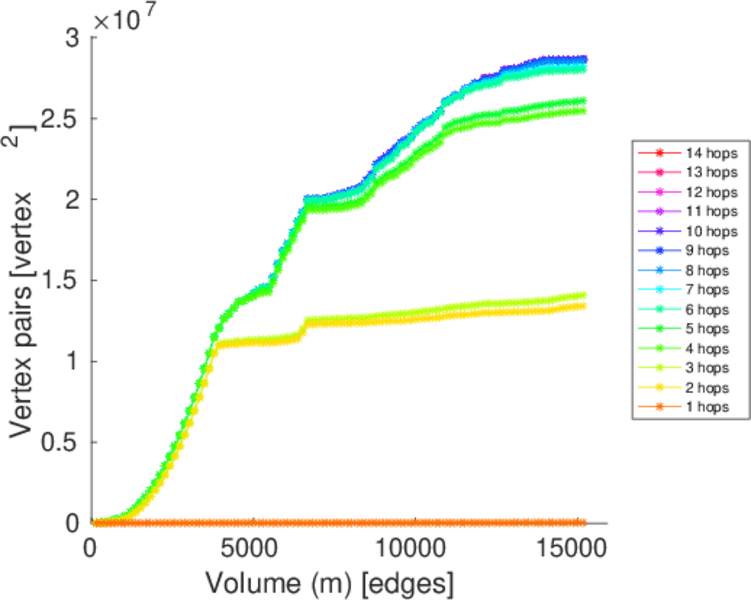
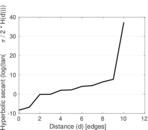
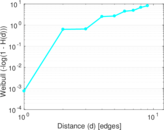
| Diameter | δ = | 14
|
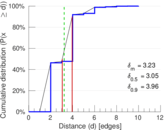
| 50-Percentile effective diameter | δ0.5 = | 3.052 72
|
| 90-Percentile effective diameter | δ0.9 = | 3.957 39
|
| Median distance | δM = | 4
|
| Mean distance | δm = | 3.229 18
|
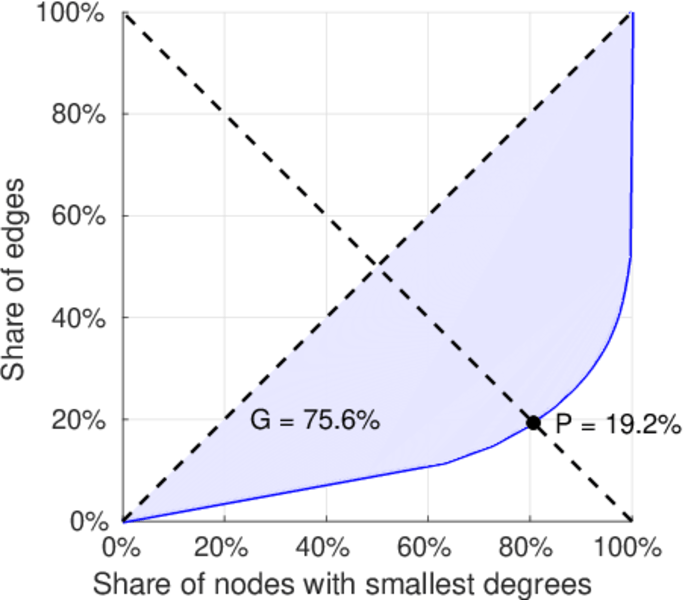
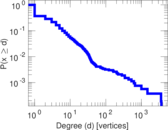
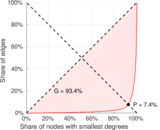
| Gini coefficient | G = | 0.761 474
|
| Balanced inequality ratio | P = | 0.192 072
|
| Left balanced inequality ratio | P1 = | 0.074 137 6
|
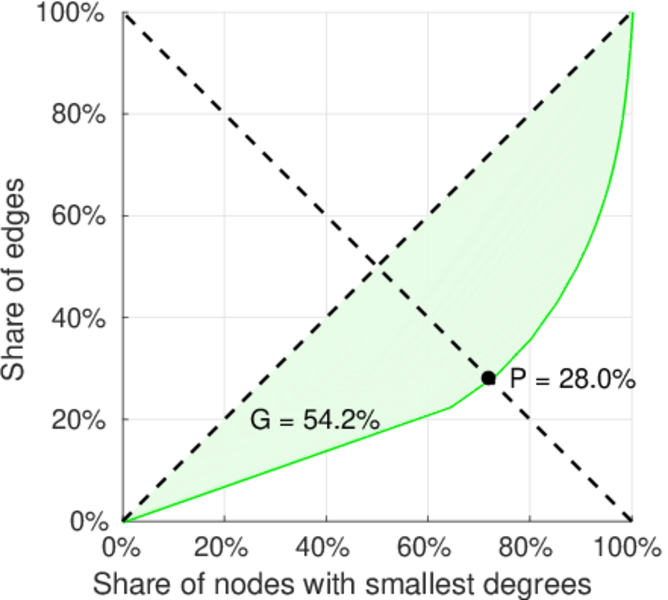
| Right balanced inequality ratio | P2 = | 0.279 863
|
| Relative edge distribution entropy | Her = | 0.719 303
|
| Power law exponent | γ = | 3.626 20
|
| Tail power law exponent | γt = | 2.281 00
|
| Tail power law exponent with p | γ3 = | 2.281 00
|
| p-value | p = | 0.000 00
|
| Left tail power law exponent with p | γ3,1 = | 1.641 00
|
| Left p-value | p1 = | 0.006 000 00
|
| Right tail power law exponent with p | γ3,2 = | 6.611 00
|
| Right p-value | p2 = | 0.439 000
|
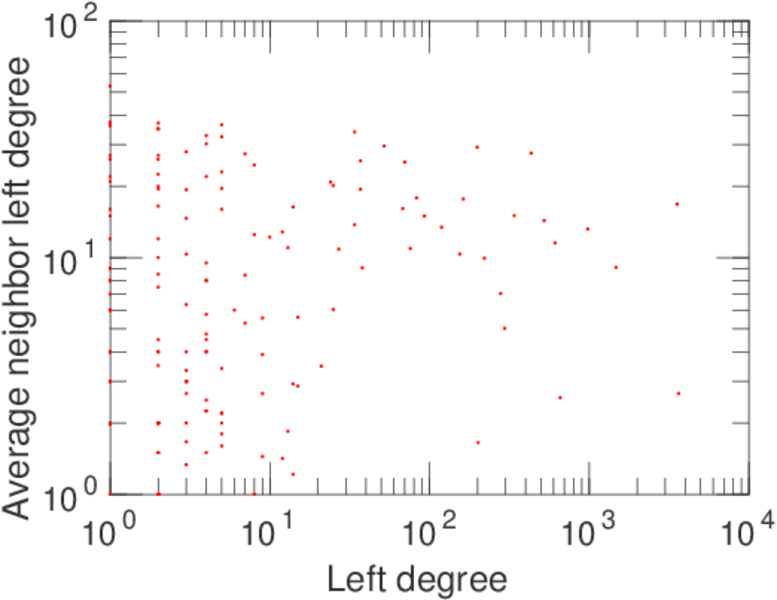
| Degree assortativity | ρ = | −0.433 192
|
| Degree assortativity p-value | pρ = | 0.000 00
|
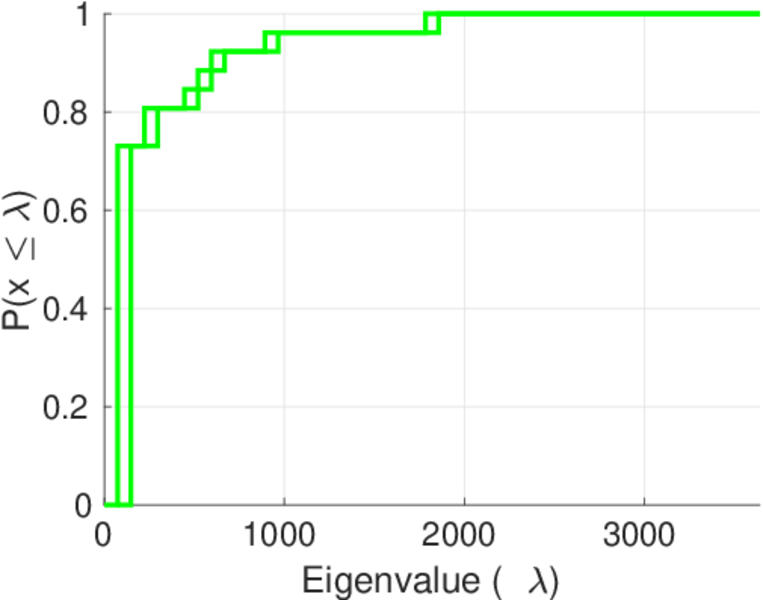
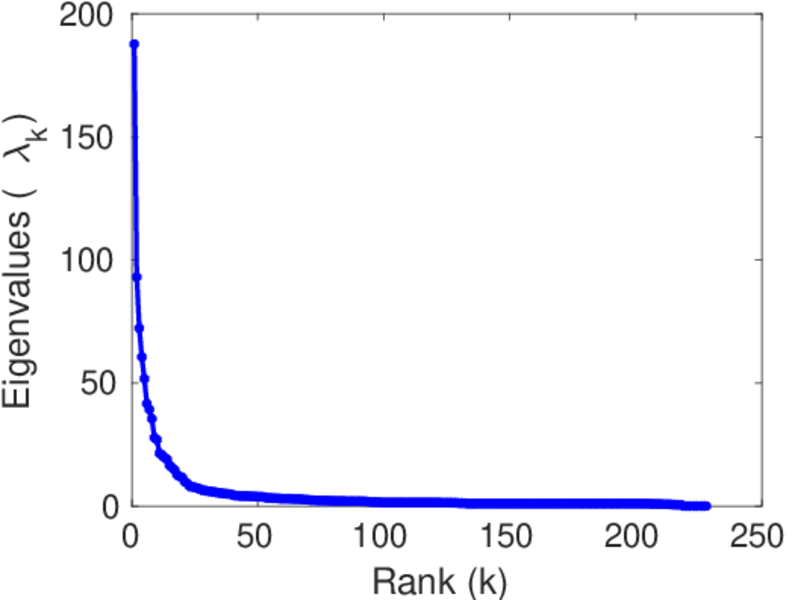
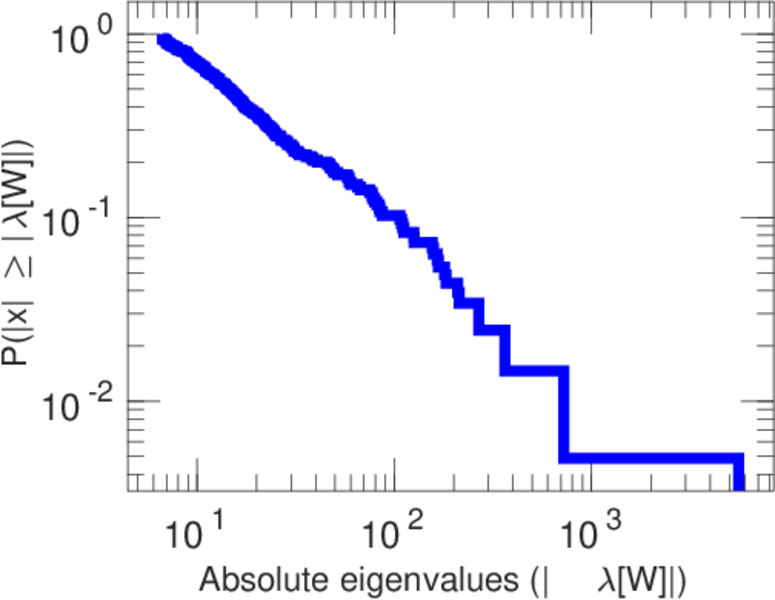
| Spectral norm | α = | 187.634
|
| Algebraic connectivity | a = | 0.011 087 1
|
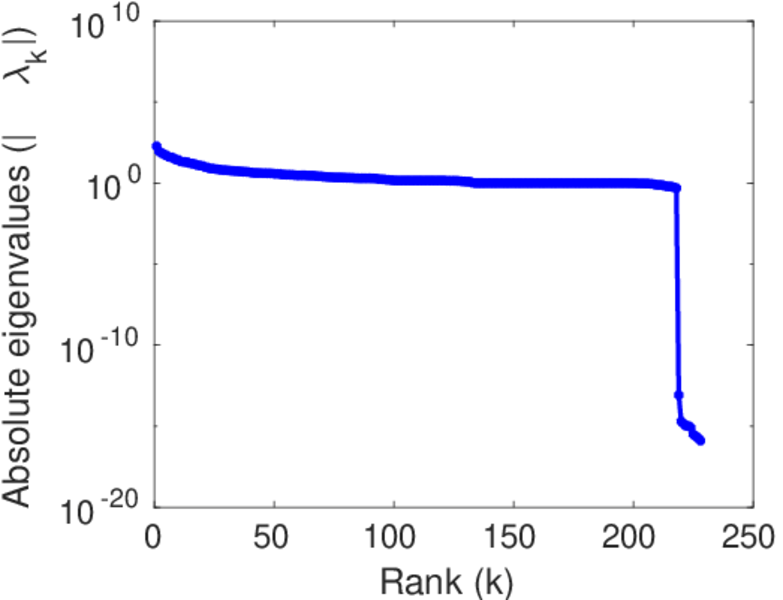
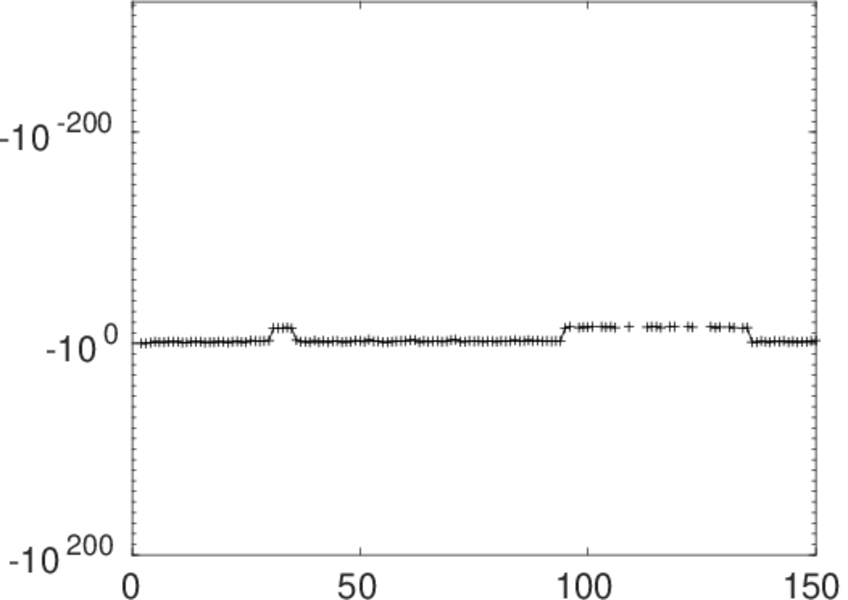
| Spectral separation | |λ1[A] / λ2[A]| = | 2.017 59
|
| Controllability | C = | 5,123
|
| Relative controllability | Cr = | 0.921 569
|
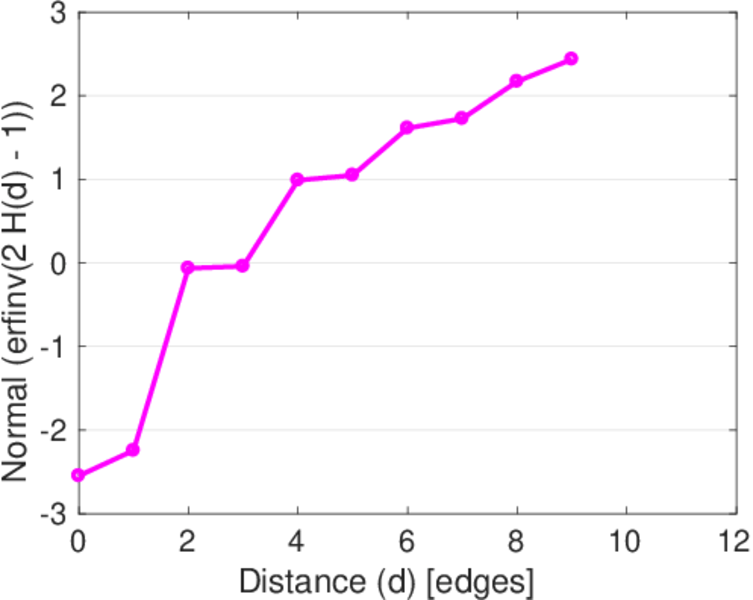
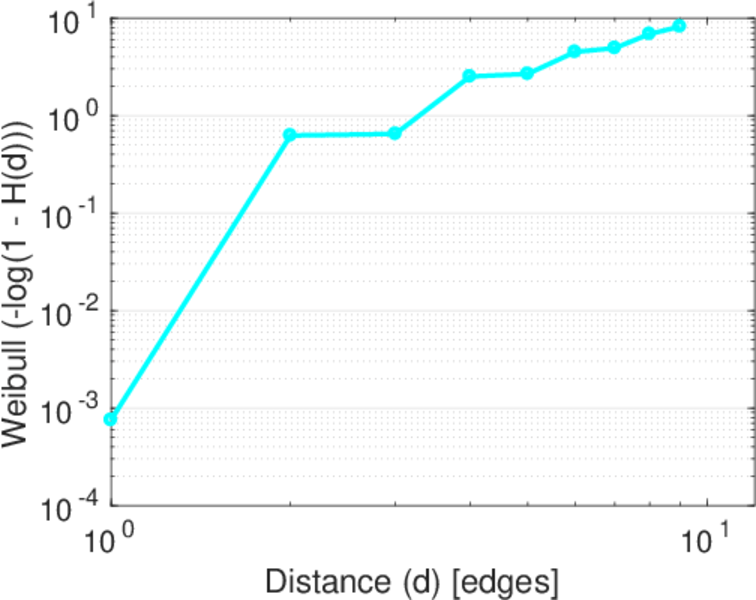
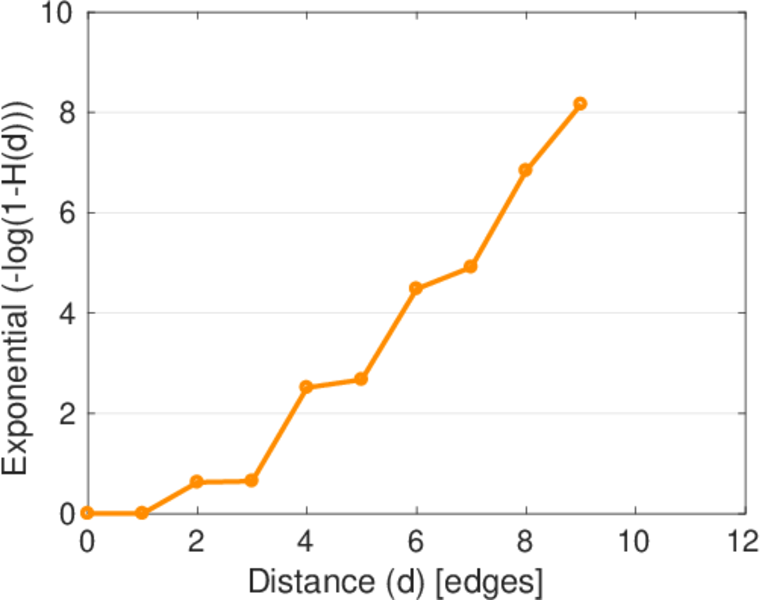
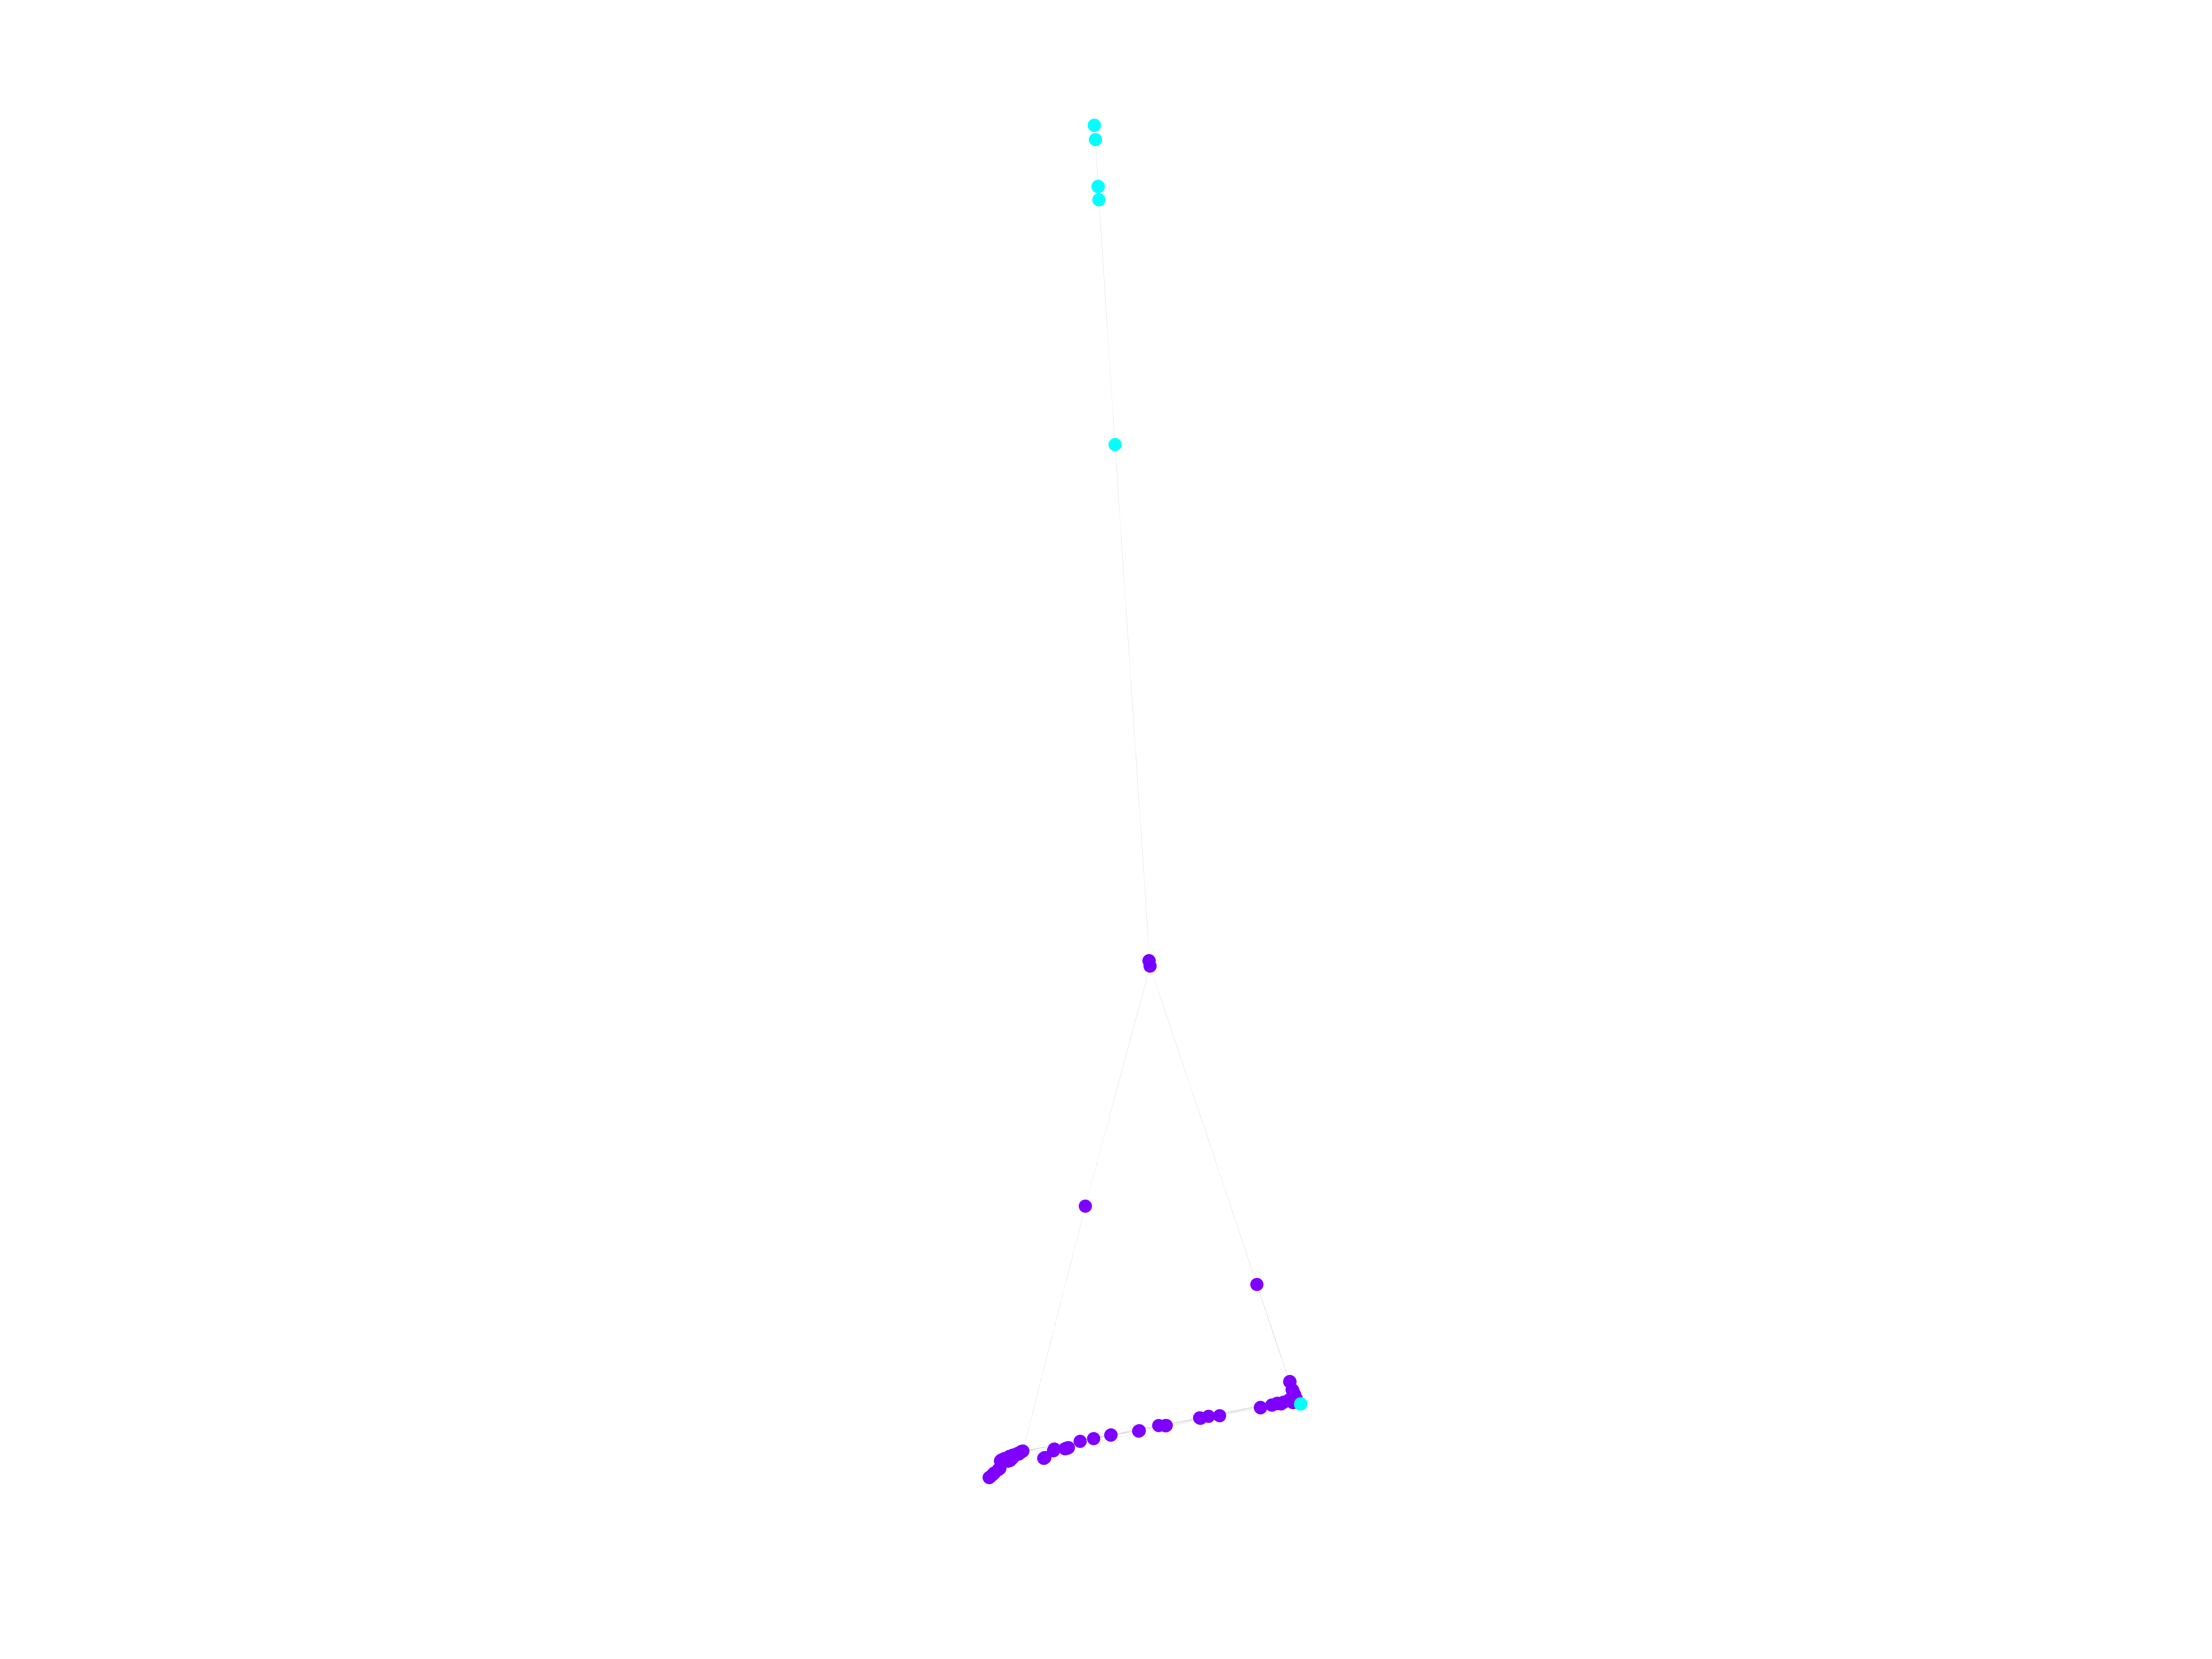
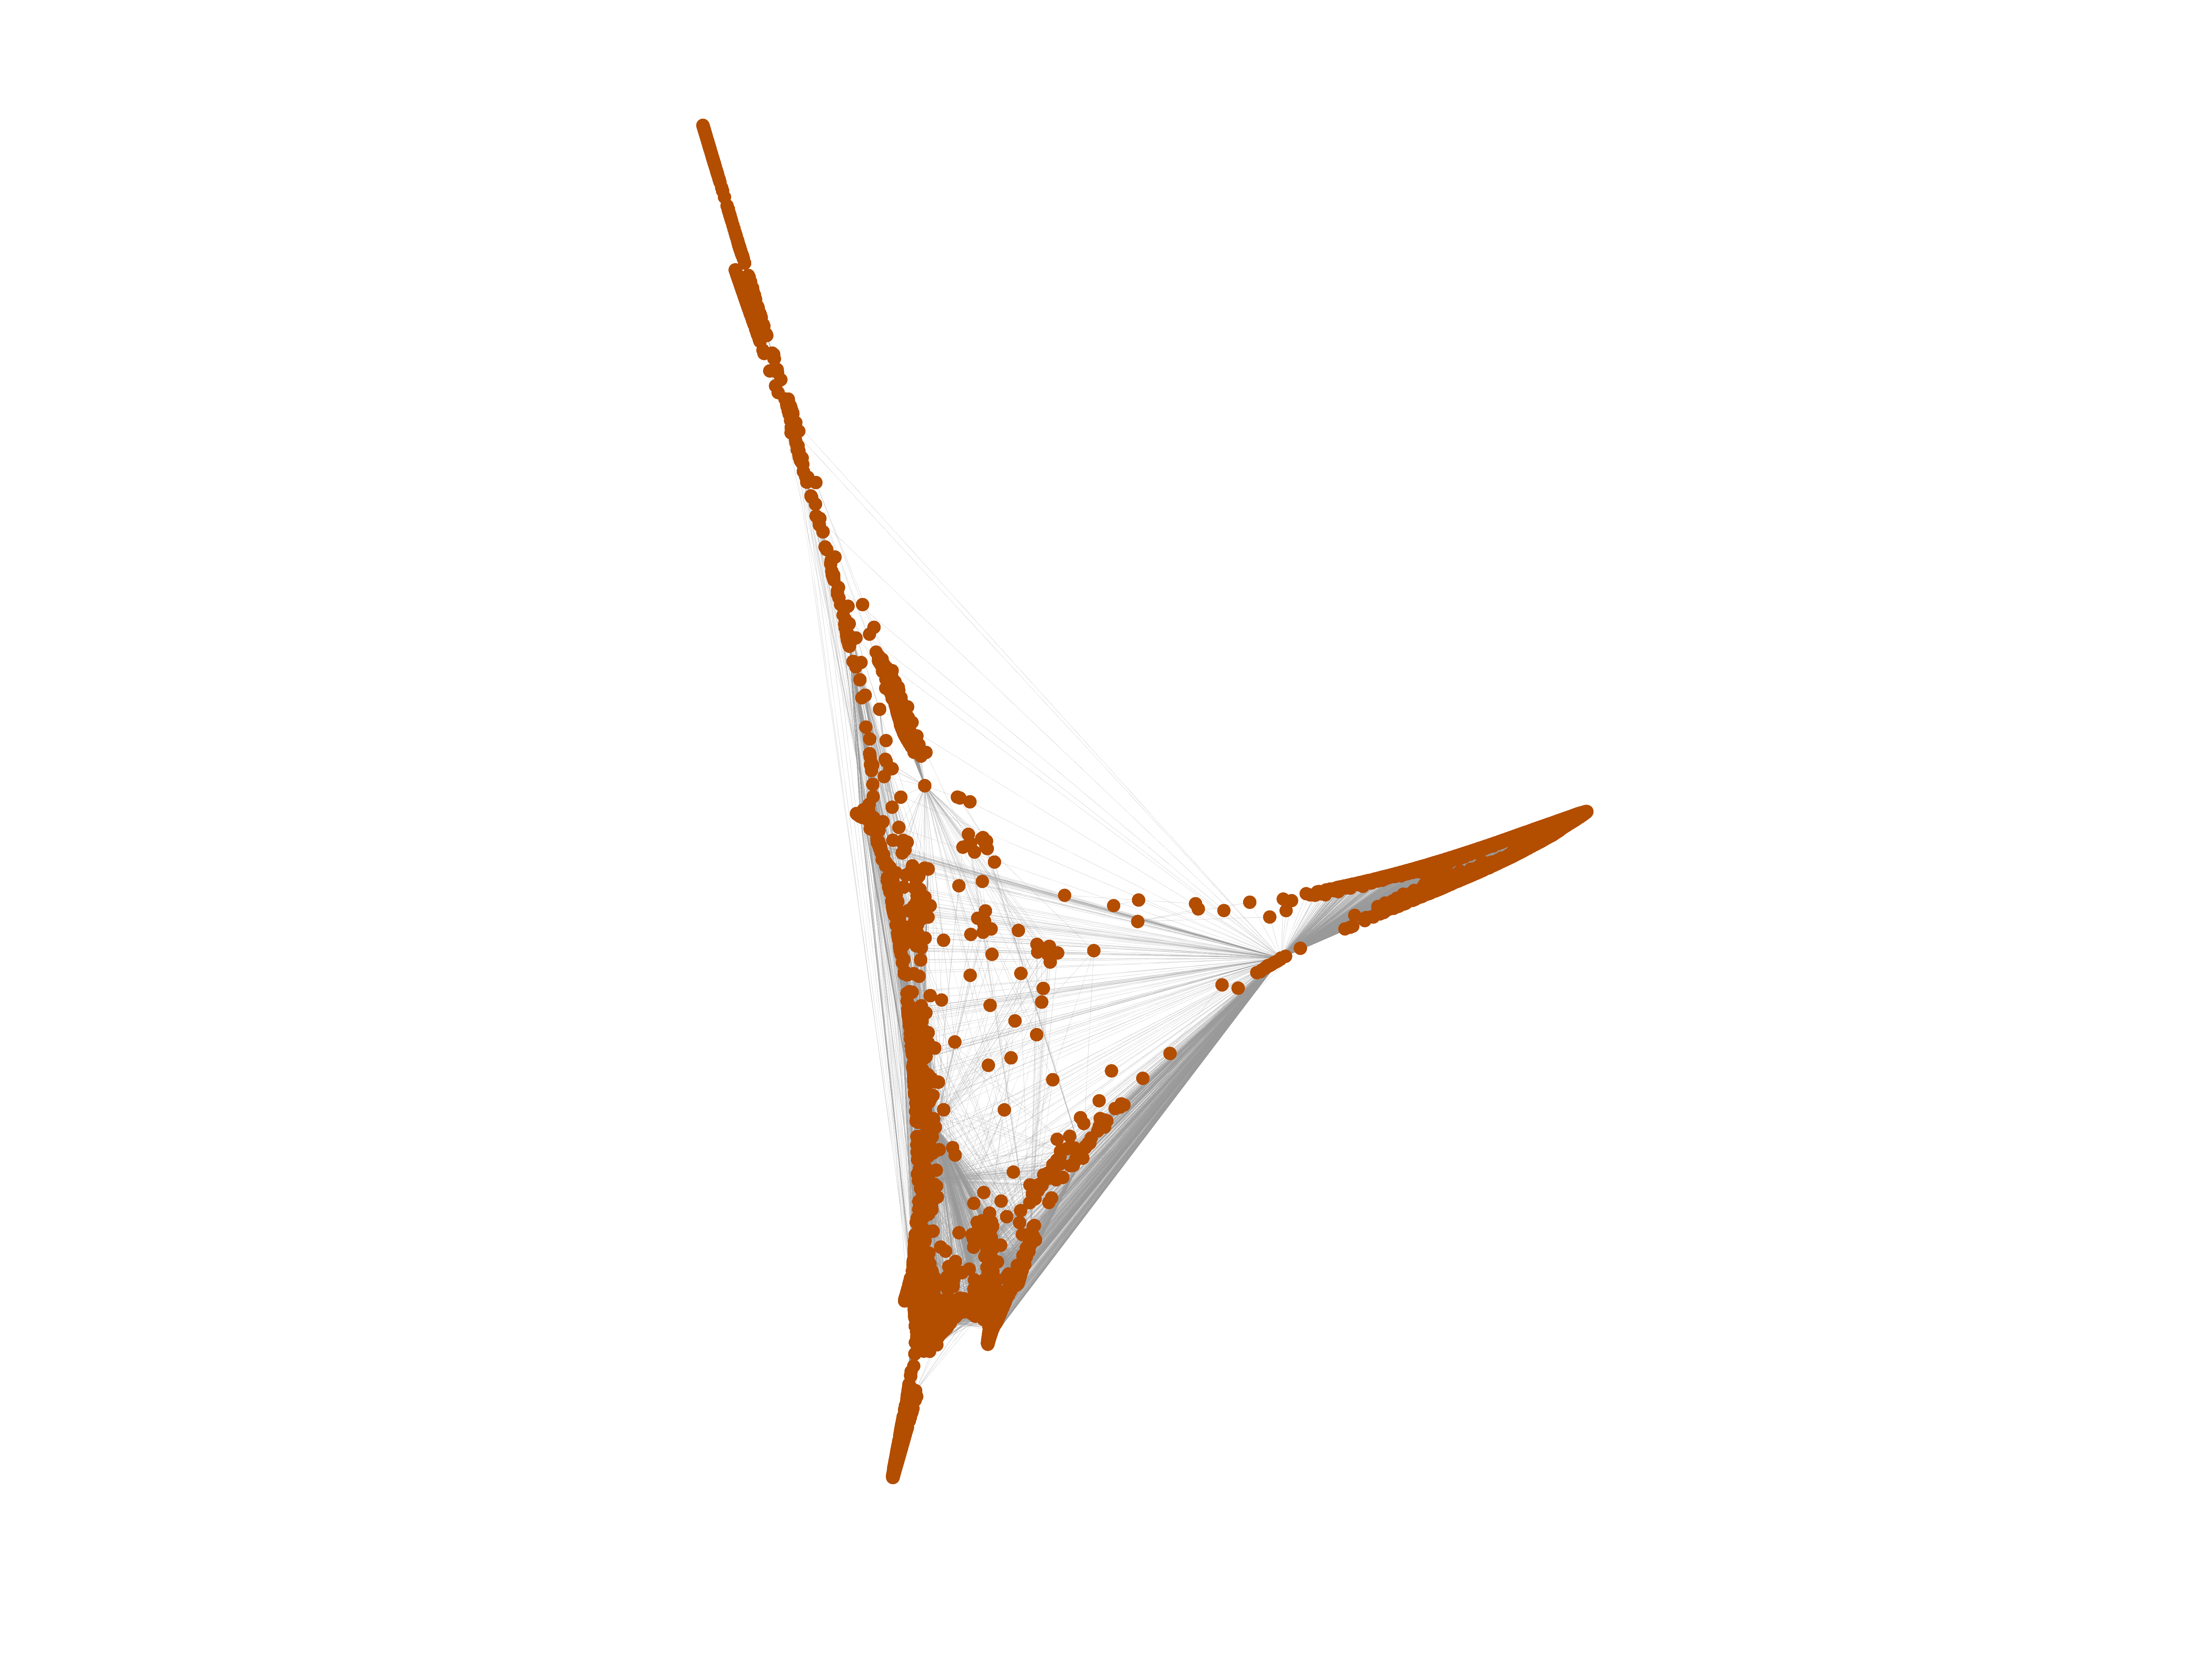
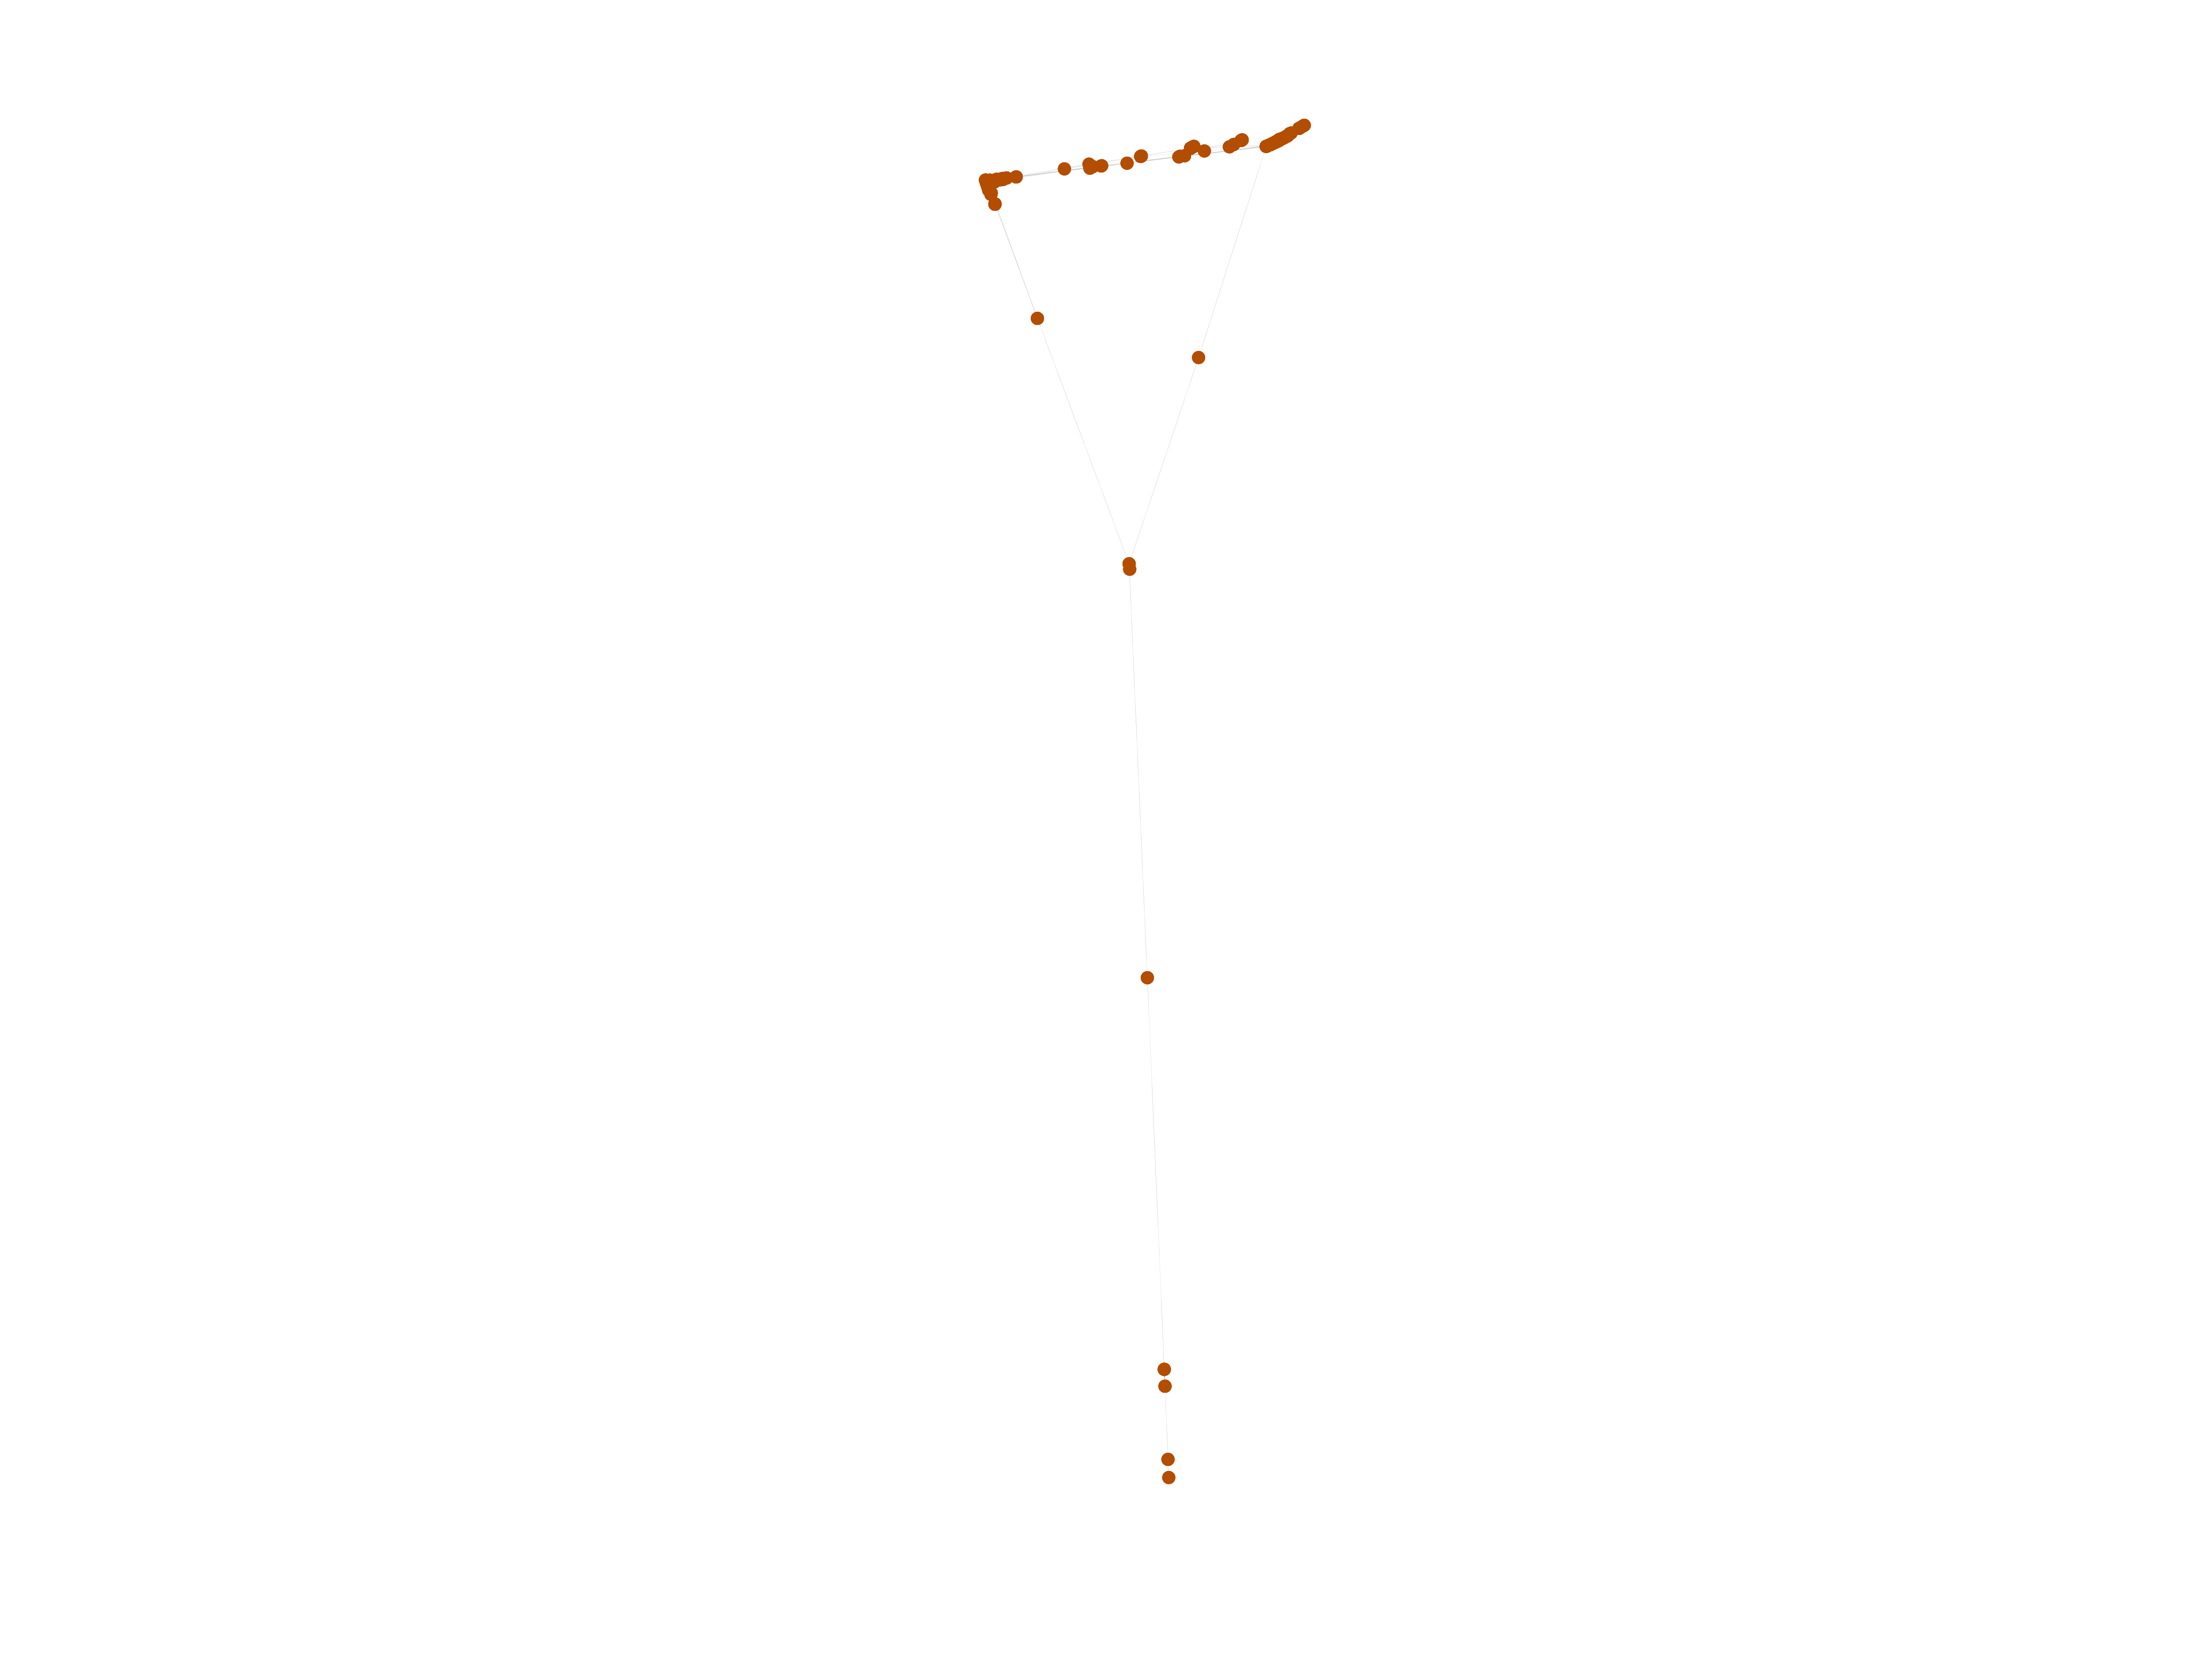
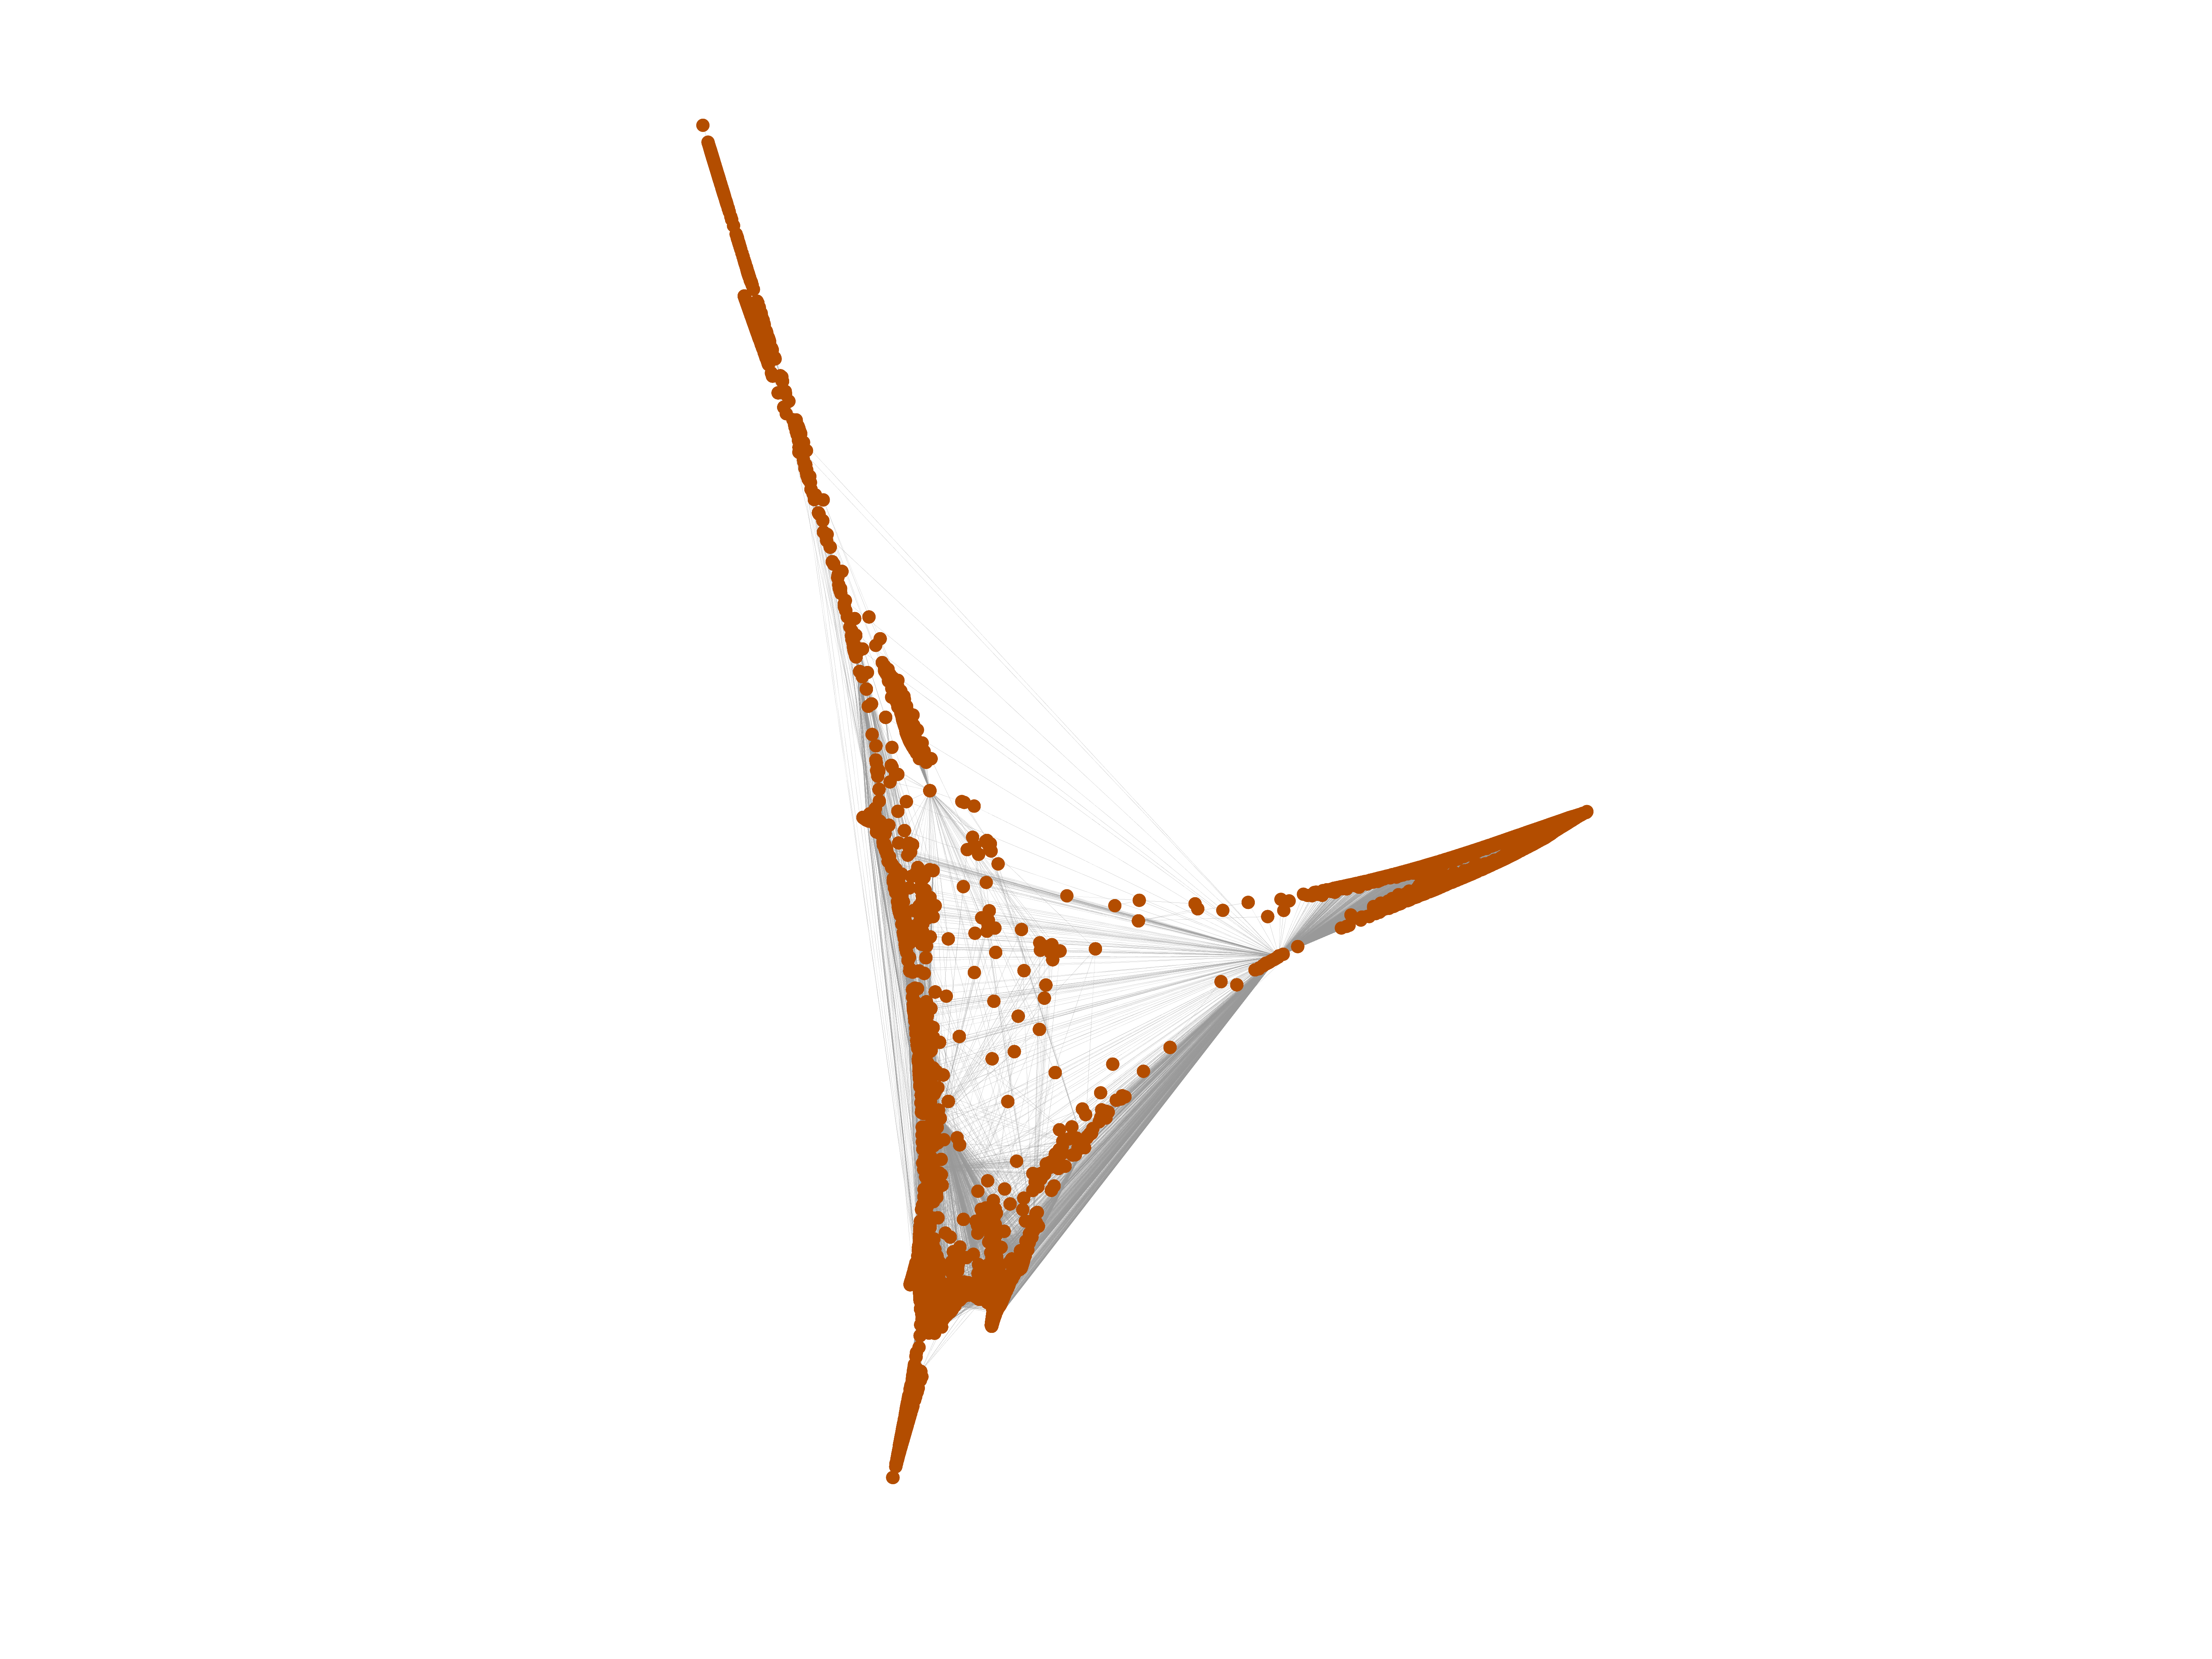
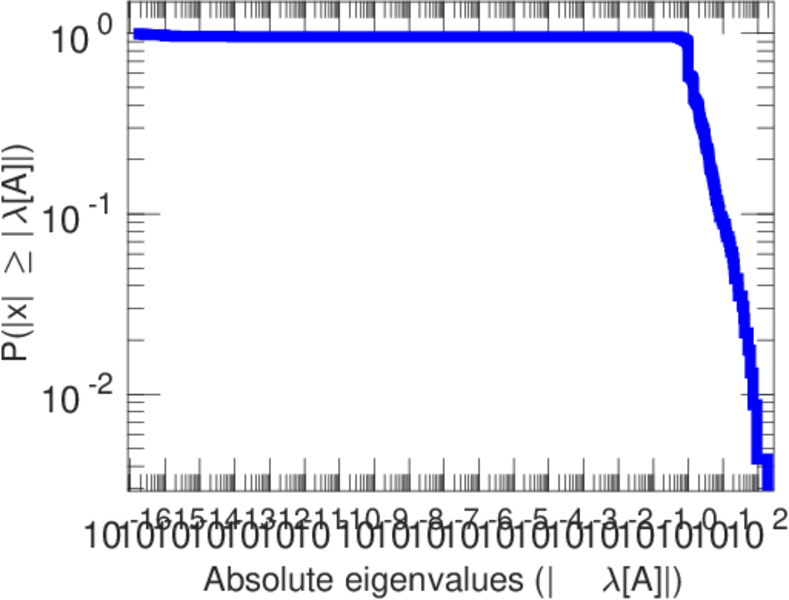
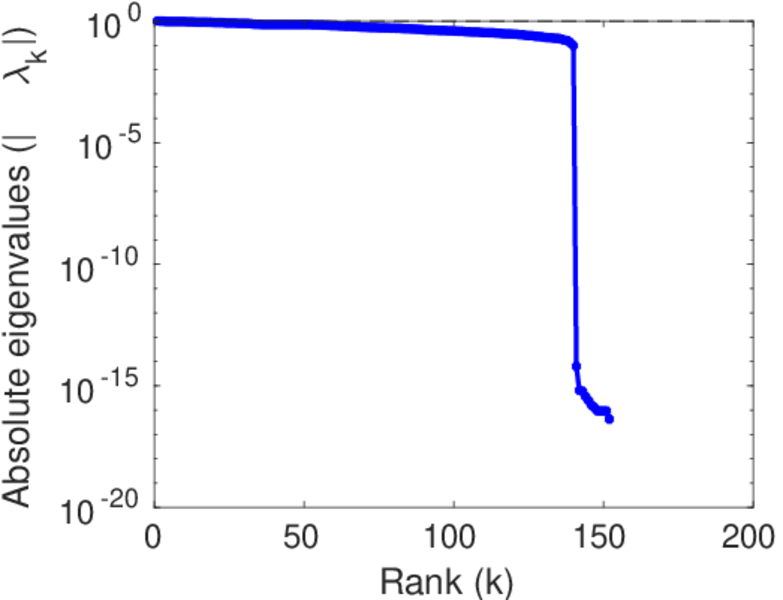
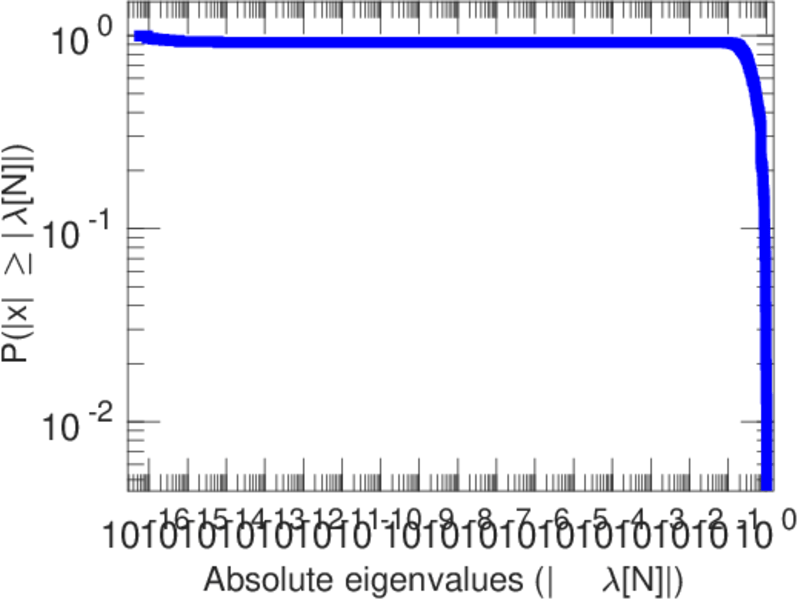
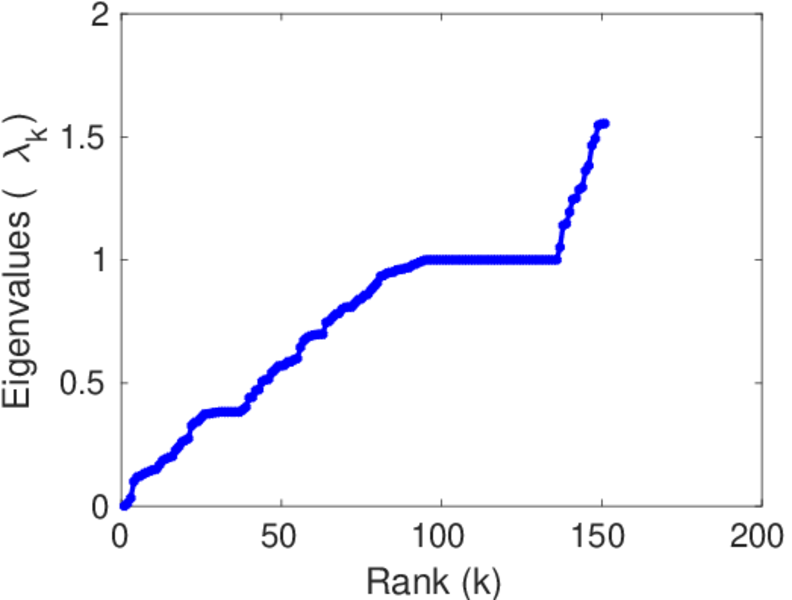
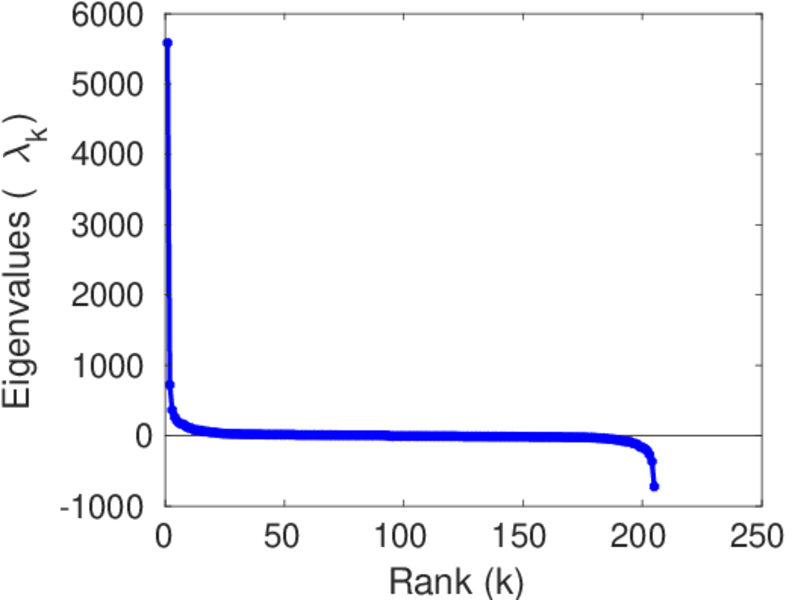
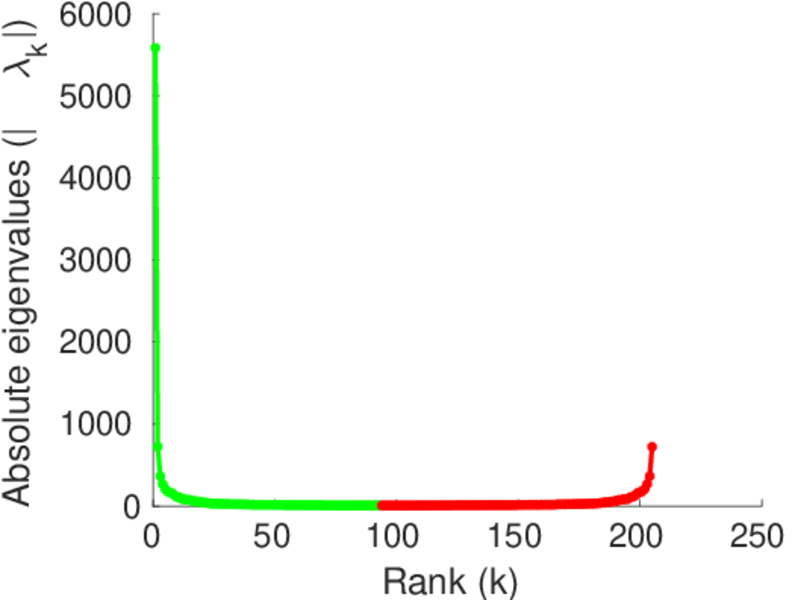
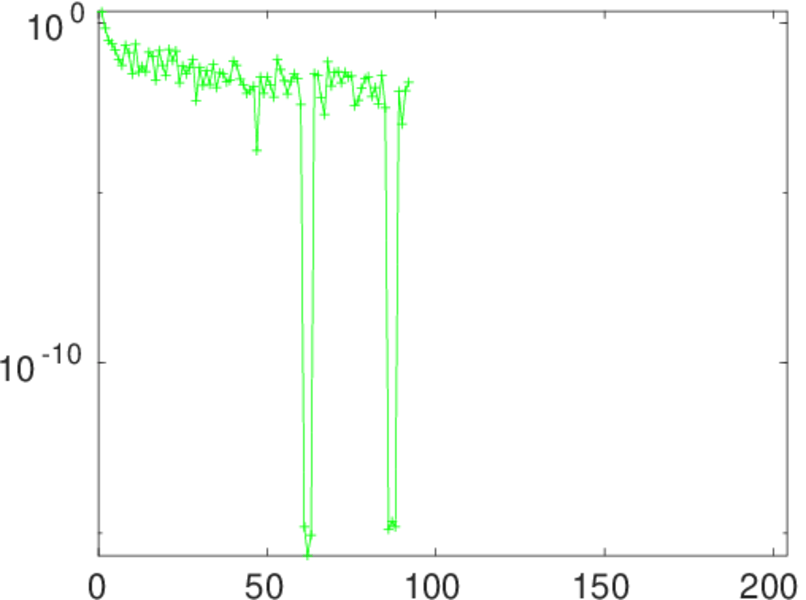
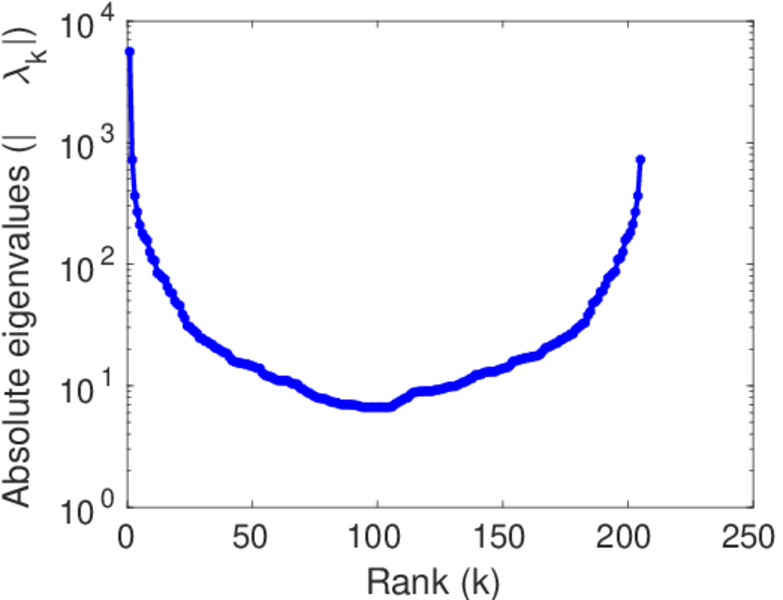
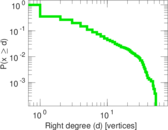
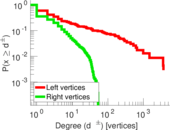
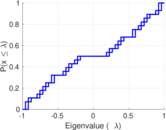
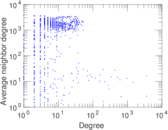
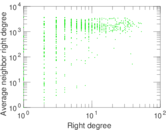
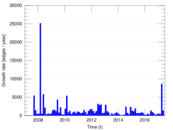
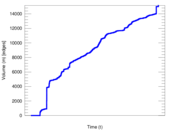
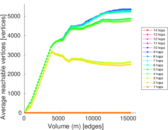
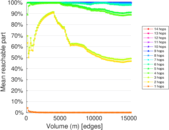
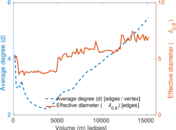
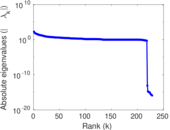
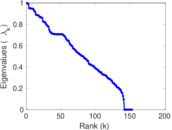
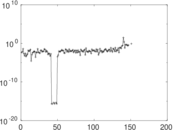
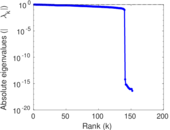
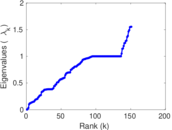
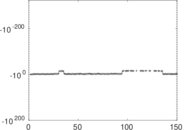
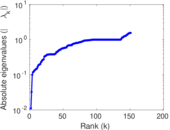
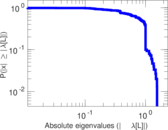
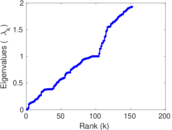
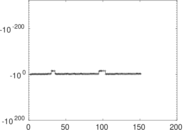
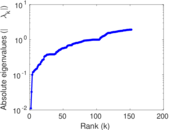
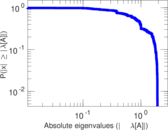
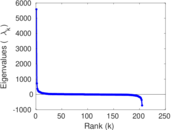
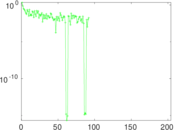
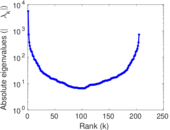
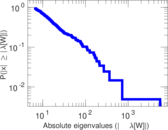
Plots


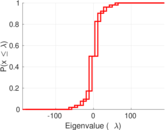


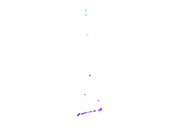
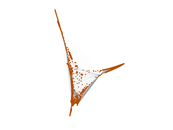
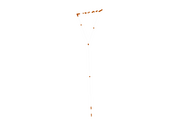


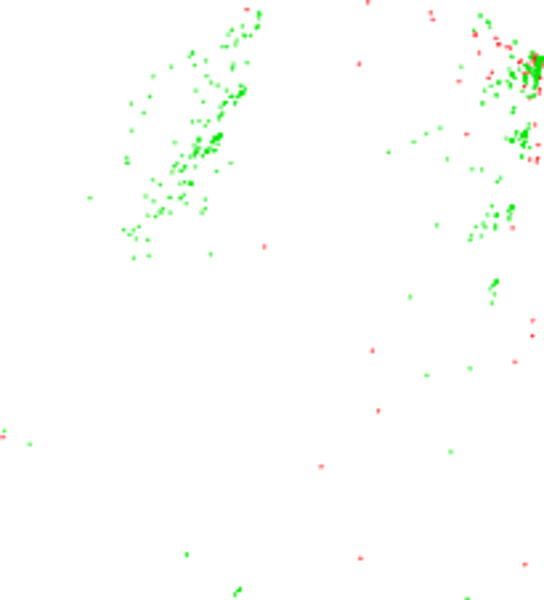
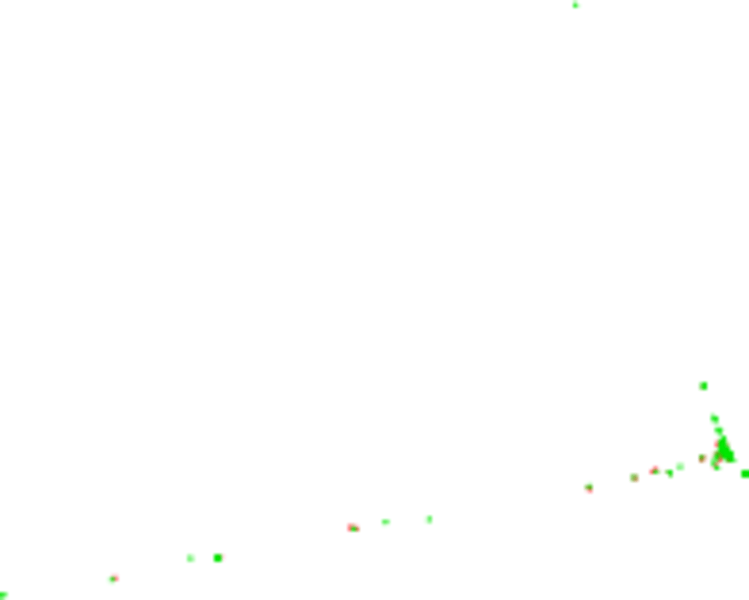
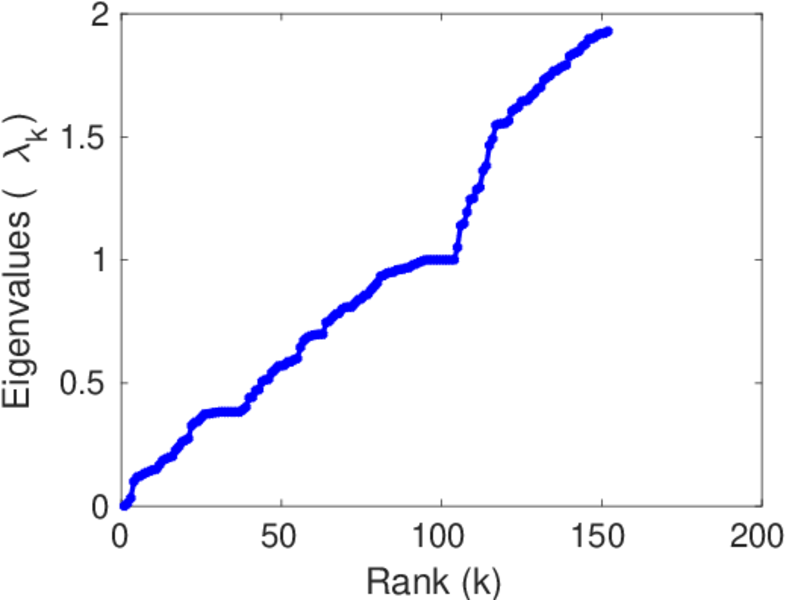
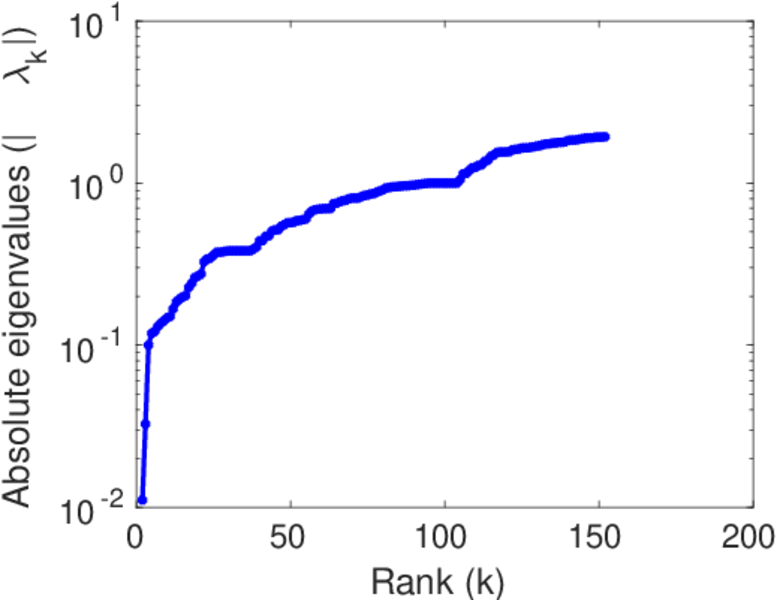
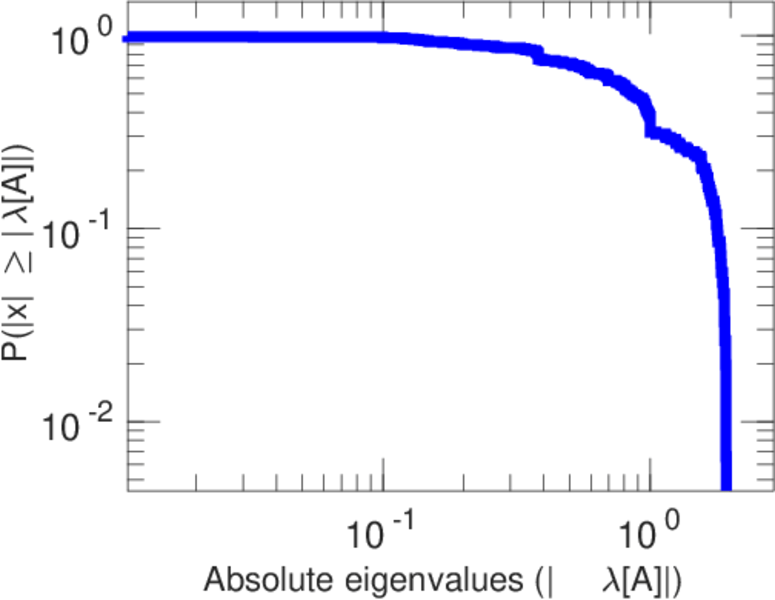
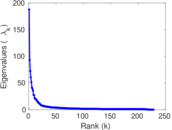
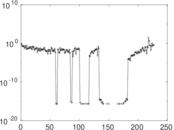
Matrix decompositions plots


Downloads
References
|
[1]
|
Jérôme Kunegis.
KONECT – The Koblenz Network Collection.
In Proc. Int. Conf. on World Wide Web Companion, pages
1343–1350, 2013.
[ http ]
|
|
[2]
|
Wikimedia Foundation.
Wikimedia downloads.
http://dumps.wikimedia.org/, January 2010.
|
 KONECT ‣ Networks ‣
Buy Me a Coffee
KONECT ‣ Networks ‣
Buy Me a Coffee