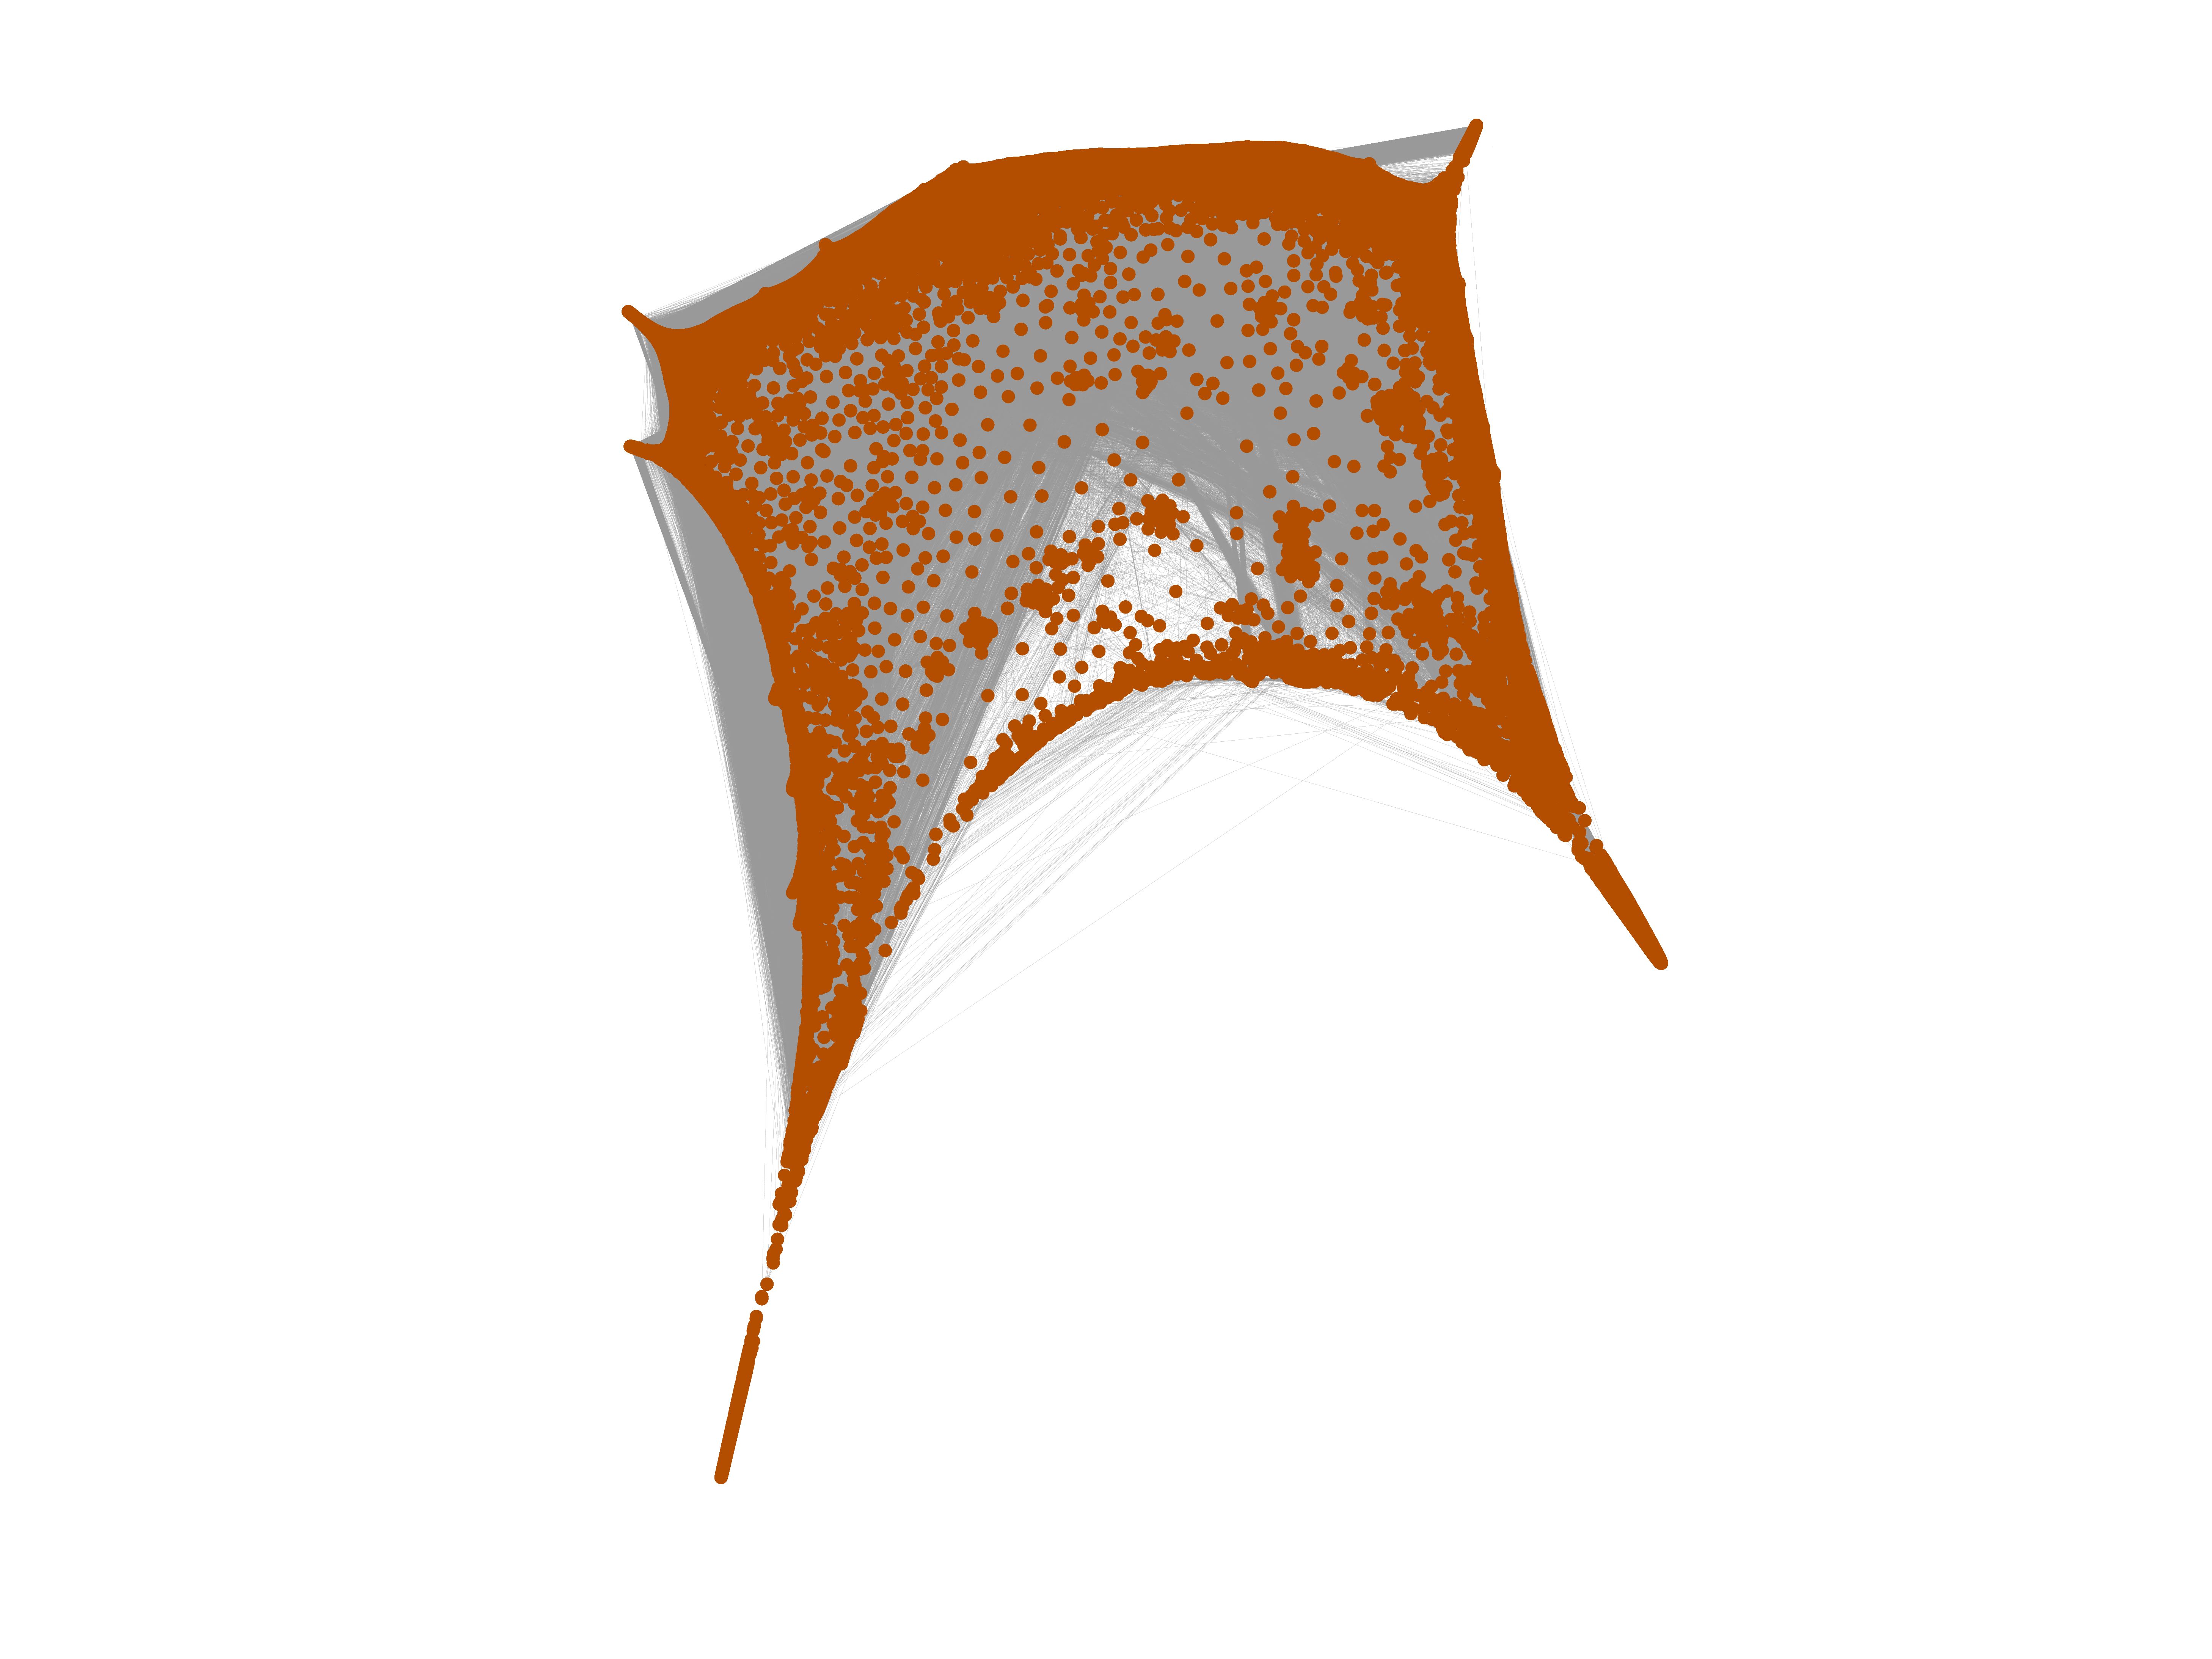
Wikipedia edits (ht)
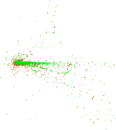
This is the bipartite edit network of the Haitian Creole Wikipedia. It contains
users and pages from the Haitian Creole Wikipedia, connected by edit events.
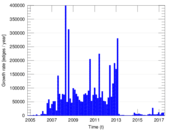
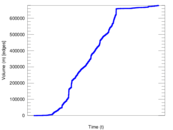
Each edge represents an edit. The dataset includes the timestamp of each edit.
Metadata
Statistics
| Size | n = | 64,801
|
| Left size | n1 = | 2,045
|
| Right size | n2 = | 62,756
|
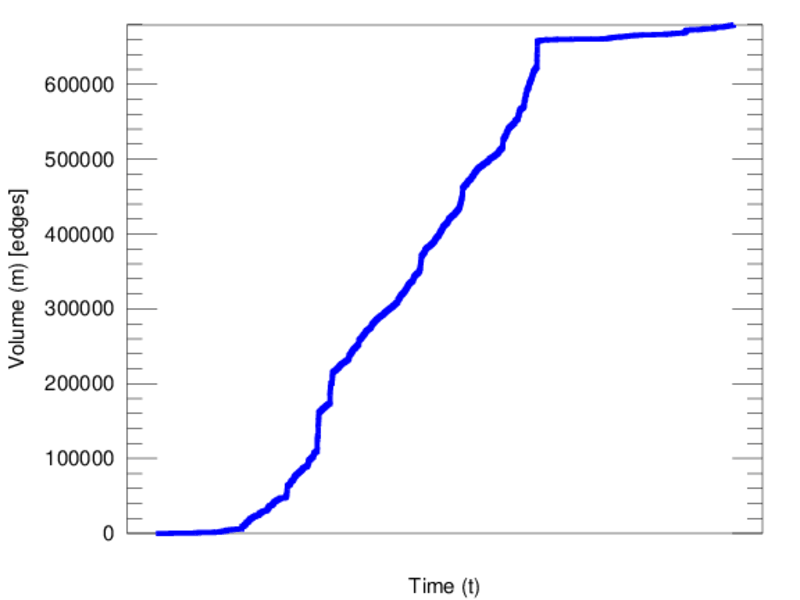
| Volume | m = | 679,189
|
| Unique edge count | m̿ = | 398,588
|
| Wedge count | s = | 3,094,636,304
|
| Claw count | z = | 28,306,085,088,306
|
| Cross count | x = | 241,361,004,591,982,720
|
| Square count | q = | 4,488,984,303
|
| 4-Tour count | T4 = | 48,291,928,924
|
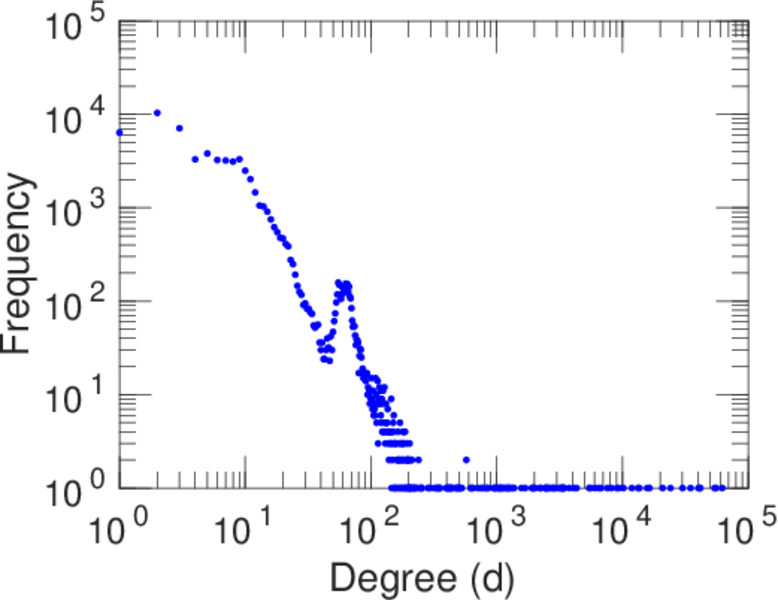
| Maximum degree | dmax = | 62,197
|
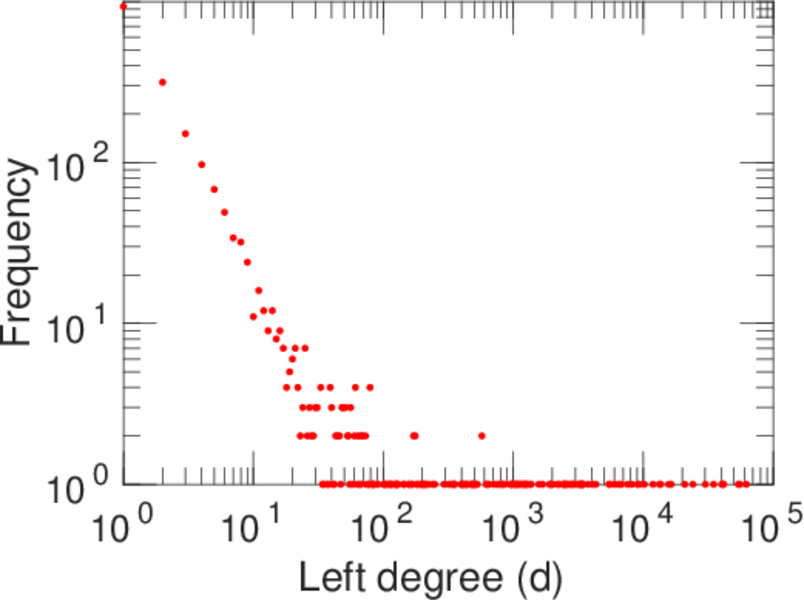
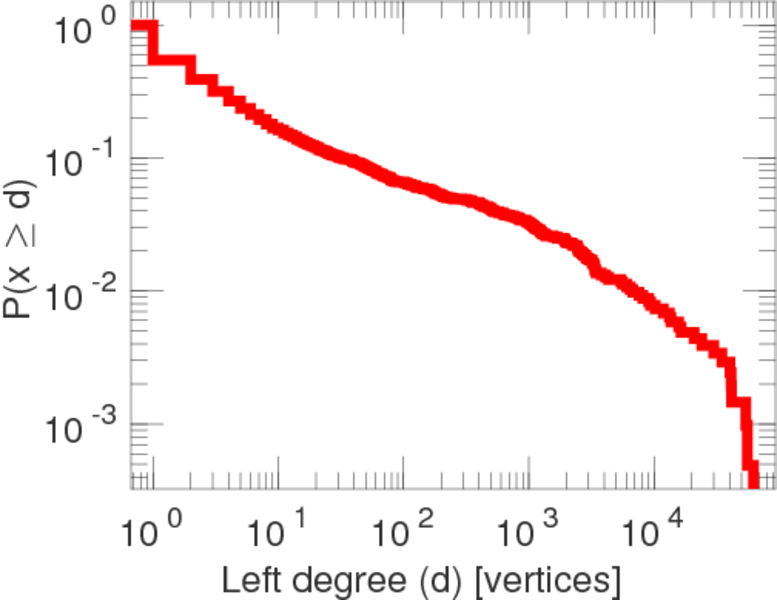
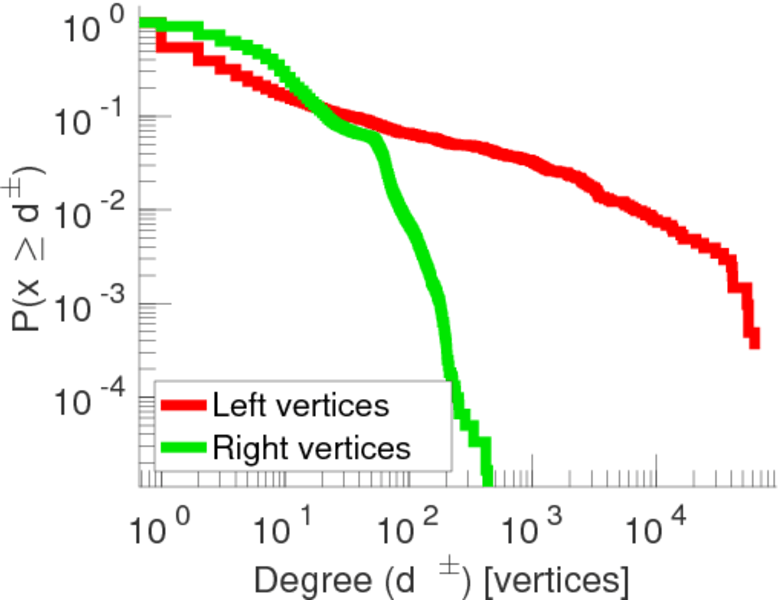
| Maximum left degree | d1max = | 62,197
|
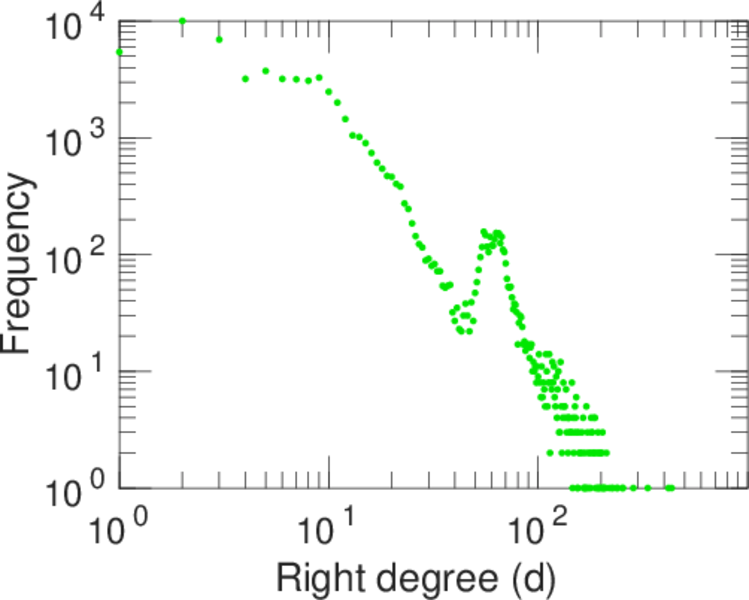
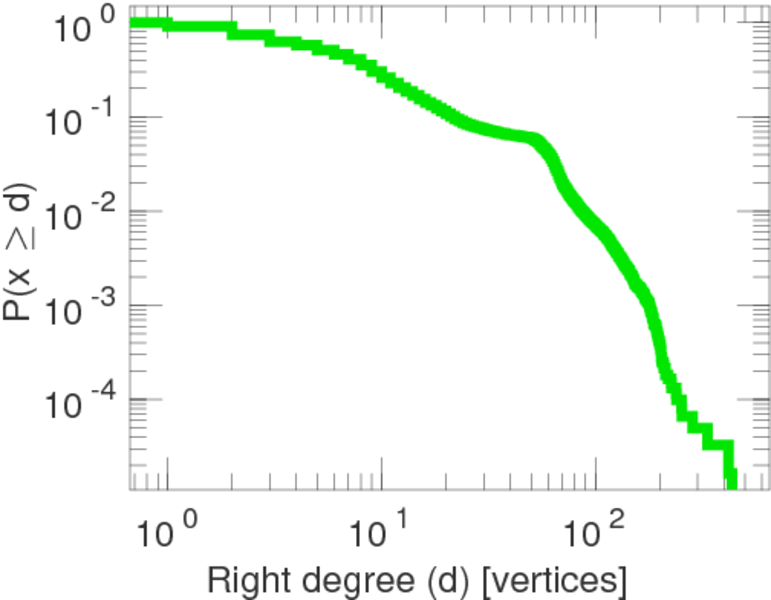
| Maximum right degree | d2max = | 434
|
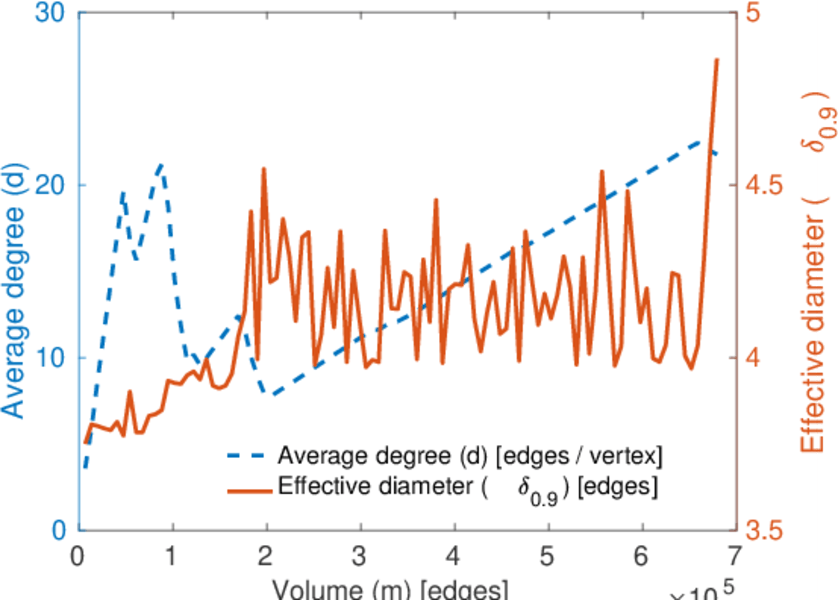
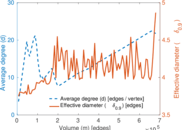
| Average degree | d = | 20.962 3
|
| Average left degree | d1 = | 332.122
|
| Average right degree | d2 = | 10.822 7
|
| Fill | p = | 0.003 105 82
|
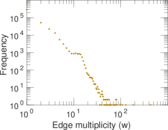
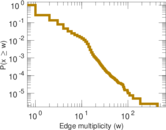
| Average edge multiplicity | m̃ = | 1.703 99
|
| Size of LCC | N = | 61,616
|
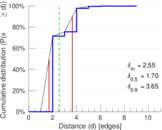
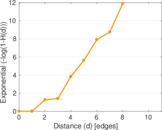
| Diameter | δ = | 13
|
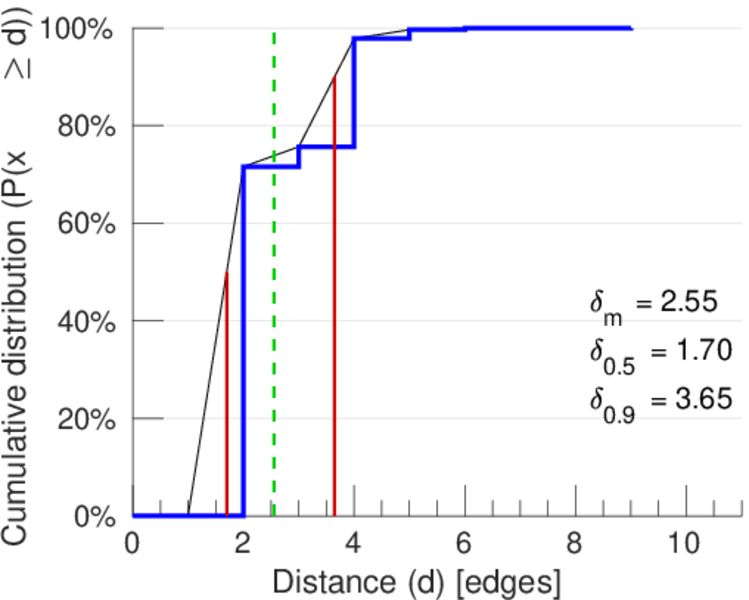
| 50-Percentile effective diameter | δ0.5 = | 1.698 51
|
| 90-Percentile effective diameter | δ0.9 = | 3.646 42
|
| Median distance | δM = | 2
|
| Mean distance | δm = | 2.553 21
|
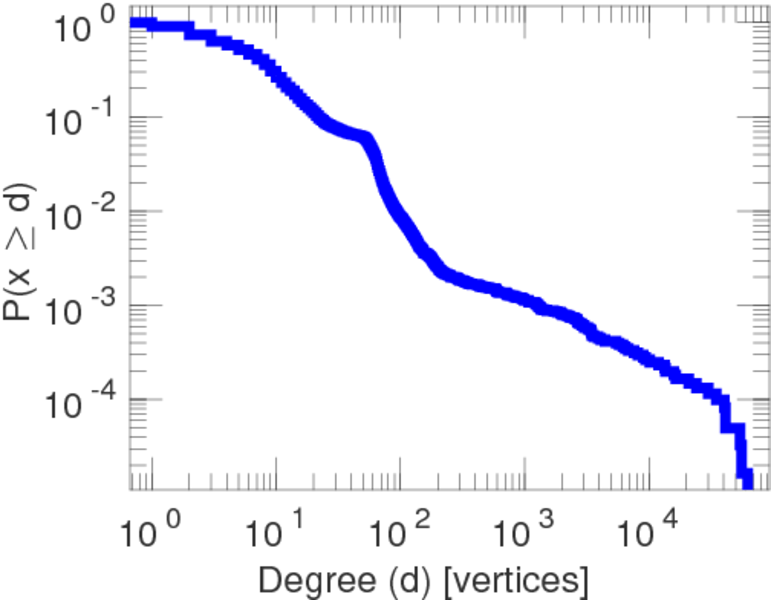
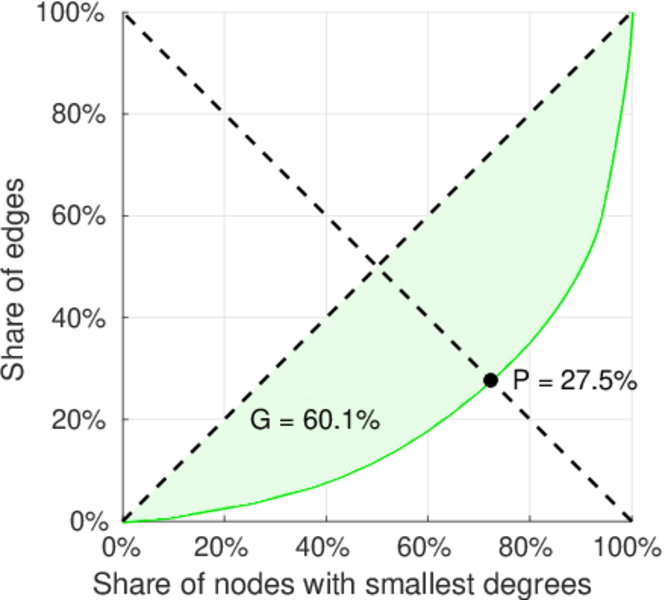
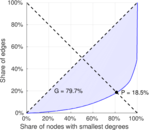
| Gini coefficient | G = | 0.797 947
|
| Balanced inequality ratio | P = | 0.184 744
|
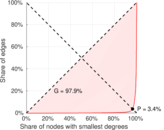
| Left balanced inequality ratio | P1 = | 0.034 395 4
|
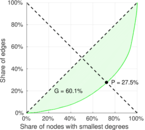
| Right balanced inequality ratio | P2 = | 0.275 409
|
| Relative edge distribution entropy | Her = | 0.720 465
|
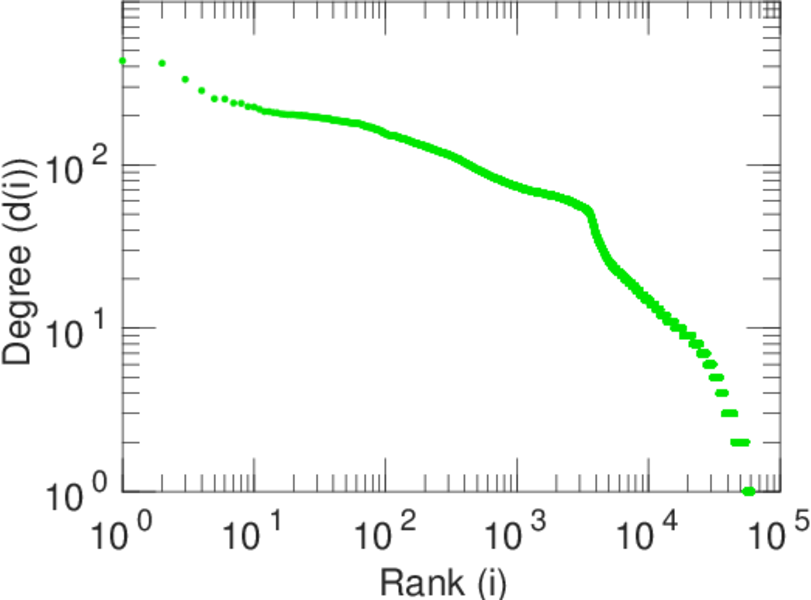
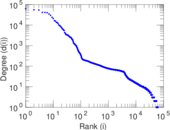
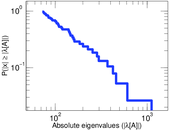
| Tail power law exponent | γt = | 2.751 00
|
| Tail power law exponent with p | γ3 = | 2.751 00
|
| p-value | p = | 0.000 00
|
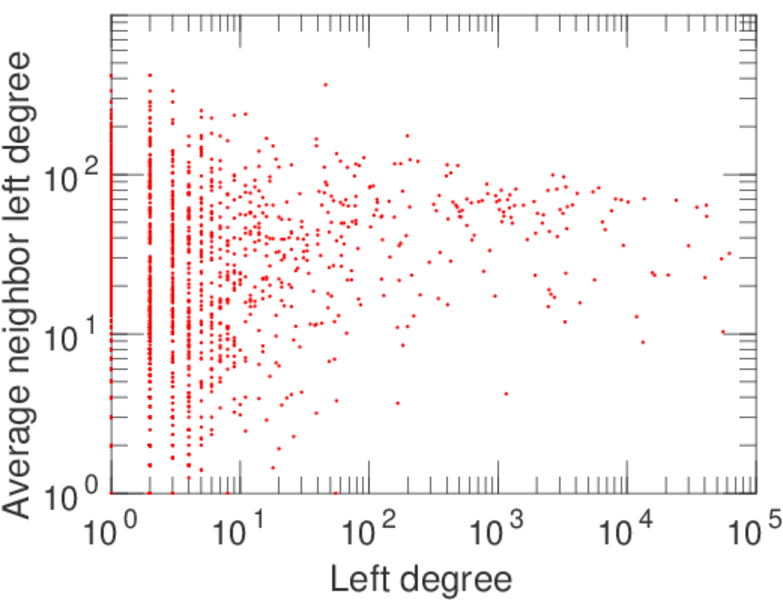
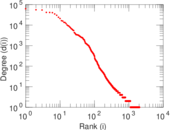
| Left tail power law exponent with p | γ3,1 = | 1.681 00
|
| Left p-value | p1 = | 0.000 00
|
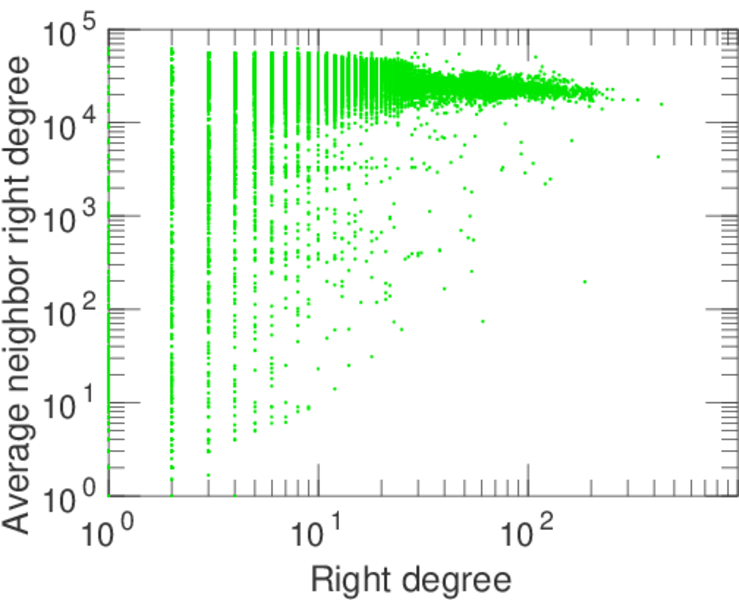
| Right tail power law exponent with p | γ3,2 = | 2.841 00
|
| Right p-value | p2 = | 0.000 00
|
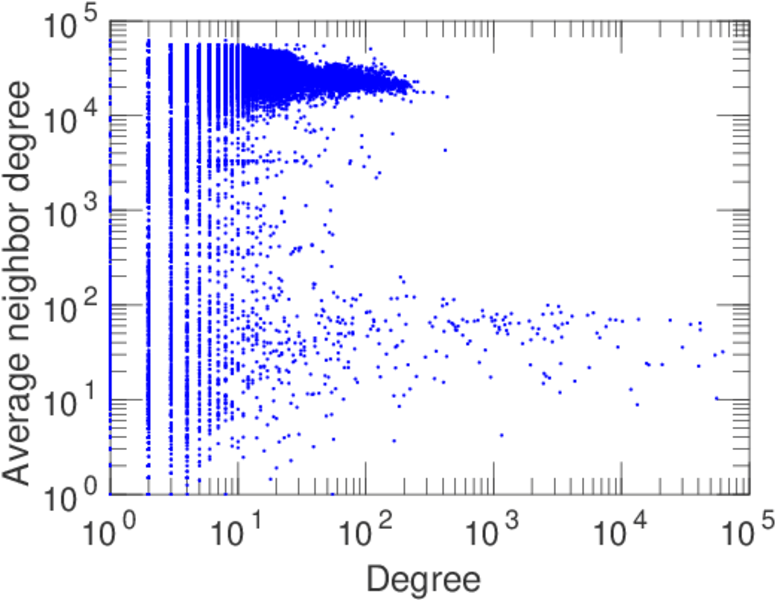
| Degree assortativity | ρ = | −0.417 492
|
| Degree assortativity p-value | pρ = | 0.000 00
|
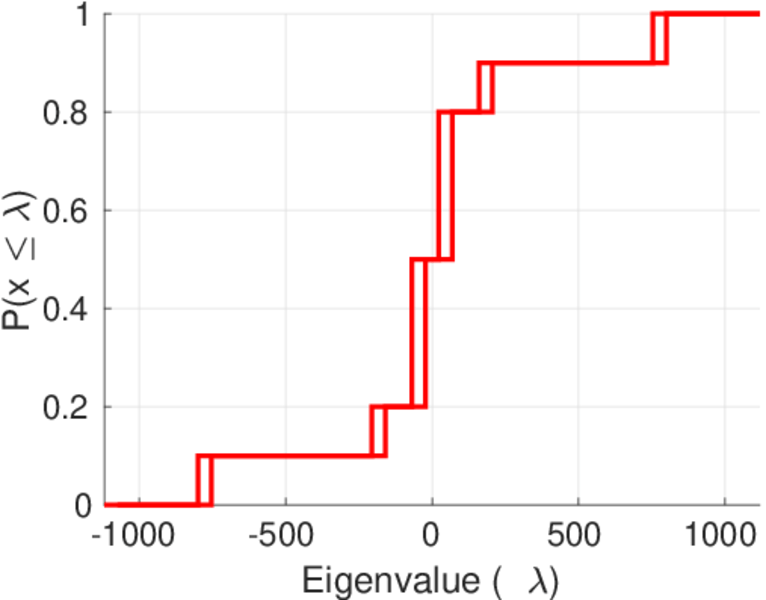
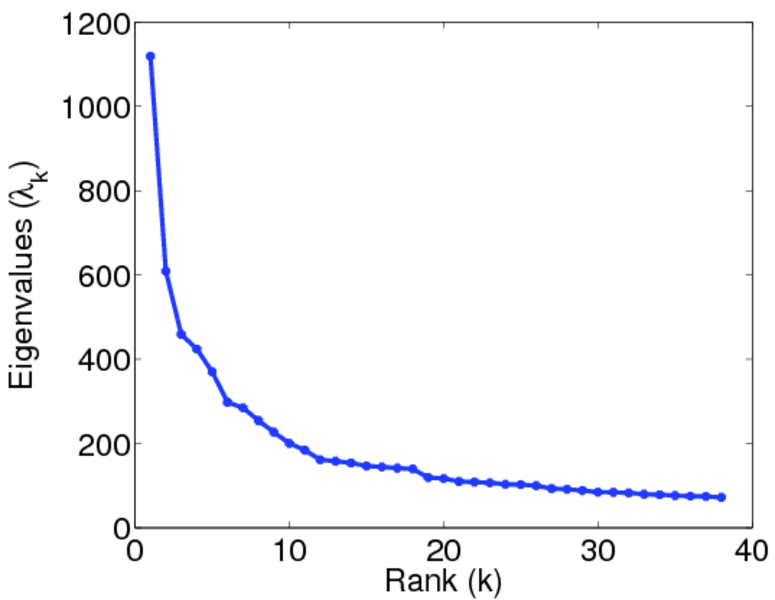
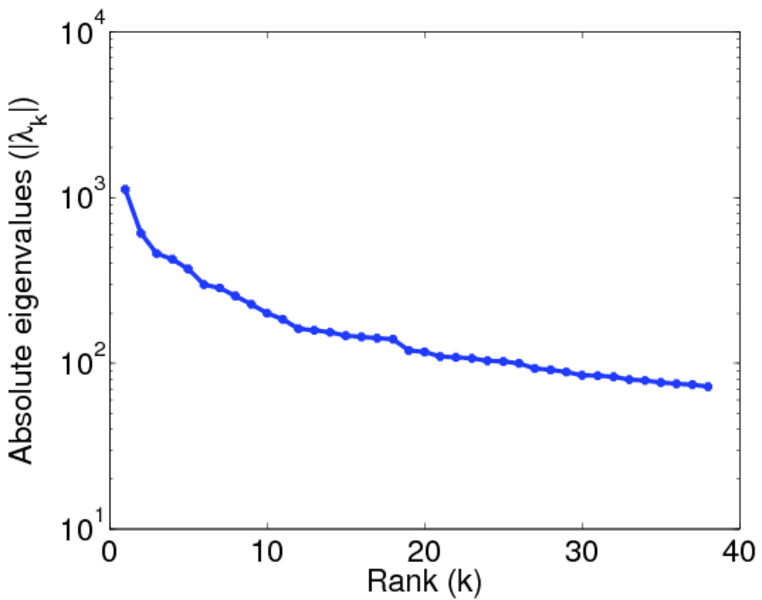
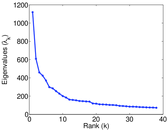
| Spectral norm | α = | 1,119.04
|
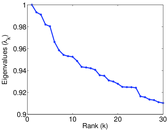
| Algebraic connectivity | a = | 0.022 502 6
|
| Controllability | C = | 58,558
|
| Relative controllability | Cr = | 0.938 279
|
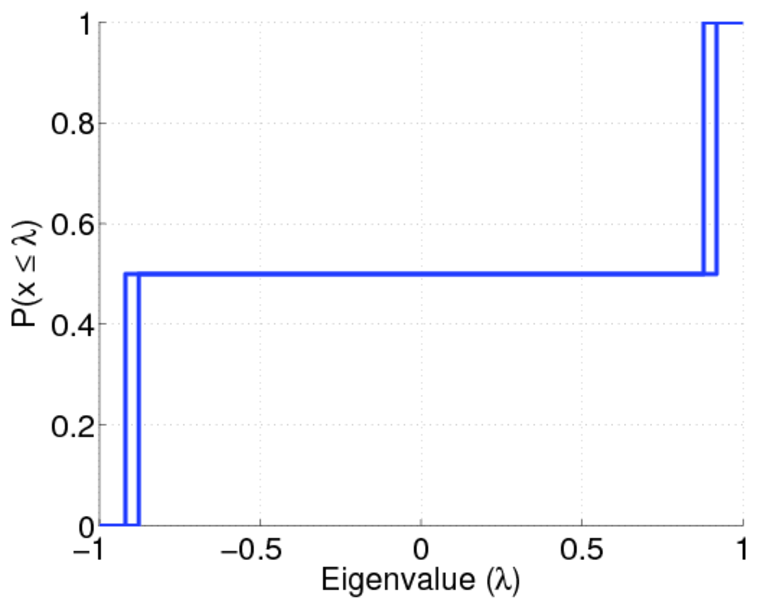
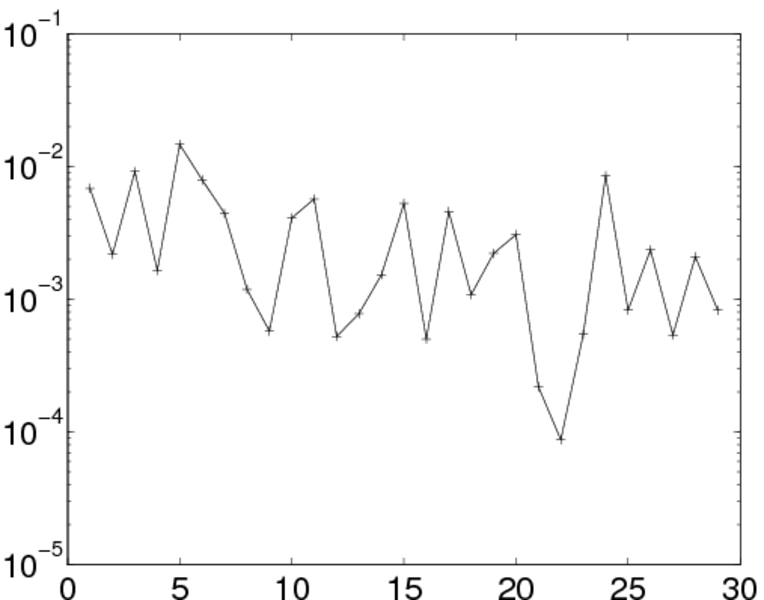
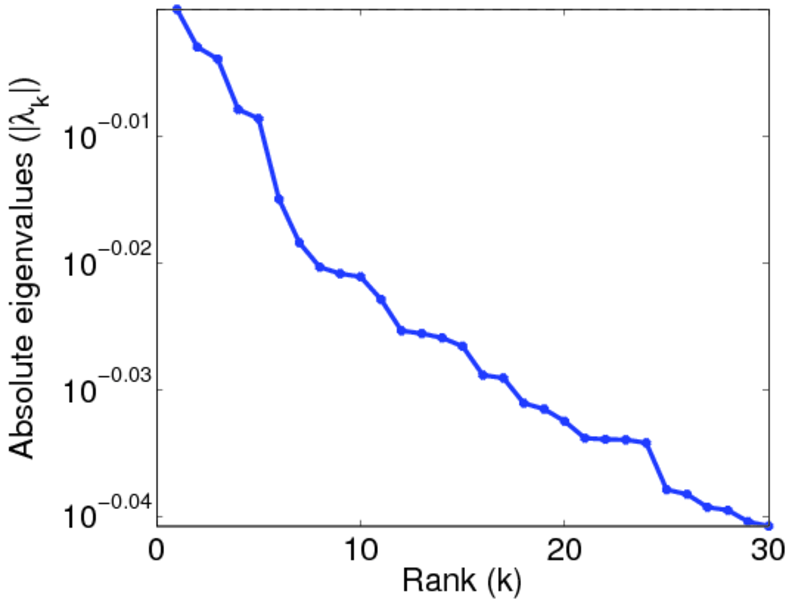
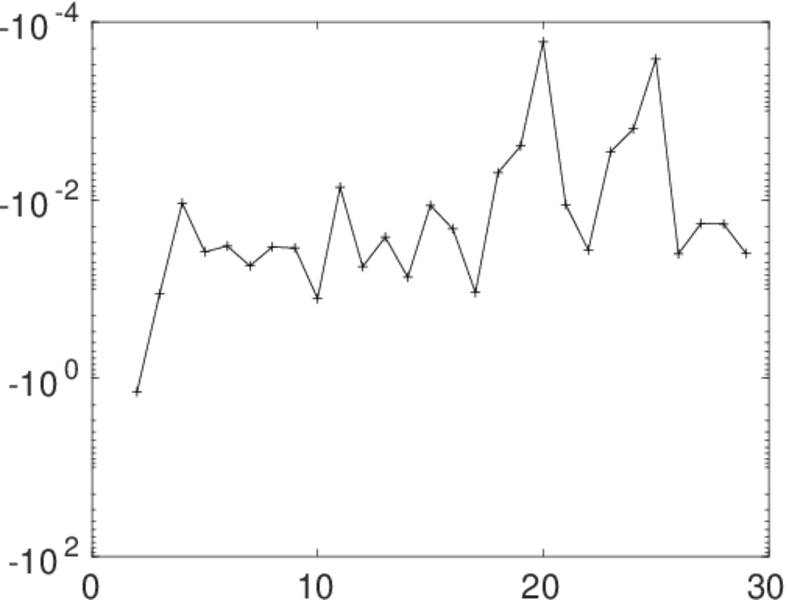
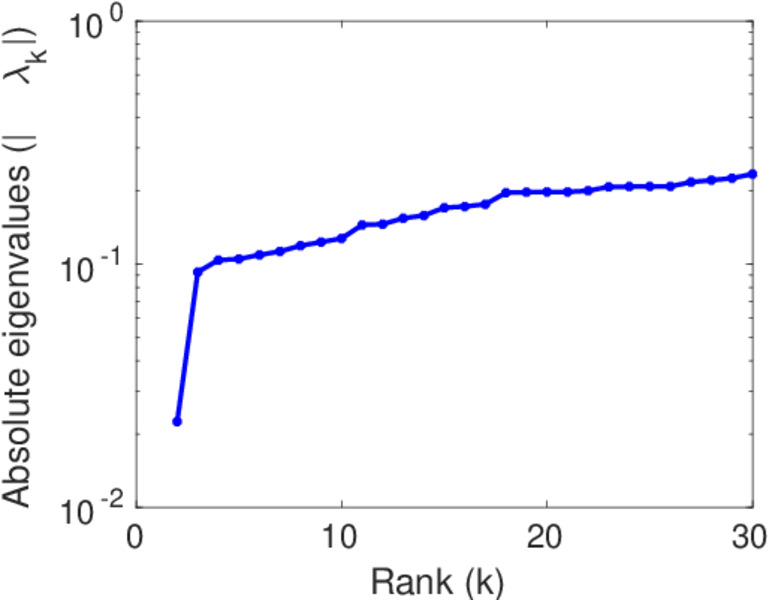
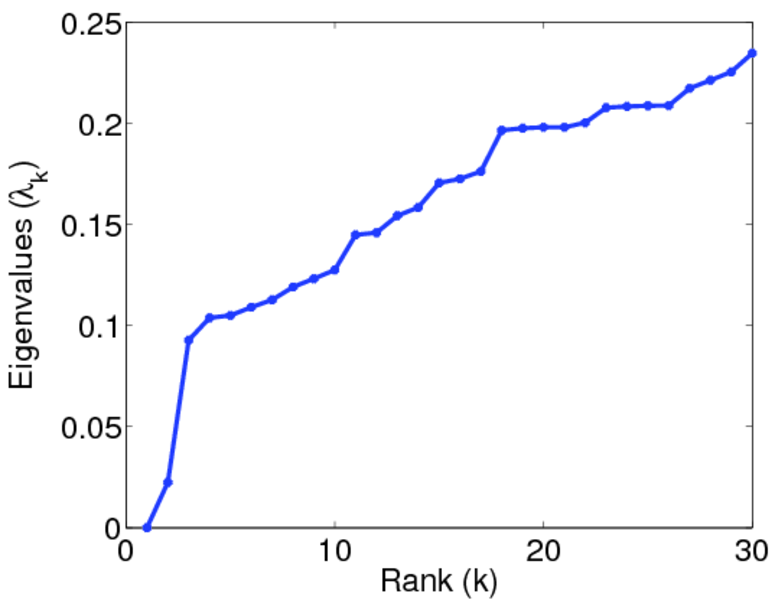
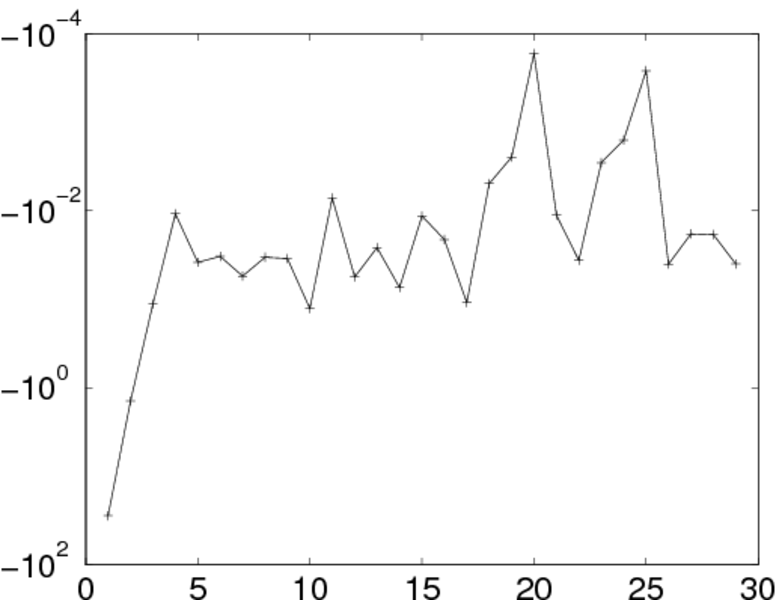
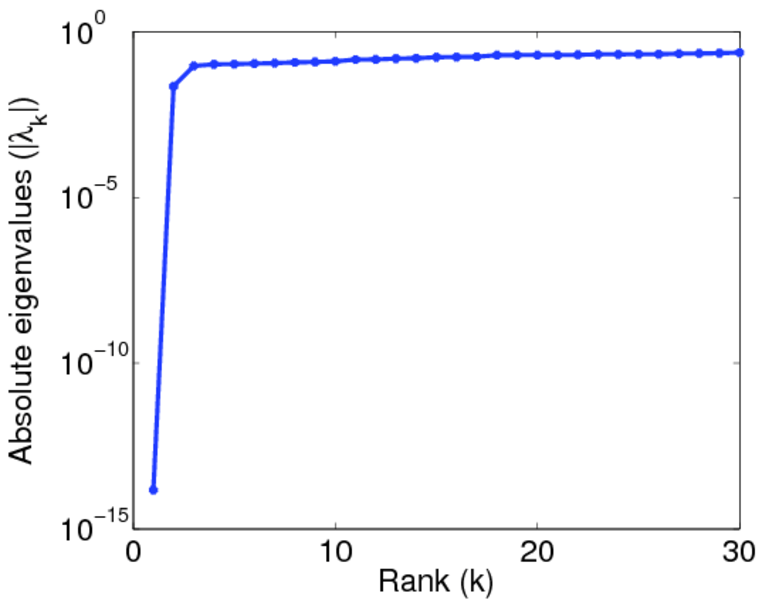
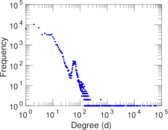
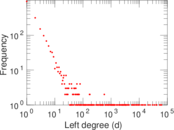
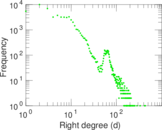
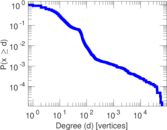
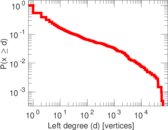
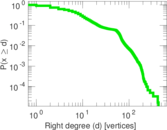
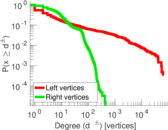
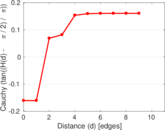
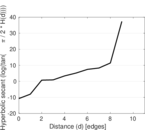
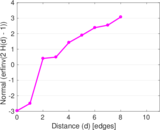
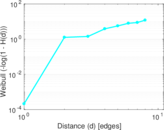
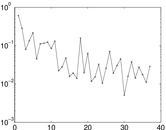
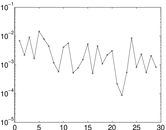
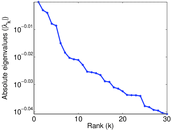
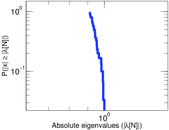
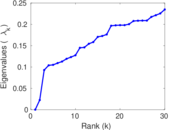
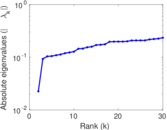
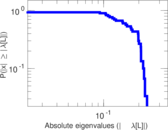
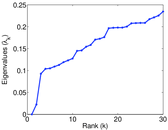
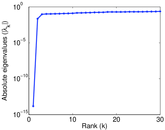
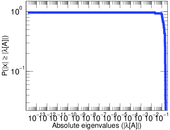
Plots


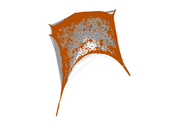

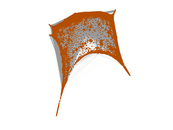
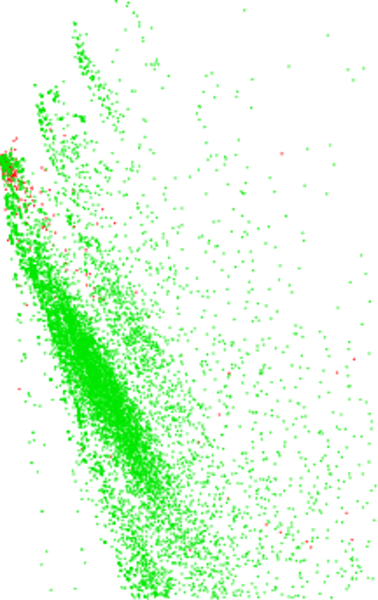
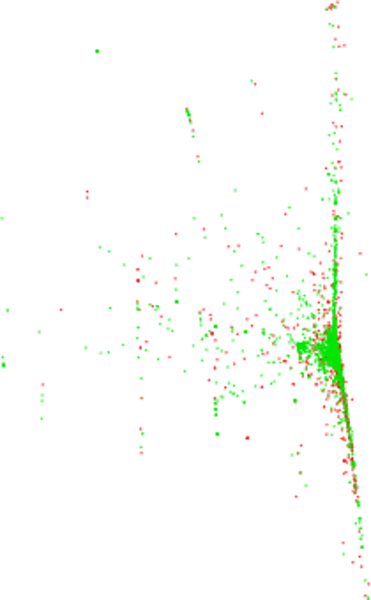
Matrix decompositions plots


Downloads
References
|
[1]
|
Jérôme Kunegis.
KONECT – The Koblenz Network Collection.
In Proc. Int. Conf. on World Wide Web Companion, pages
1343–1350, 2013.
[ http ]
|
|
[2]
|
Wikimedia Foundation.
Wikimedia downloads.
http://dumps.wikimedia.org/, January 2010.
|
 KONECT ‣ Networks ‣
Buy Me a Coffee
KONECT ‣ Networks ‣
Buy Me a Coffee