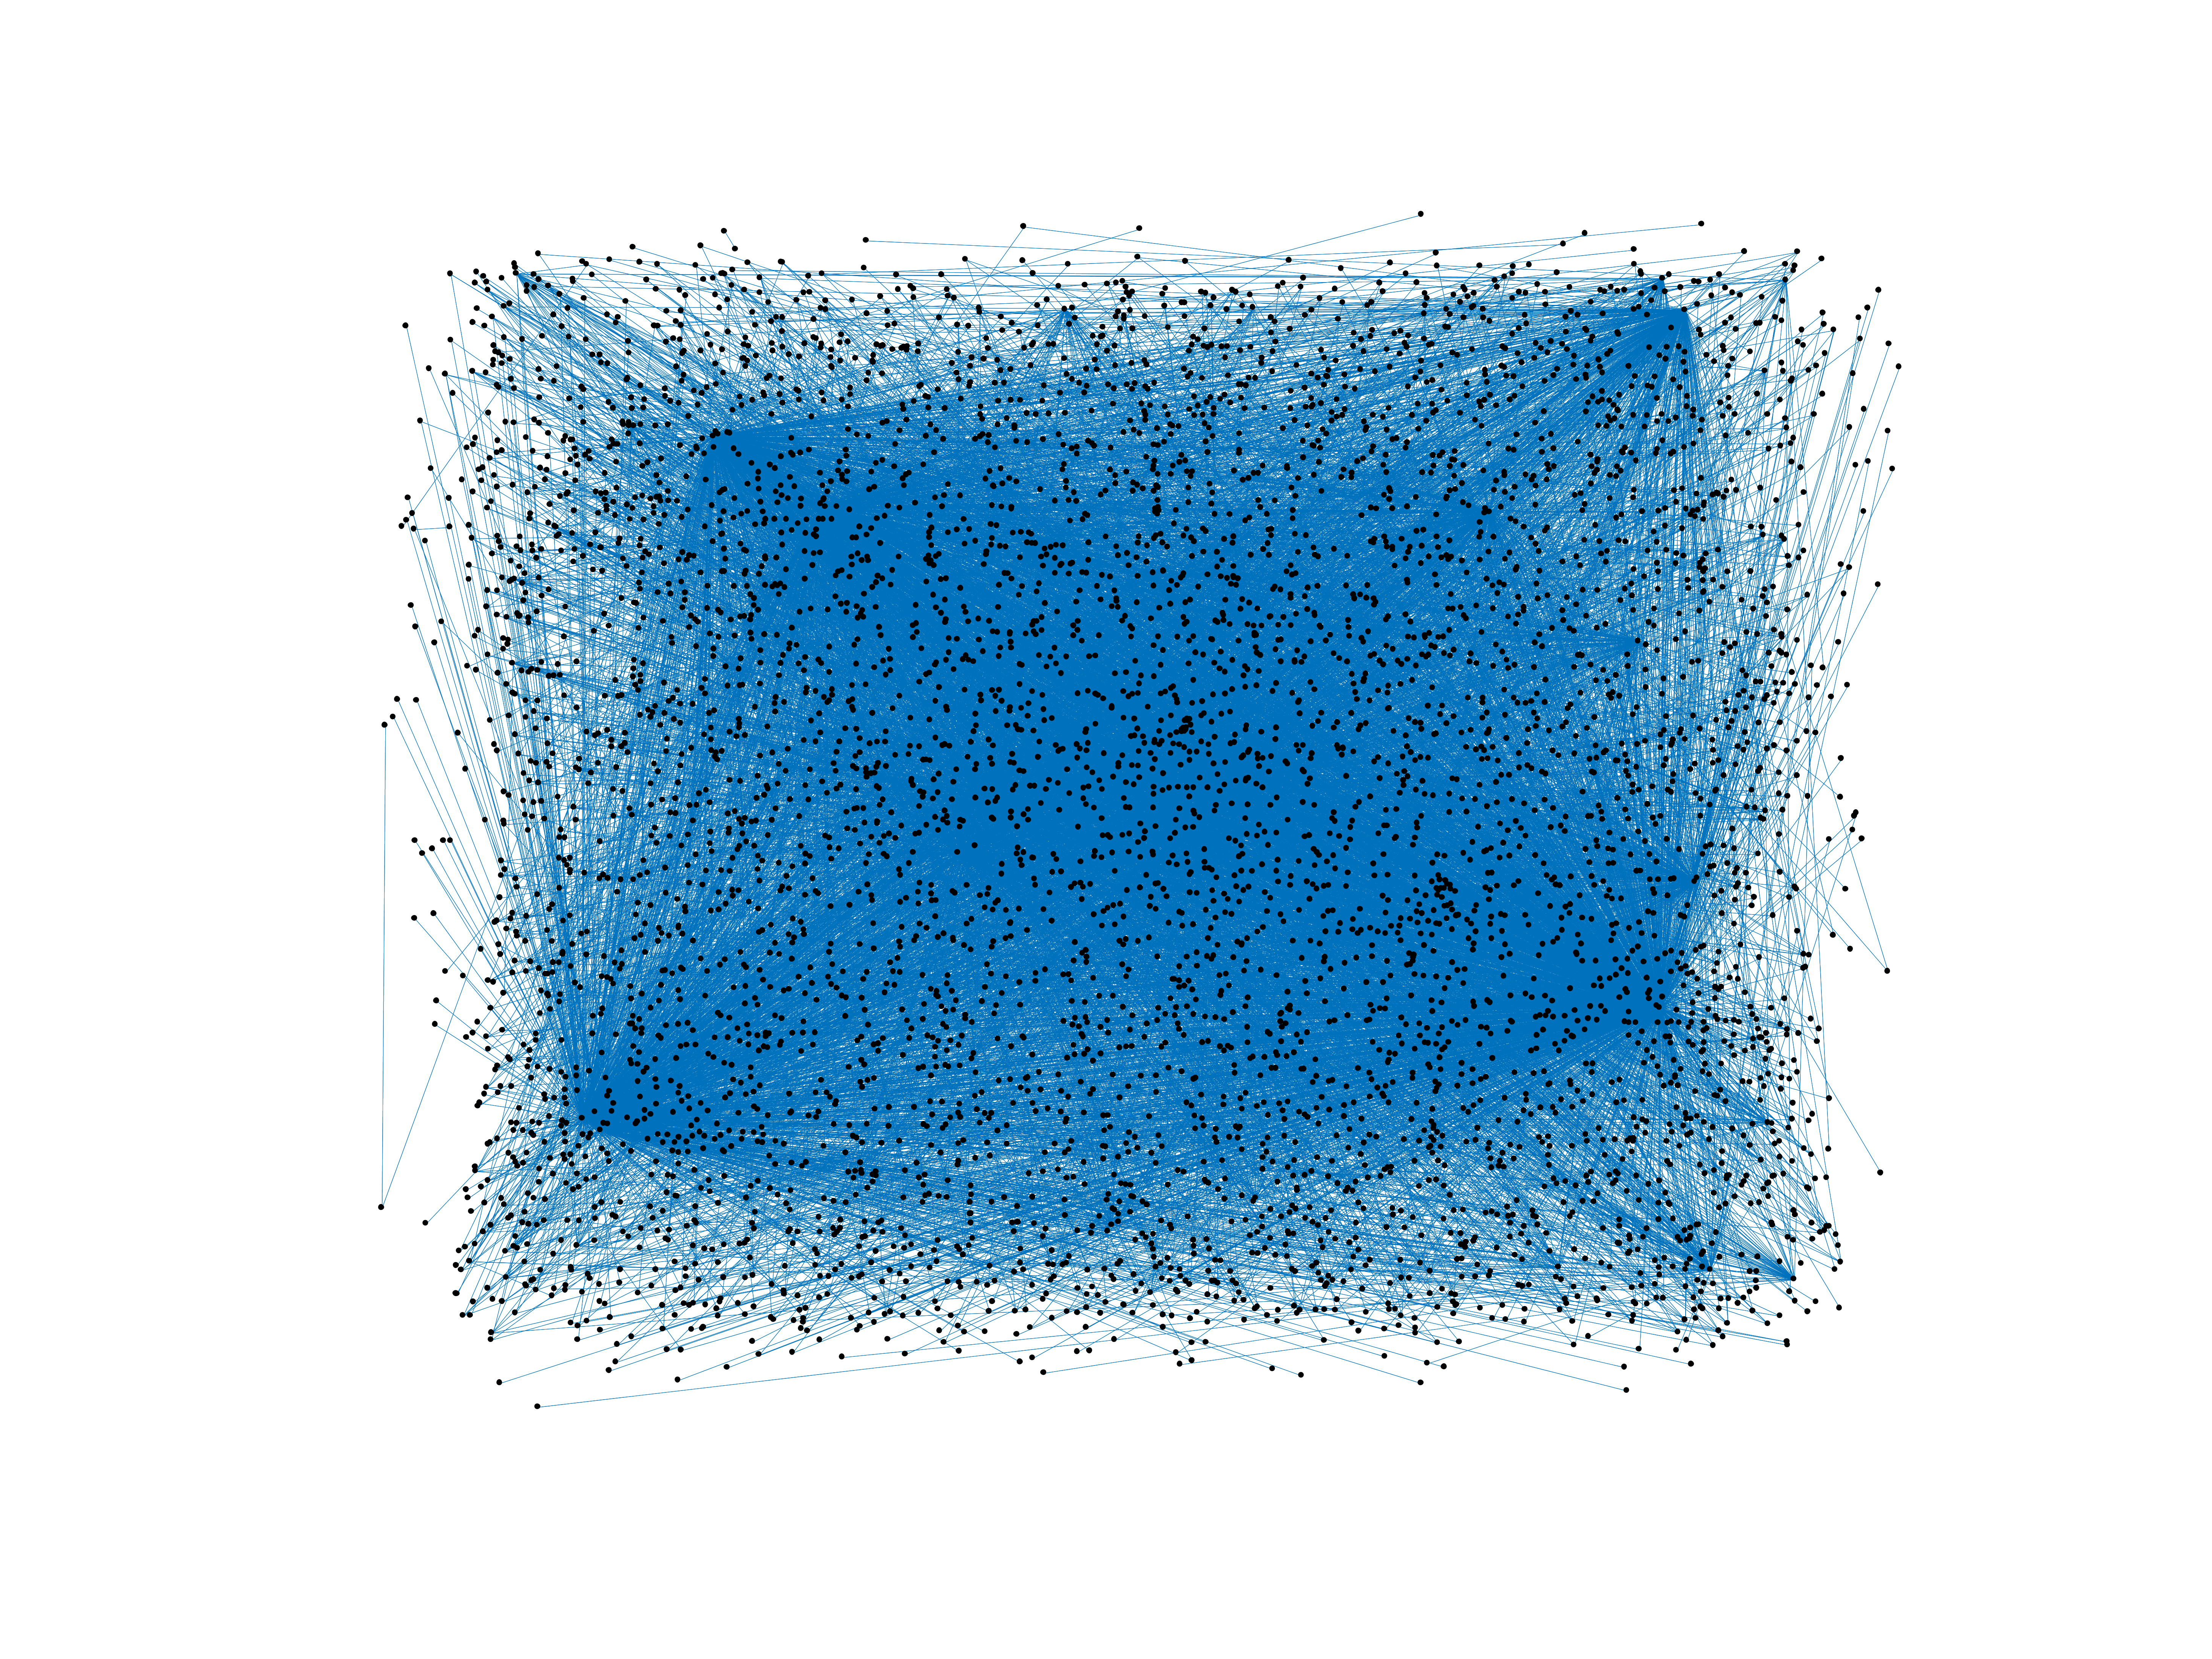
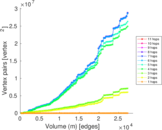
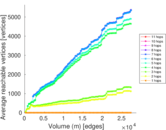
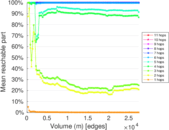
Wikinews edits (hu)
This is the bipartite edit network of the Hungarian Wikinews. It contains users
and pages from the Hungarian Wikinews, connected by edit events. Each edge
represents an edit. The dataset includes the timestamp of each edit.
Metadata
Statistics
| Size | n = | 5,541
|
| Left size | n1 = | 318
|
| Right size | n2 = | 5,223
|
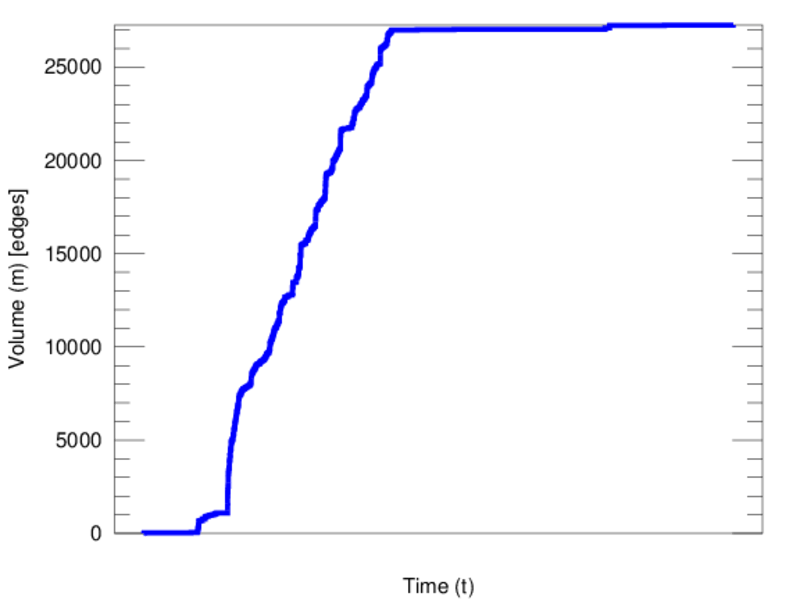
| Volume | m = | 27,265
|
| Unique edge count | m̿ = | 10,545
|
| Wedge count | s = | 3,513,436
|
| Claw count | z = | 1,450,627,593
|
| Cross count | x = | 582,607,168,588
|
| Square count | q = | 625,234
|
| 4-Tour count | T4 = | 19,084,182
|
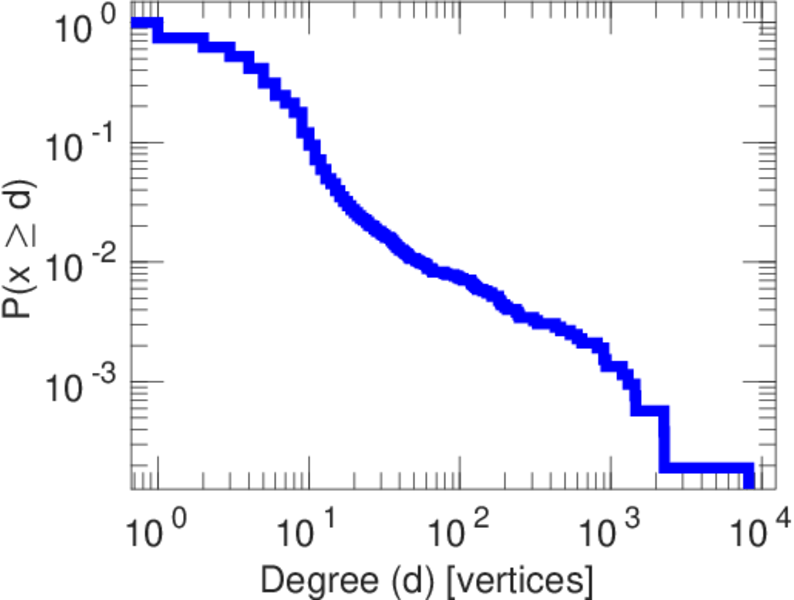
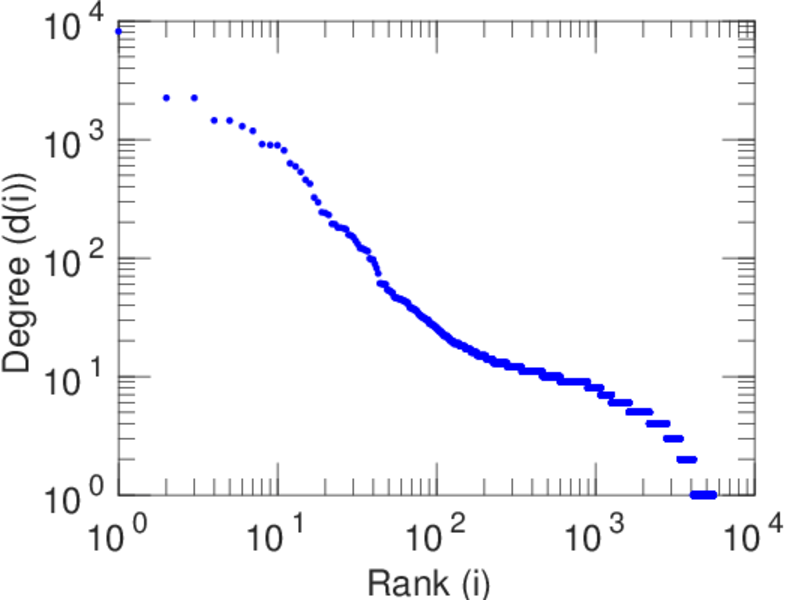
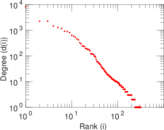
| Maximum degree | dmax = | 8,176
|
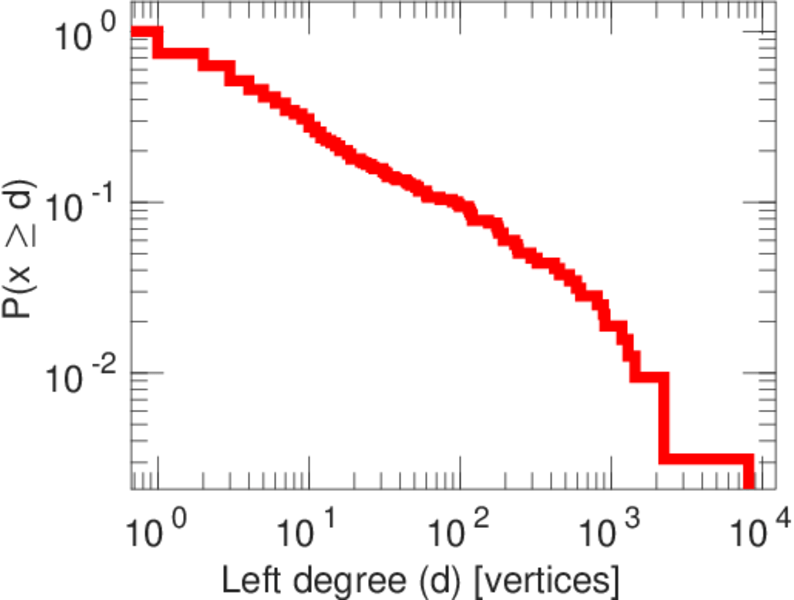
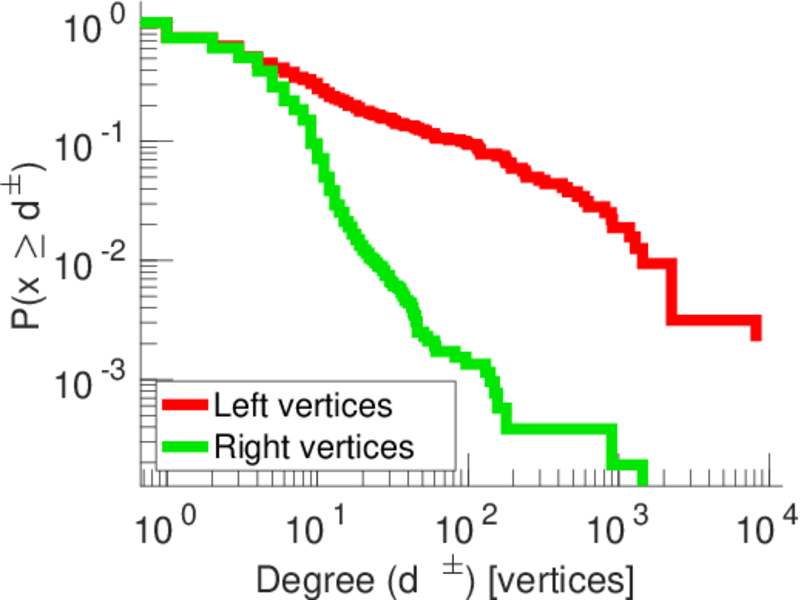
| Maximum left degree | d1max = | 8,176
|
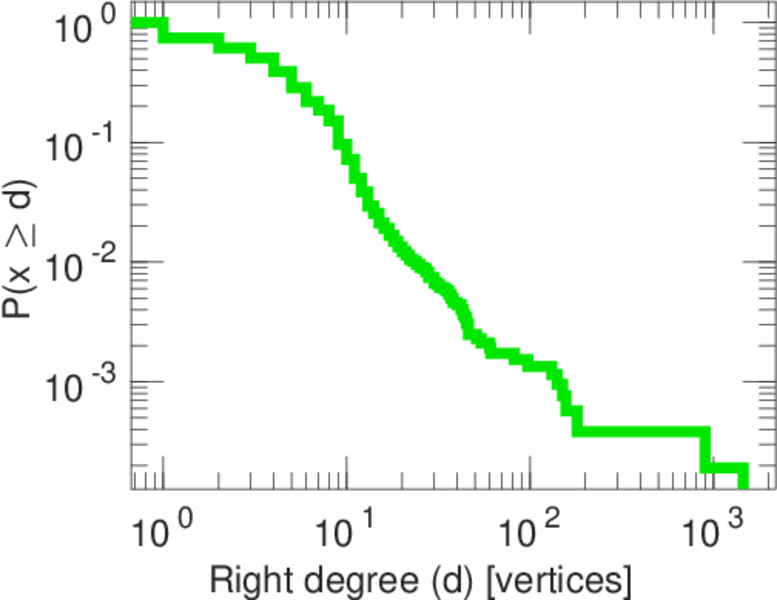
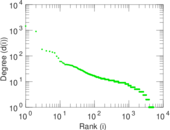
| Maximum right degree | d2max = | 1,448
|
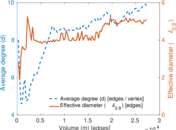
| Average degree | d = | 9.841 18
|
| Average left degree | d1 = | 85.739 0
|
| Average right degree | d2 = | 5.220 18
|
| Fill | p = | 0.006 348 91
|
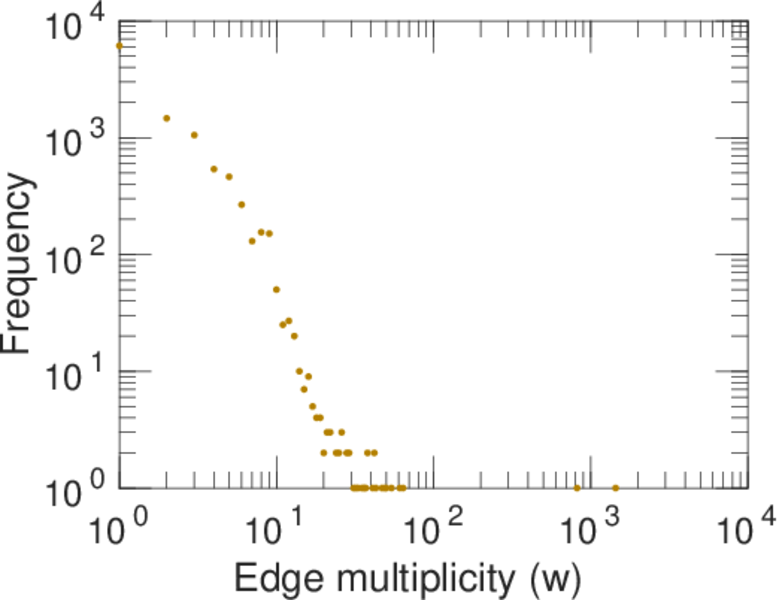
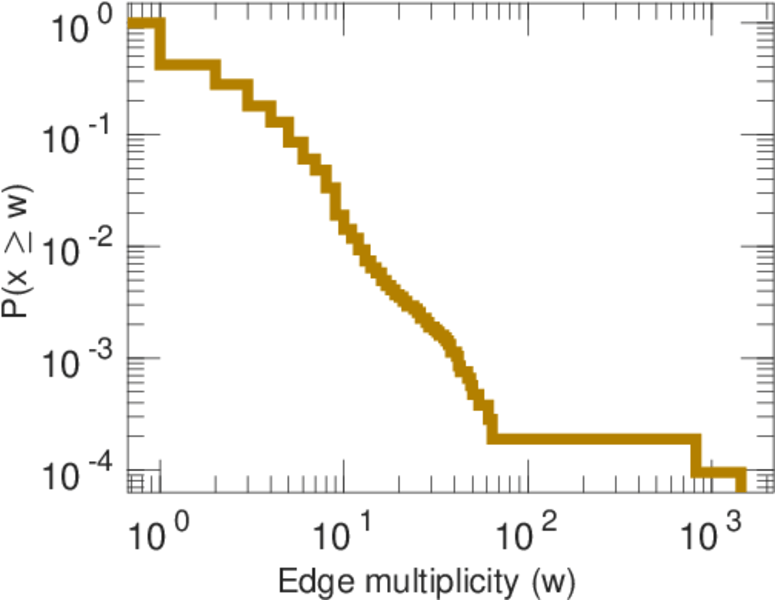
| Average edge multiplicity | m̃ = | 2.585 59
|
| Size of LCC | N = | 5,367
|
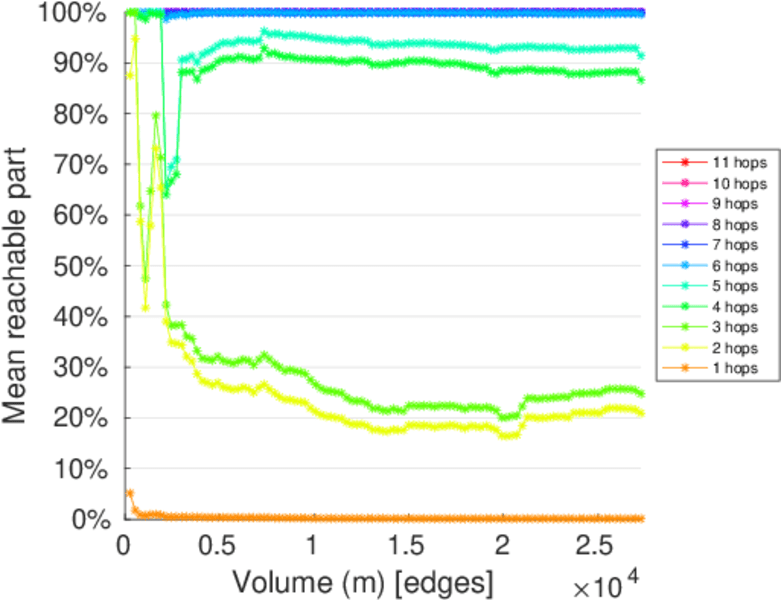
| Diameter | δ = | 11
|
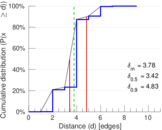
| 50-Percentile effective diameter | δ0.5 = | 3.417 37
|
| 90-Percentile effective diameter | δ0.9 = | 4.831 98
|
| Median distance | δM = | 4
|
| Mean distance | δm = | 3.783 27
|
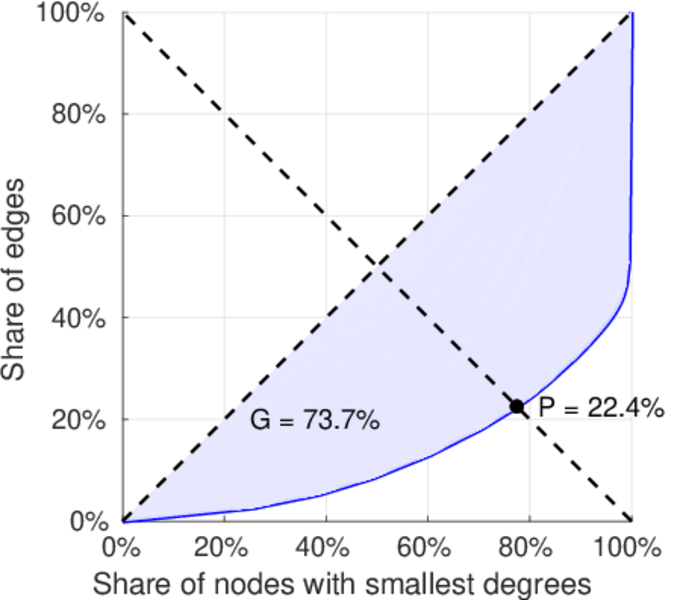
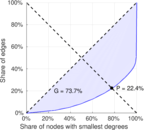
| Gini coefficient | G = | 0.742 824
|
| Balanced inequality ratio | P = | 0.218 907
|
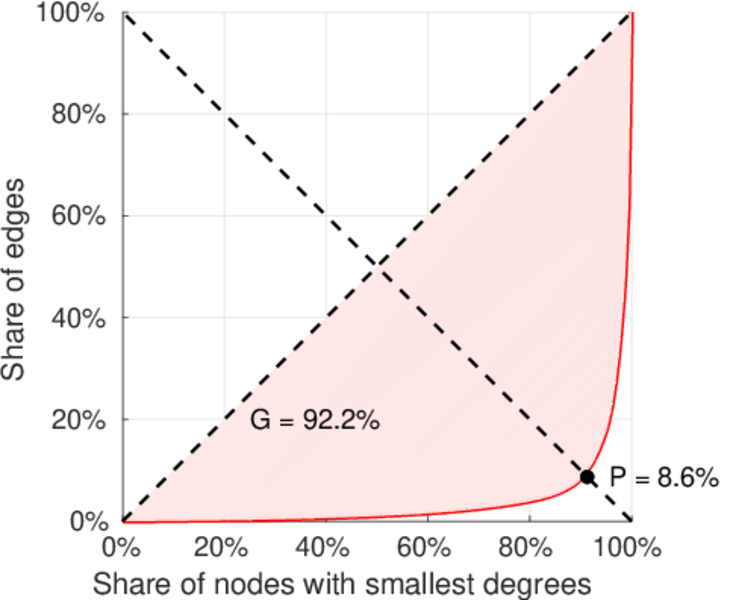
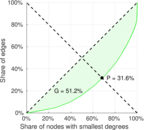
| Left balanced inequality ratio | P1 = | 0.085 604 3
|
| Right balanced inequality ratio | P2 = | 0.316 450
|
| Relative edge distribution entropy | Her = | 0.766 504
|
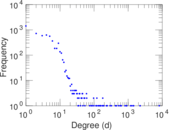
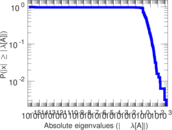
| Power law exponent | γ = | 2.788 97
|
| Tail power law exponent | γt = | 3.011 00
|
| Tail power law exponent with p | γ3 = | 3.011 00
|
| p-value | p = | 0.000 00
|
| Left tail power law exponent with p | γ3,1 = | 1.681 00
|
| Left p-value | p1 = | 0.002 000 00
|
| Right tail power law exponent with p | γ3,2 = | 4.071 00
|
| Right p-value | p2 = | 0.605 000
|
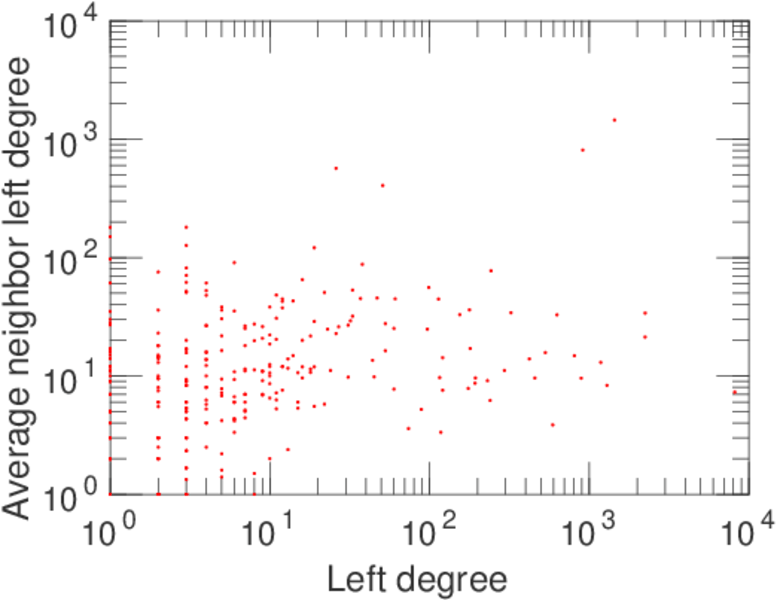
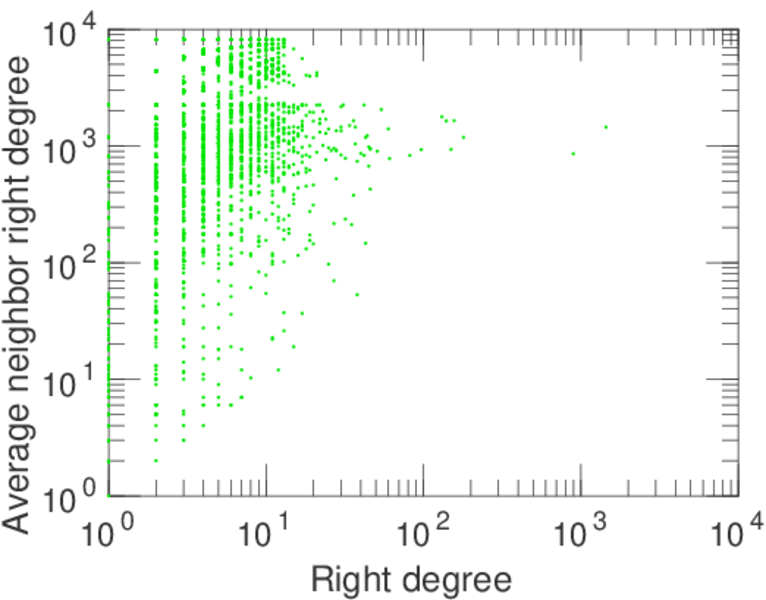
| Degree assortativity | ρ = | −0.207 667
|
| Degree assortativity p-value | pρ = | 4.456 96 × 10−103
|
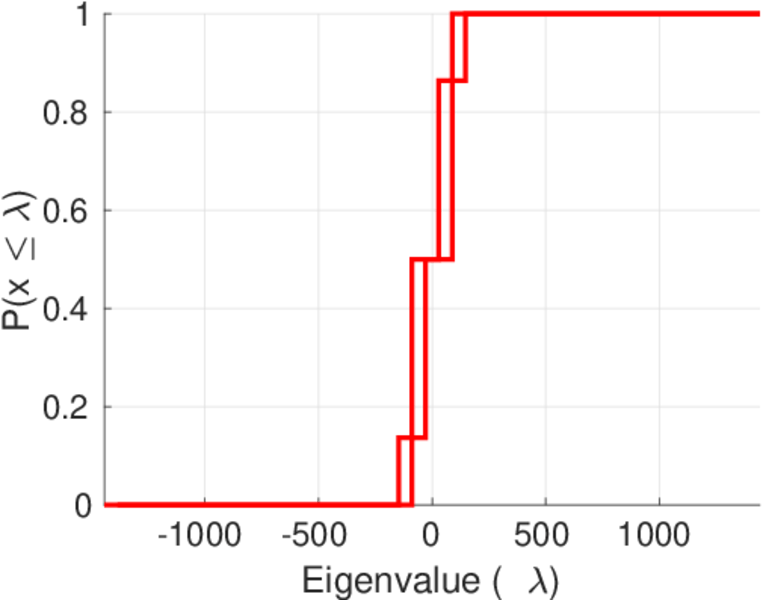
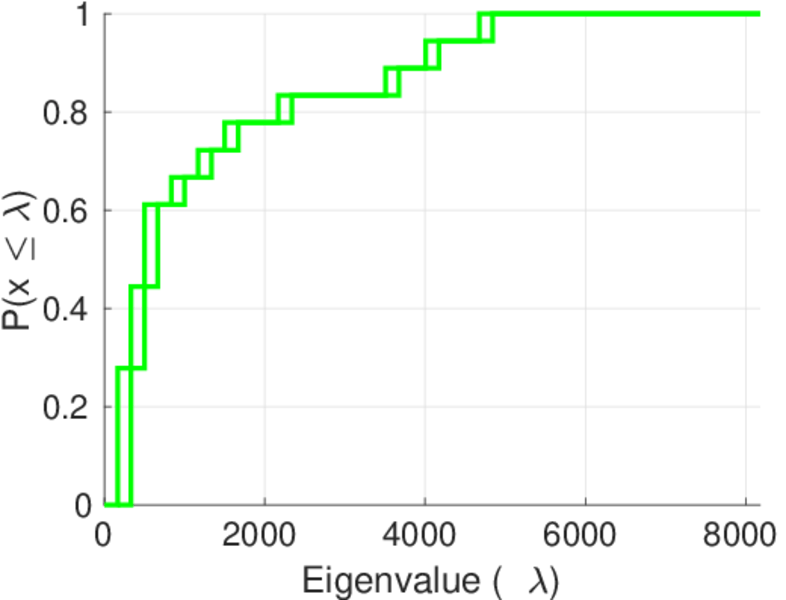
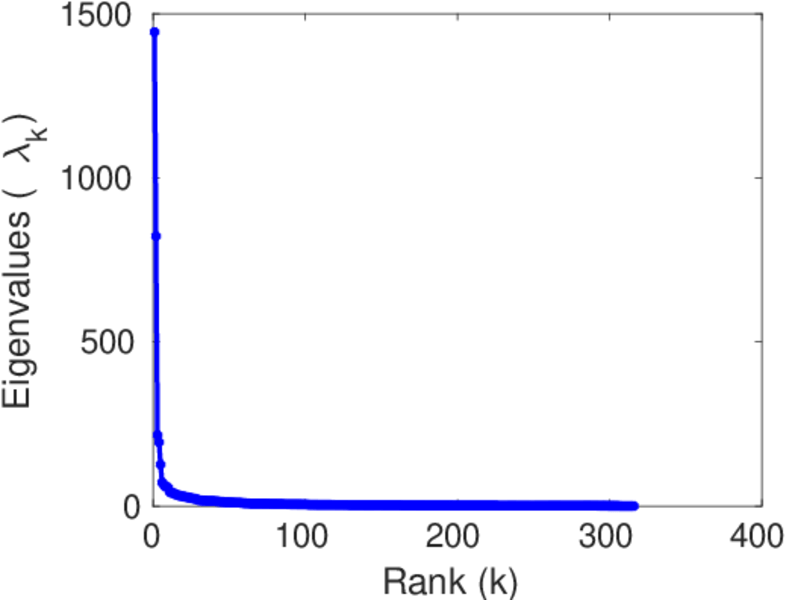
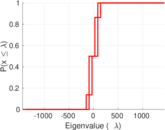
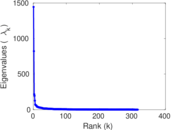
| Spectral norm | α = | 1,444.00
|
| Algebraic connectivity | a = | 0.086 461 9
|
| Spectral separation | |λ1[A] / λ2[A]| = | 1.755 81
|
| Controllability | C = | 4,924
|
| Relative controllability | Cr = | 0.889 451
|
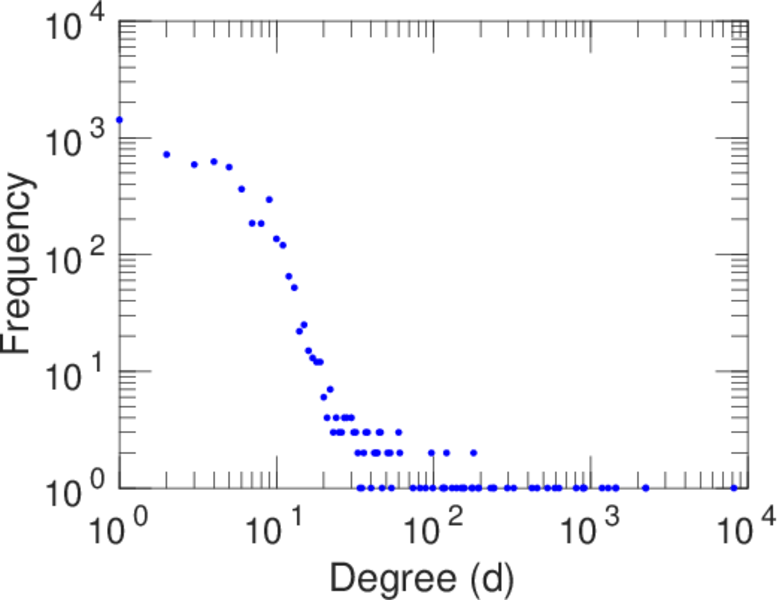
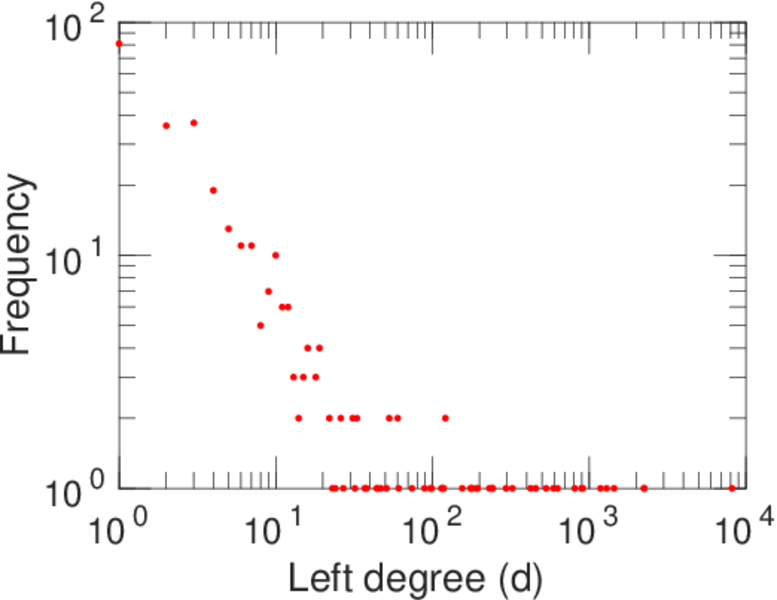
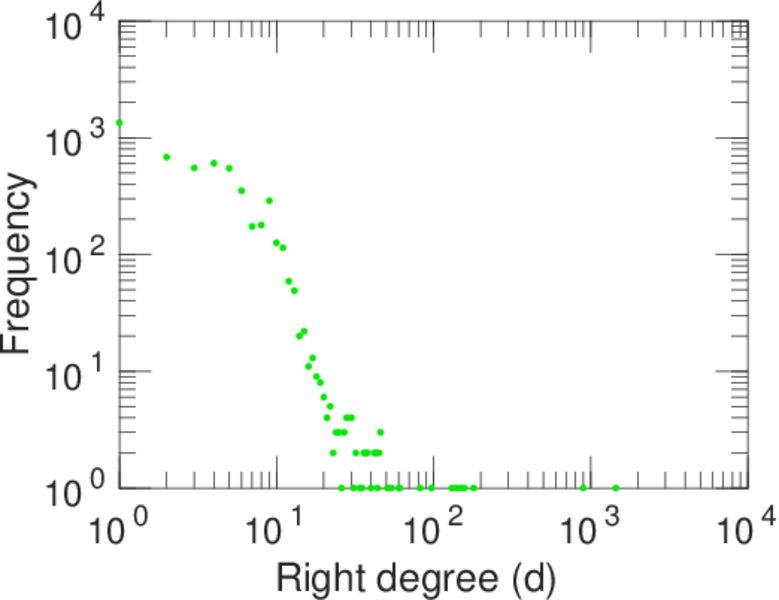
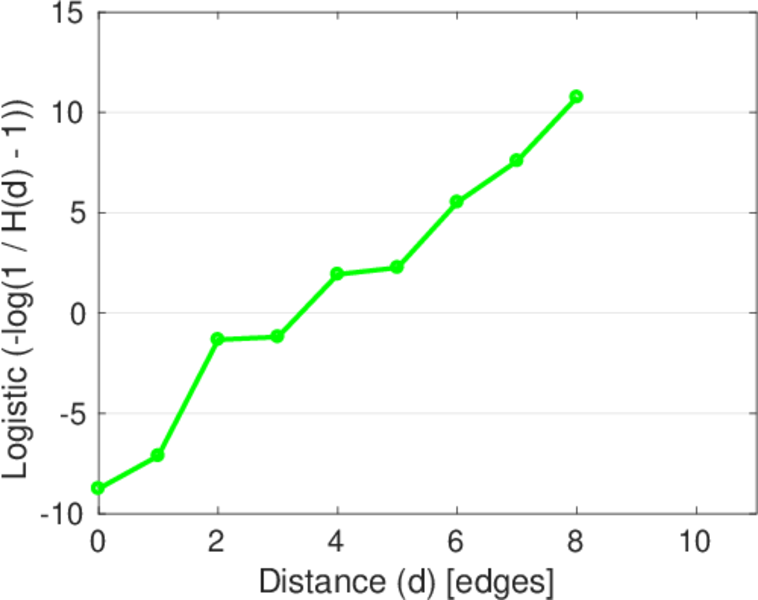
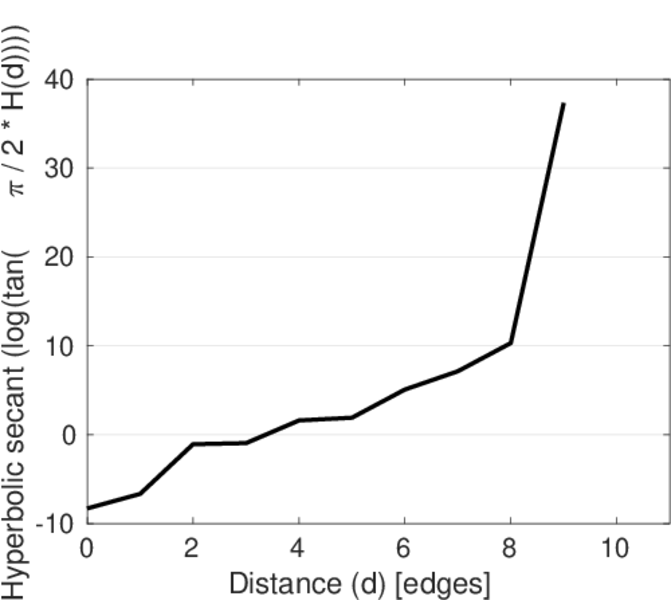
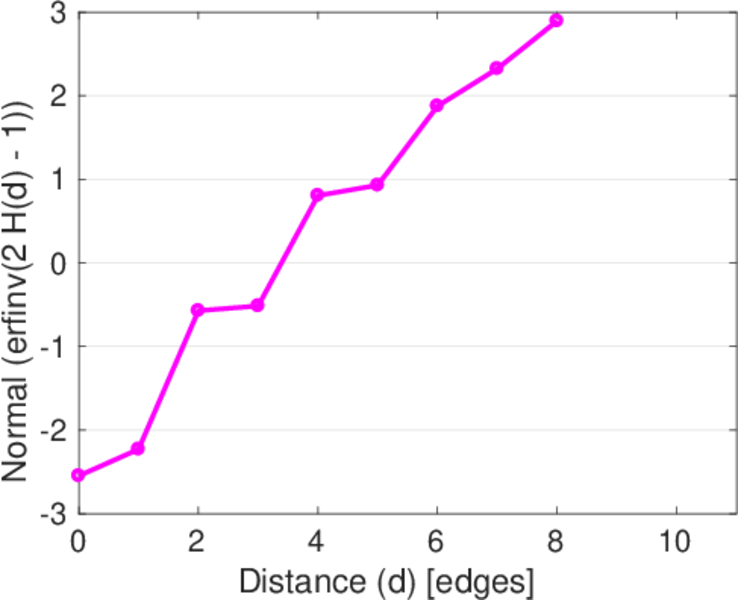
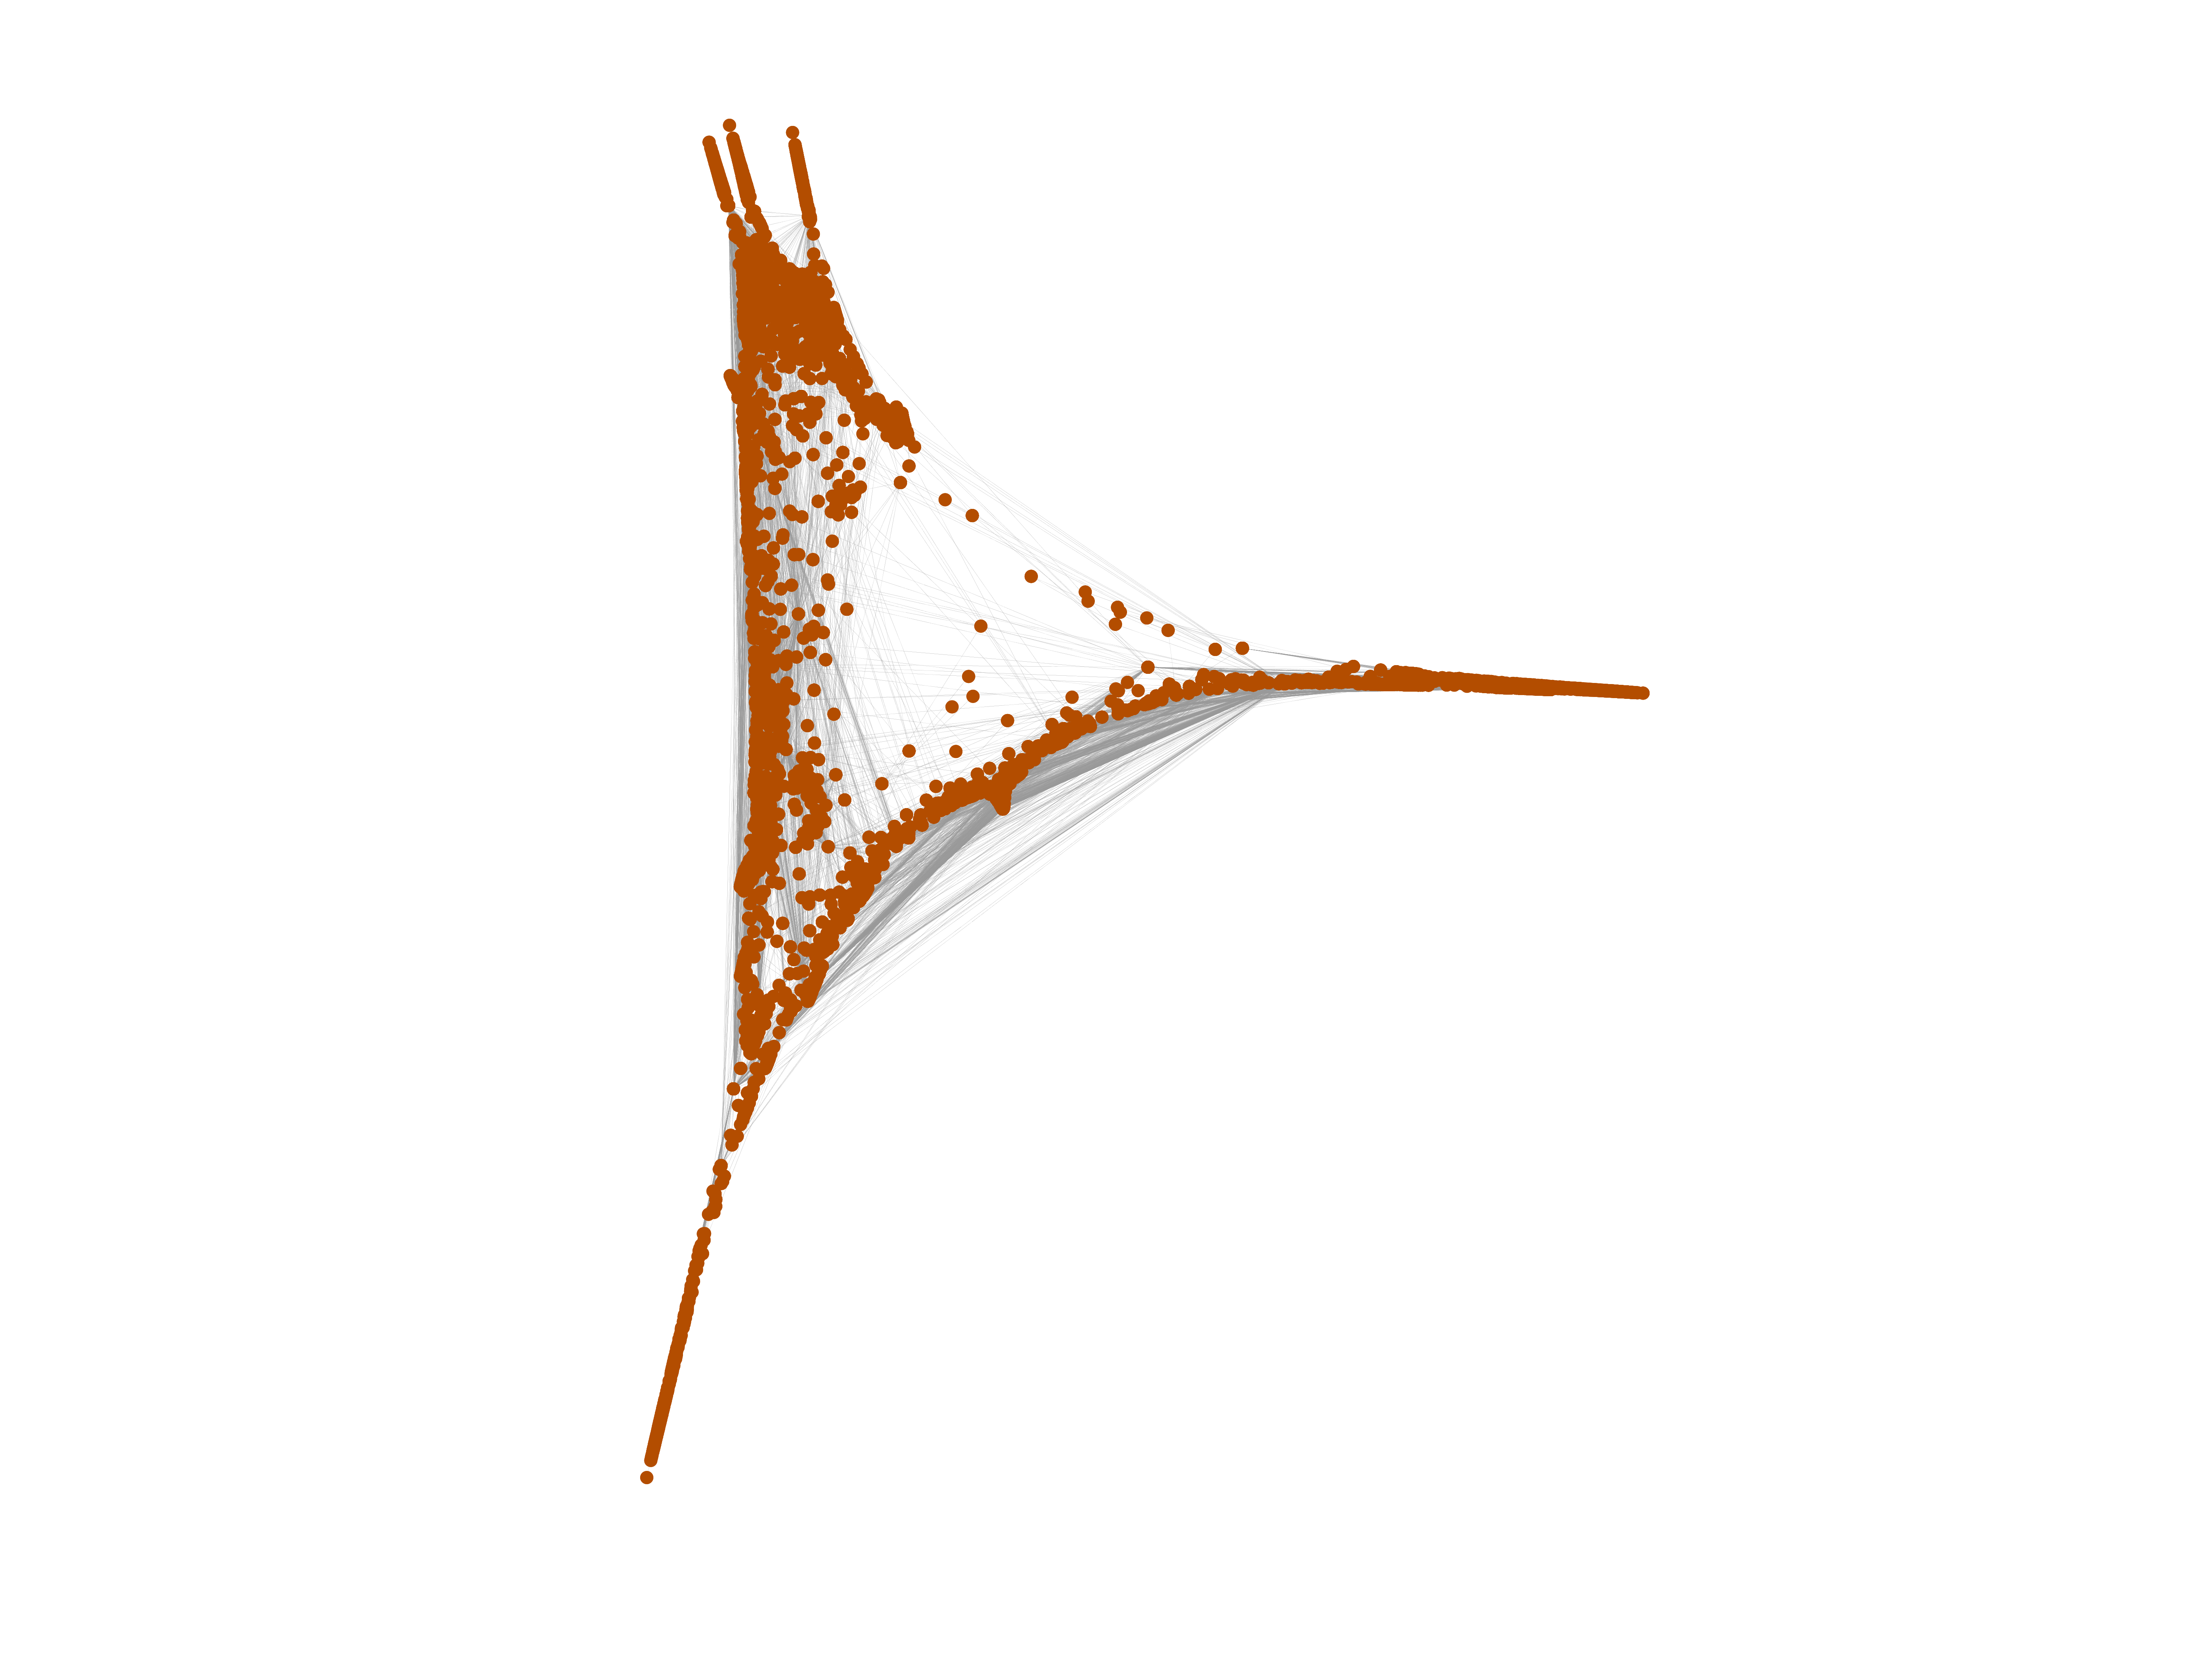
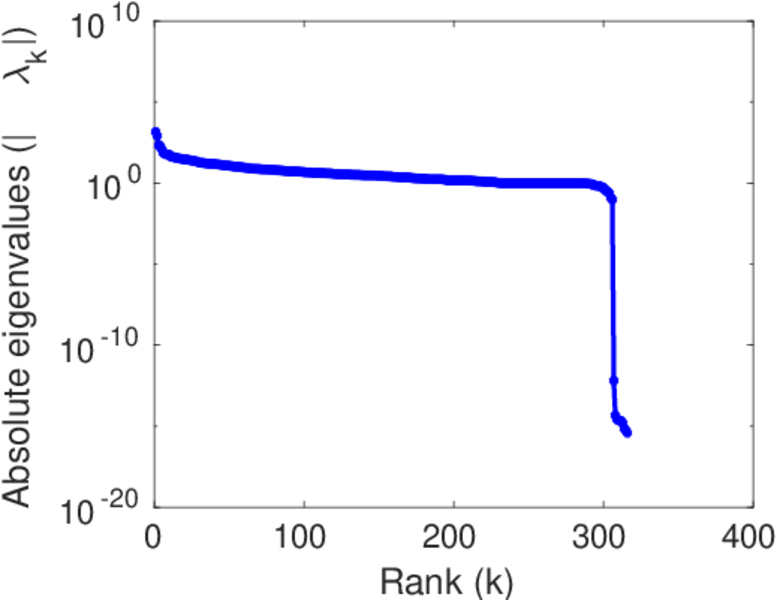
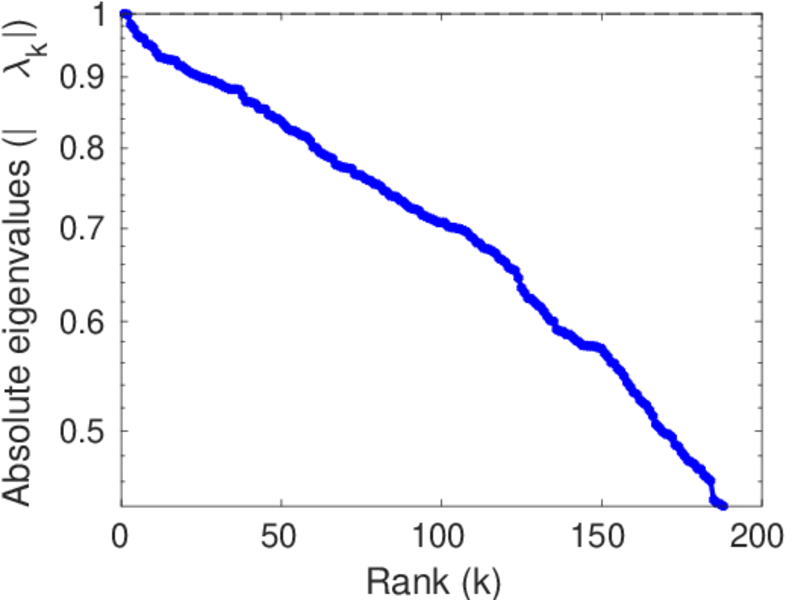
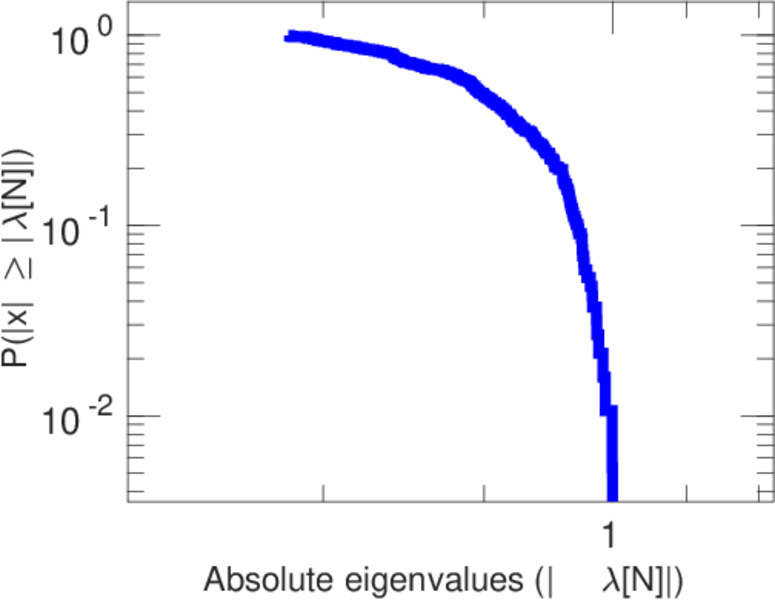
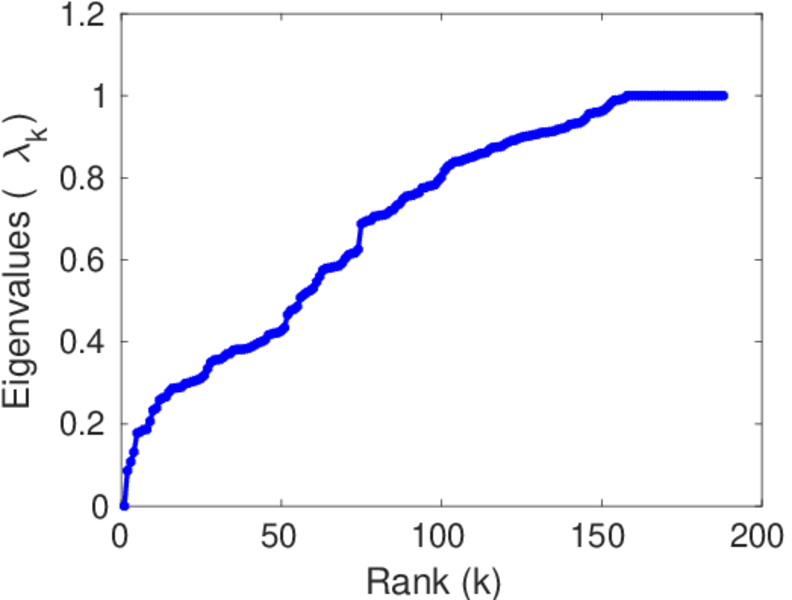
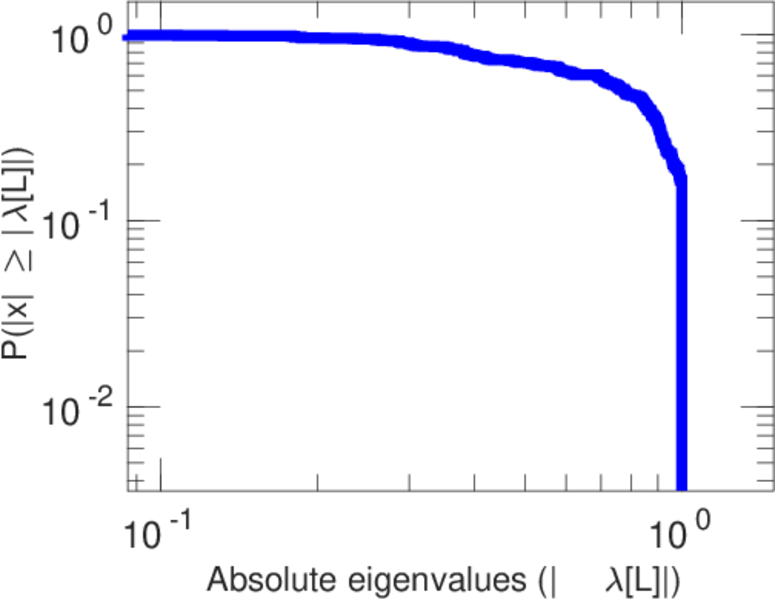
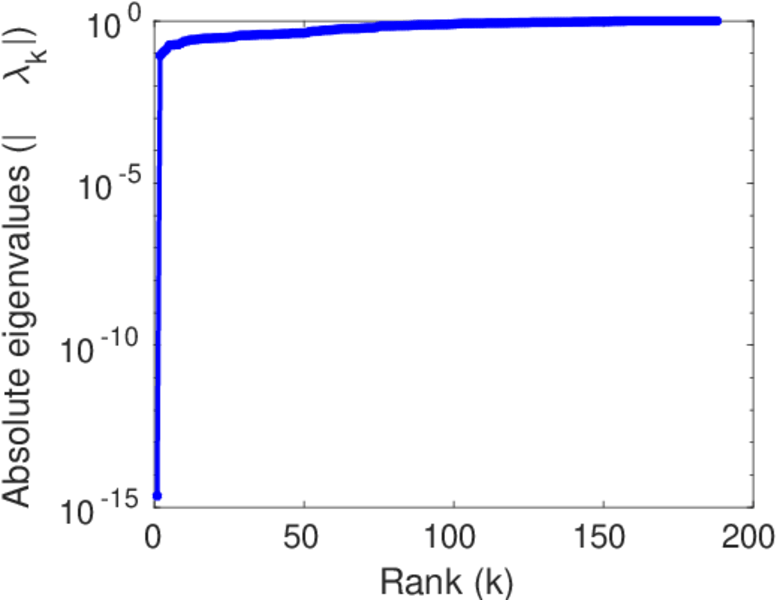
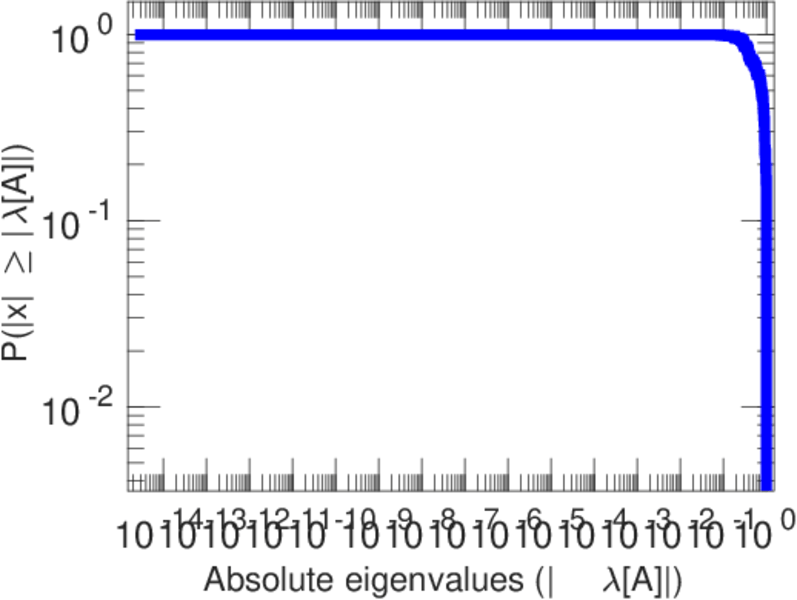
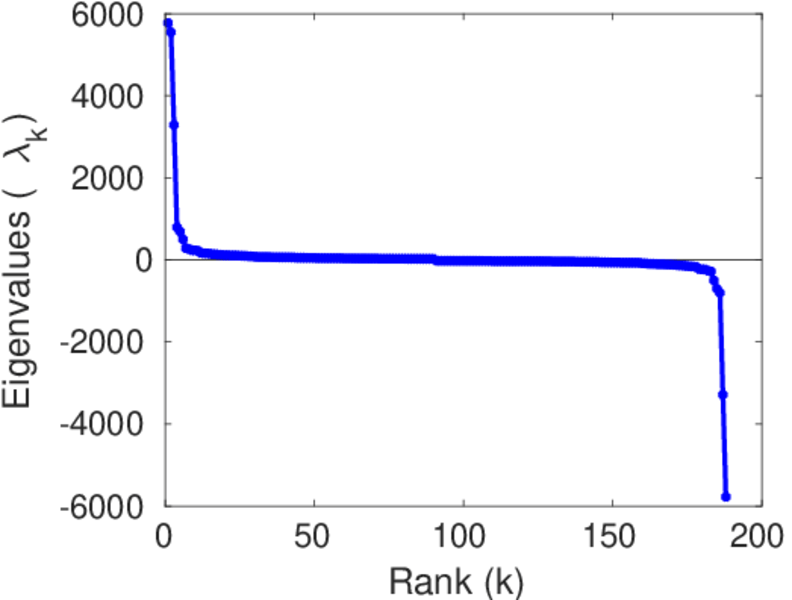
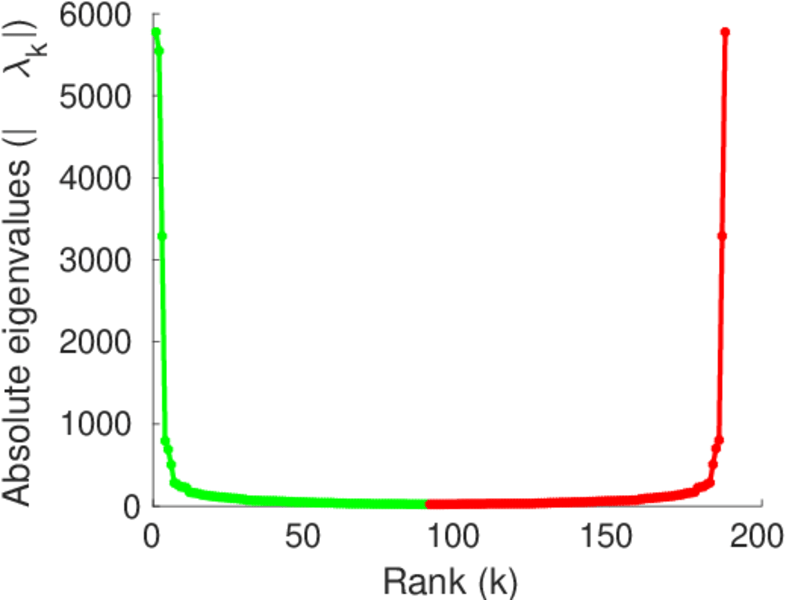
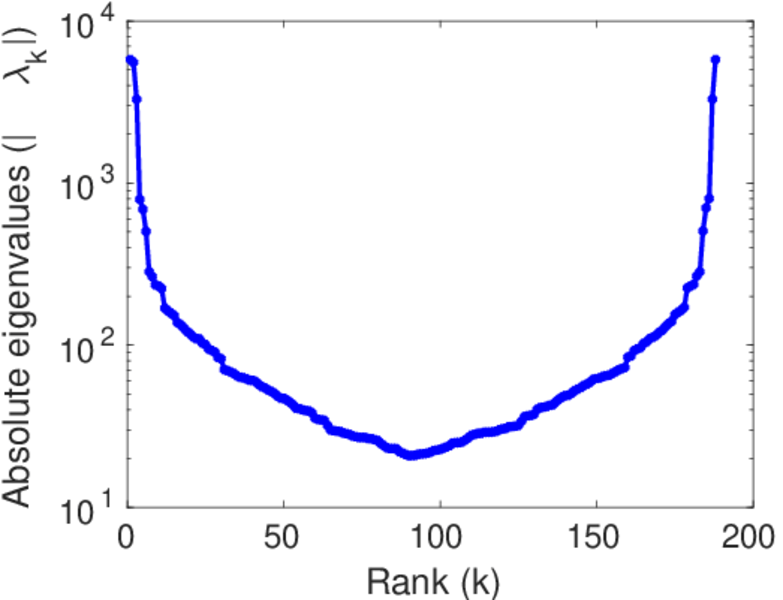
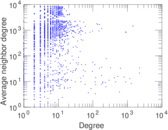
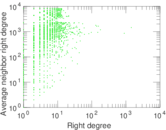
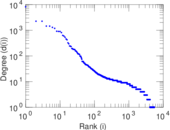
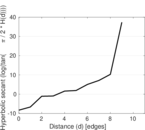
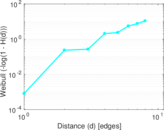
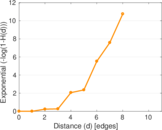
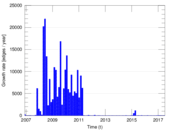
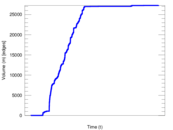
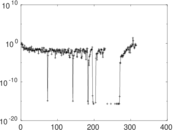
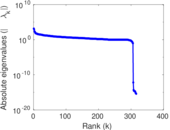
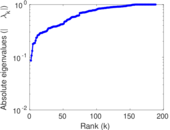
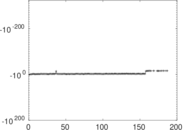
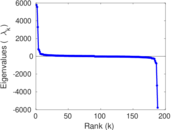
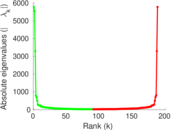
Plots


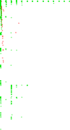


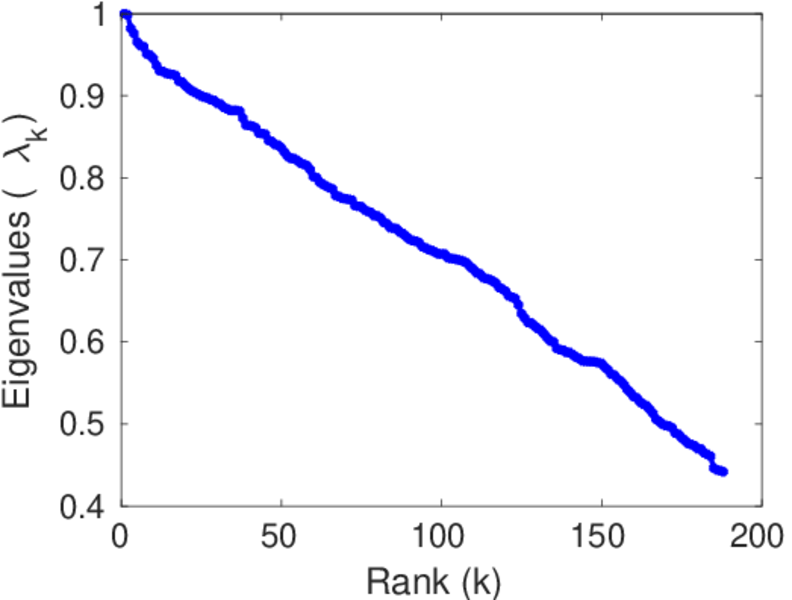
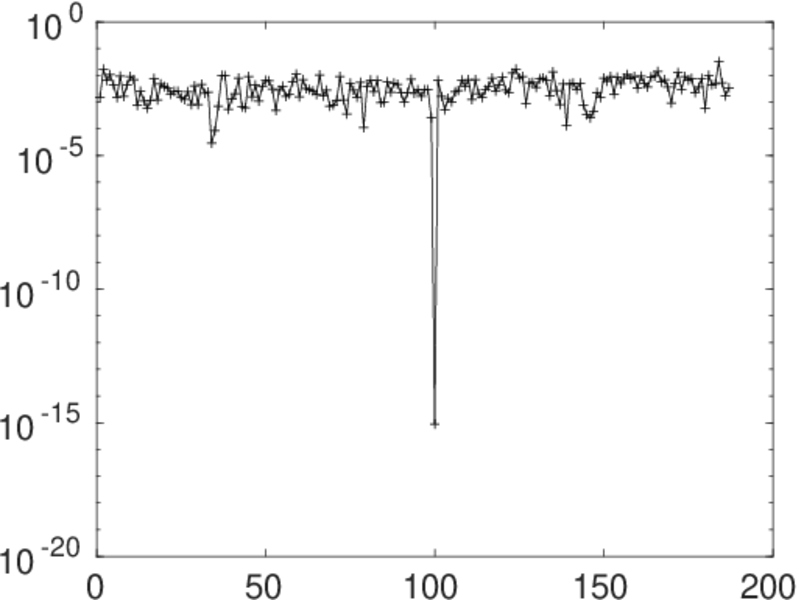
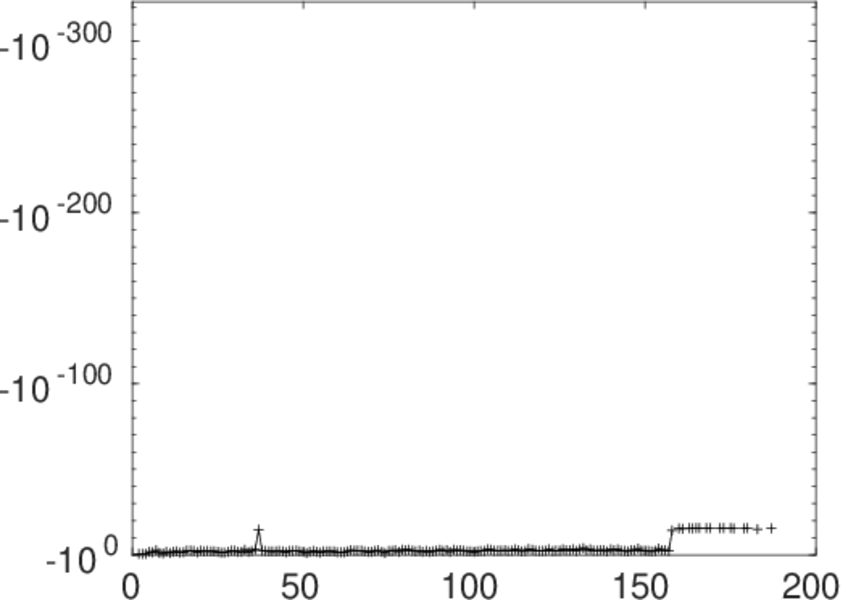
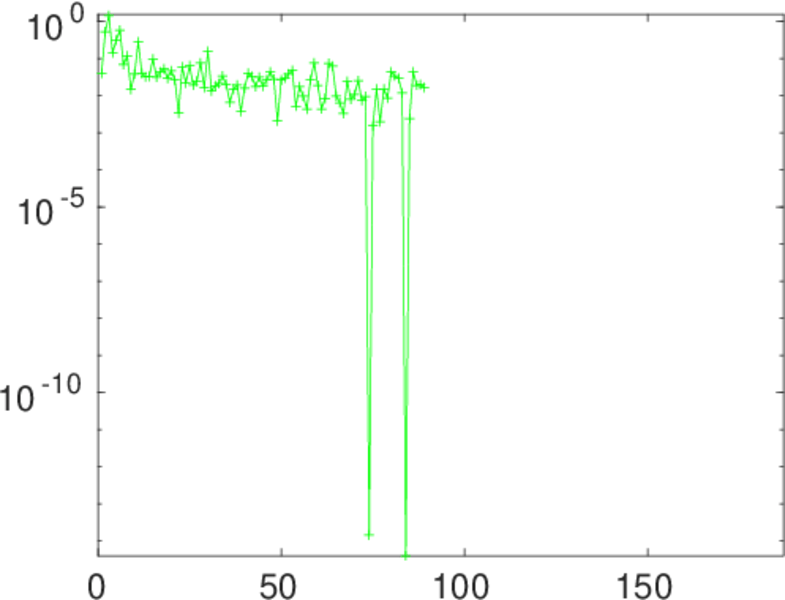
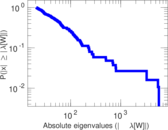
Matrix decompositions plots


Downloads
References
|
[1]
|
Jérôme Kunegis.
KONECT – The Koblenz Network Collection.
In Proc. Int. Conf. on World Wide Web Companion, pages
1343–1350, 2013.
[ http ]
|
|
[2]
|
Wikimedia Foundation.
Wikimedia downloads.
http://dumps.wikimedia.org/, January 2010.
|
 KONECT ‣ Networks ‣
Buy Me a Coffee
KONECT ‣ Networks ‣
Buy Me a Coffee