Wiktionary edits (hy)
This is the bipartite edit network of the Armenian Wiktionary. It contains
users and pages from the Armenian Wiktionary, connected by edit events. Each
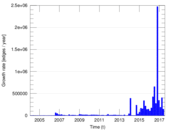
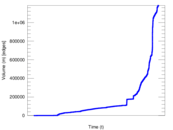
edge represents an edit. The dataset includes the timestamp of each edit.
Metadata
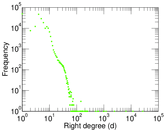
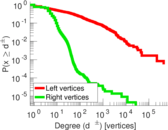
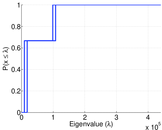
Statistics
| Size | n = | 218,585
|
| Left size | n1 = | 1,202
|
| Right size | n2 = | 217,383
|
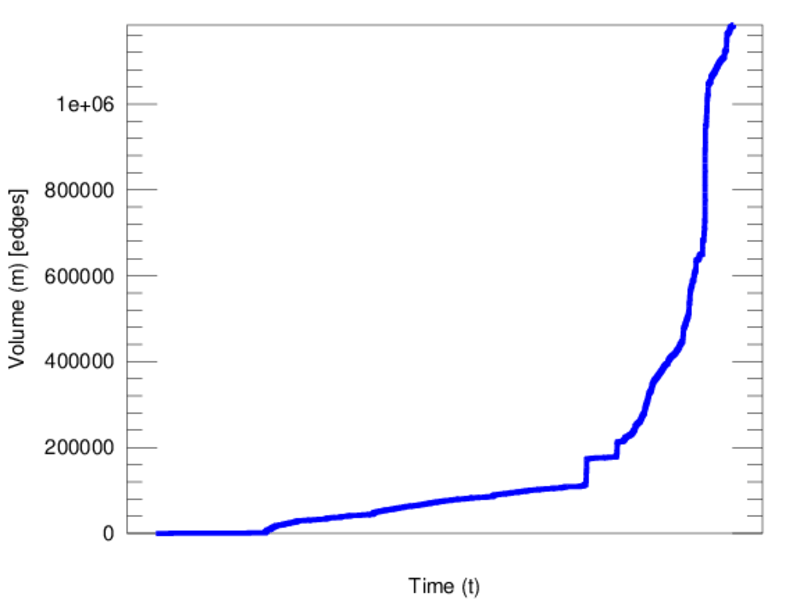
| Volume | m = | 1,183,865
|
| Unique edge count | m̿ = | 634,076
|
| Wedge count | s = | 20,541,171,816
|
| Claw count | z = | 918,766,533,443,506
|
| Cross count | x = | 3.330 75 × 1019
|
| Square count | q = | 8,718,756,758
|
| 4-Tour count | T4 = | 151,916,021,340
|
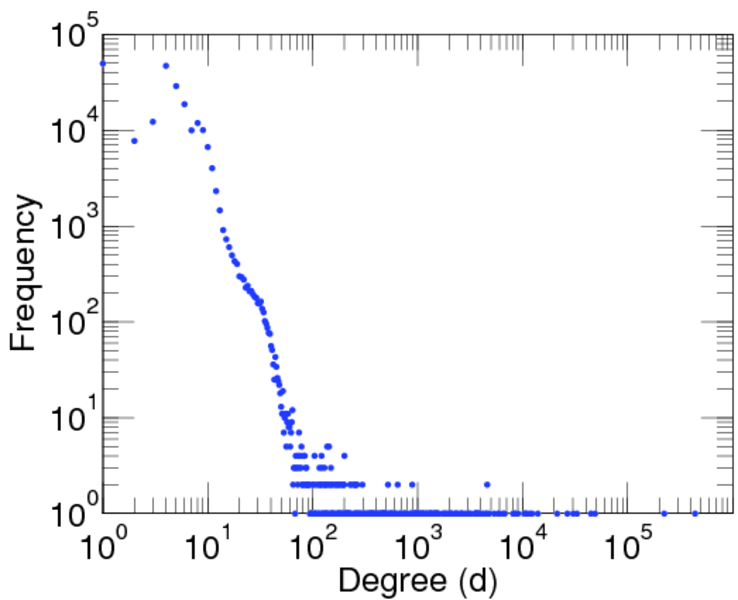
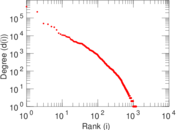
| Maximum degree | dmax = | 438,603
|
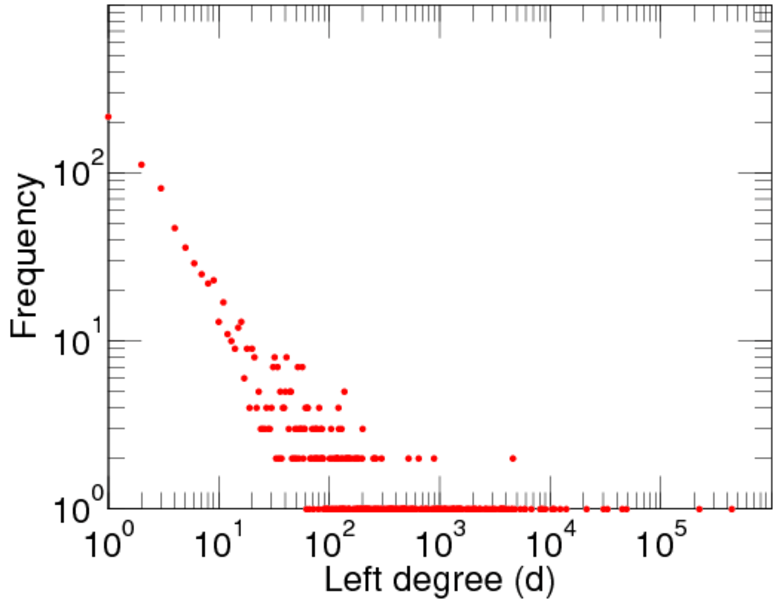
| Maximum left degree | d1max = | 438,603
|
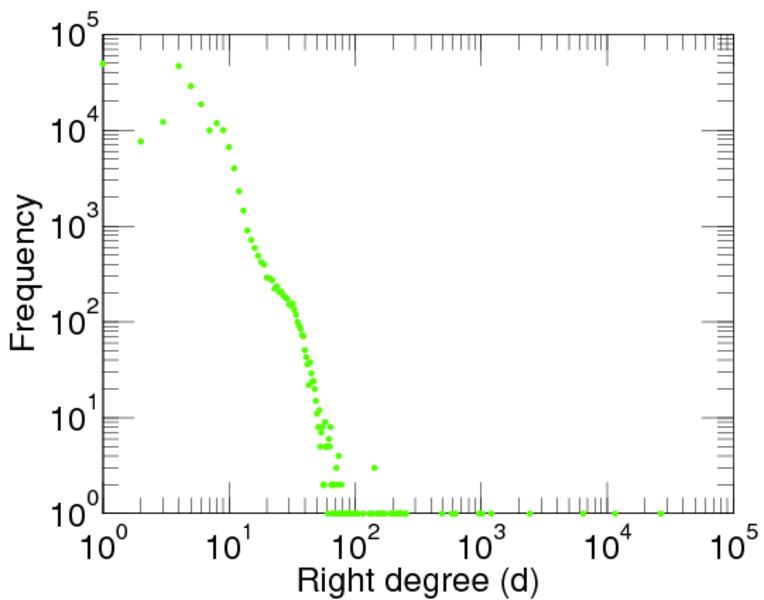
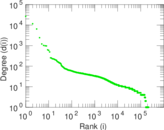
| Maximum right degree | d2max = | 26,672
|
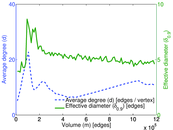
| Average degree | d = | 10.832 1
|
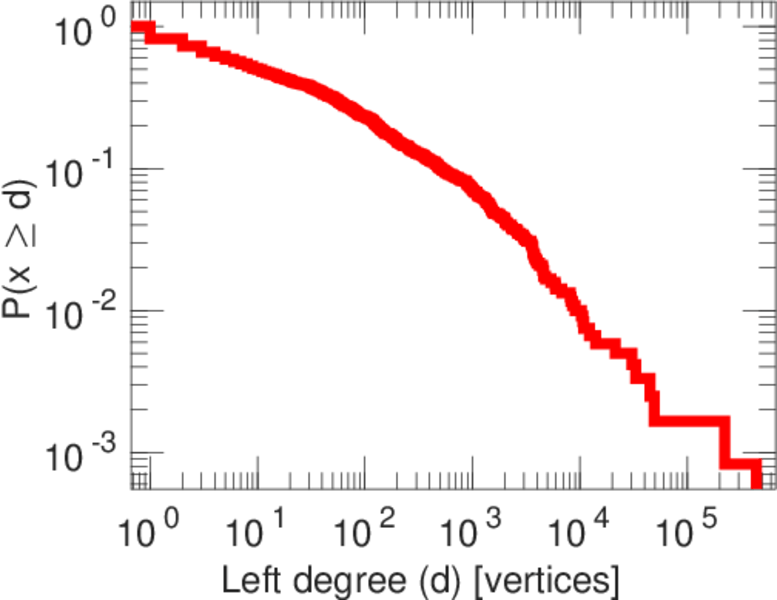
| Average left degree | d1 = | 984.913
|
| Average right degree | d2 = | 5.445 99
|
| Fill | p = | 0.002 426 67
|
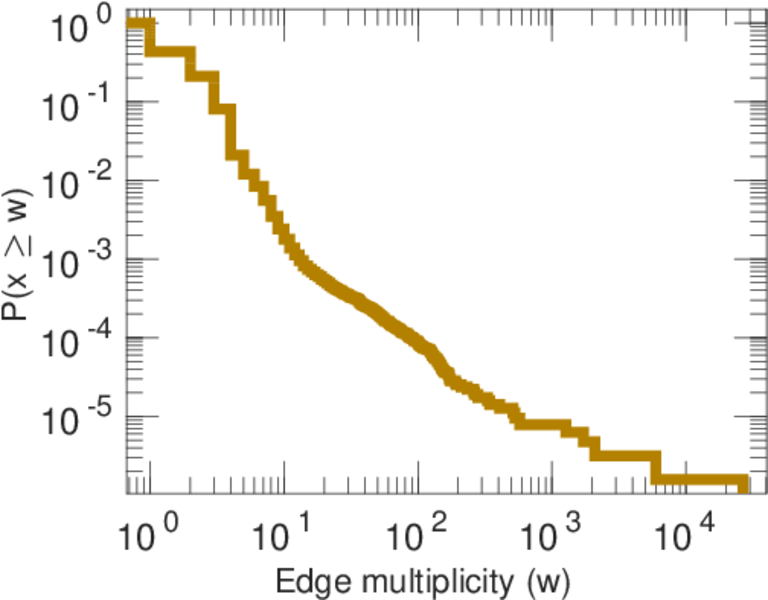
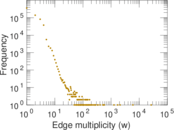
| Average edge multiplicity | m̃ = | 1.867 07
|
| Size of LCC | N = | 218,165
|
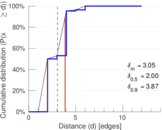
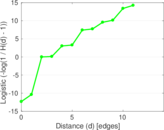
| Diameter | δ = | 14
|
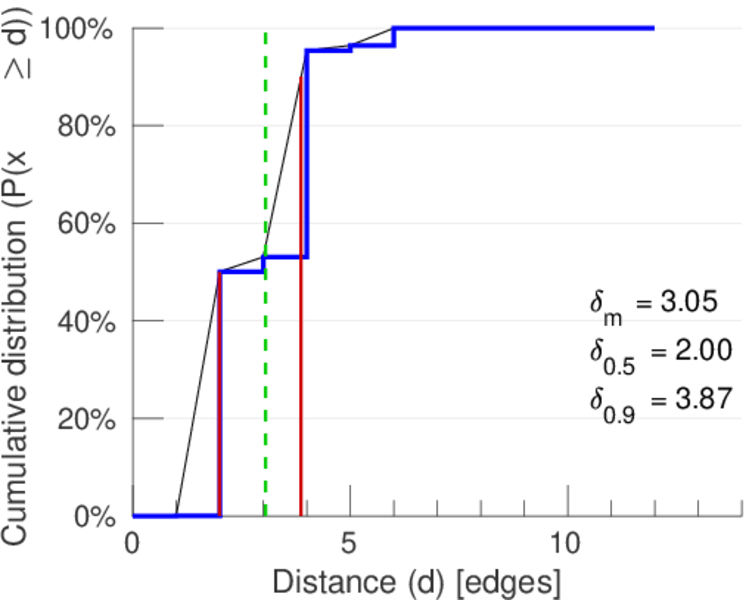
| 50-Percentile effective diameter | δ0.5 = | 1.998 96
|
| 90-Percentile effective diameter | δ0.9 = | 3.872 71
|
| Median distance | δM = | 2
|
| Mean distance | δm = | 3.051 90
|
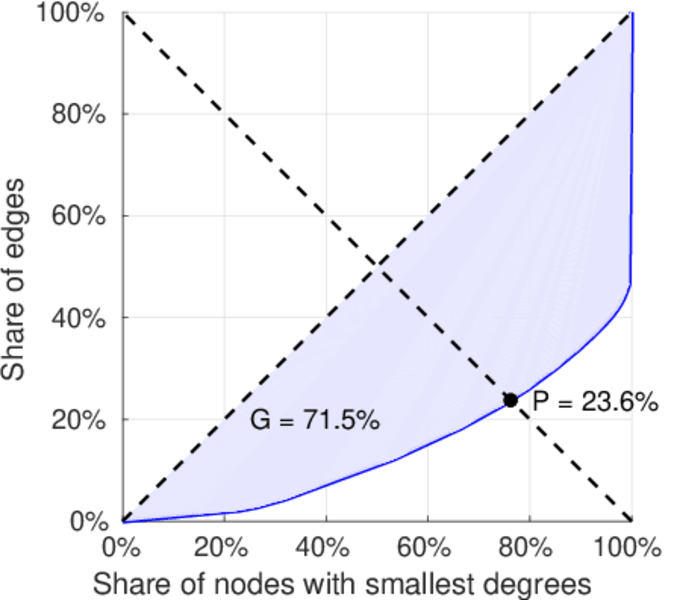
| Gini coefficient | G = | 0.716 592
|
| Balanced inequality ratio | P = | 0.234 987
|
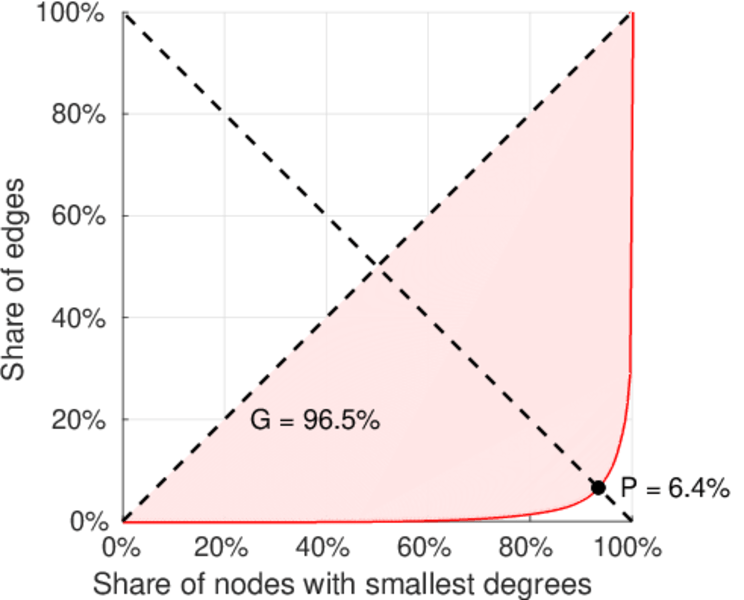
| Left balanced inequality ratio | P1 = | 0.064 305 5
|
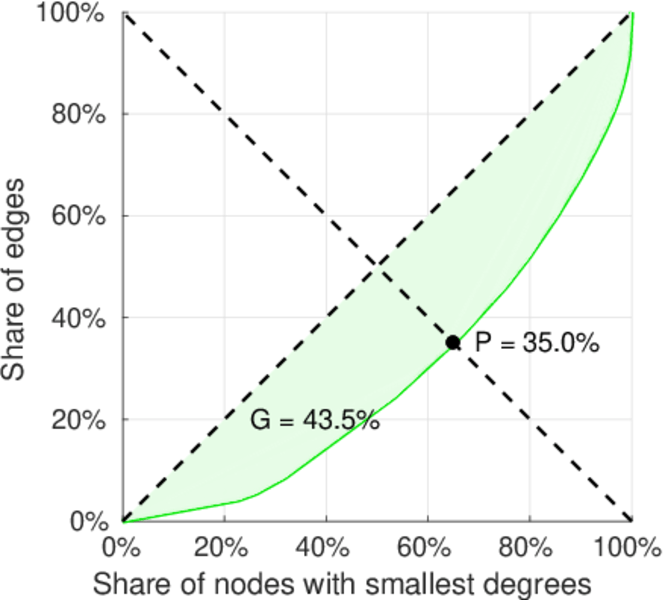
| Right balanced inequality ratio | P2 = | 0.349 817
|
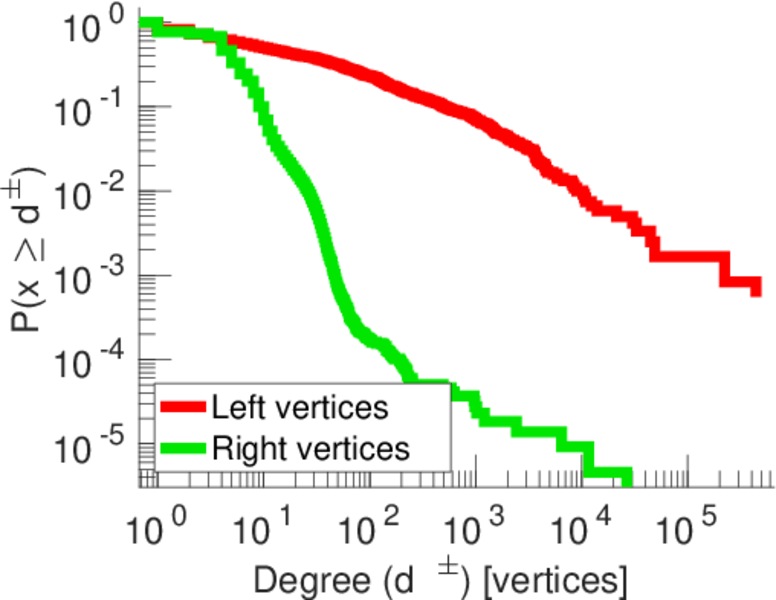
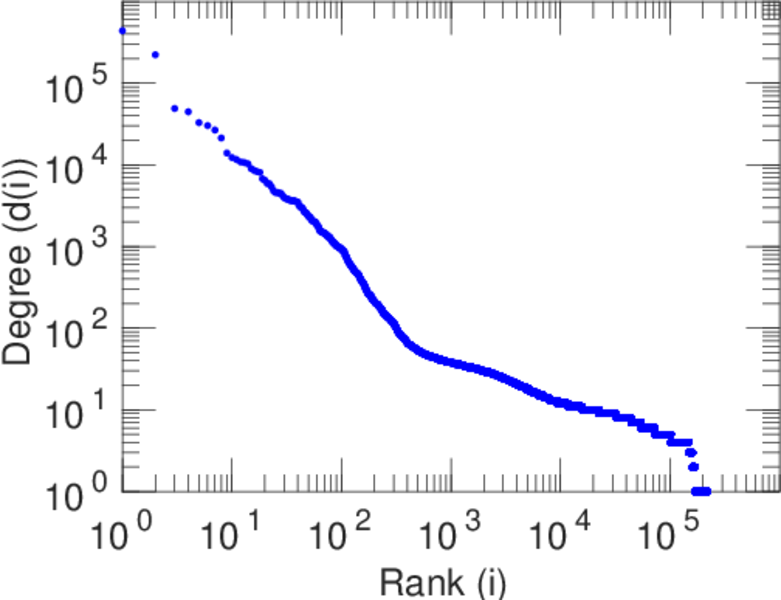
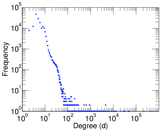
| Power law exponent | γ = | 2.104 79
|
| Tail power law exponent | γt = | 1.521 00
|
| Tail power law exponent with p | γ3 = | 1.521 00
|
| p-value | p = | 0.065 000 0
|
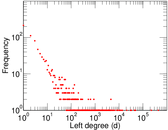
| Left tail power law exponent with p | γ3,1 = | 1.521 00
|
| Left p-value | p1 = | 0.046 000 0
|
| Right tail power law exponent with p | γ3,2 = | 4.451 00
|
| Right p-value | p2 = | 0.000 00
|
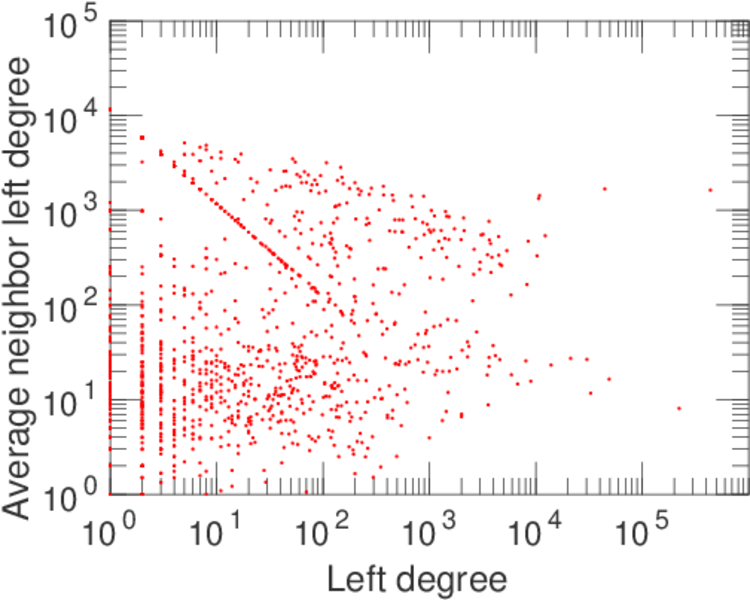
| Degree assortativity | ρ = | −0.100 527
|
| Degree assortativity p-value | pρ = | 0.000 00
|
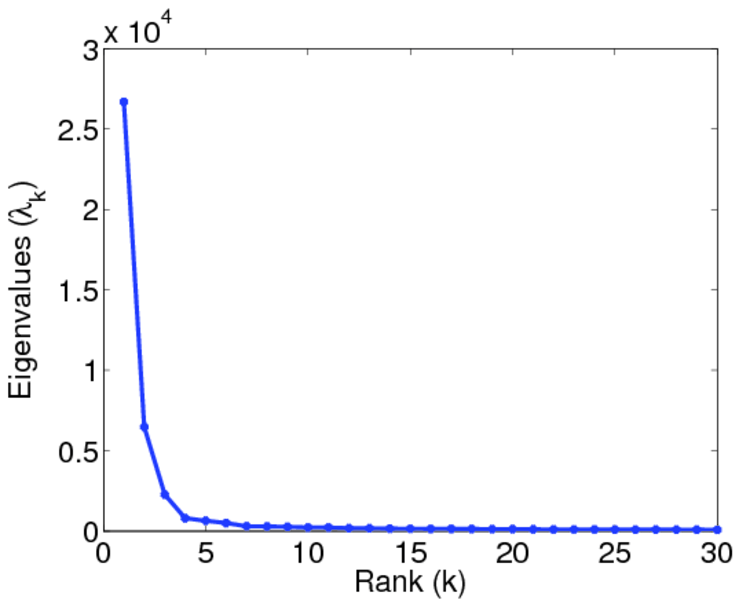
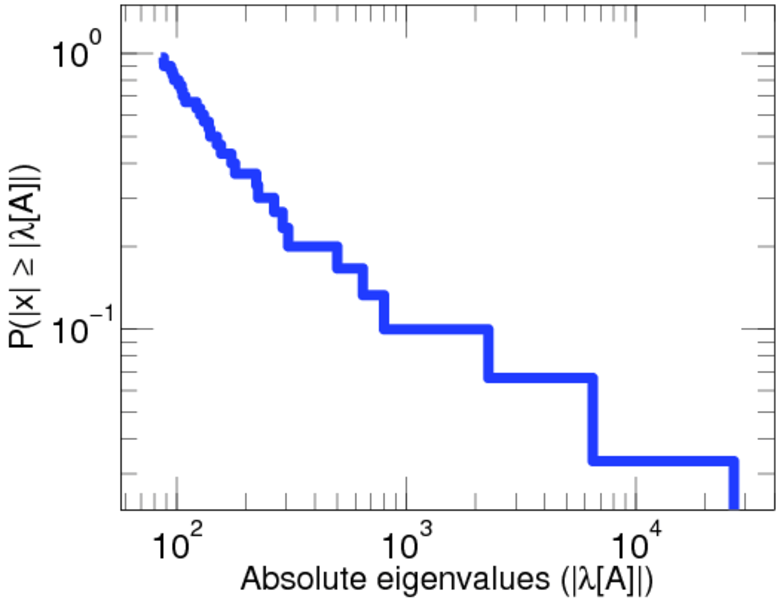
| Spectral norm | α = | 26,692.2
|
| Algebraic connectivity | a = | 0.007 170 95
|
| Spectral separation | |λ1[A] / λ2[A]| = | 4.121 78
|
| Controllability | C = | 216,152
|
| Relative controllability | Cr = | 0.989 480
|
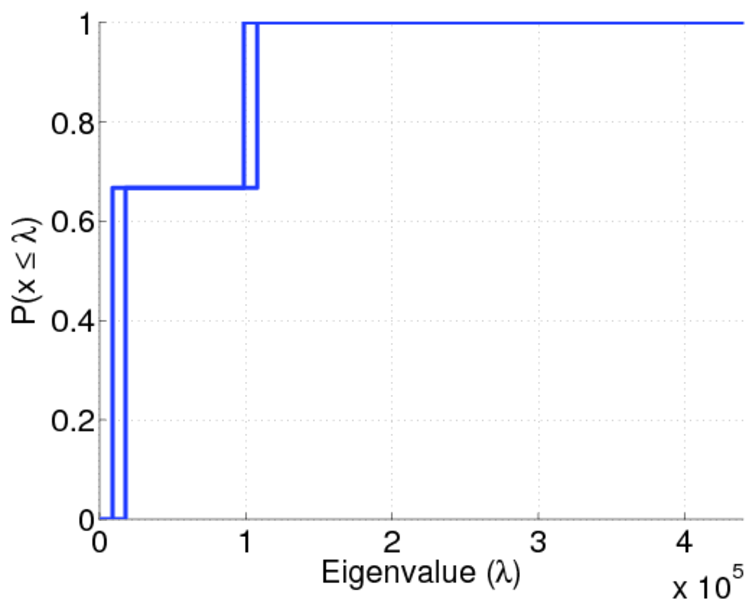
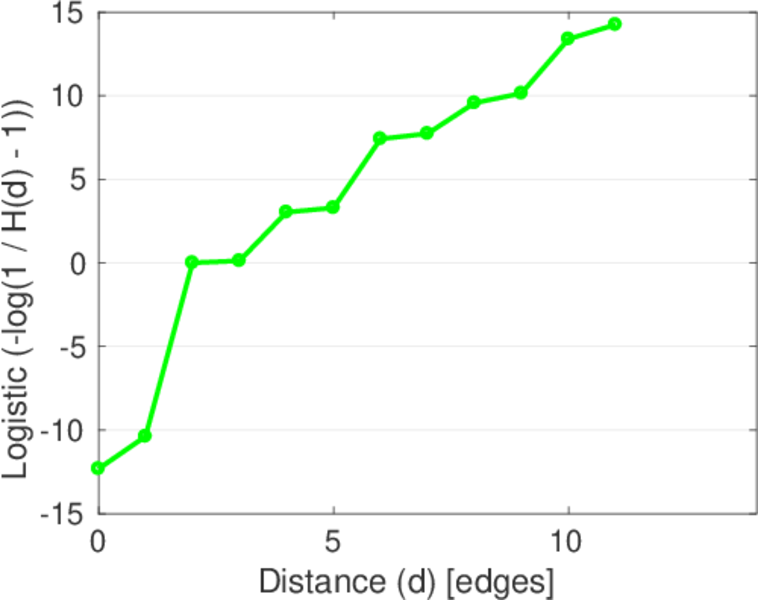
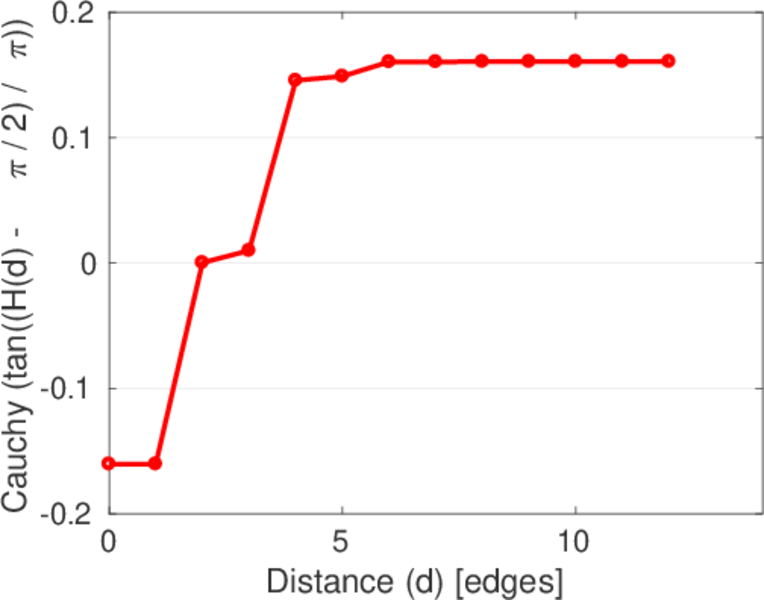
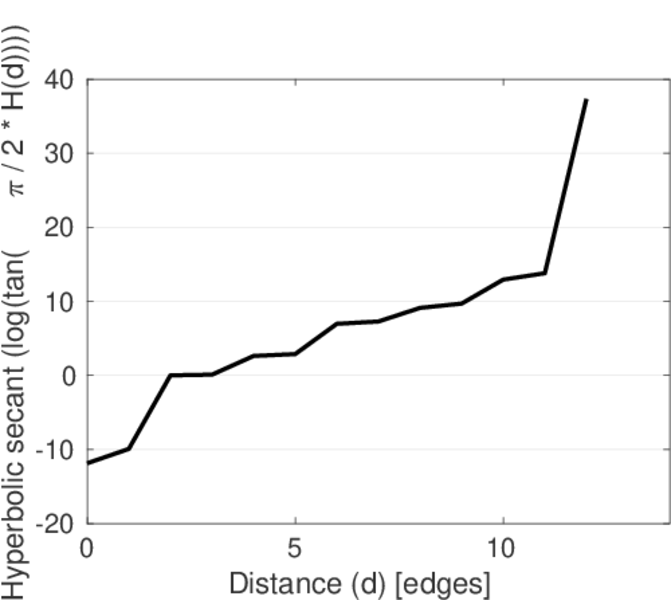
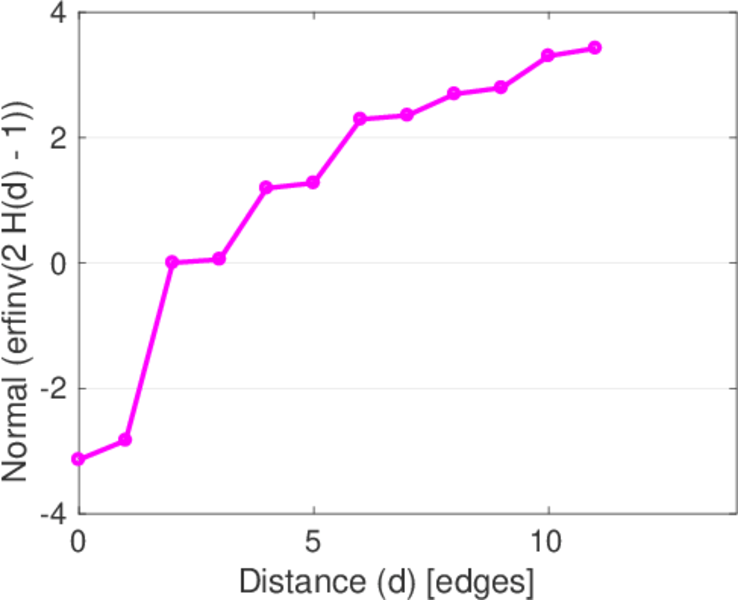
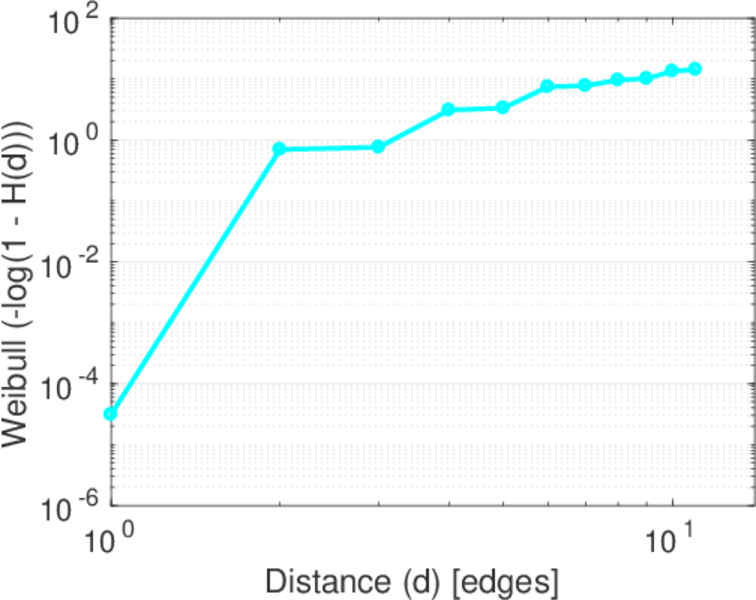
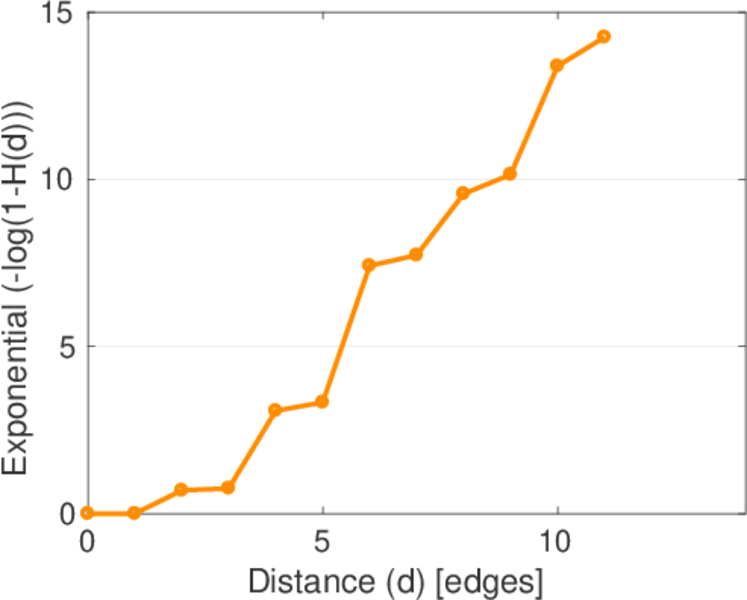
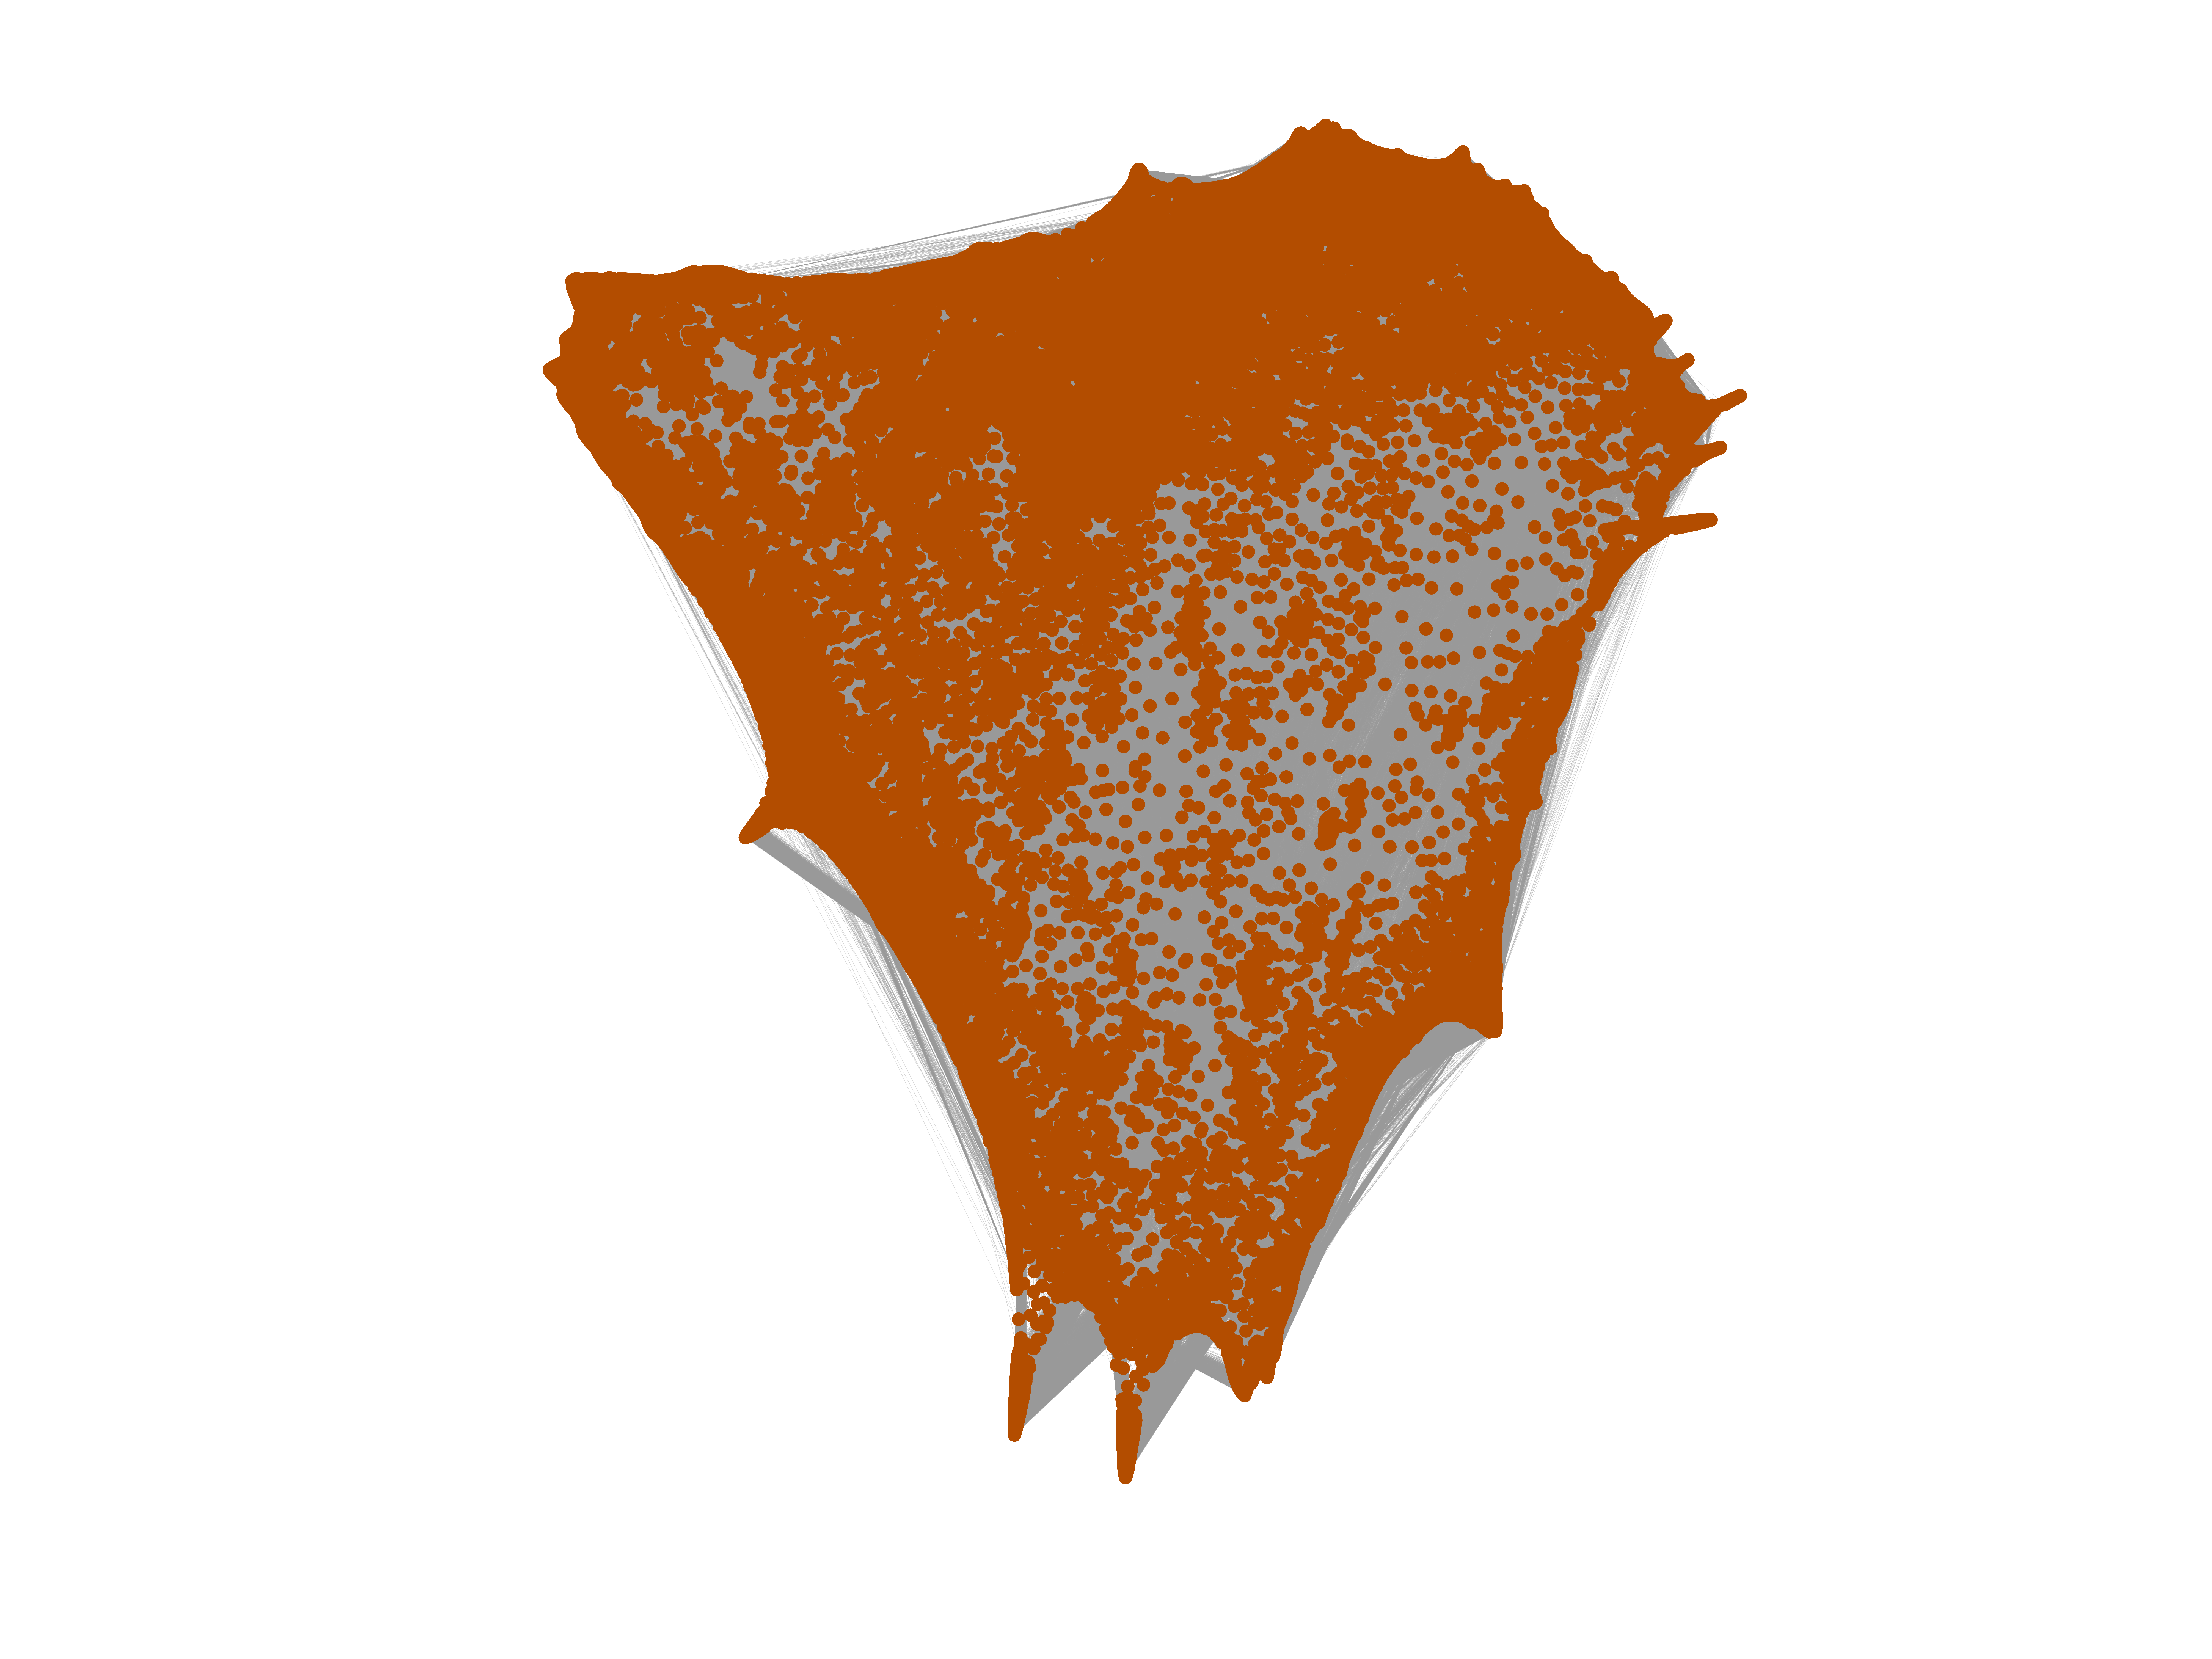
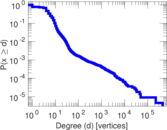
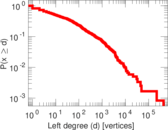
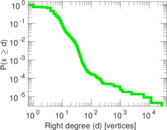
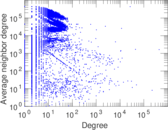
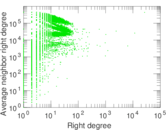
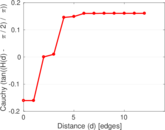
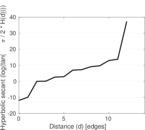
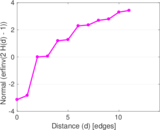
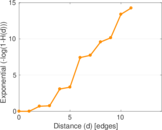
Plots


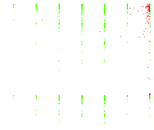


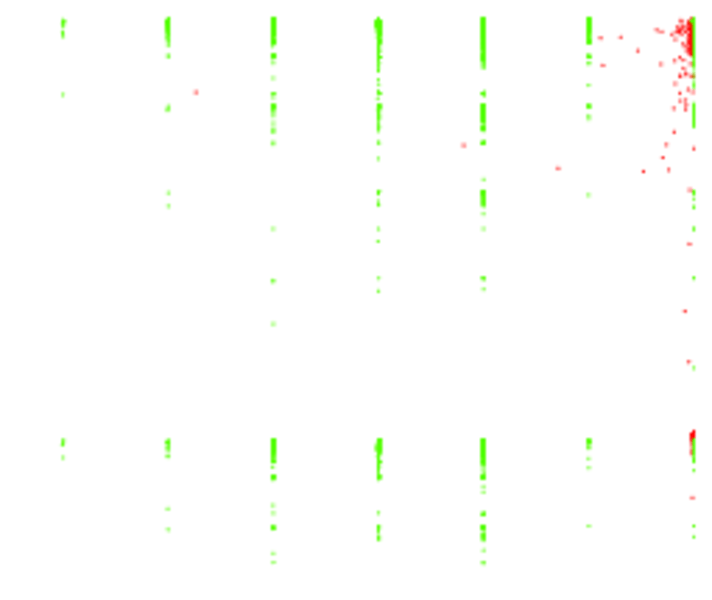
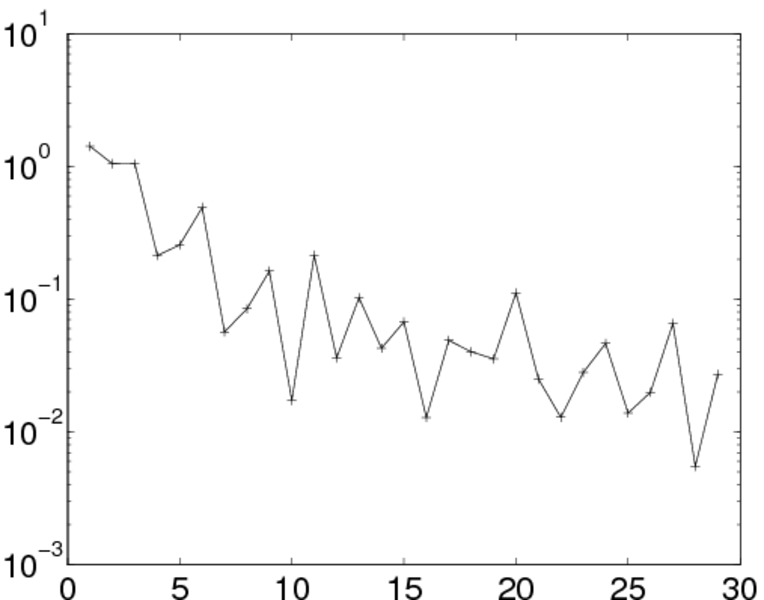
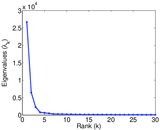
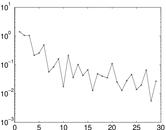
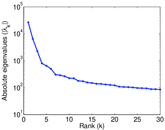
Matrix decompositions plots
Downloads
References
|
[1]
|
Jérôme Kunegis.
KONECT – The Koblenz Network Collection.
In Proc. Int. Conf. on World Wide Web Companion, pages
1343–1350, 2013.
[ http ]
|
|
[2]
|
Wikimedia Foundation.
Wikimedia downloads.
http://dumps.wikimedia.org/, January 2010.
|
 KONECT ‣ Networks ‣
Buy Me a Coffee
KONECT ‣ Networks ‣
Buy Me a Coffee