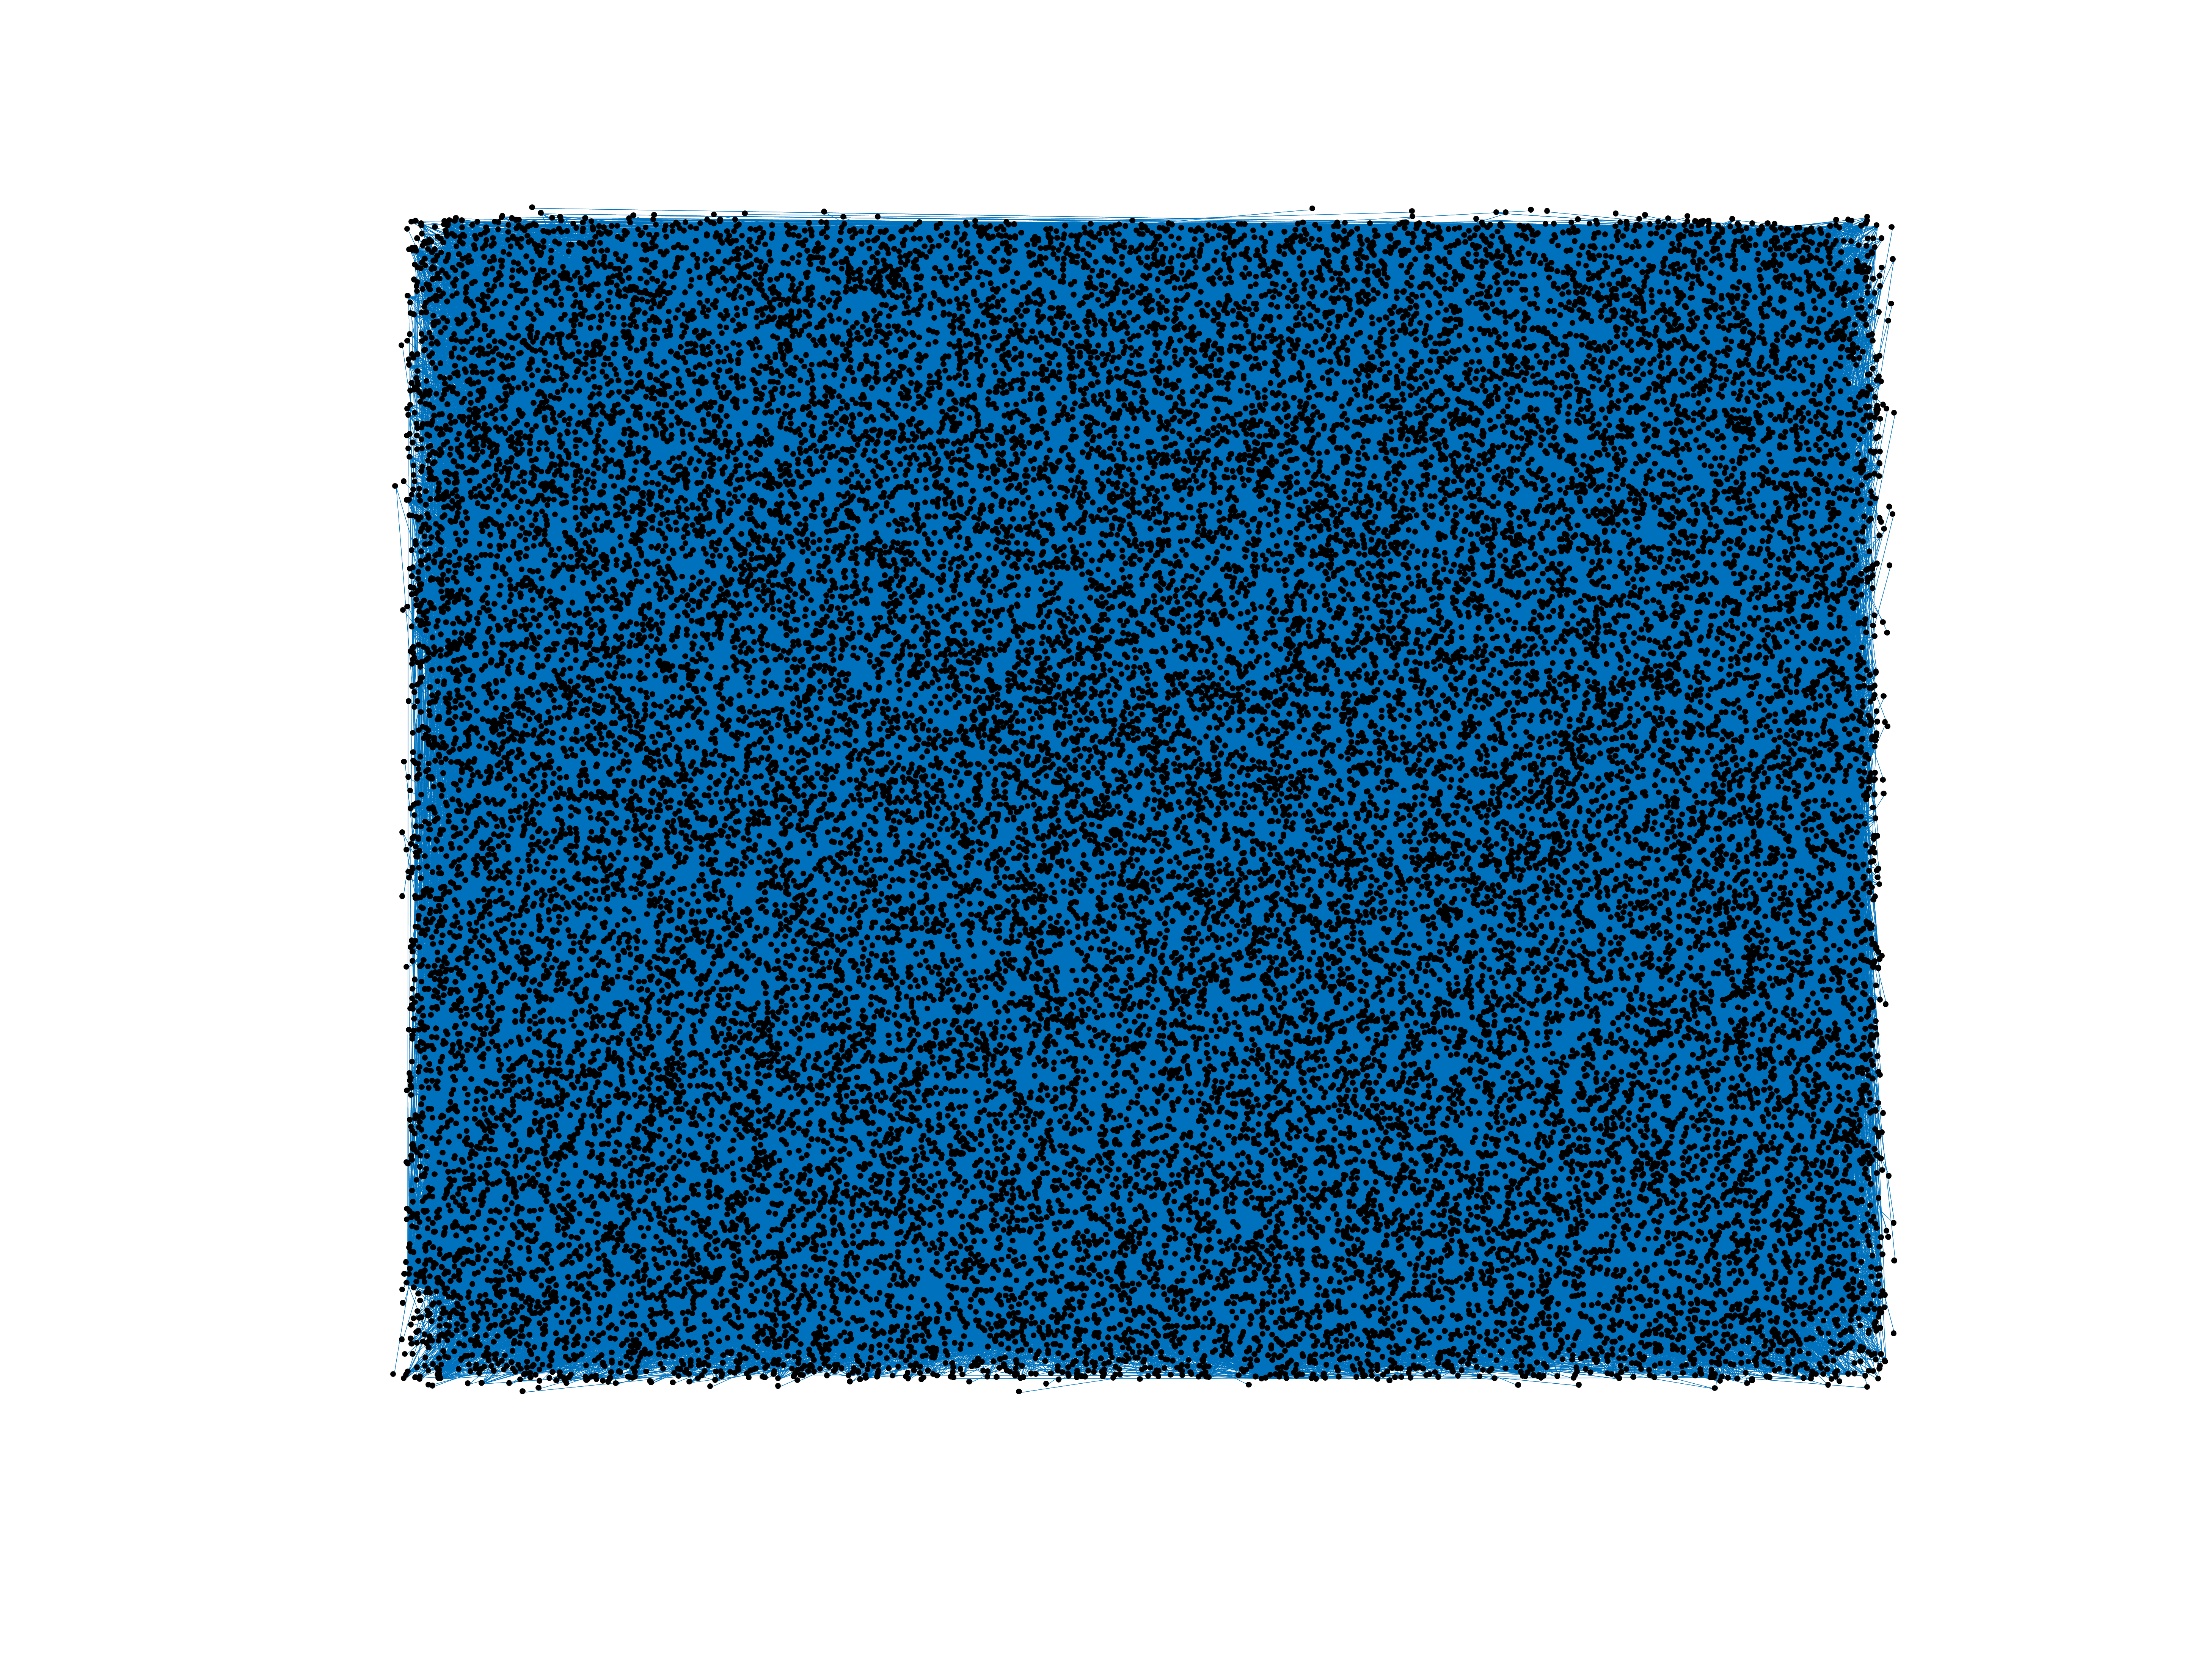
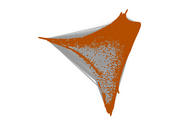
Wikipedia edits (ia)
This is the bipartite edit network of the Interlingua Wikipedia. It contains
users and pages from the Interlingua Wikipedia, connected by edit events. Each
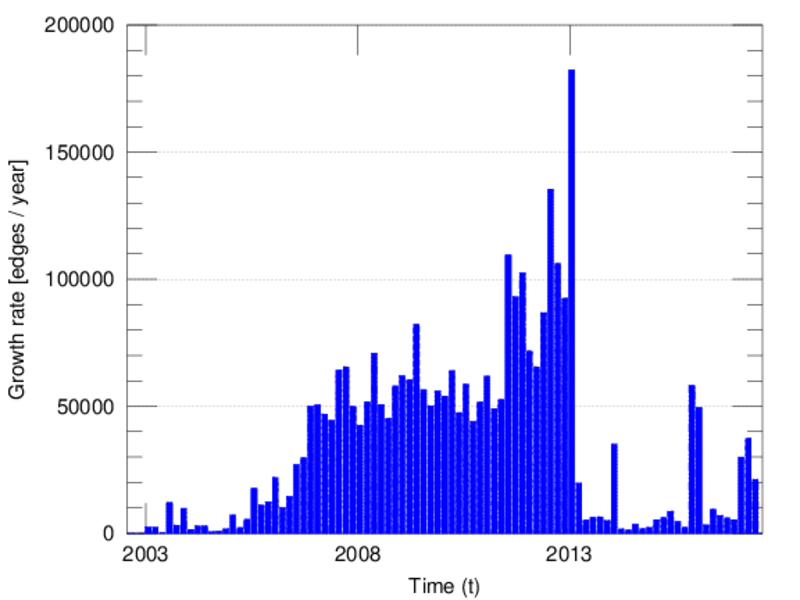
edge represents an edit. The dataset includes the timestamp of each edit.
Metadata
Statistics
| Size | n = | 35,162
|
| Left size | n1 = | 2,509
|
| Right size | n2 = | 32,653
|
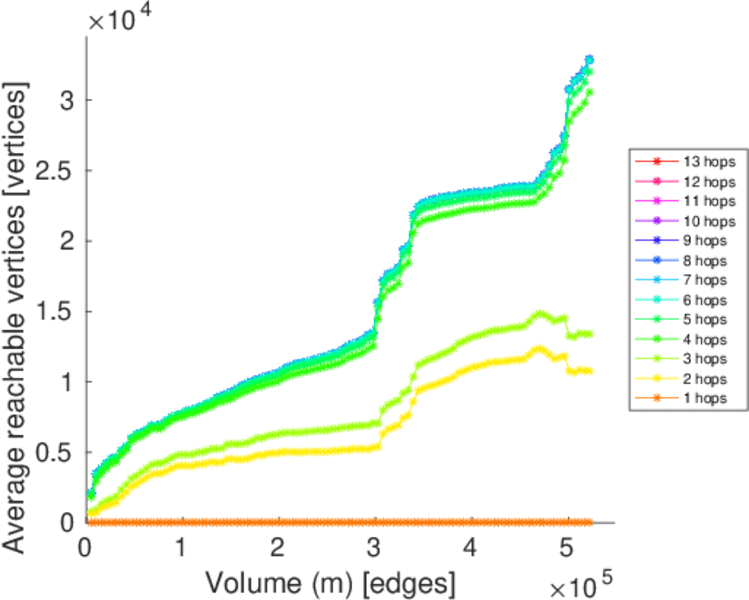
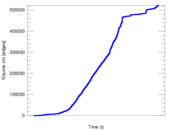
| Volume | m = | 521,965
|
| Unique edge count | m̿ = | 251,824
|
| Wedge count | s = | 650,922,024
|
| Claw count | z = | 2,037,142,496,304
|
| Cross count | x = | 6,069,540,528,610,593
|
| Square count | q = | 1,864,671,663
|
| 4-Tour count | T4 = | 17,521,989,408
|
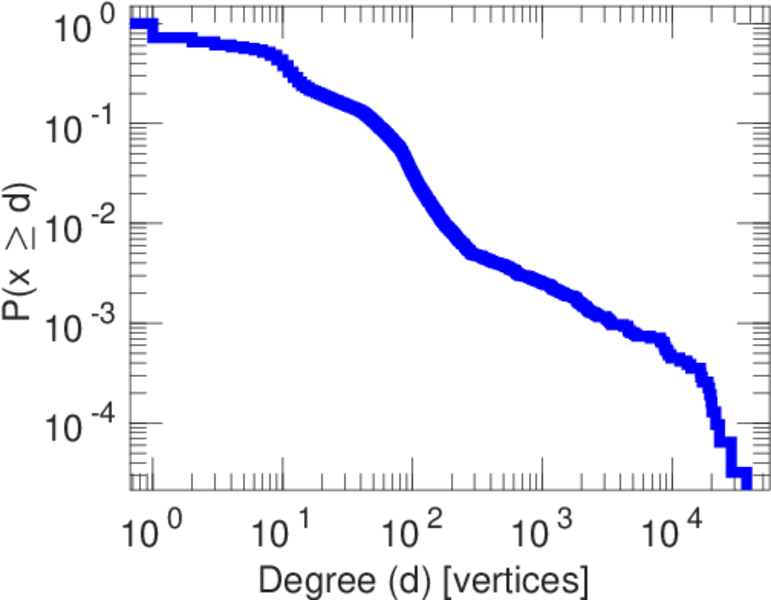
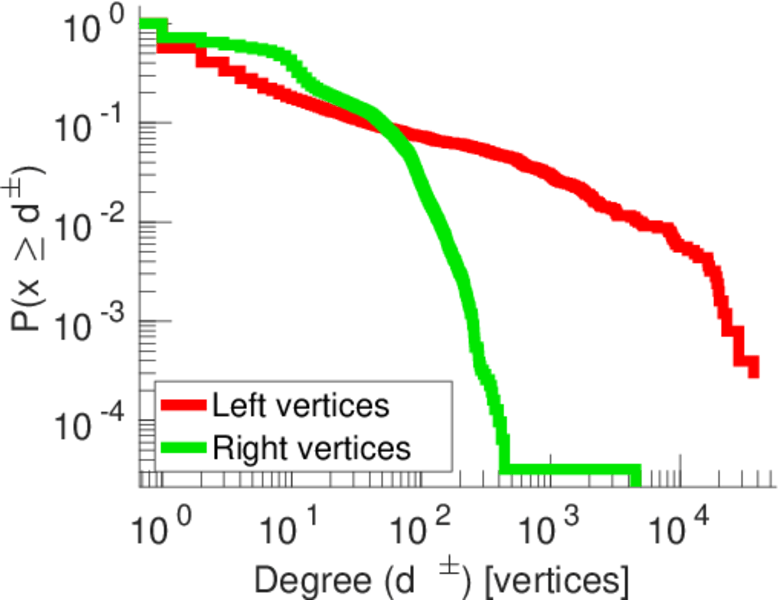
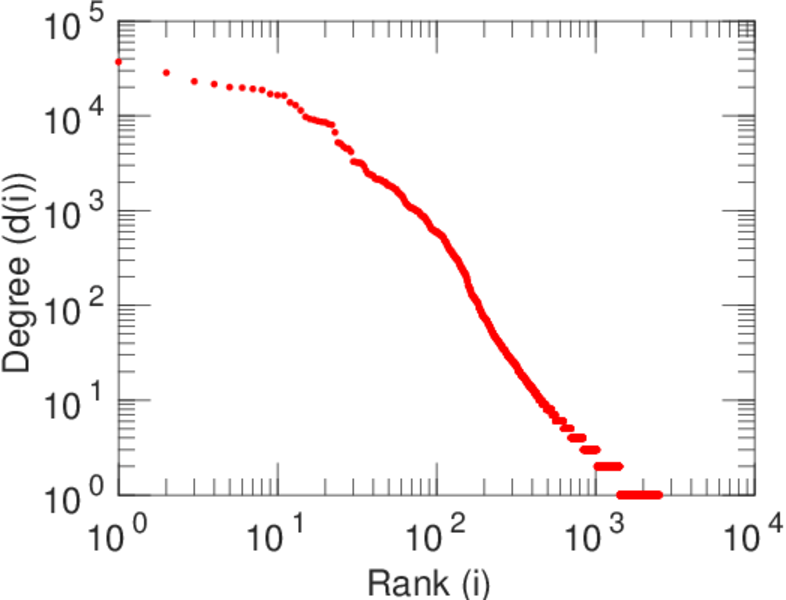
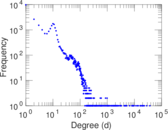
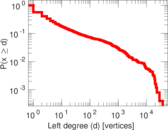
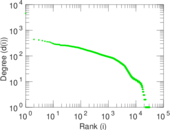
| Maximum degree | dmax = | 37,071
|
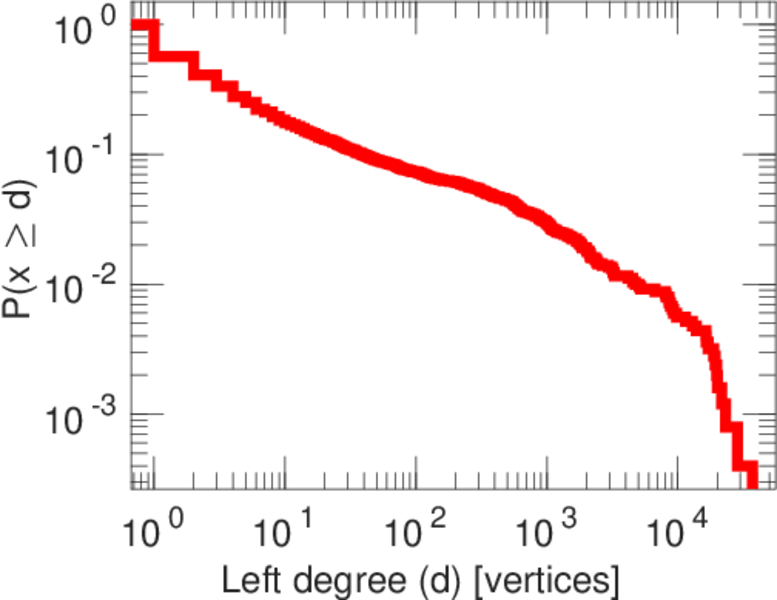
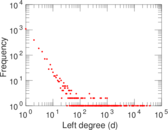
| Maximum left degree | d1max = | 37,071
|
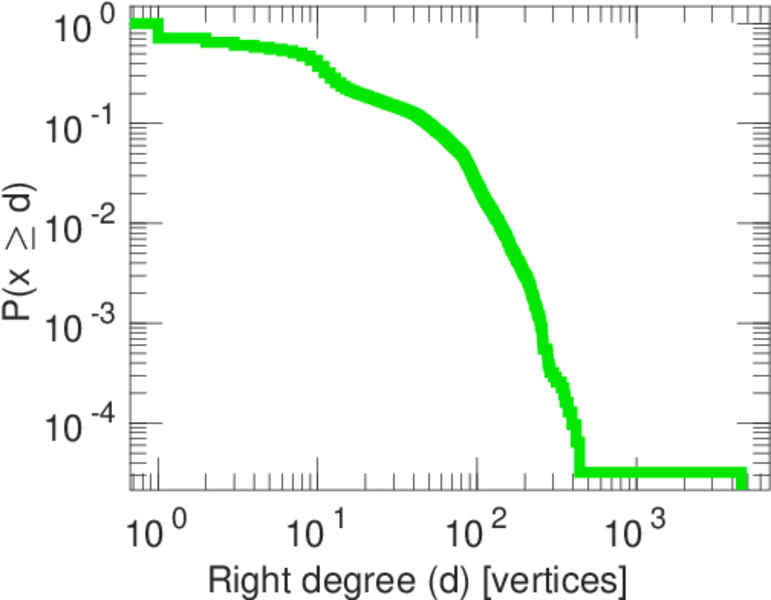
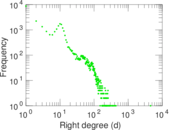
| Maximum right degree | d2max = | 4,555
|
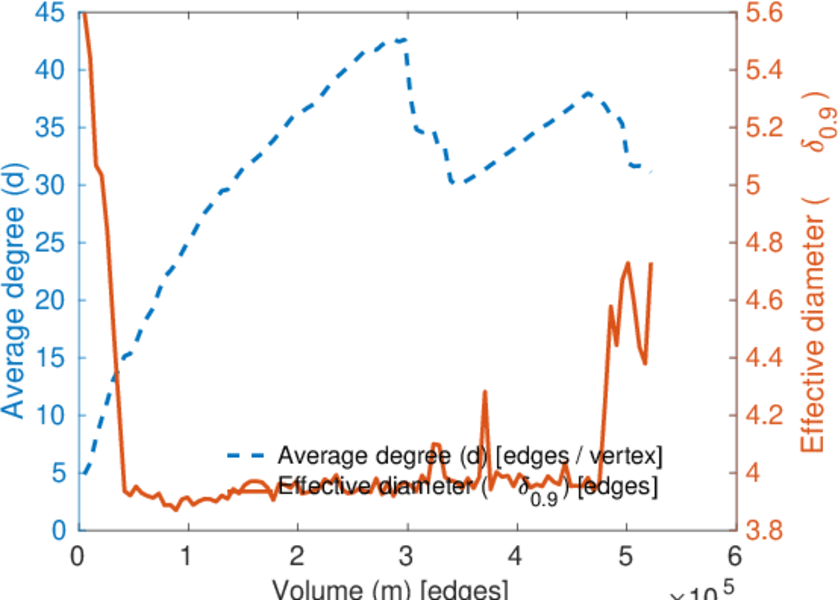
| Average degree | d = | 29.689 2
|
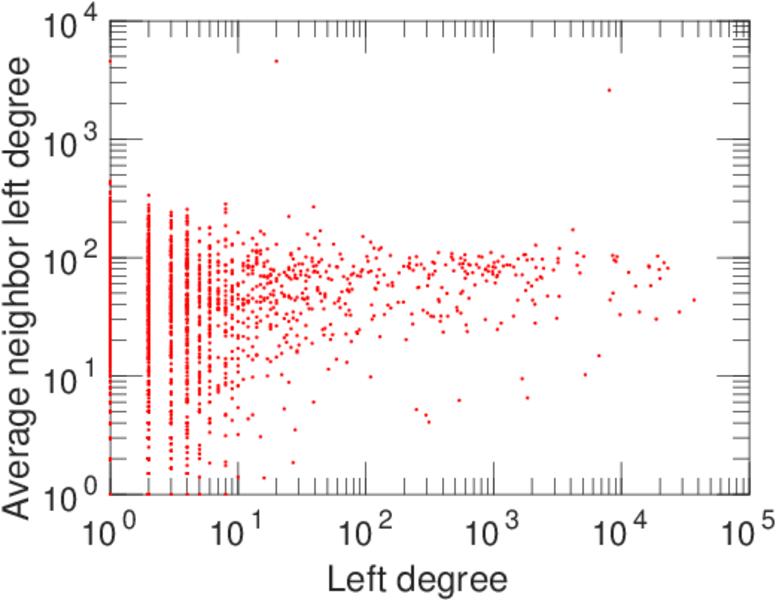
| Average left degree | d1 = | 208.037
|
| Average right degree | d2 = | 15.985 2
|
| Fill | p = | 0.003 073 78
|
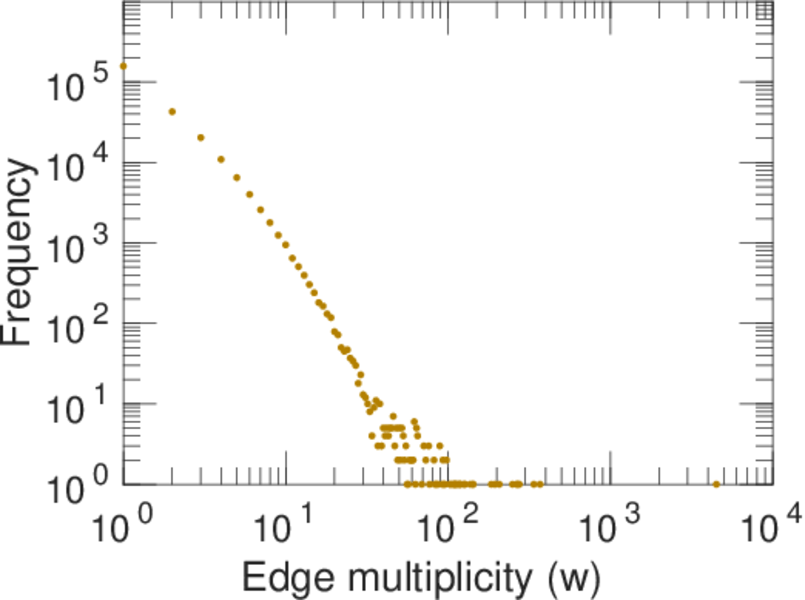
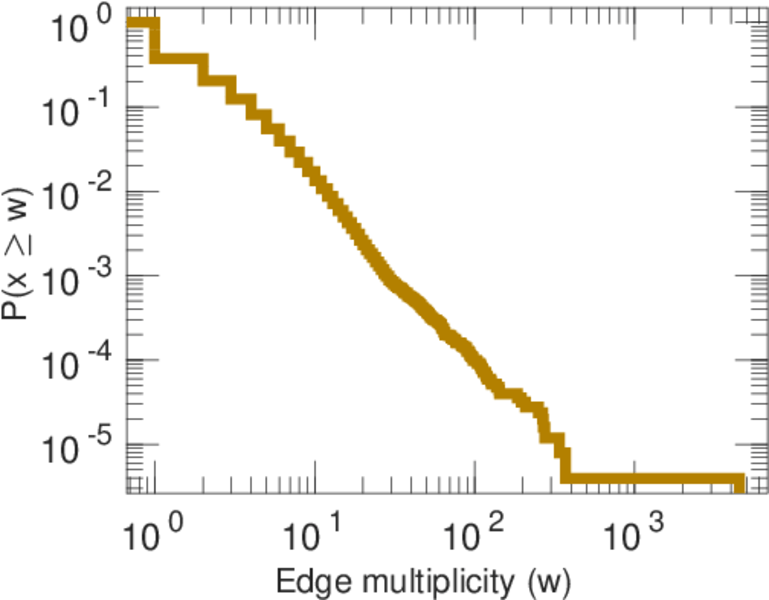
| Average edge multiplicity | m̃ = | 2.072 74
|
| Size of LCC | N = | 32,888
|
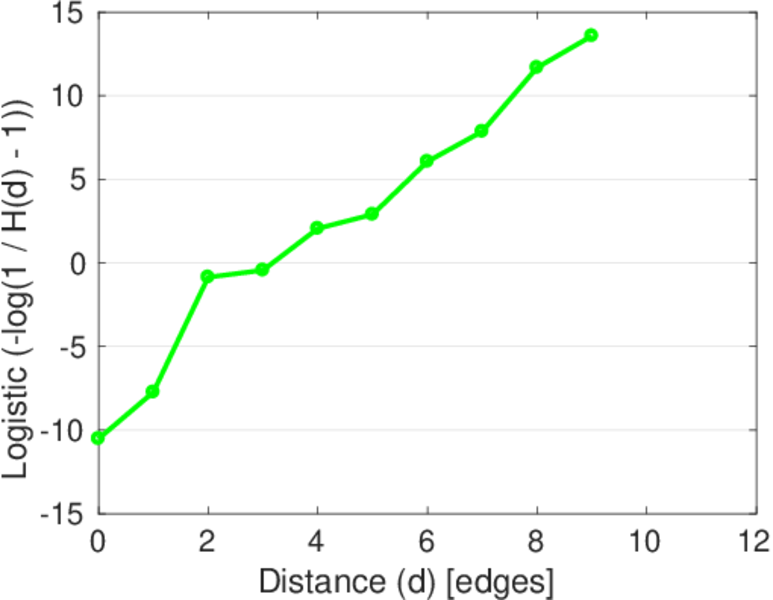
| Diameter | δ = | 11
|
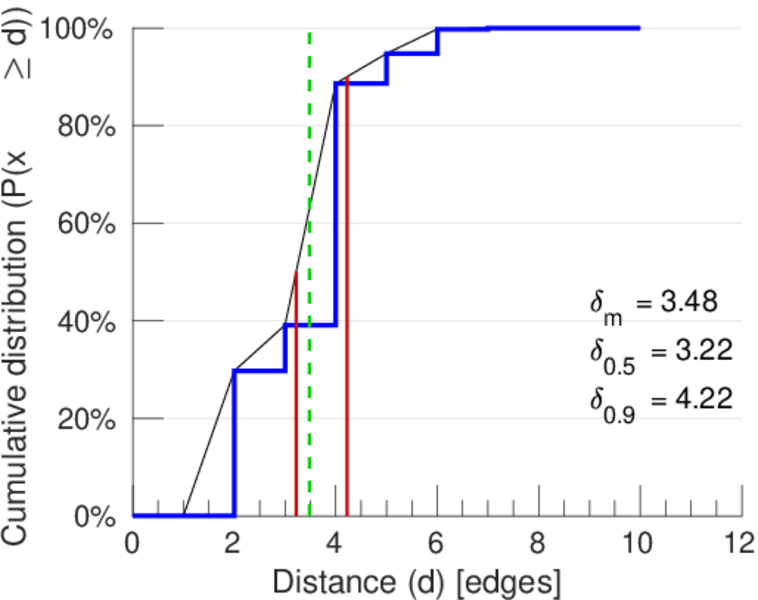
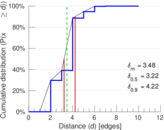
| 50-Percentile effective diameter | δ0.5 = | 3.219 86
|
| 90-Percentile effective diameter | δ0.9 = | 4.222 12
|
| Median distance | δM = | 4
|
| Mean distance | δm = | 3.479 84
|
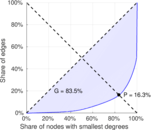
| Gini coefficient | G = | 0.833 721
|
| Balanced inequality ratio | P = | 0.162 798
|
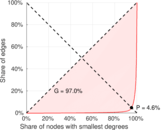
| Left balanced inequality ratio | P1 = | 0.046 476 3
|
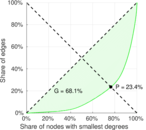
| Right balanced inequality ratio | P2 = | 0.234 431
|
| Relative edge distribution entropy | Her = | 0.753 395
|
| Power law exponent | γ = | 1.727 27
|
| Tail power law exponent | γt = | 2.251 00
|
| Tail power law exponent with p | γ3 = | 2.251 00
|
| p-value | p = | 0.000 00
|
| Left tail power law exponent with p | γ3,1 = | 1.671 00
|
| Left p-value | p1 = | 0.000 00
|
| Right tail power law exponent with p | γ3,2 = | 6.741 00
|
| Right p-value | p2 = | 0.007 000 00
|
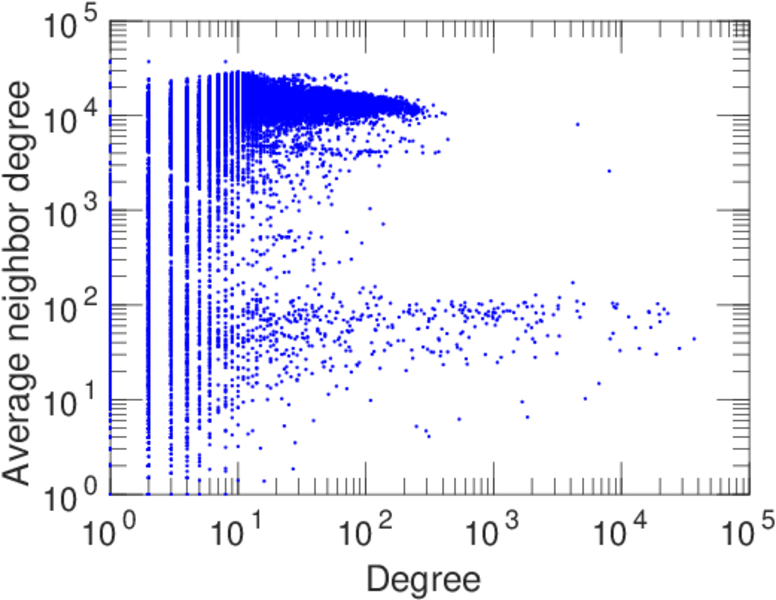
| Degree assortativity | ρ = | −0.272 671
|
| Degree assortativity p-value | pρ = | 0.000 00
|
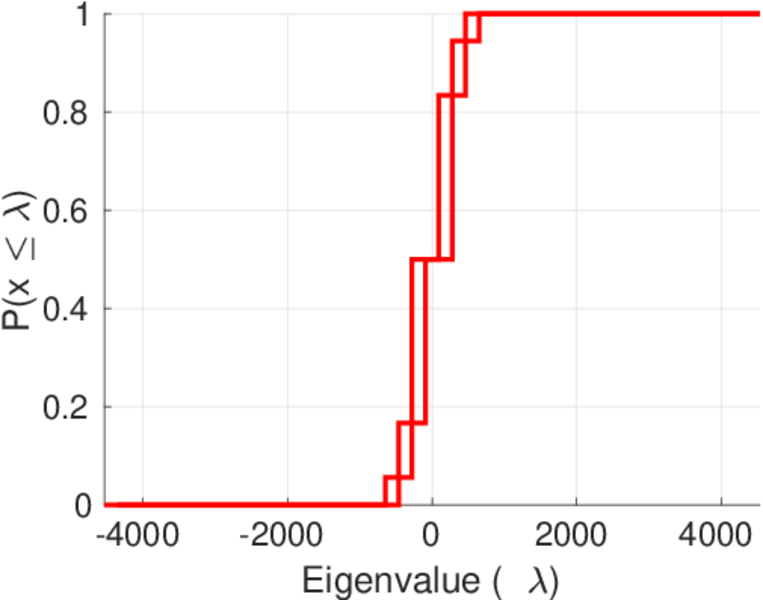
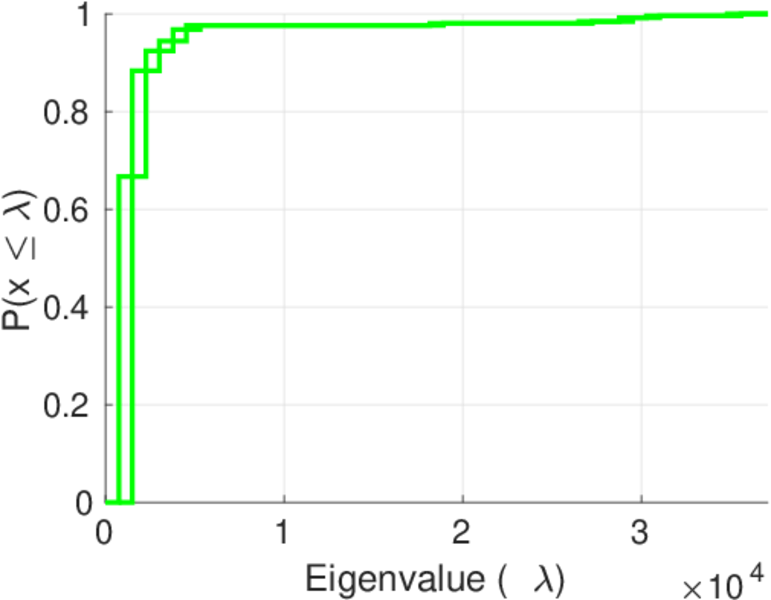
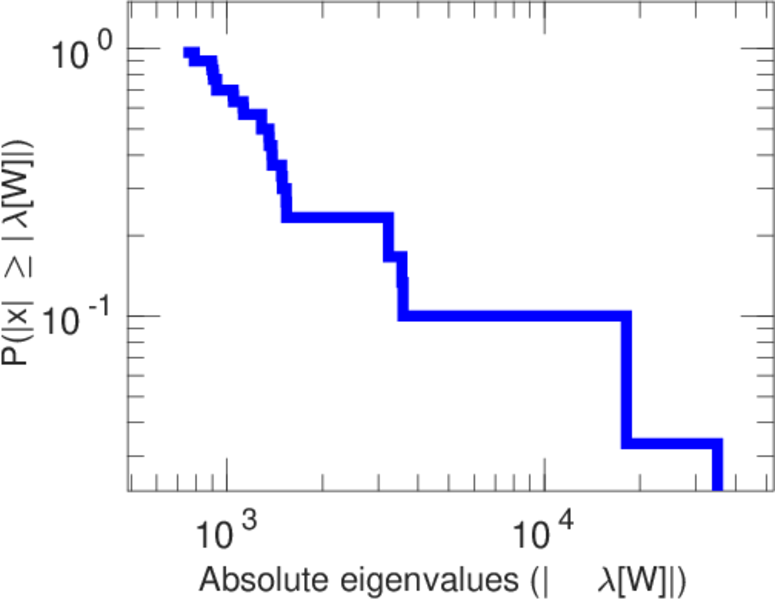
| Spectral norm | α = | 4,536.20
|
| Algebraic connectivity | a = | 0.049 198 1
|
| Spectral separation | |λ1[A] / λ2[A]| = | 4.639 42
|
| Controllability | C = | 28,962
|
| Relative controllability | Cr = | 0.863 146
|
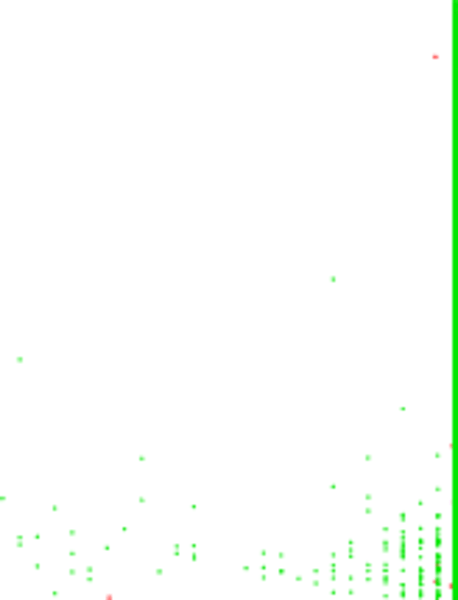
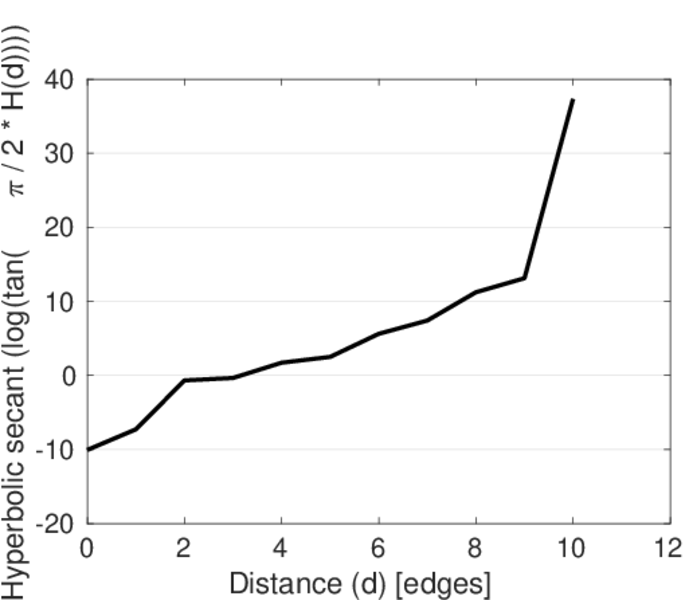
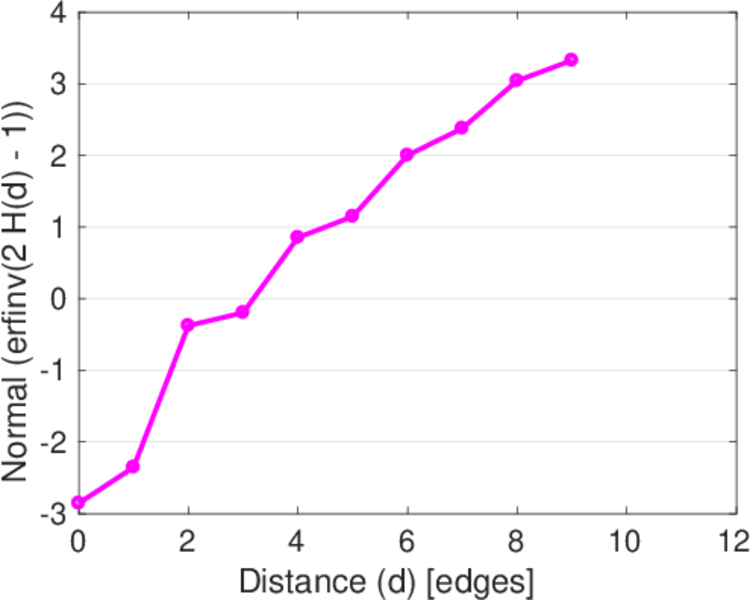
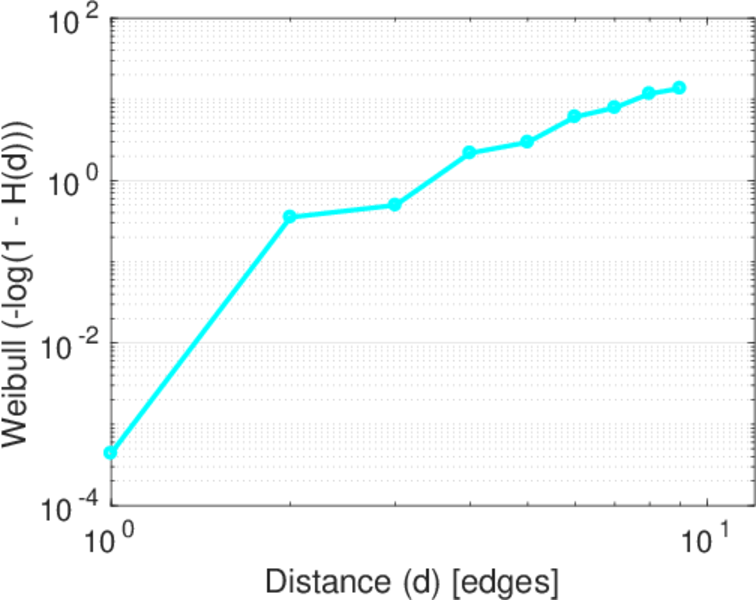
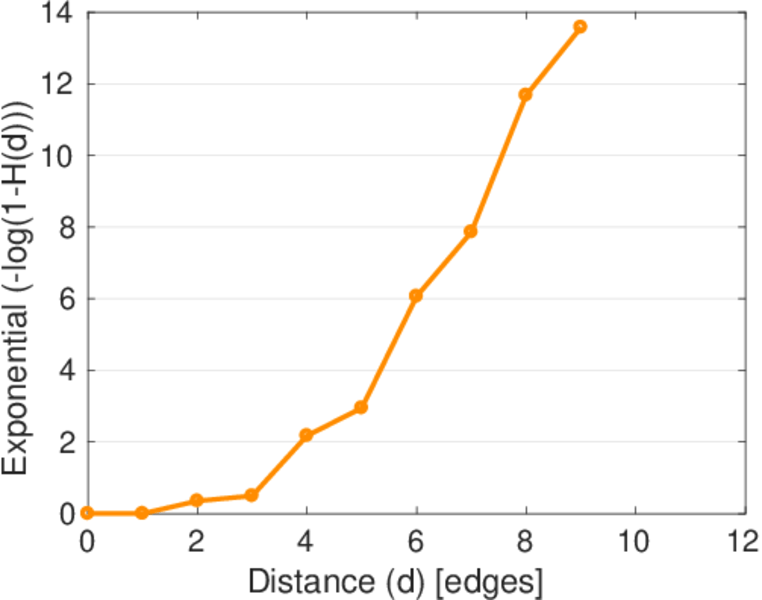
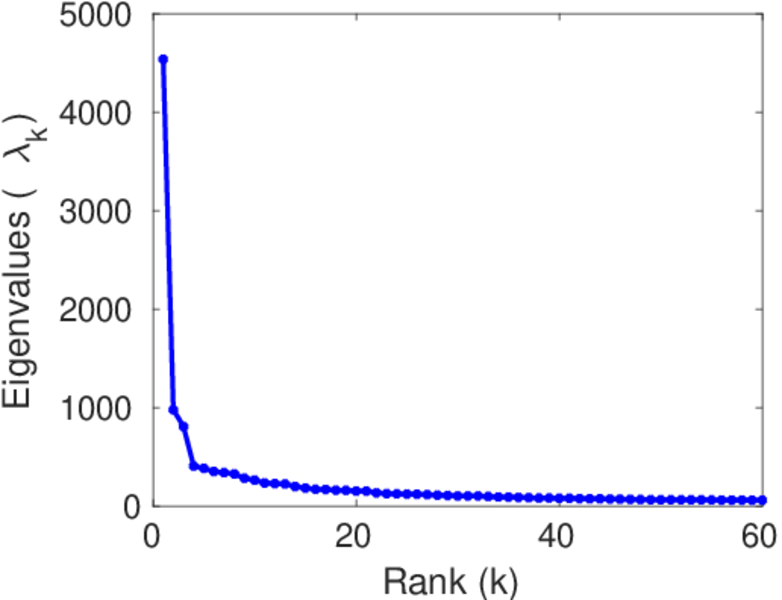
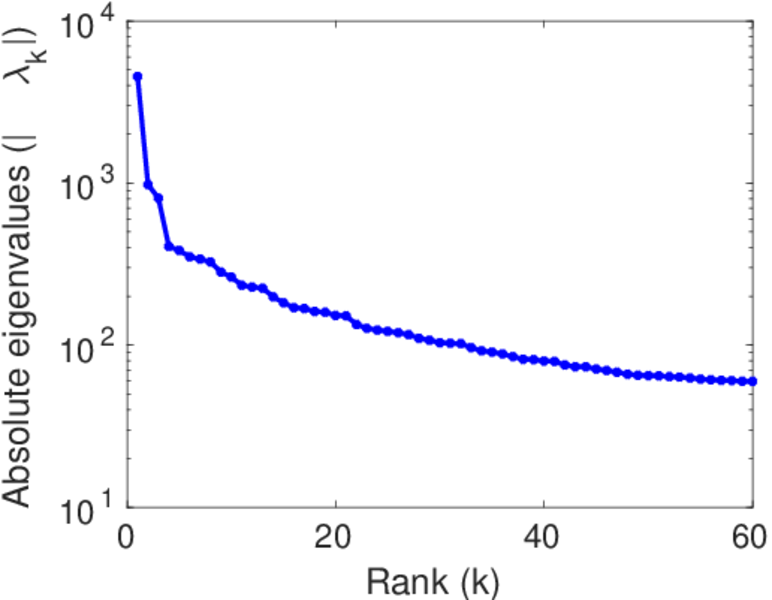
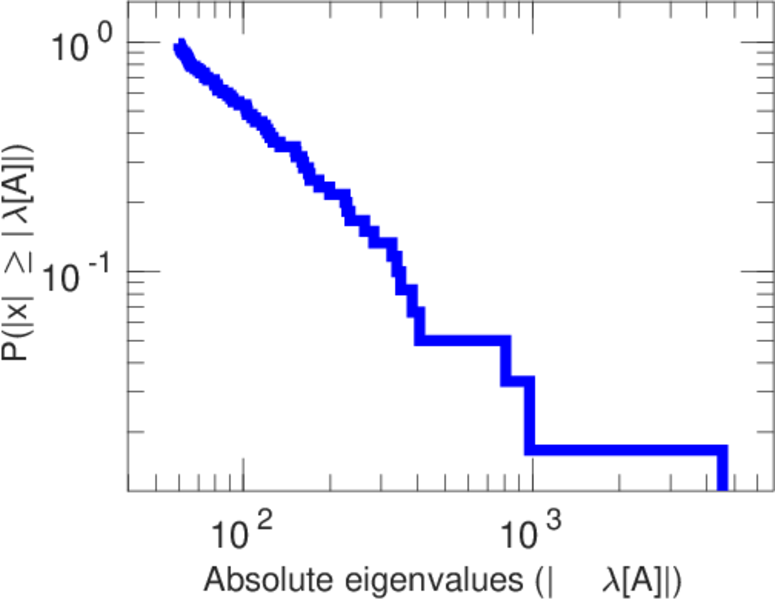
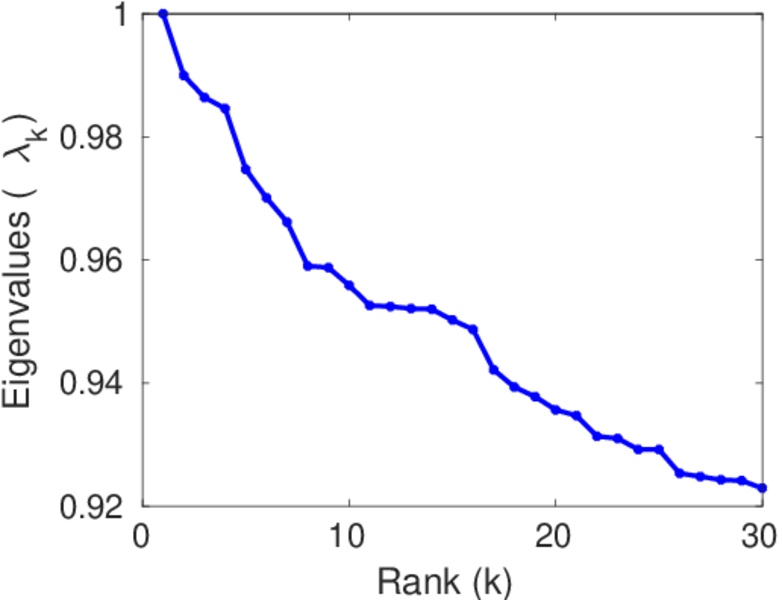
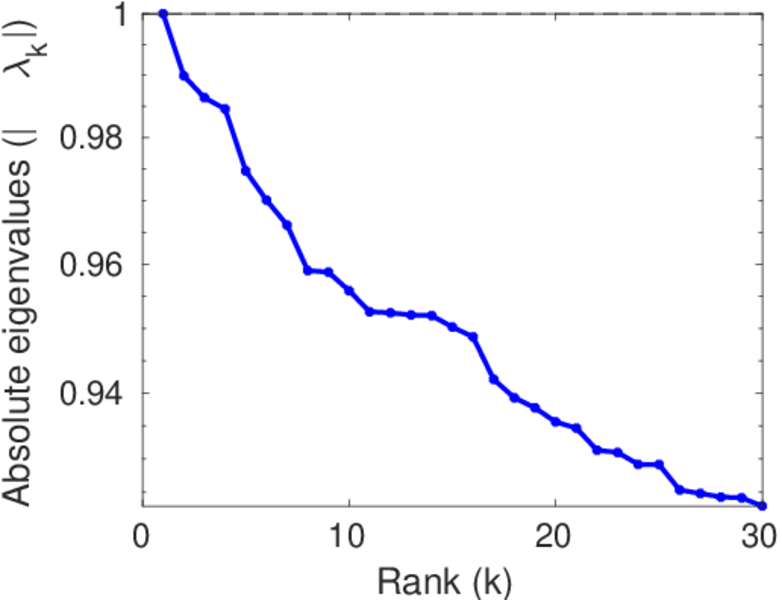
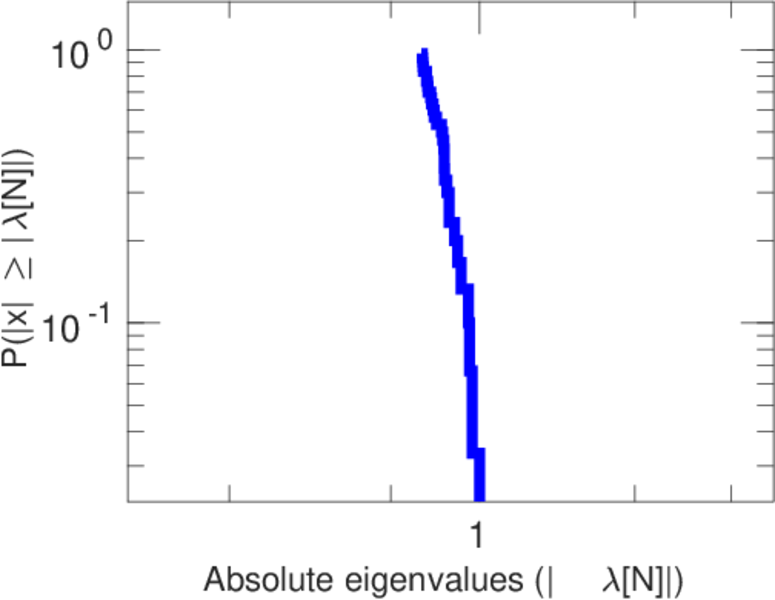
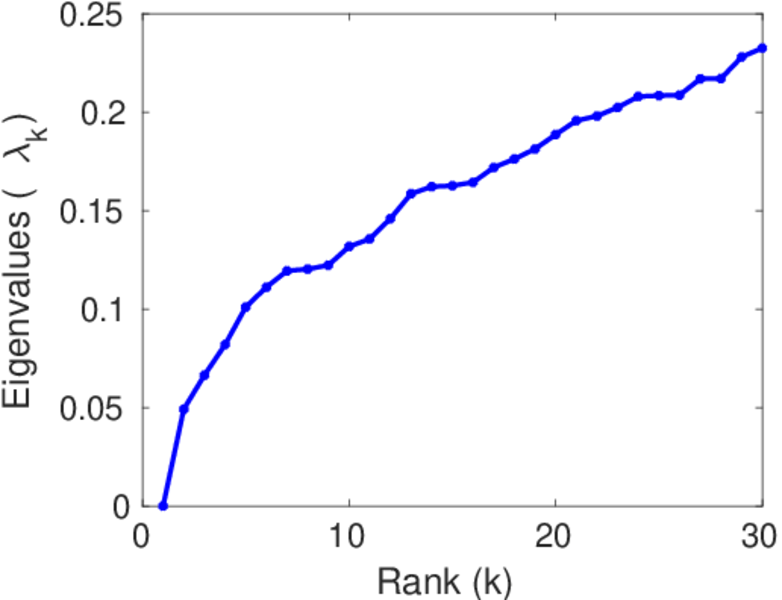
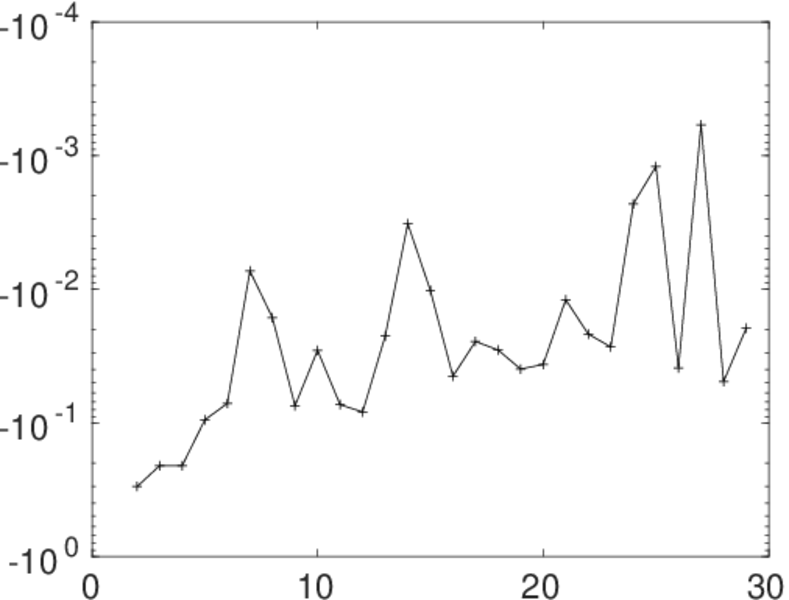
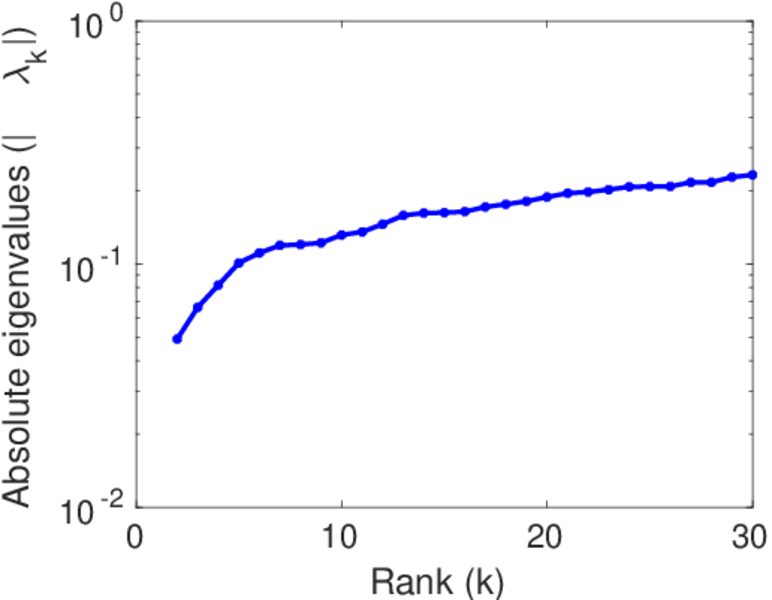
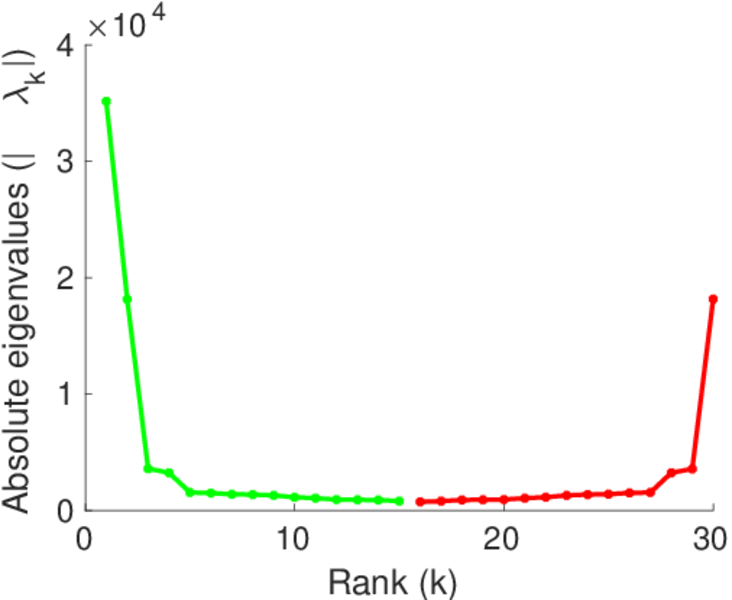
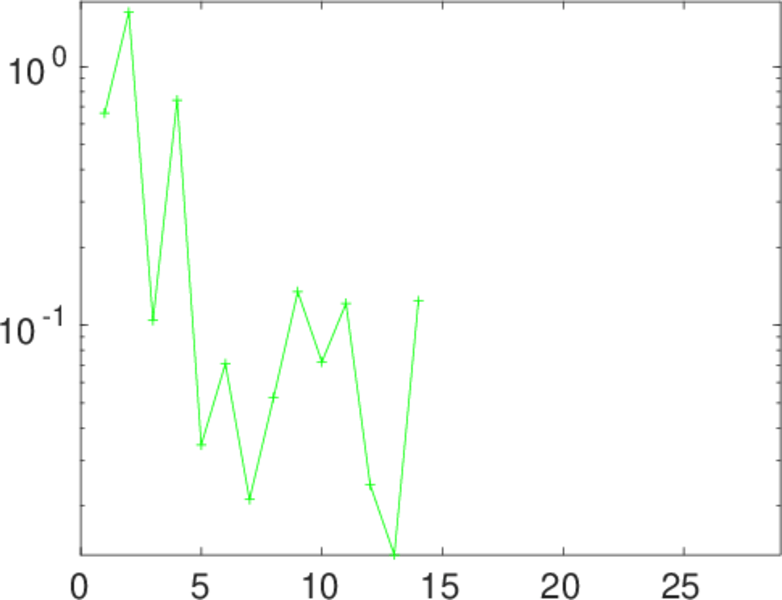
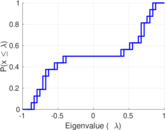
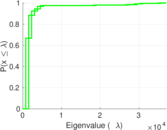
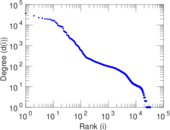
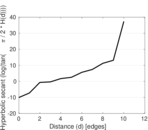
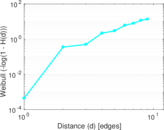
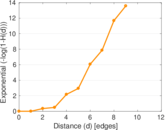
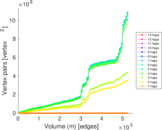
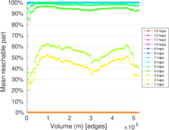
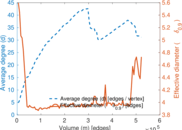
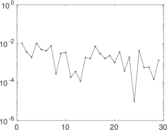
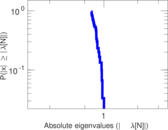
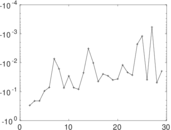
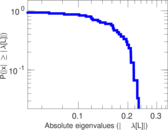
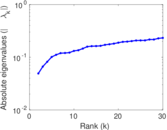
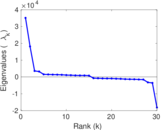
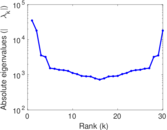
Plots


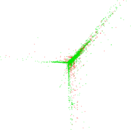


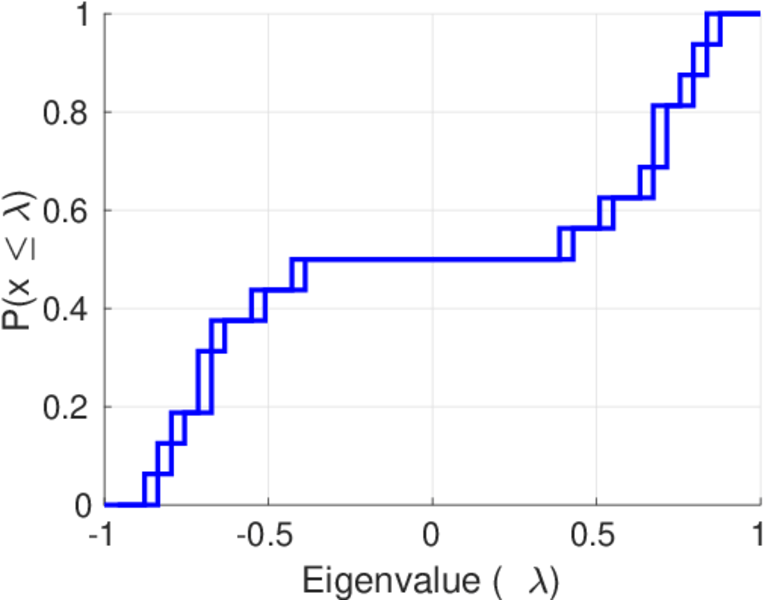
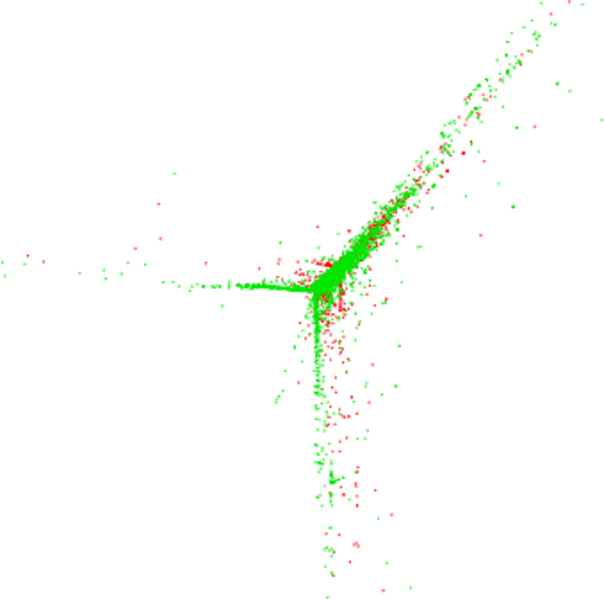
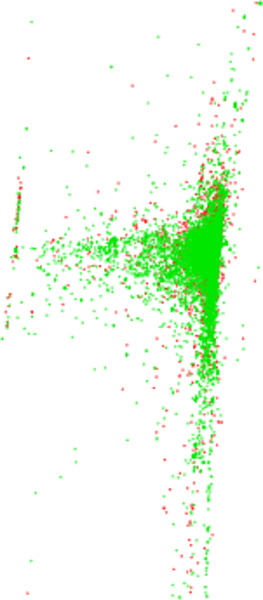
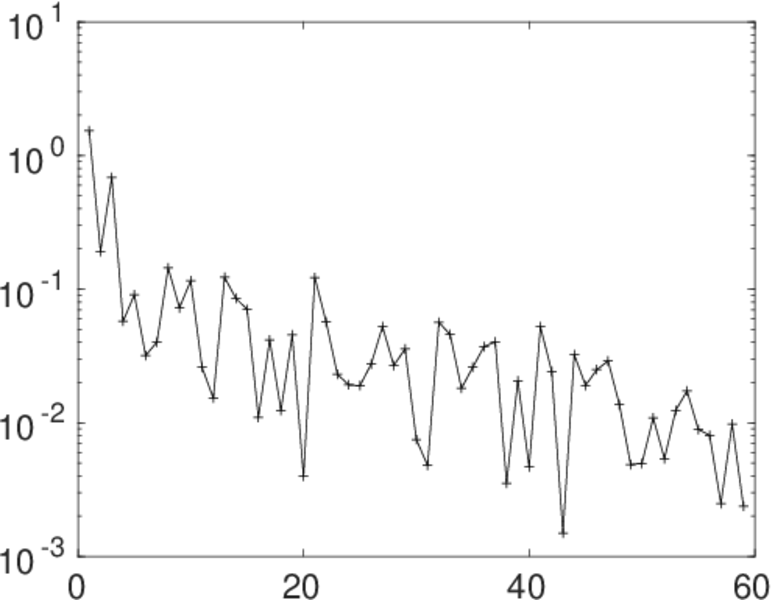
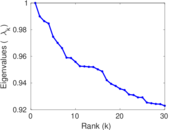
Matrix decompositions plots


Downloads
References
|
[1]
|
Jérôme Kunegis.
KONECT – The Koblenz Network Collection.
In Proc. Int. Conf. on World Wide Web Companion, pages
1343–1350, 2013.
[ http ]
|
|
[2]
|
Wikimedia Foundation.
Wikimedia downloads.
http://dumps.wikimedia.org/, January 2010.
|
 KONECT ‣ Networks ‣
Buy Me a Coffee
KONECT ‣ Networks ‣
Buy Me a Coffee