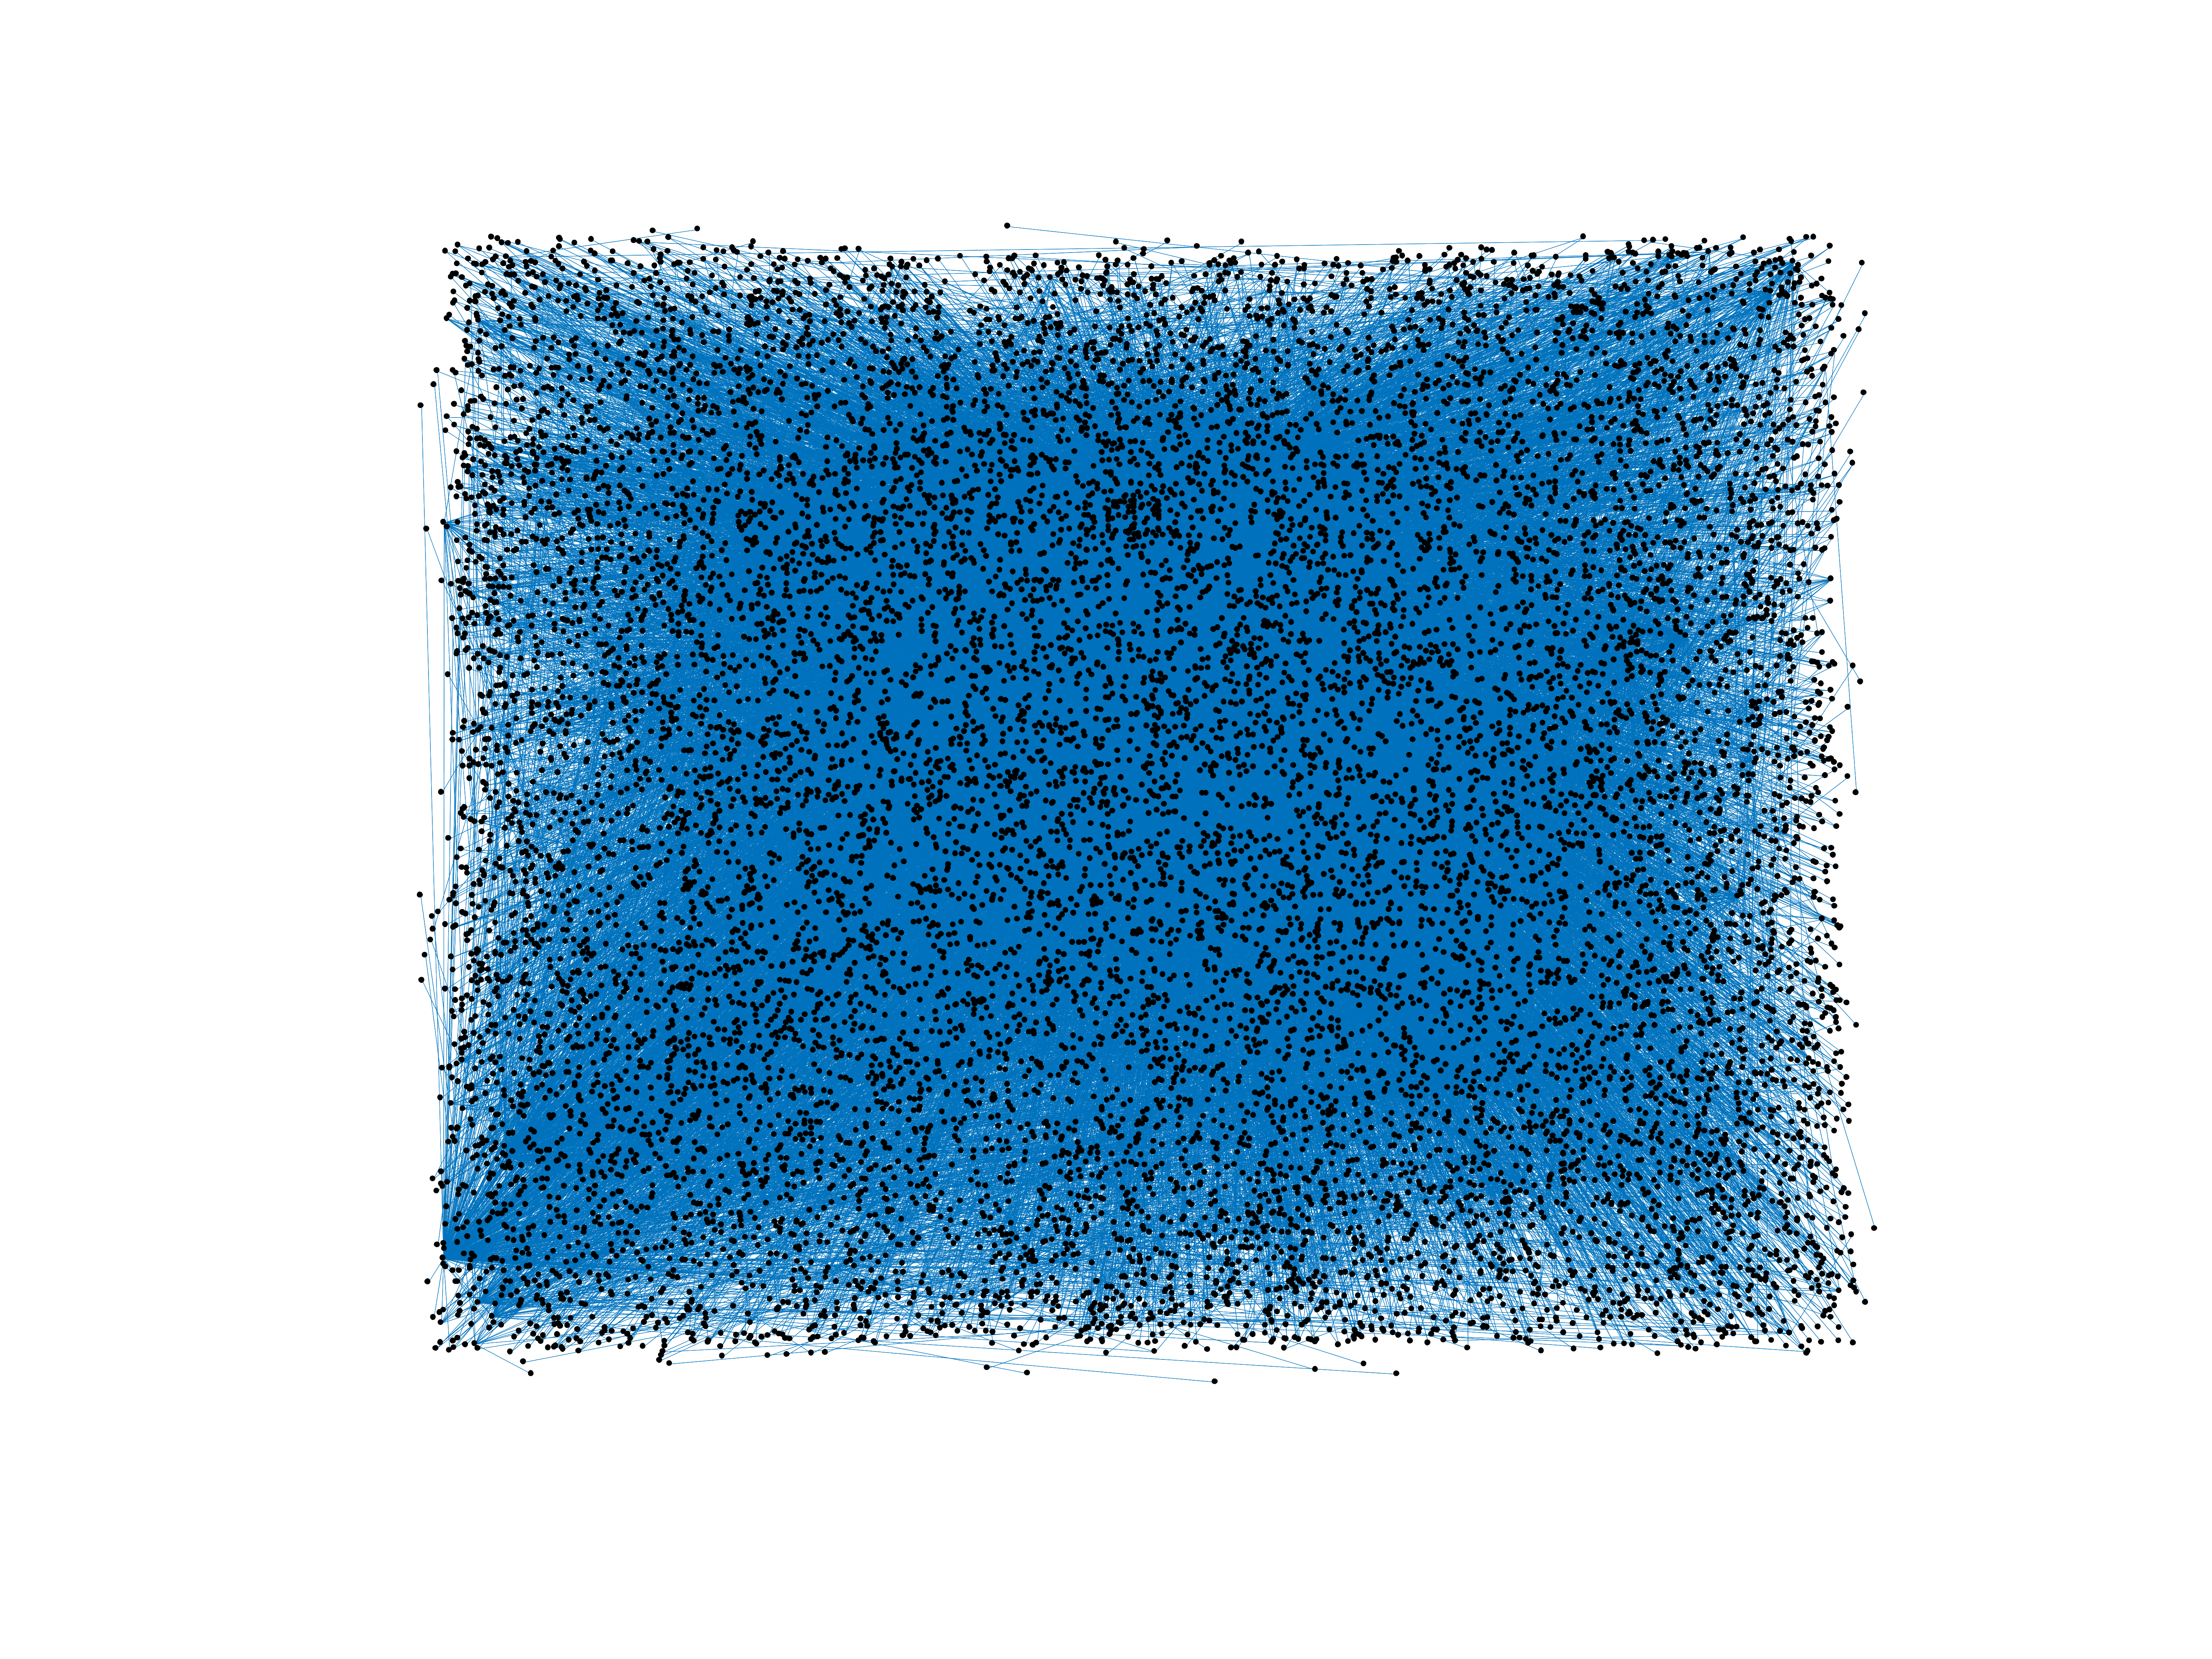
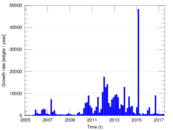
Wikibooks edits (id)
This is the bipartite edit network of the Indonesian Wikibooks. It contains
users and pages from the Indonesian Wikibooks, connected by edit events. Each
edge represents an edit. The dataset includes the timestamp of each edit.
Metadata
Statistics
| Size | n = | 13,841
|
| Left size | n1 = | 1,053
|
| Right size | n2 = | 12,788
|
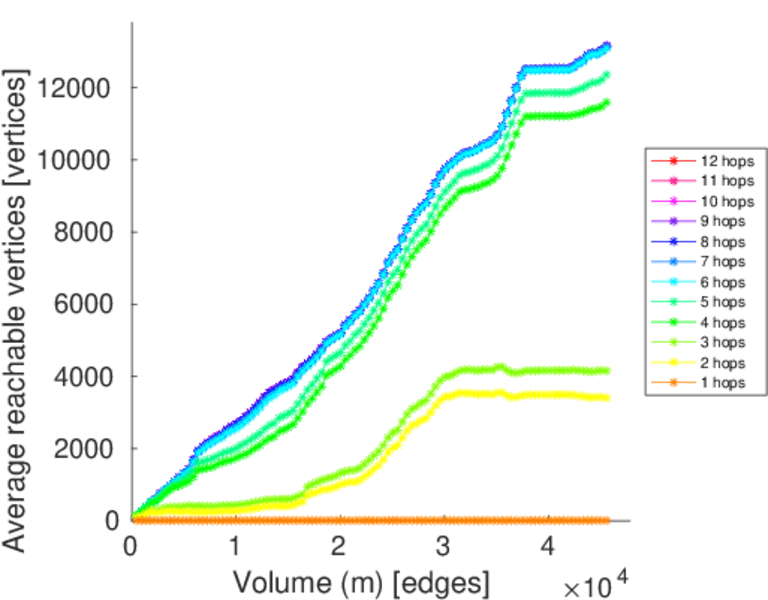
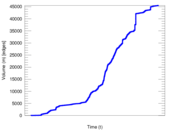
| Volume | m = | 45,536
|
| Unique edge count | m̿ = | 21,906
|
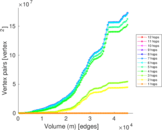
| Wedge count | s = | 25,623,091
|
| Claw count | z = | 38,311,849,164
|
| Cross count | x = | 50,907,227,297,392
|
| Square count | q = | 3,391,146
|
| 4-Tour count | T4 = | 129,667,600
|
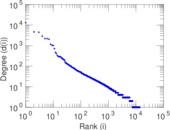
| Maximum degree | dmax = | 13,169
|
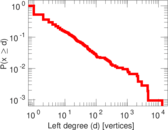
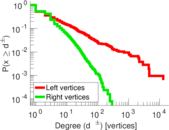
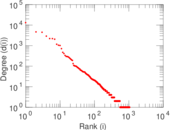
| Maximum left degree | d1max = | 13,169
|
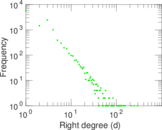
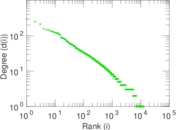
| Maximum right degree | d2max = | 293
|
| Average degree | d = | 6.579 87
|
| Average left degree | d1 = | 43.244 1
|
| Average right degree | d2 = | 3.560 84
|
| Fill | p = | 0.001 626 79
|
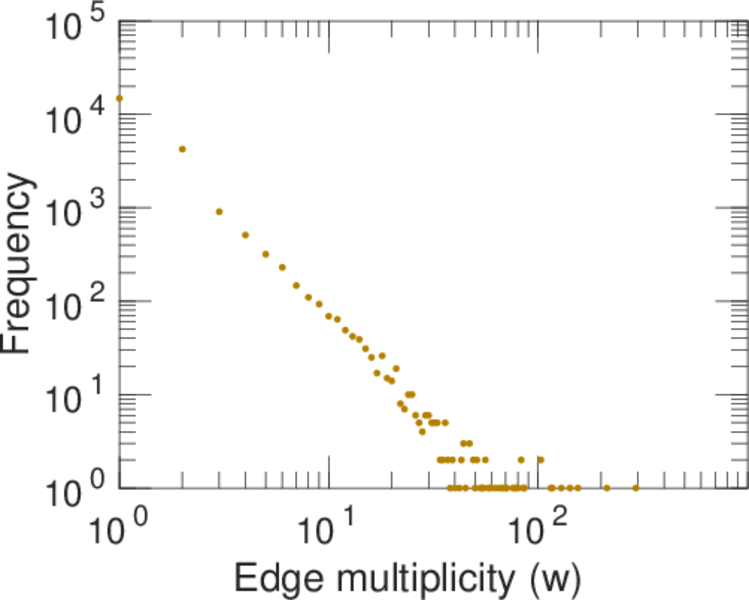
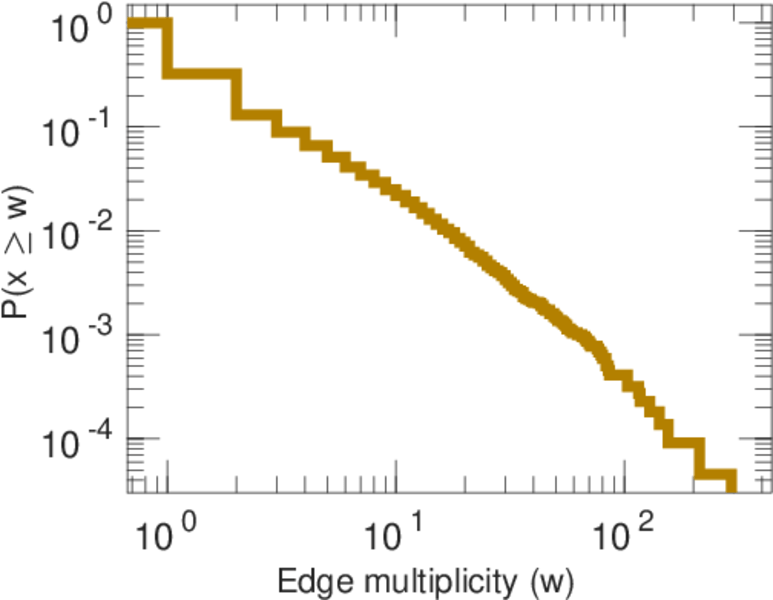
| Average edge multiplicity | m̃ = | 2.078 70
|
| Size of LCC | N = | 13,148
|
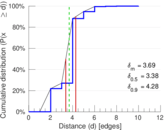
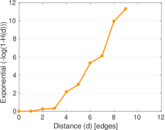
| Diameter | δ = | 11
|
| 50-Percentile effective diameter | δ0.5 = | 3.375 22
|
| 90-Percentile effective diameter | δ0.9 = | 4.279 43
|
| Median distance | δM = | 4
|
| Mean distance | δm = | 3.687 20
|
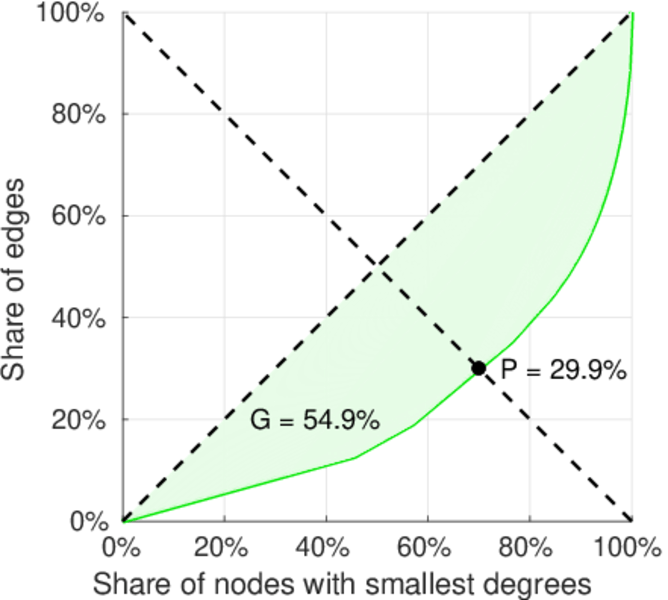
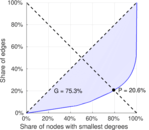
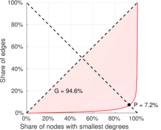
| Gini coefficient | G = | 0.760 812
|
| Balanced inequality ratio | P = | 0.202 071
|
| Left balanced inequality ratio | P1 = | 0.072 118 8
|
| Right balanced inequality ratio | P2 = | 0.298 884
|
| Relative edge distribution entropy | Her = | 0.735 835
|
| Power law exponent | γ = | 3.428 67
|
| Tail power law exponent | γt = | 3.071 00
|
| Tail power law exponent with p | γ3 = | 3.071 00
|
| p-value | p = | 0.000 00
|
| Left tail power law exponent with p | γ3,1 = | 1.751 00
|
| Left p-value | p1 = | 0.537 000
|
| Right tail power law exponent with p | γ3,2 = | 3.701 00
|
| Right p-value | p2 = | 0.827 000
|
| Degree assortativity | ρ = | −0.201 198
|
| Degree assortativity p-value | pρ = | 7.580 40 × 10−199
|
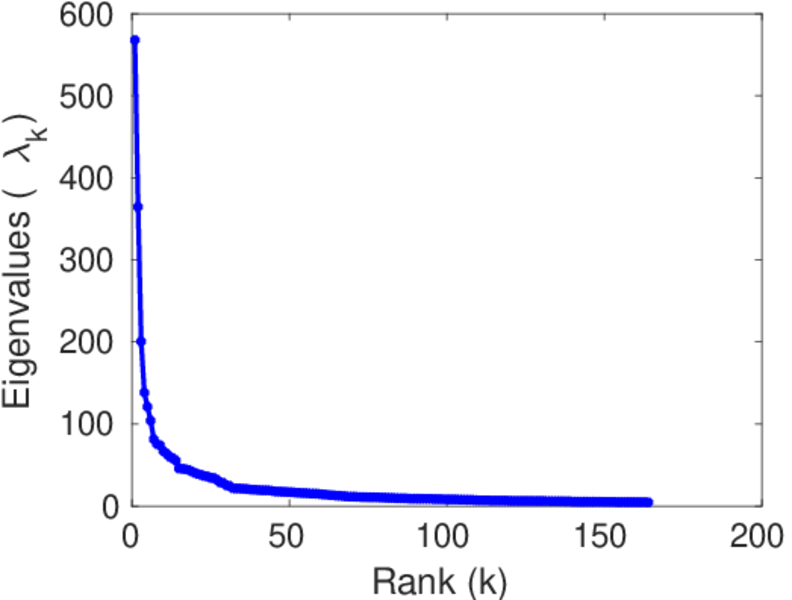
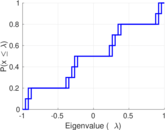
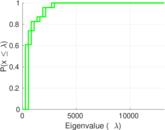
| Spectral norm | α = | 567.852
|
| Algebraic connectivity | a = | 0.049 221 7
|
| Spectral separation | |λ1[A] / λ2[A]| = | 1.557 81
|
| Controllability | C = | 11,902
|
| Relative controllability | Cr = | 0.867 366
|
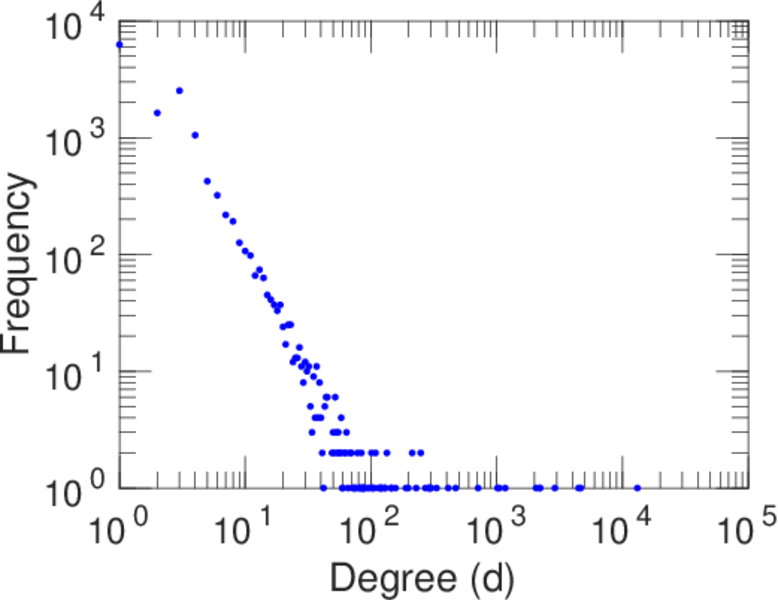
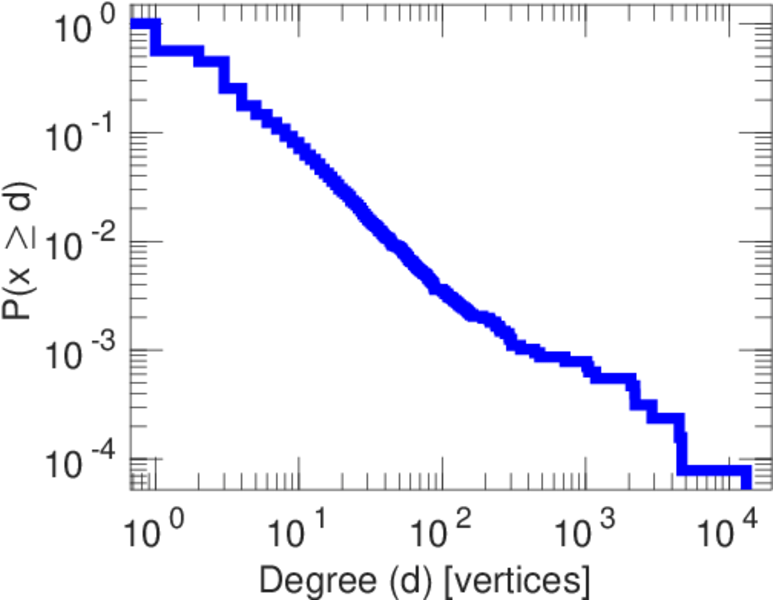
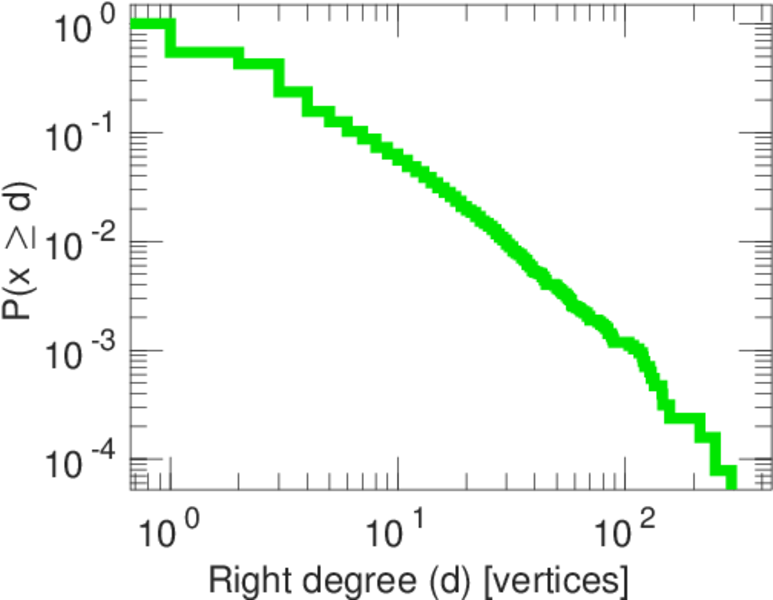
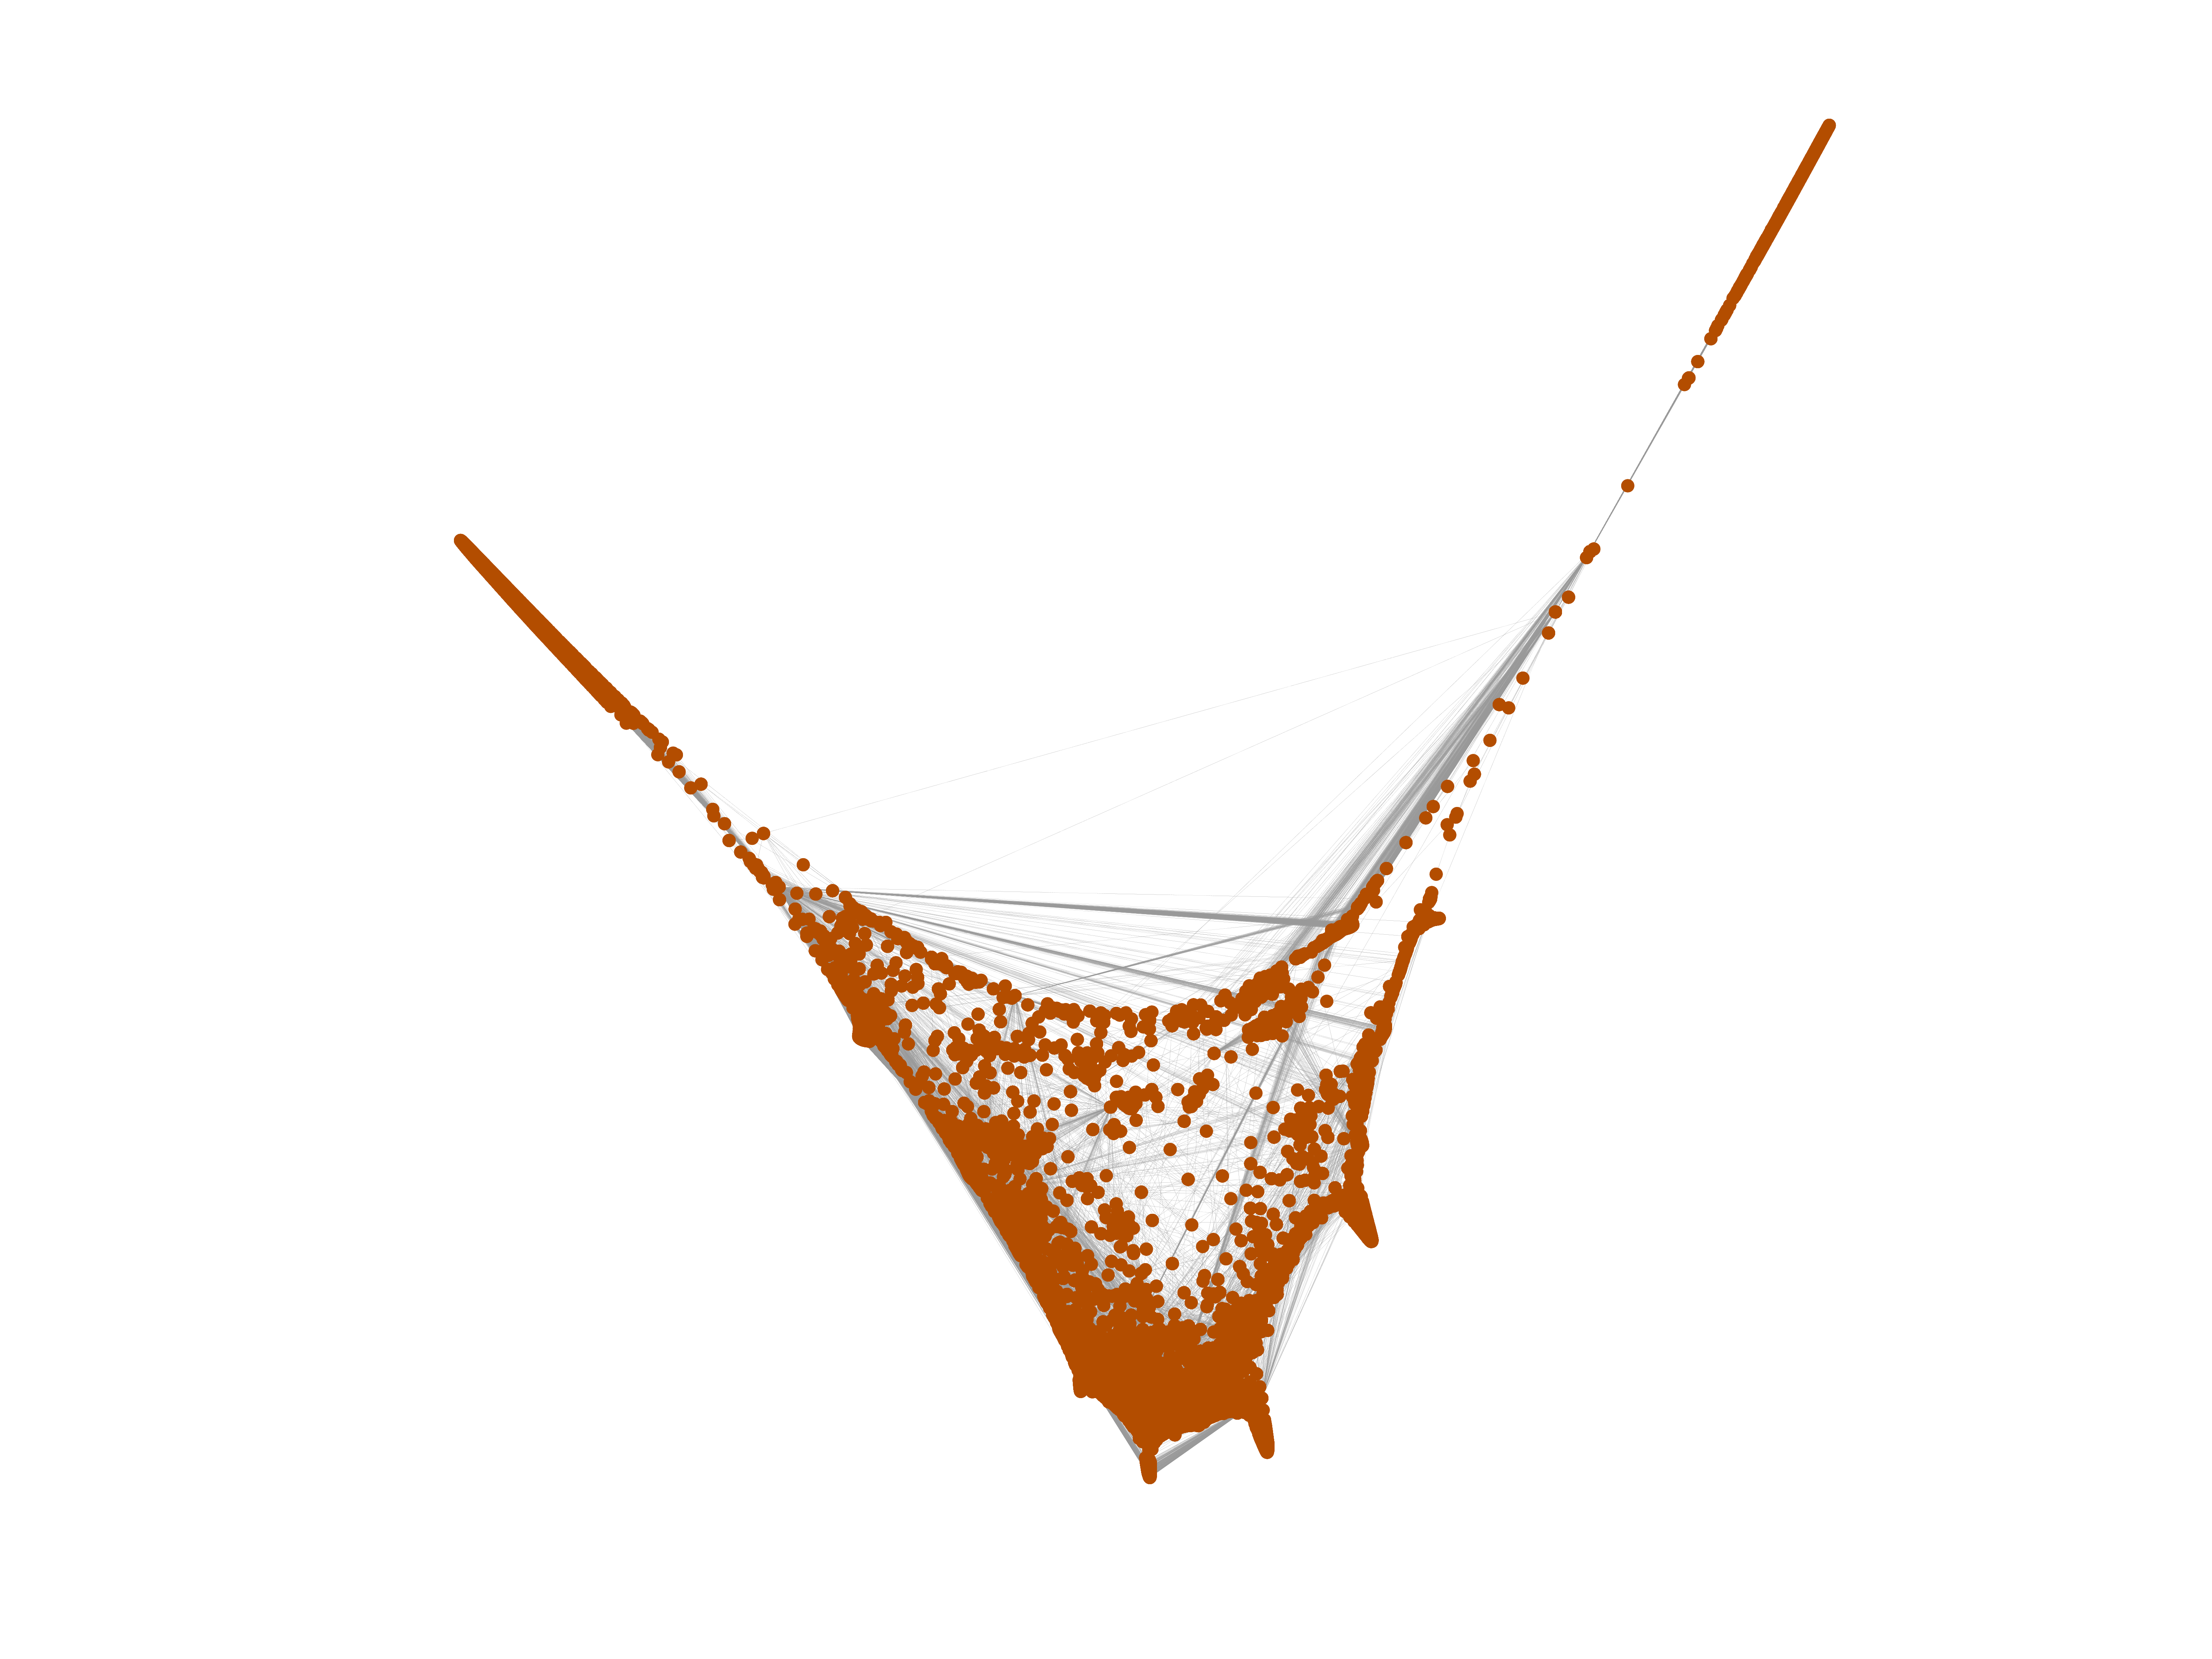
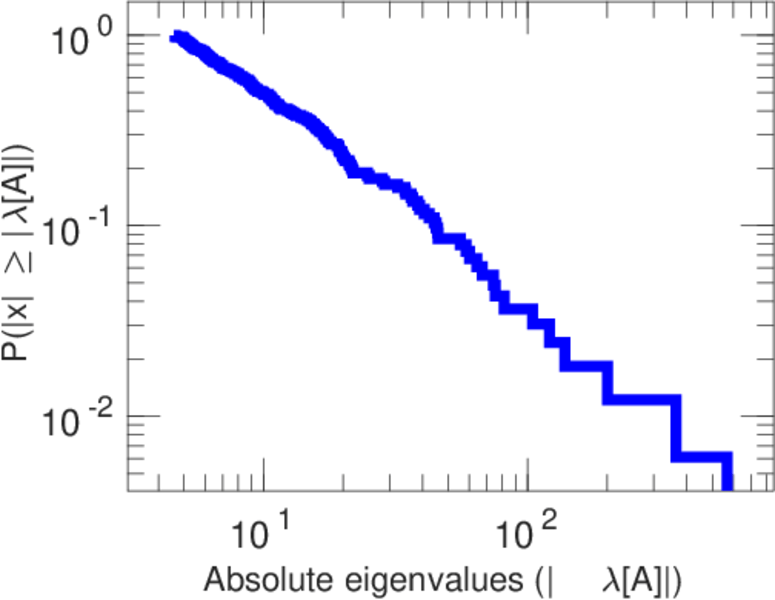
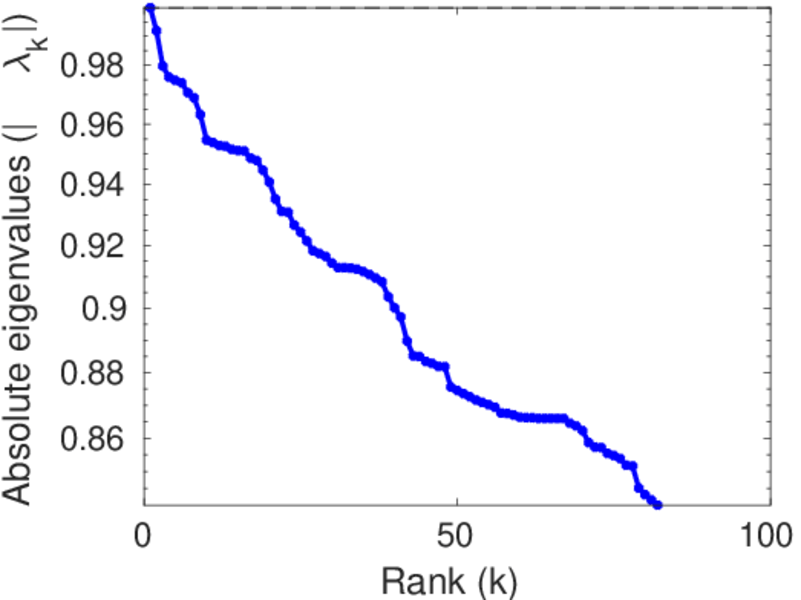
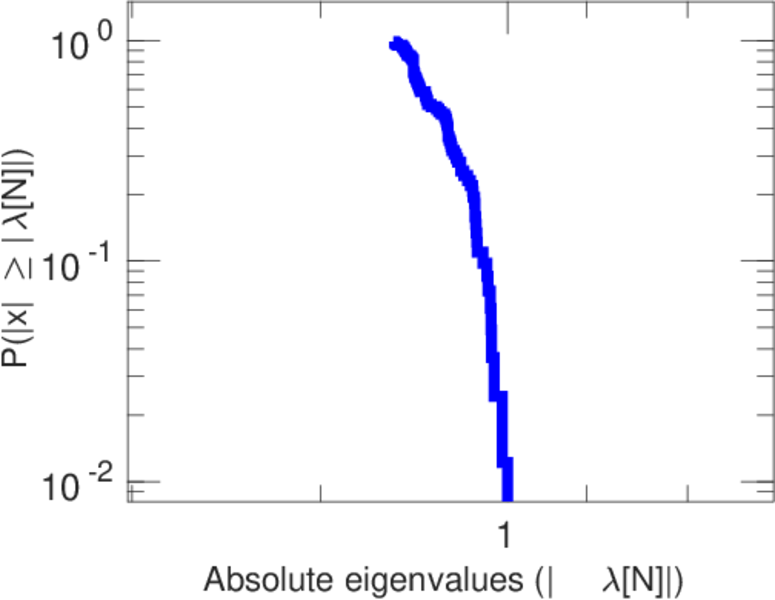
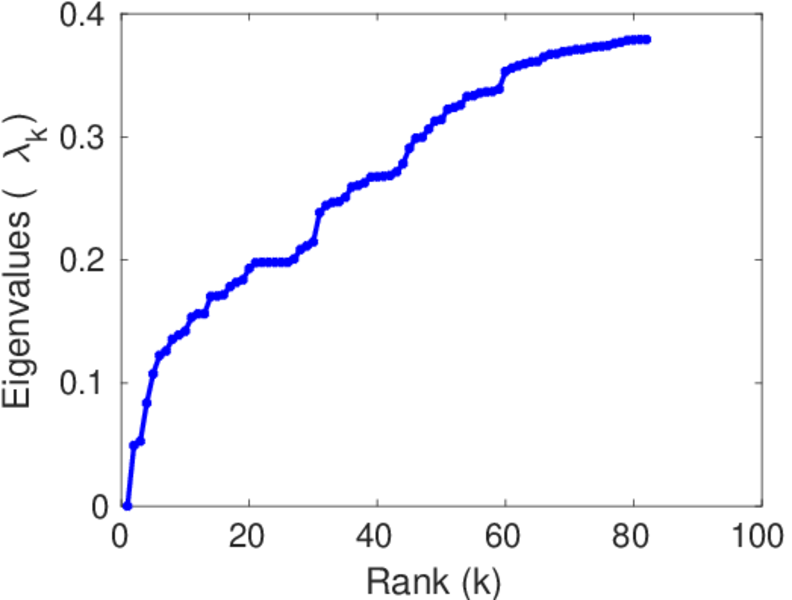
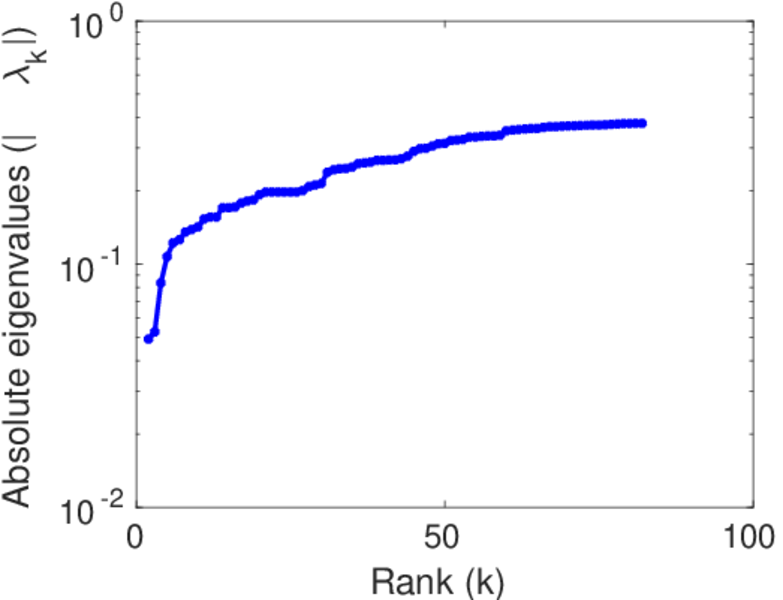
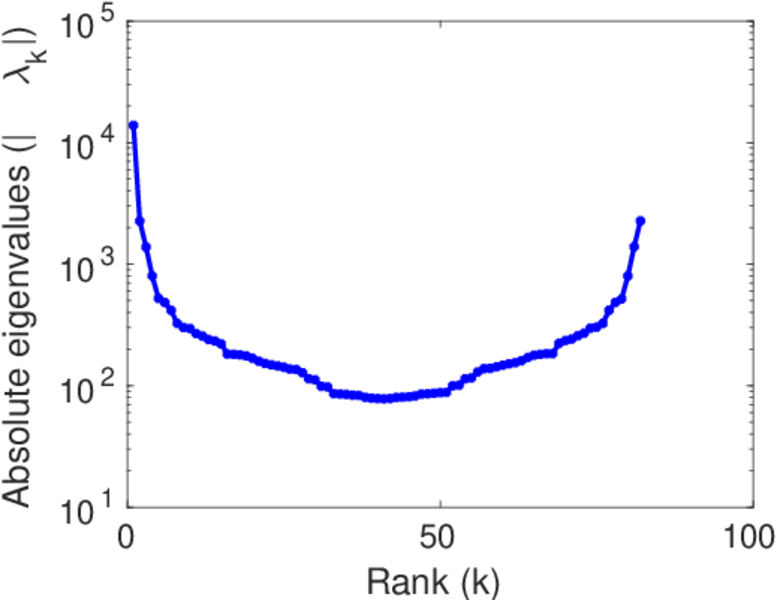
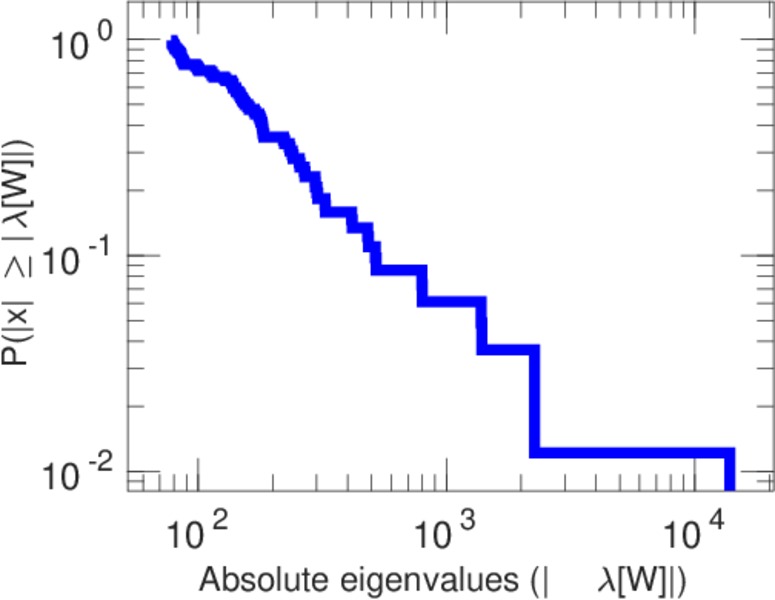
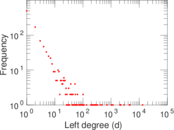
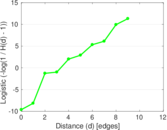
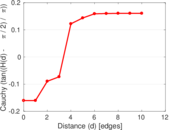
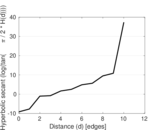
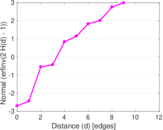
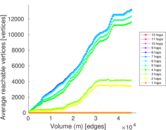
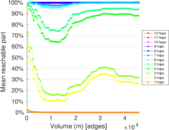
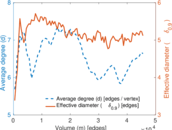
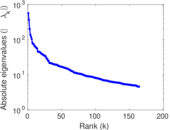
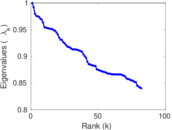
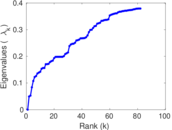
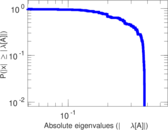
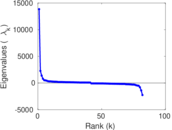
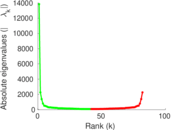
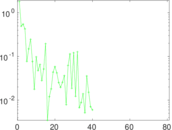
Plots


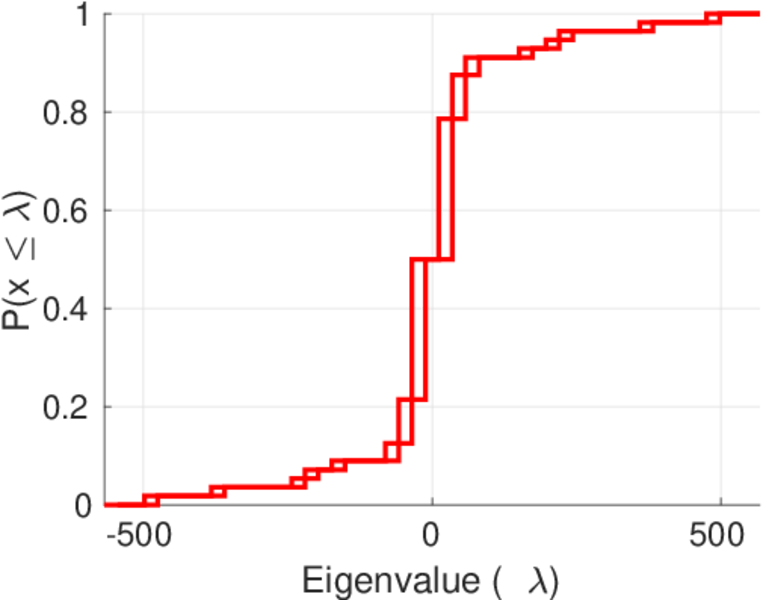
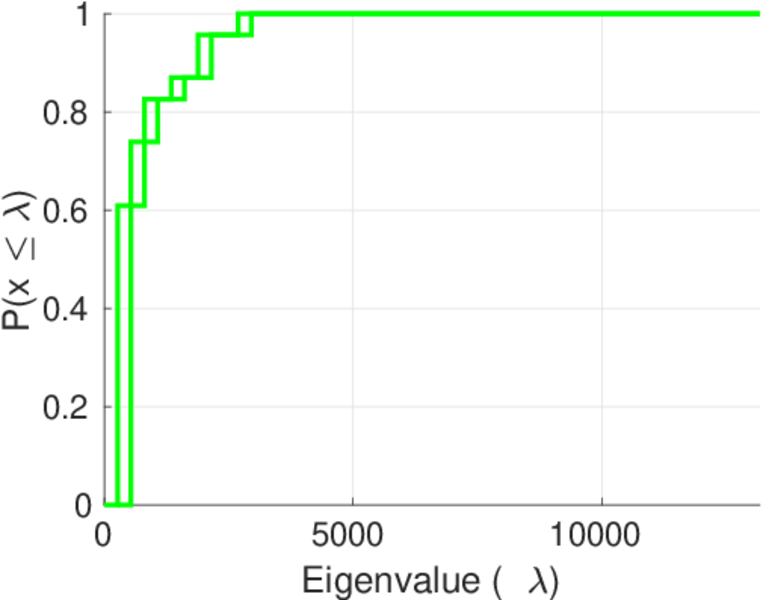
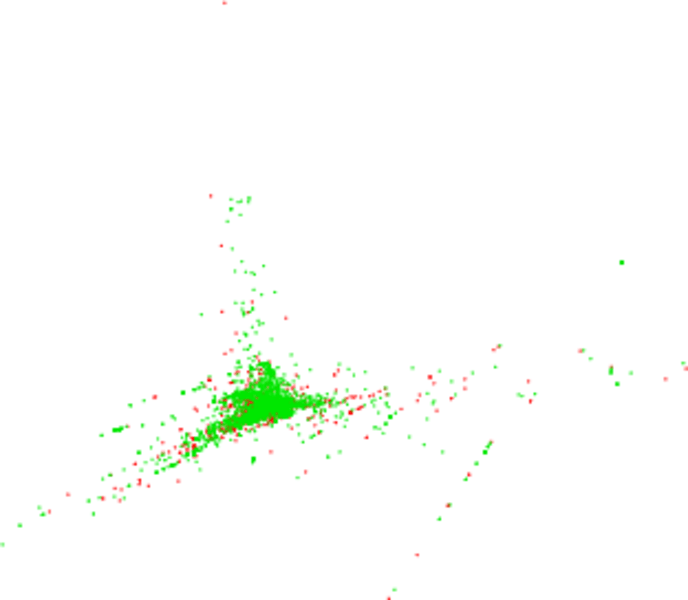
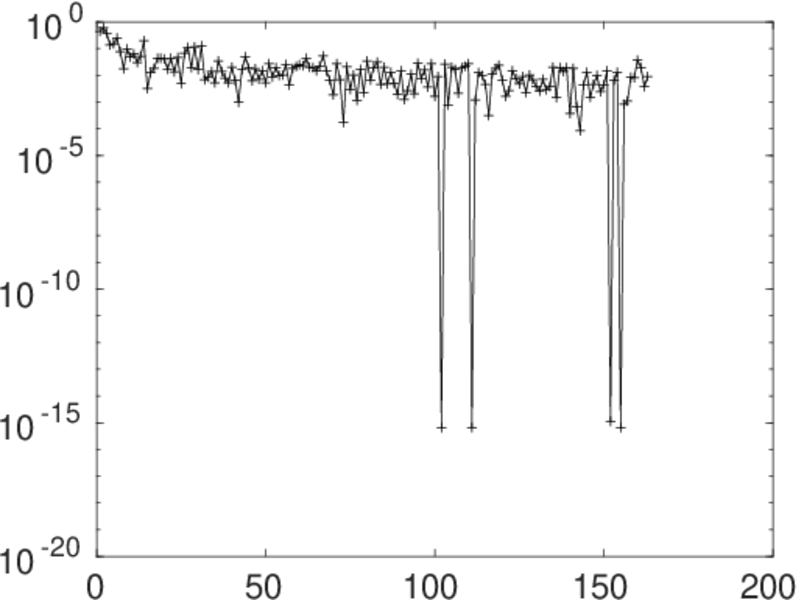
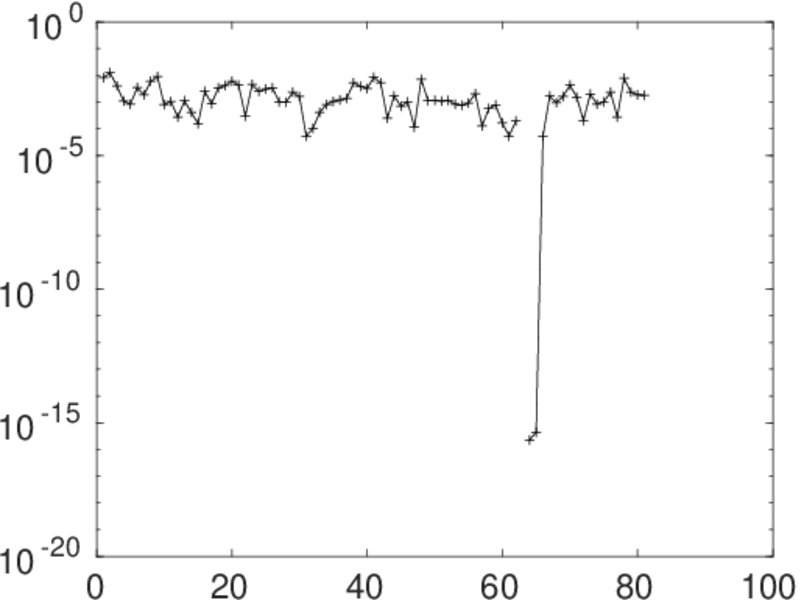
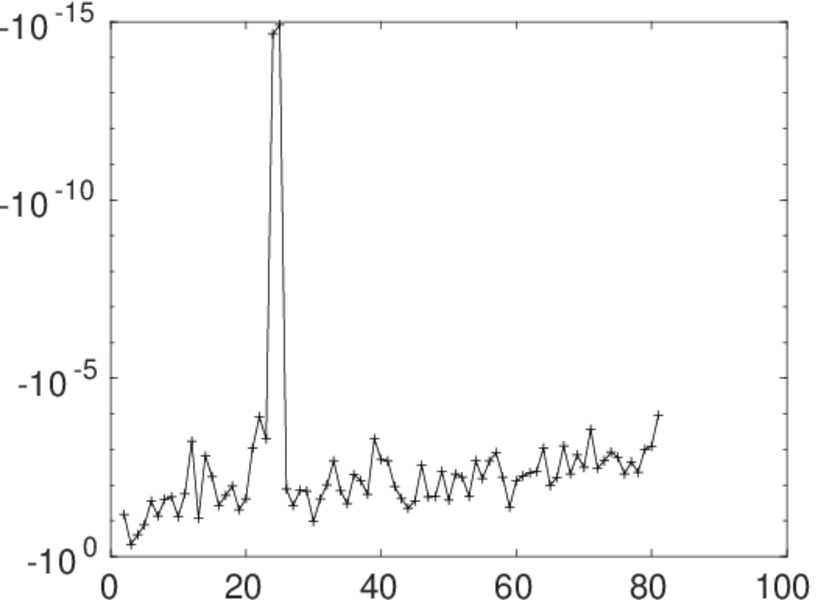
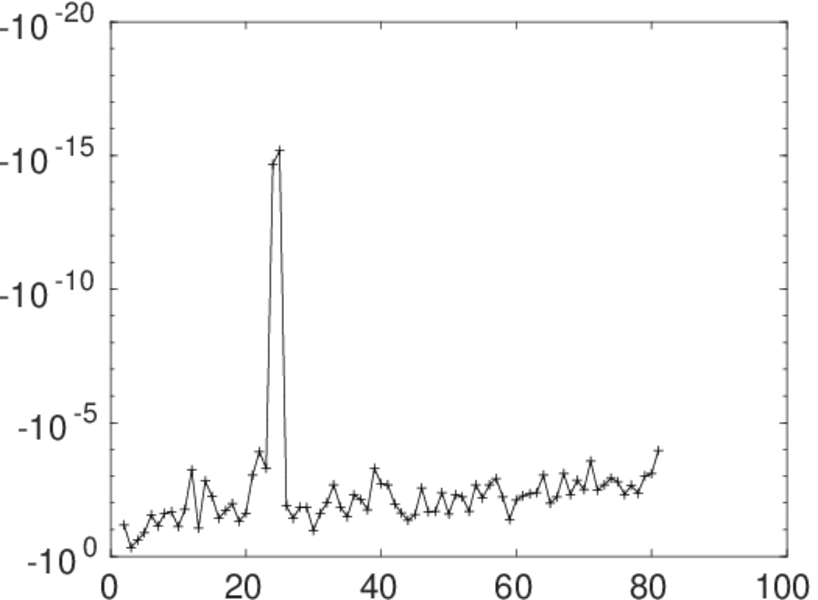
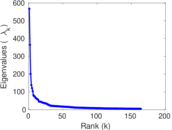
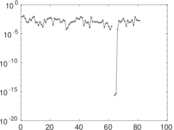
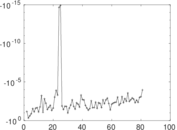
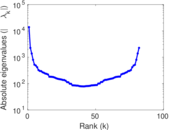
Matrix decompositions plots


Downloads
References
|
[1]
|
Jérôme Kunegis.
KONECT – The Koblenz Network Collection.
In Proc. Int. Conf. on World Wide Web Companion, pages
1343–1350, 2013.
[ http ]
|
|
[2]
|
Wikimedia Foundation.
Wikimedia downloads.
http://dumps.wikimedia.org/, January 2010.
|
 KONECT ‣ Networks ‣
Buy Me a Coffee
KONECT ‣ Networks ‣
Buy Me a Coffee