Wikipedia edits (ie)
This is the bipartite edit network of the Interlingue Wikipedia. It contains
users and pages from the Interlingue Wikipedia, connected by edit events. Each
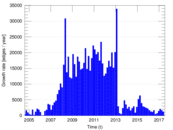
edge represents an edit. The dataset includes the timestamp of each edit.
Metadata
Statistics
| Size | n = | 6,974
|
| Left size | n1 = | 1,039
|
| Right size | n2 = | 5,935
|
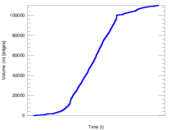
| Volume | m = | 109,987
|
| Unique edge count | m̿ = | 48,002
|
| Wedge count | s = | 21,127,781
|
| Claw count | z = | 9,695,832,392
|
| Cross count | x = | 4,163,833,986,859
|
| Square count | q = | 89,028,628
|
| 4-Tour count | T4 = | 796,933,252
|
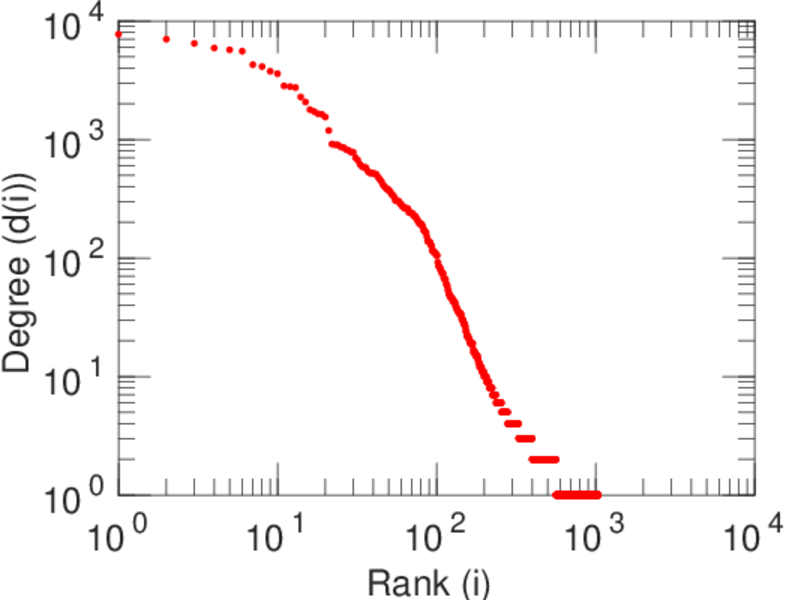
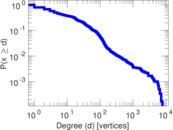
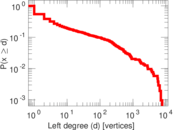
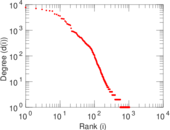
| Maximum degree | dmax = | 7,727
|
| Maximum left degree | d1max = | 7,727
|
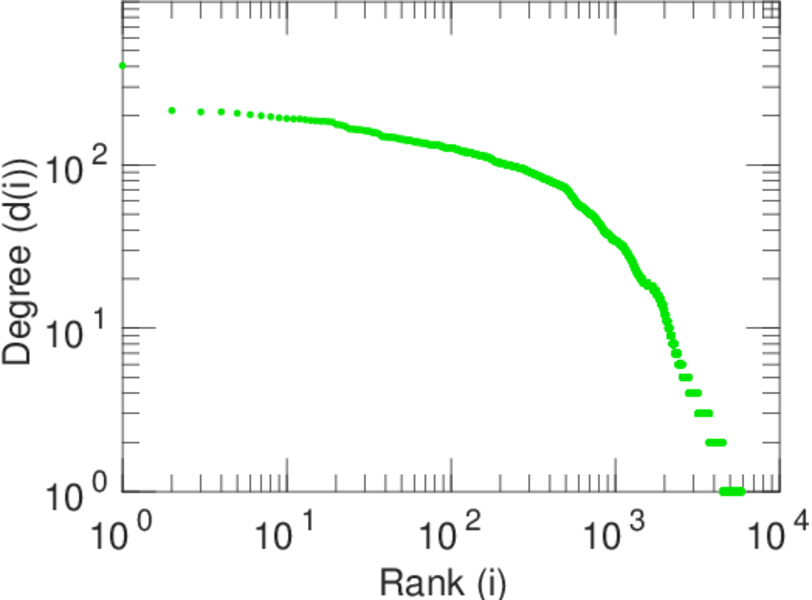
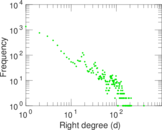
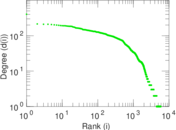
| Maximum right degree | d2max = | 405
|
| Average degree | d = | 31.542 0
|
| Average left degree | d1 = | 105.859
|
| Average right degree | d2 = | 18.531 9
|
| Fill | p = | 0.007 784 36
|
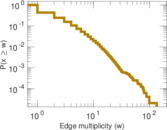
| Average edge multiplicity | m̃ = | 2.291 30
|
| Size of LCC | N = | 6,338
|
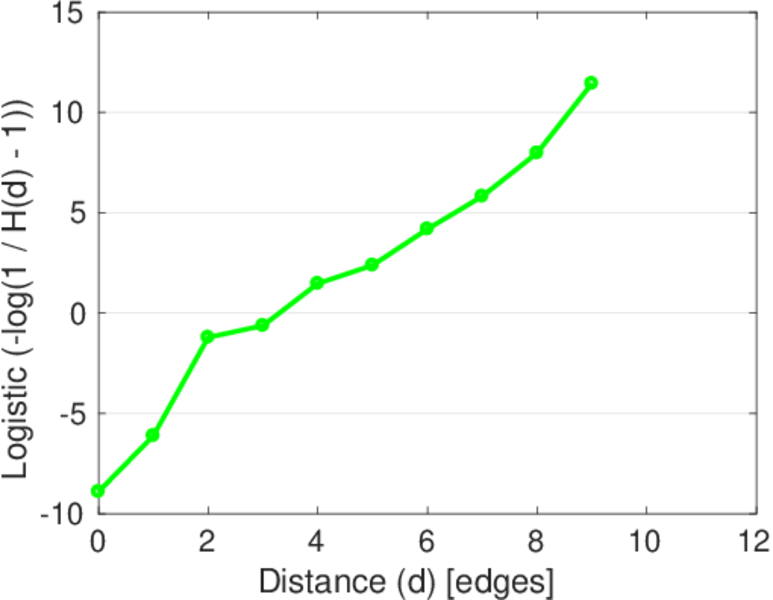
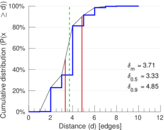
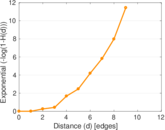
| Diameter | δ = | 12
|
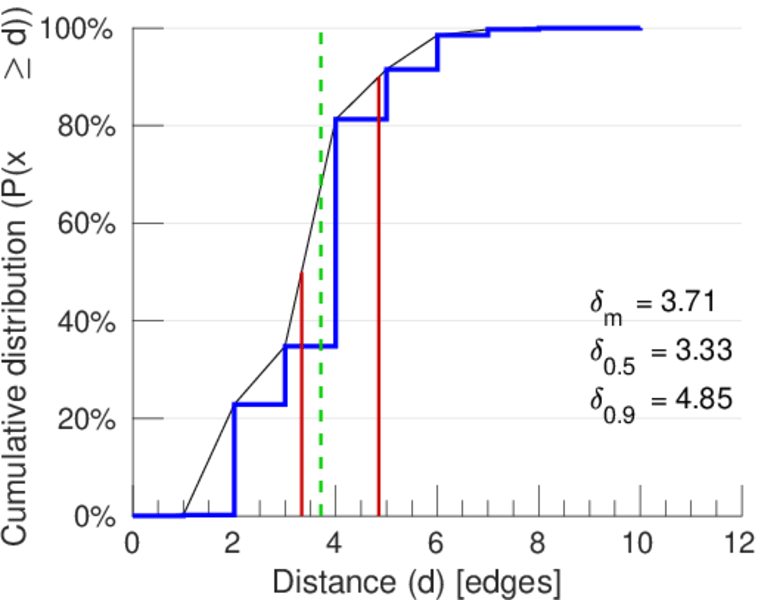
| 50-Percentile effective diameter | δ0.5 = | 3.327 33
|
| 90-Percentile effective diameter | δ0.9 = | 4.850 52
|
| Median distance | δM = | 4
|
| Mean distance | δm = | 3.711 57
|
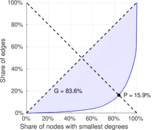
| Gini coefficient | G = | 0.833 158
|
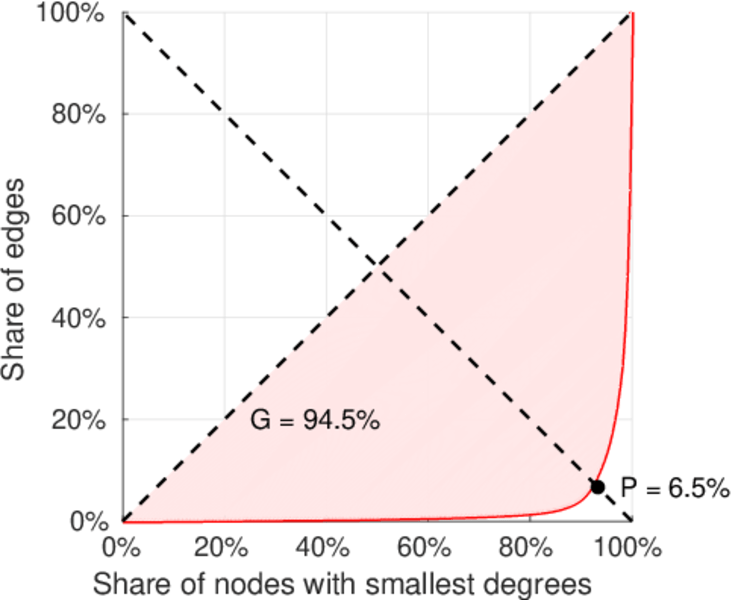
| Balanced inequality ratio | P = | 0.165 520
|
| Left balanced inequality ratio | P1 = | 0.065 298 6
|
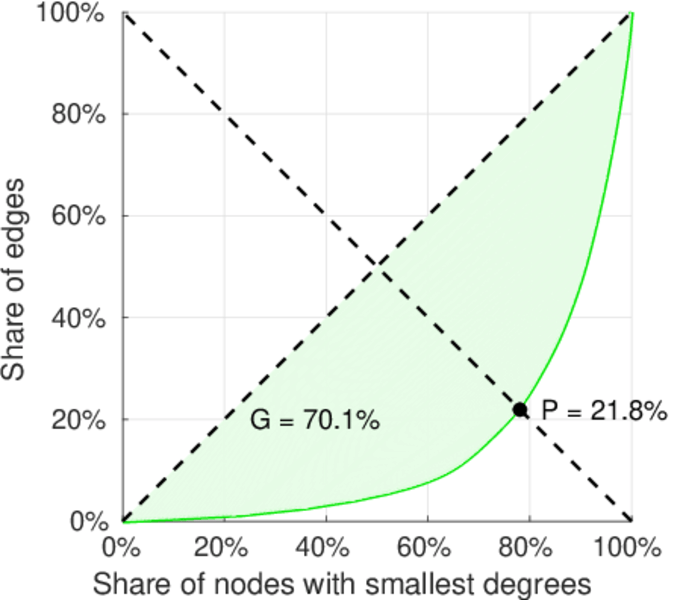
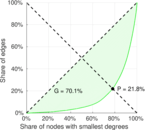
| Right balanced inequality ratio | P2 = | 0.217 689
|
| Relative edge distribution entropy | Her = | 0.786 228
|
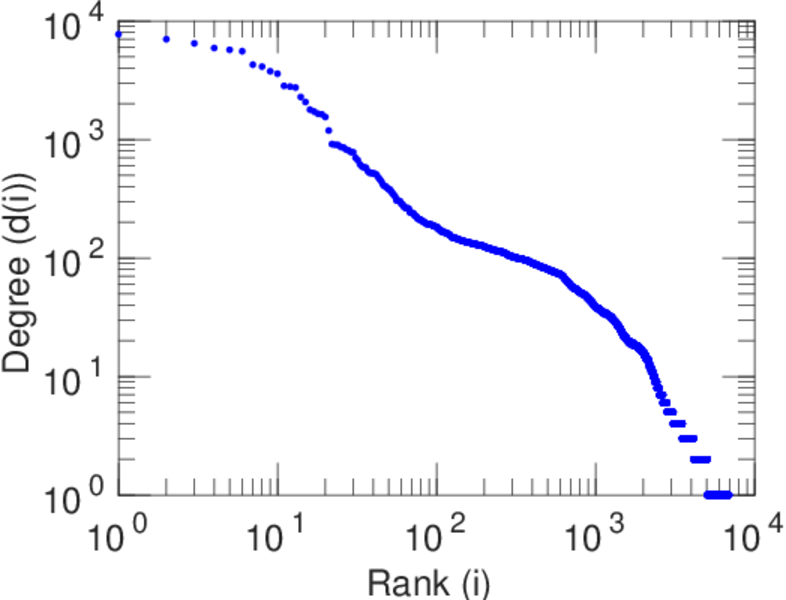
| Power law exponent | γ = | 1.851 35
|
| Tail power law exponent | γt = | 2.241 00
|
| Tail power law exponent with p | γ3 = | 2.241 00
|
| p-value | p = | 0.000 00
|
| Left tail power law exponent with p | γ3,1 = | 1.641 00
|
| Left p-value | p1 = | 0.000 00
|
| Right tail power law exponent with p | γ3,2 = | 8.911 00
|
| Right p-value | p2 = | 0.070 000 0
|
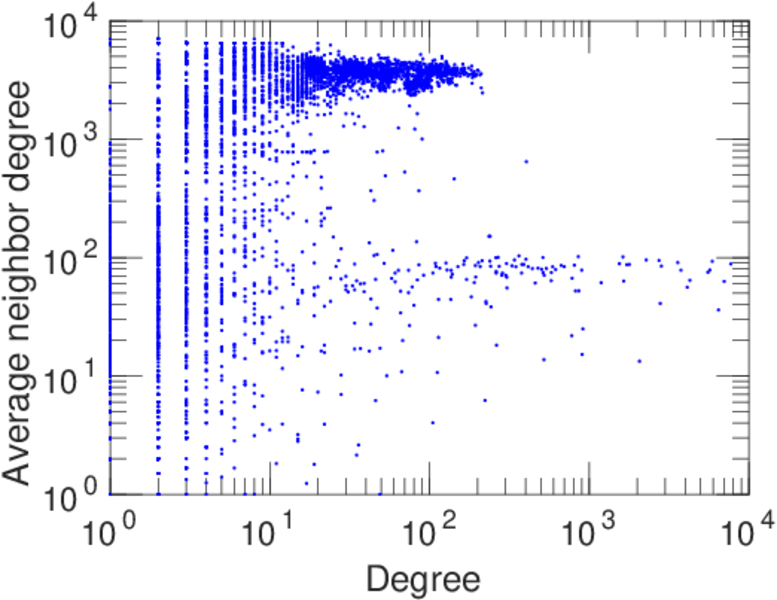
| Degree assortativity | ρ = | −0.161 218
|
| Degree assortativity p-value | pρ = | 7.260 96 × 10−277
|
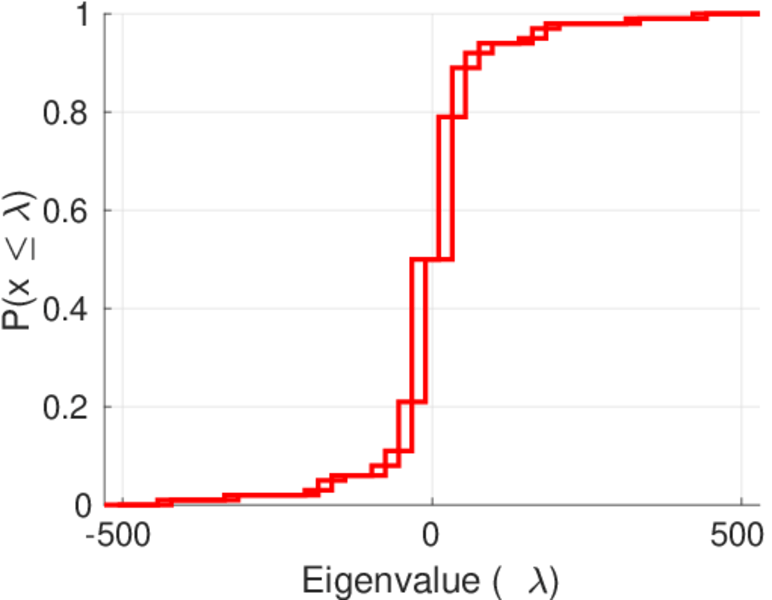
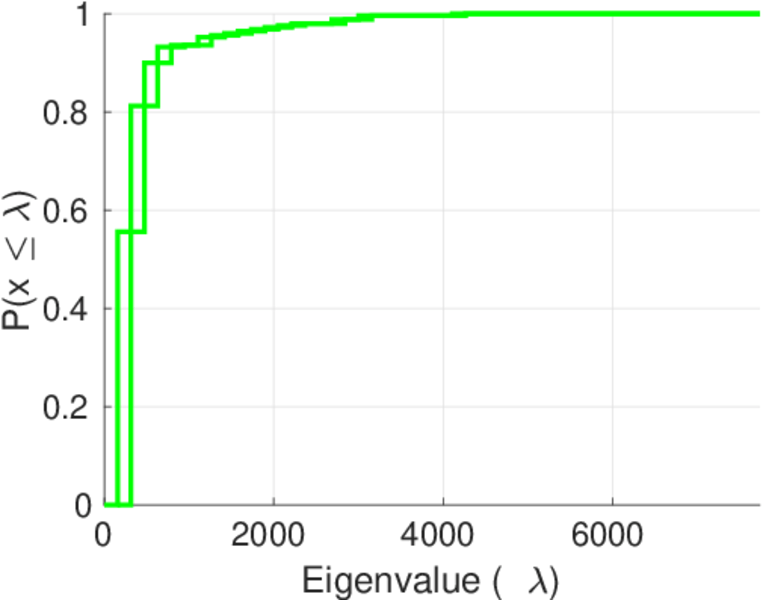
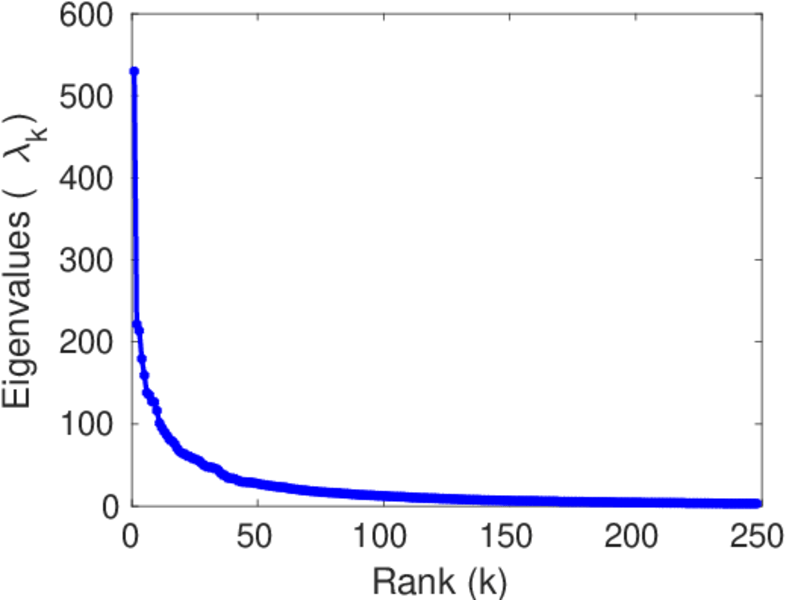
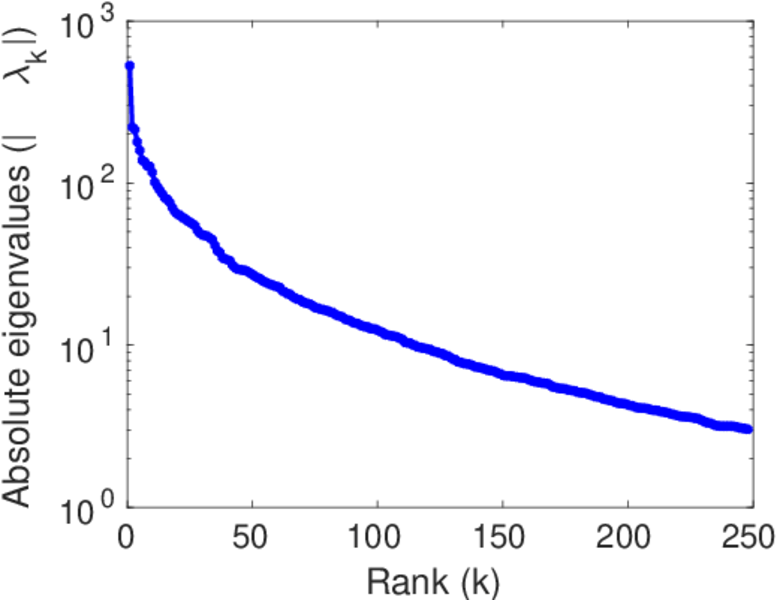
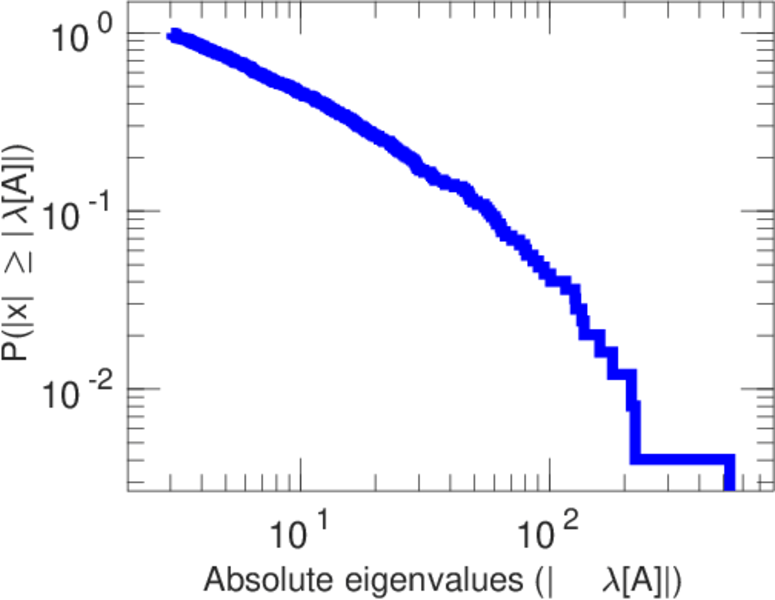
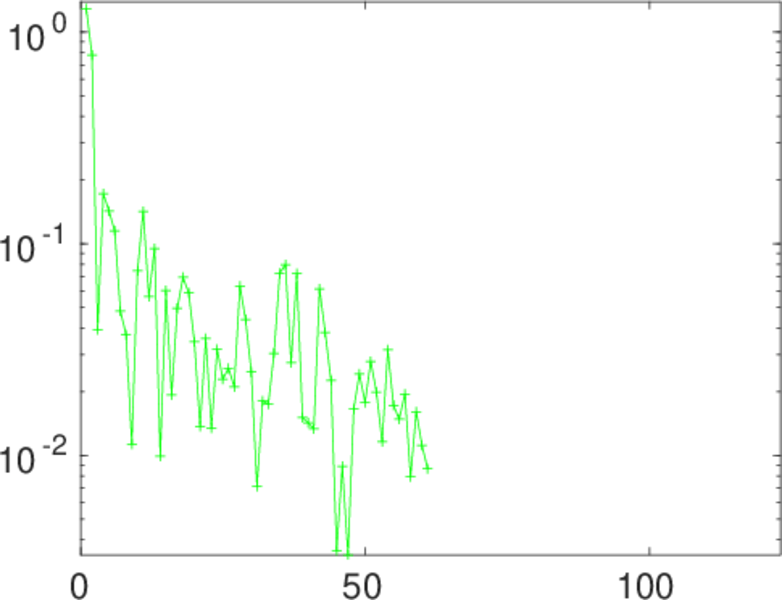
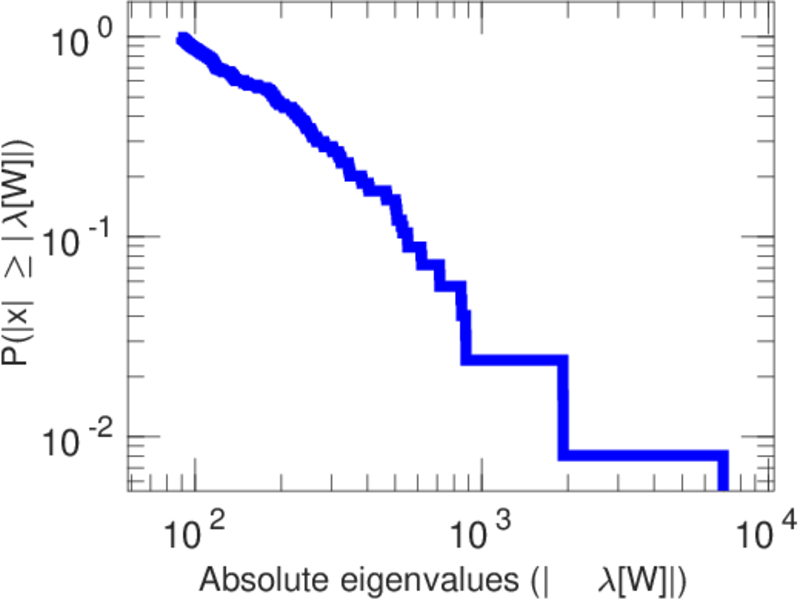
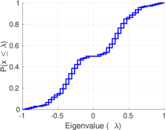
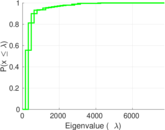
| Spectral norm | α = | 529.844
|
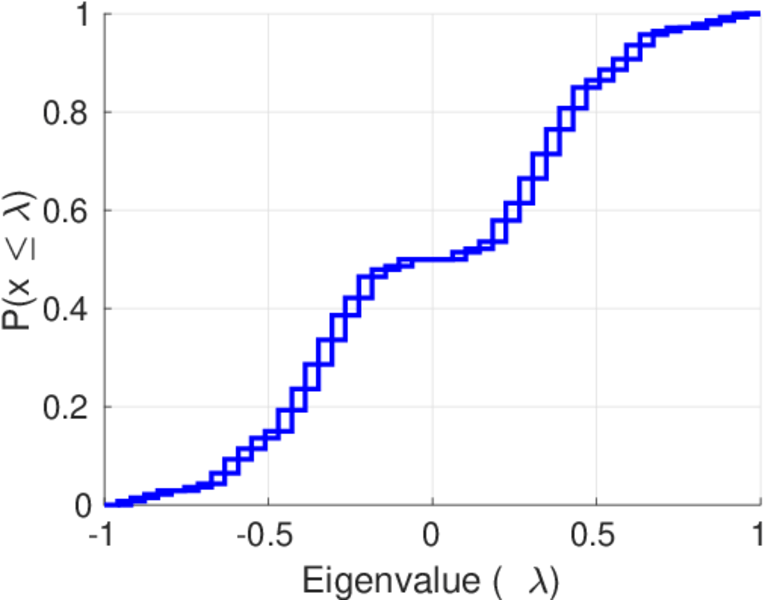
| Algebraic connectivity | a = | 0.028 004 0
|
| Spectral separation | |λ1[A] / λ2[A]| = | 2.391 82
|
| Controllability | C = | 4,992
|
| Relative controllability | Cr = | 0.723 898
|
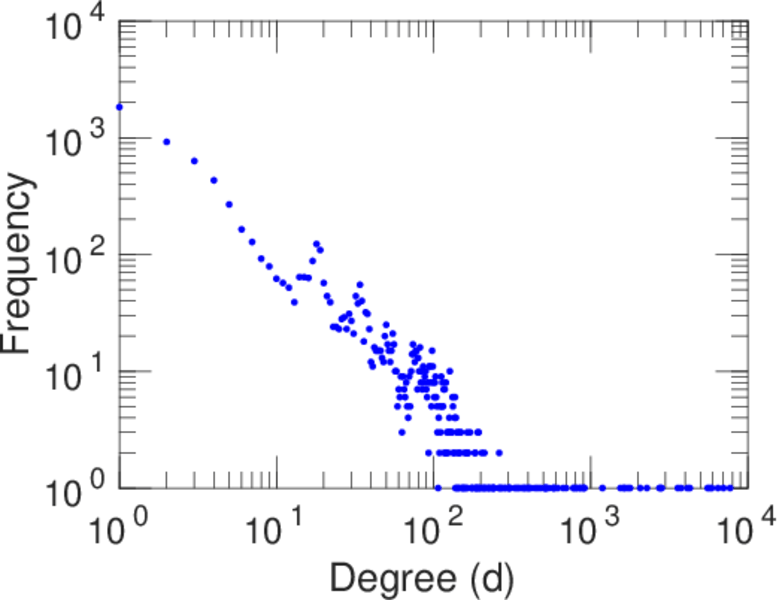
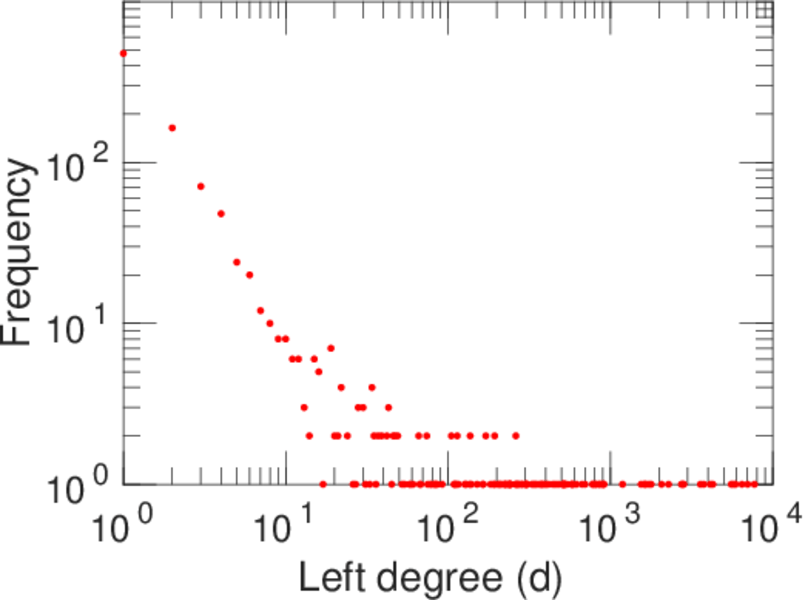
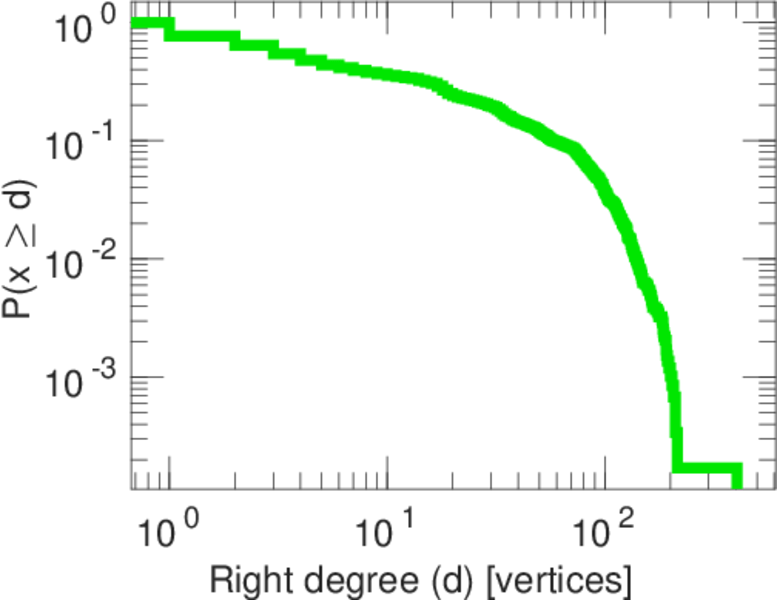
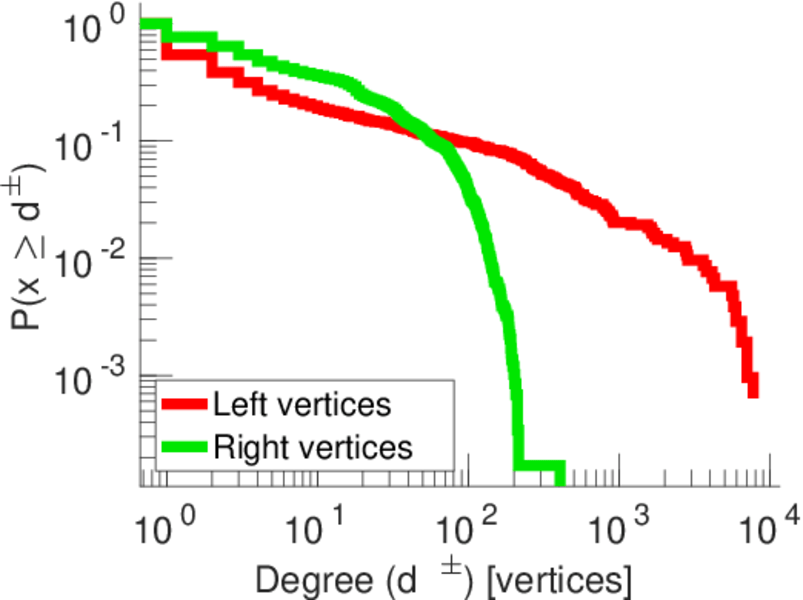
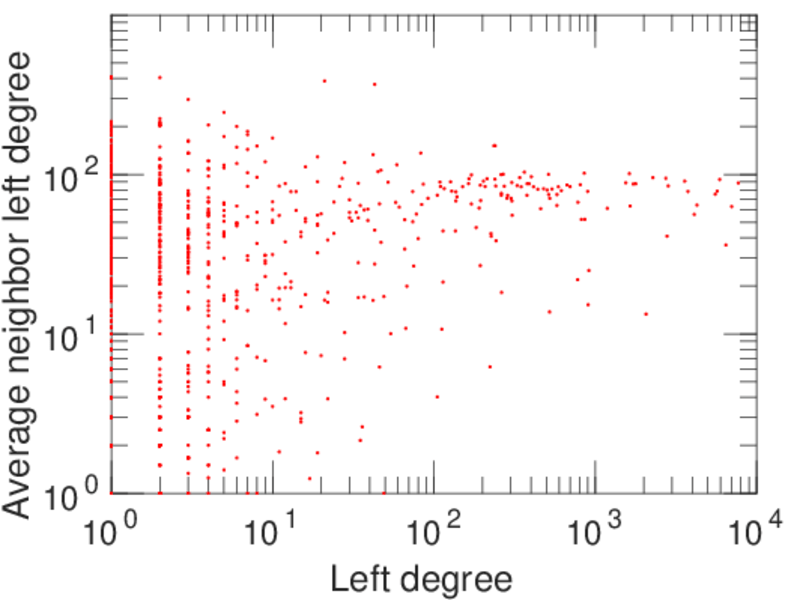
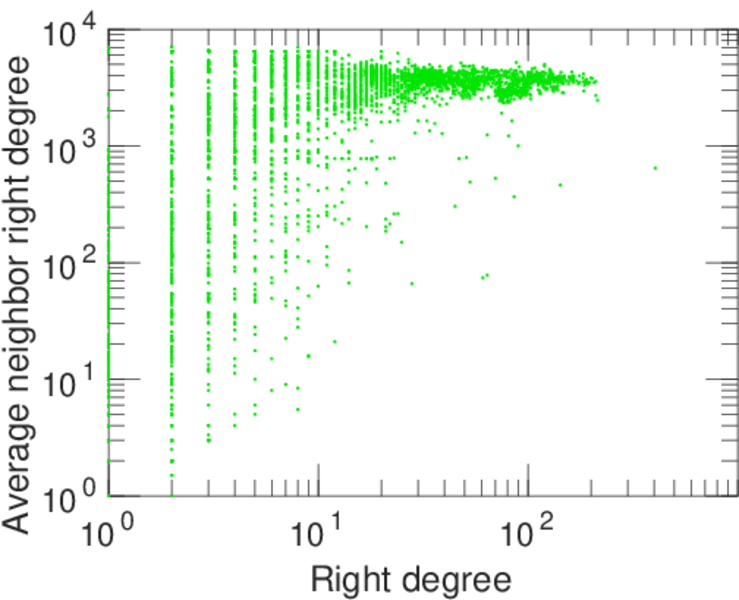
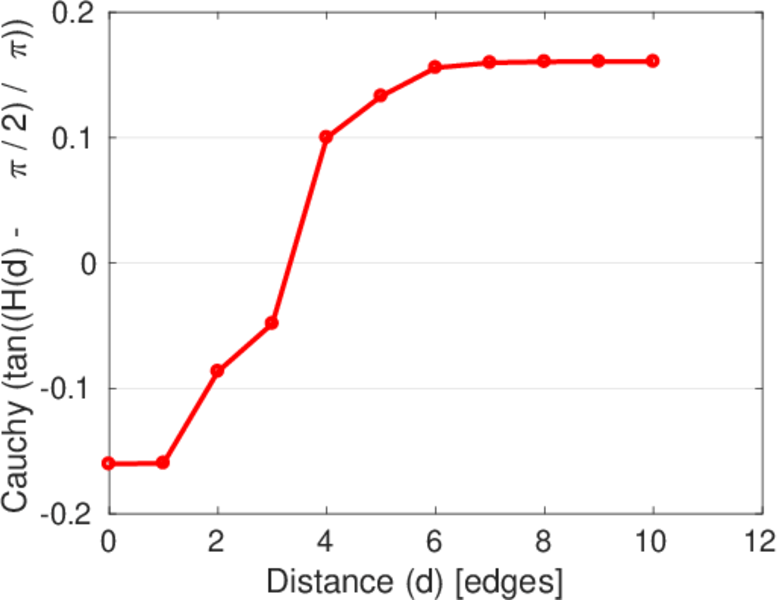
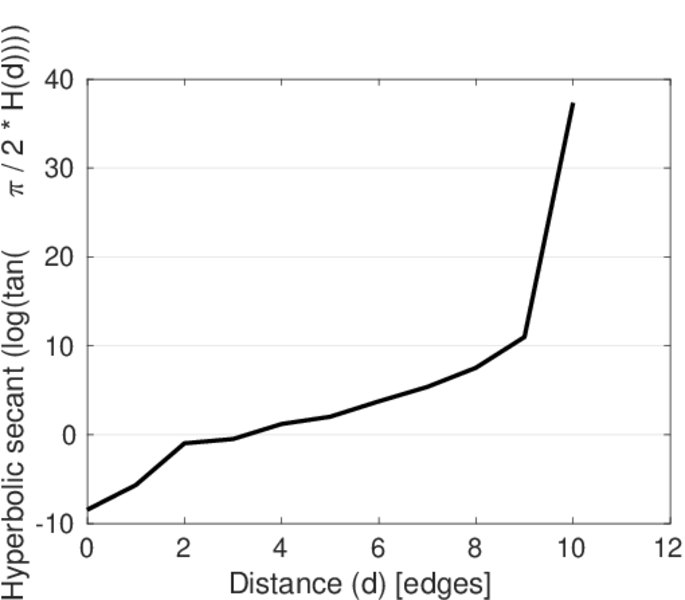
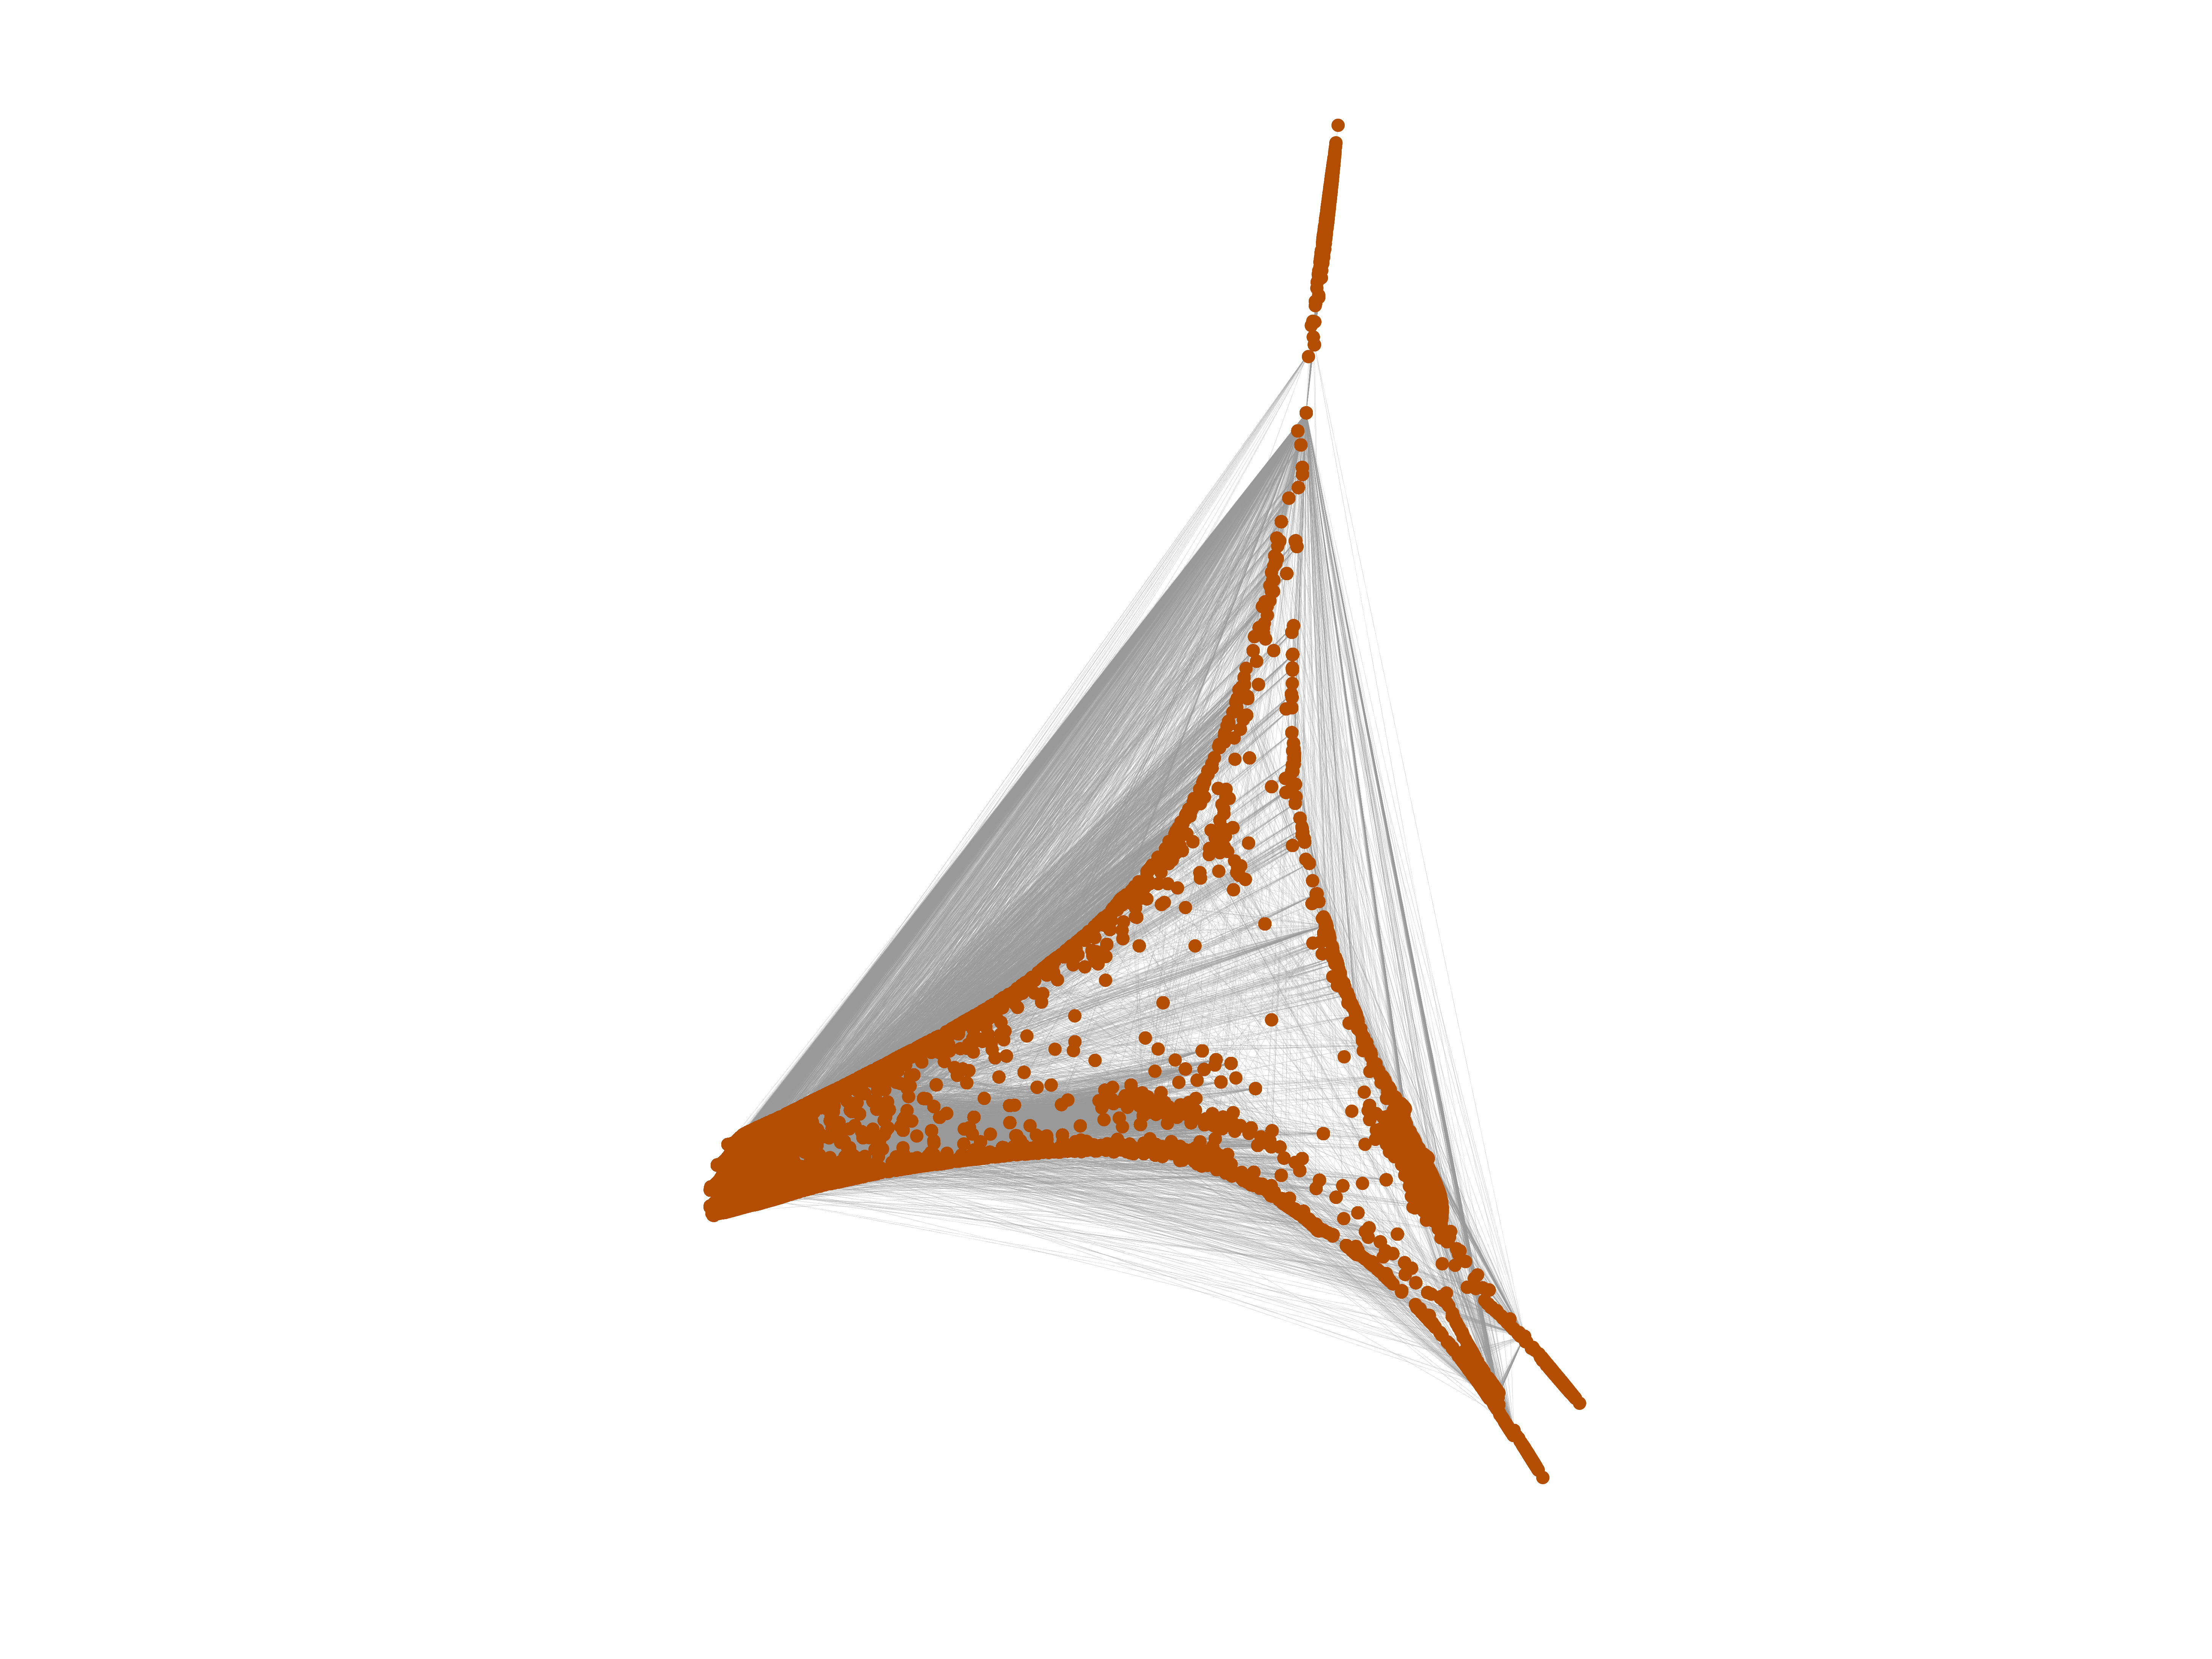
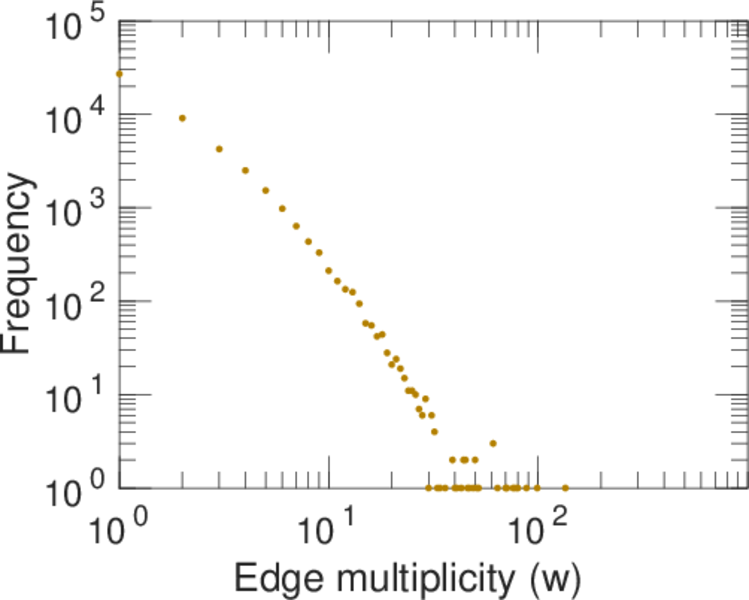
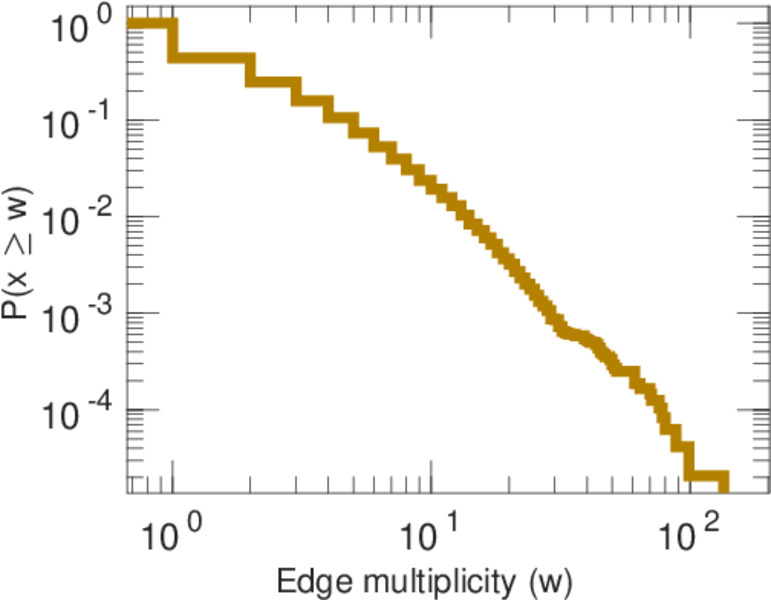
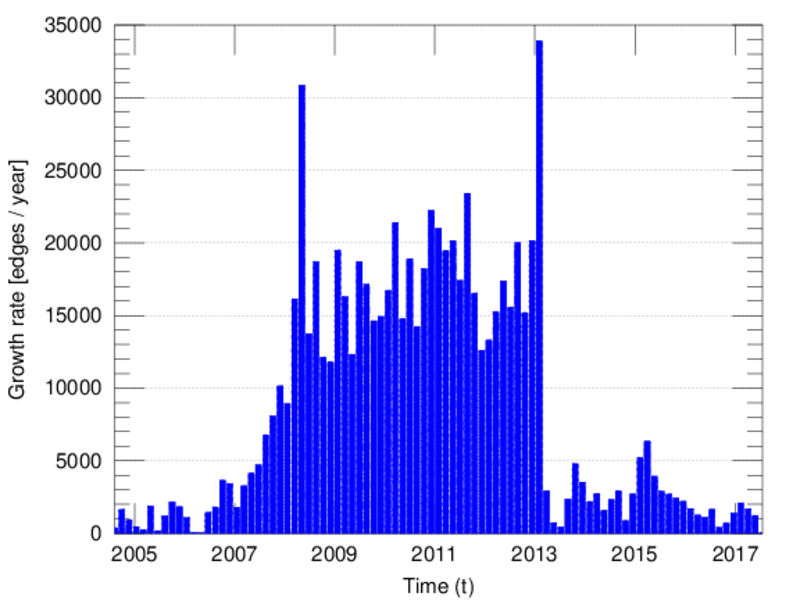
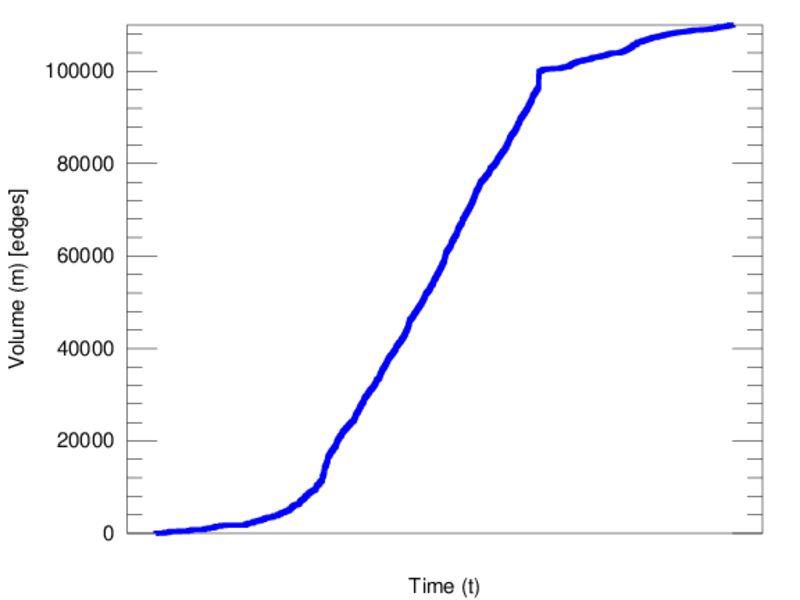
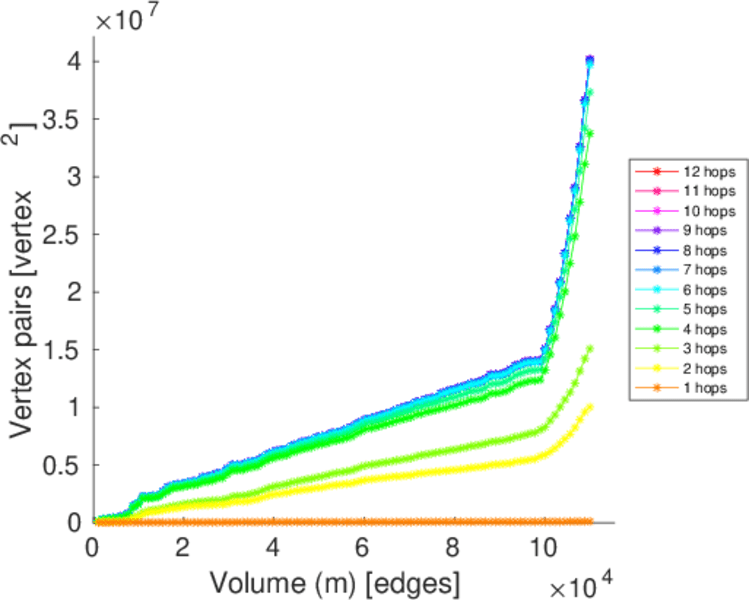
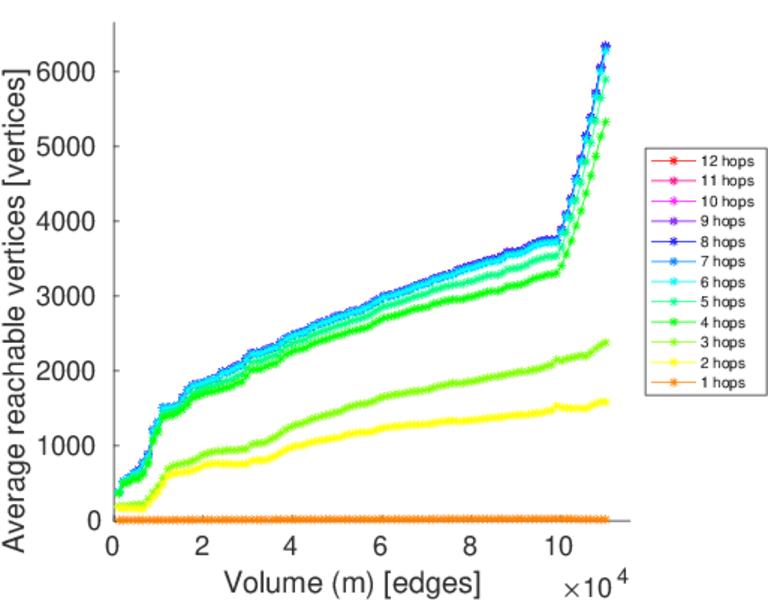
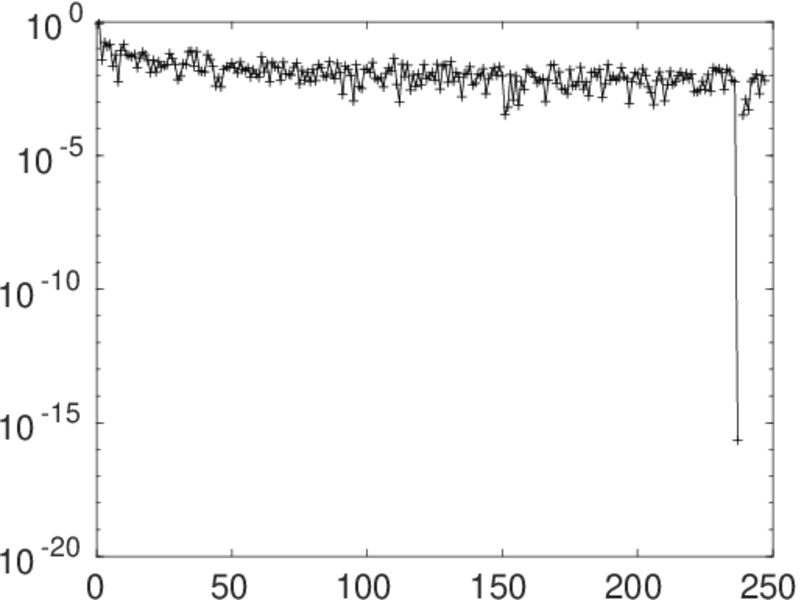
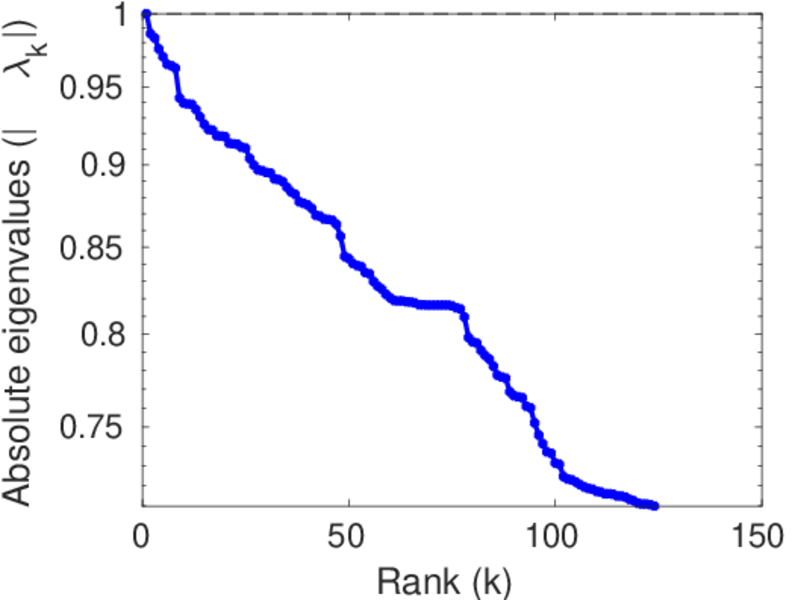
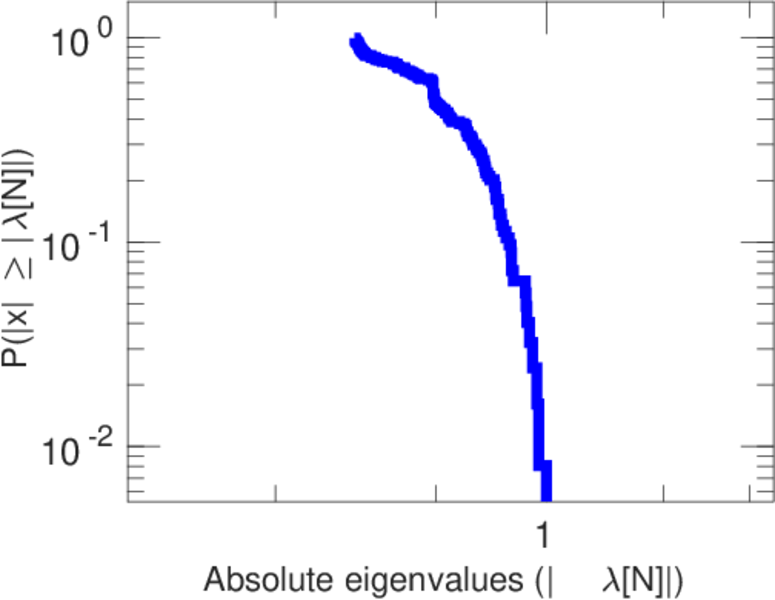
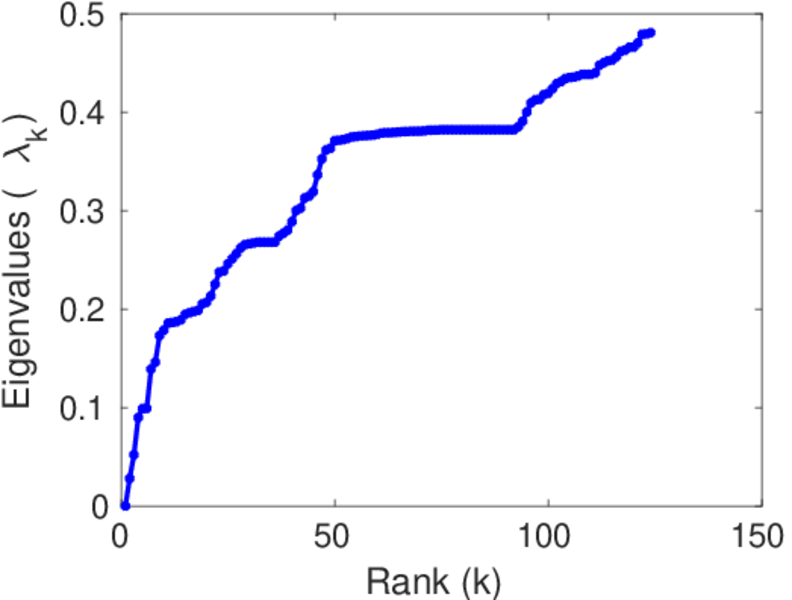
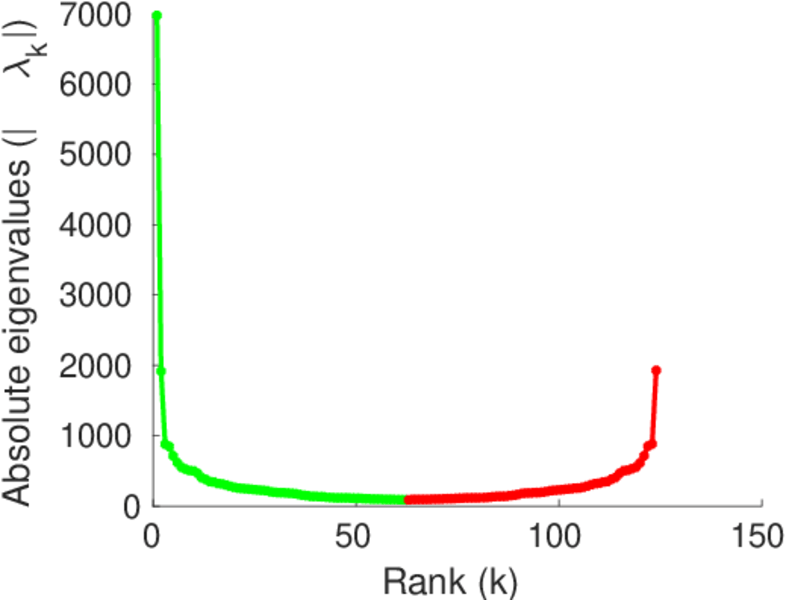
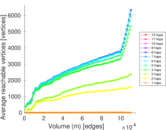
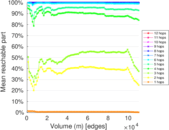
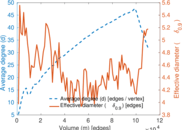
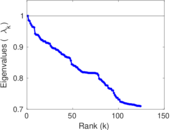
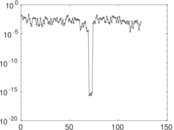
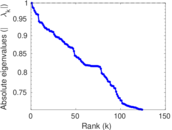
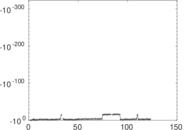
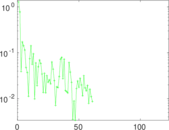
Plots


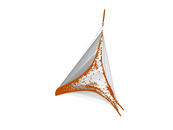


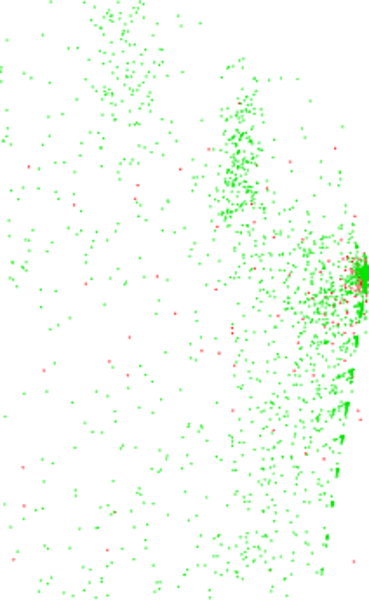
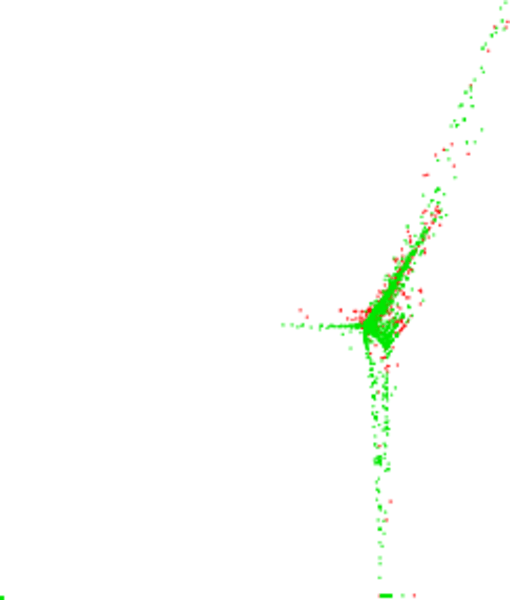
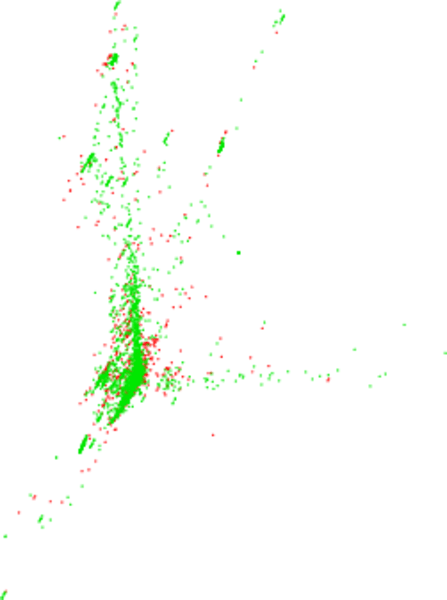
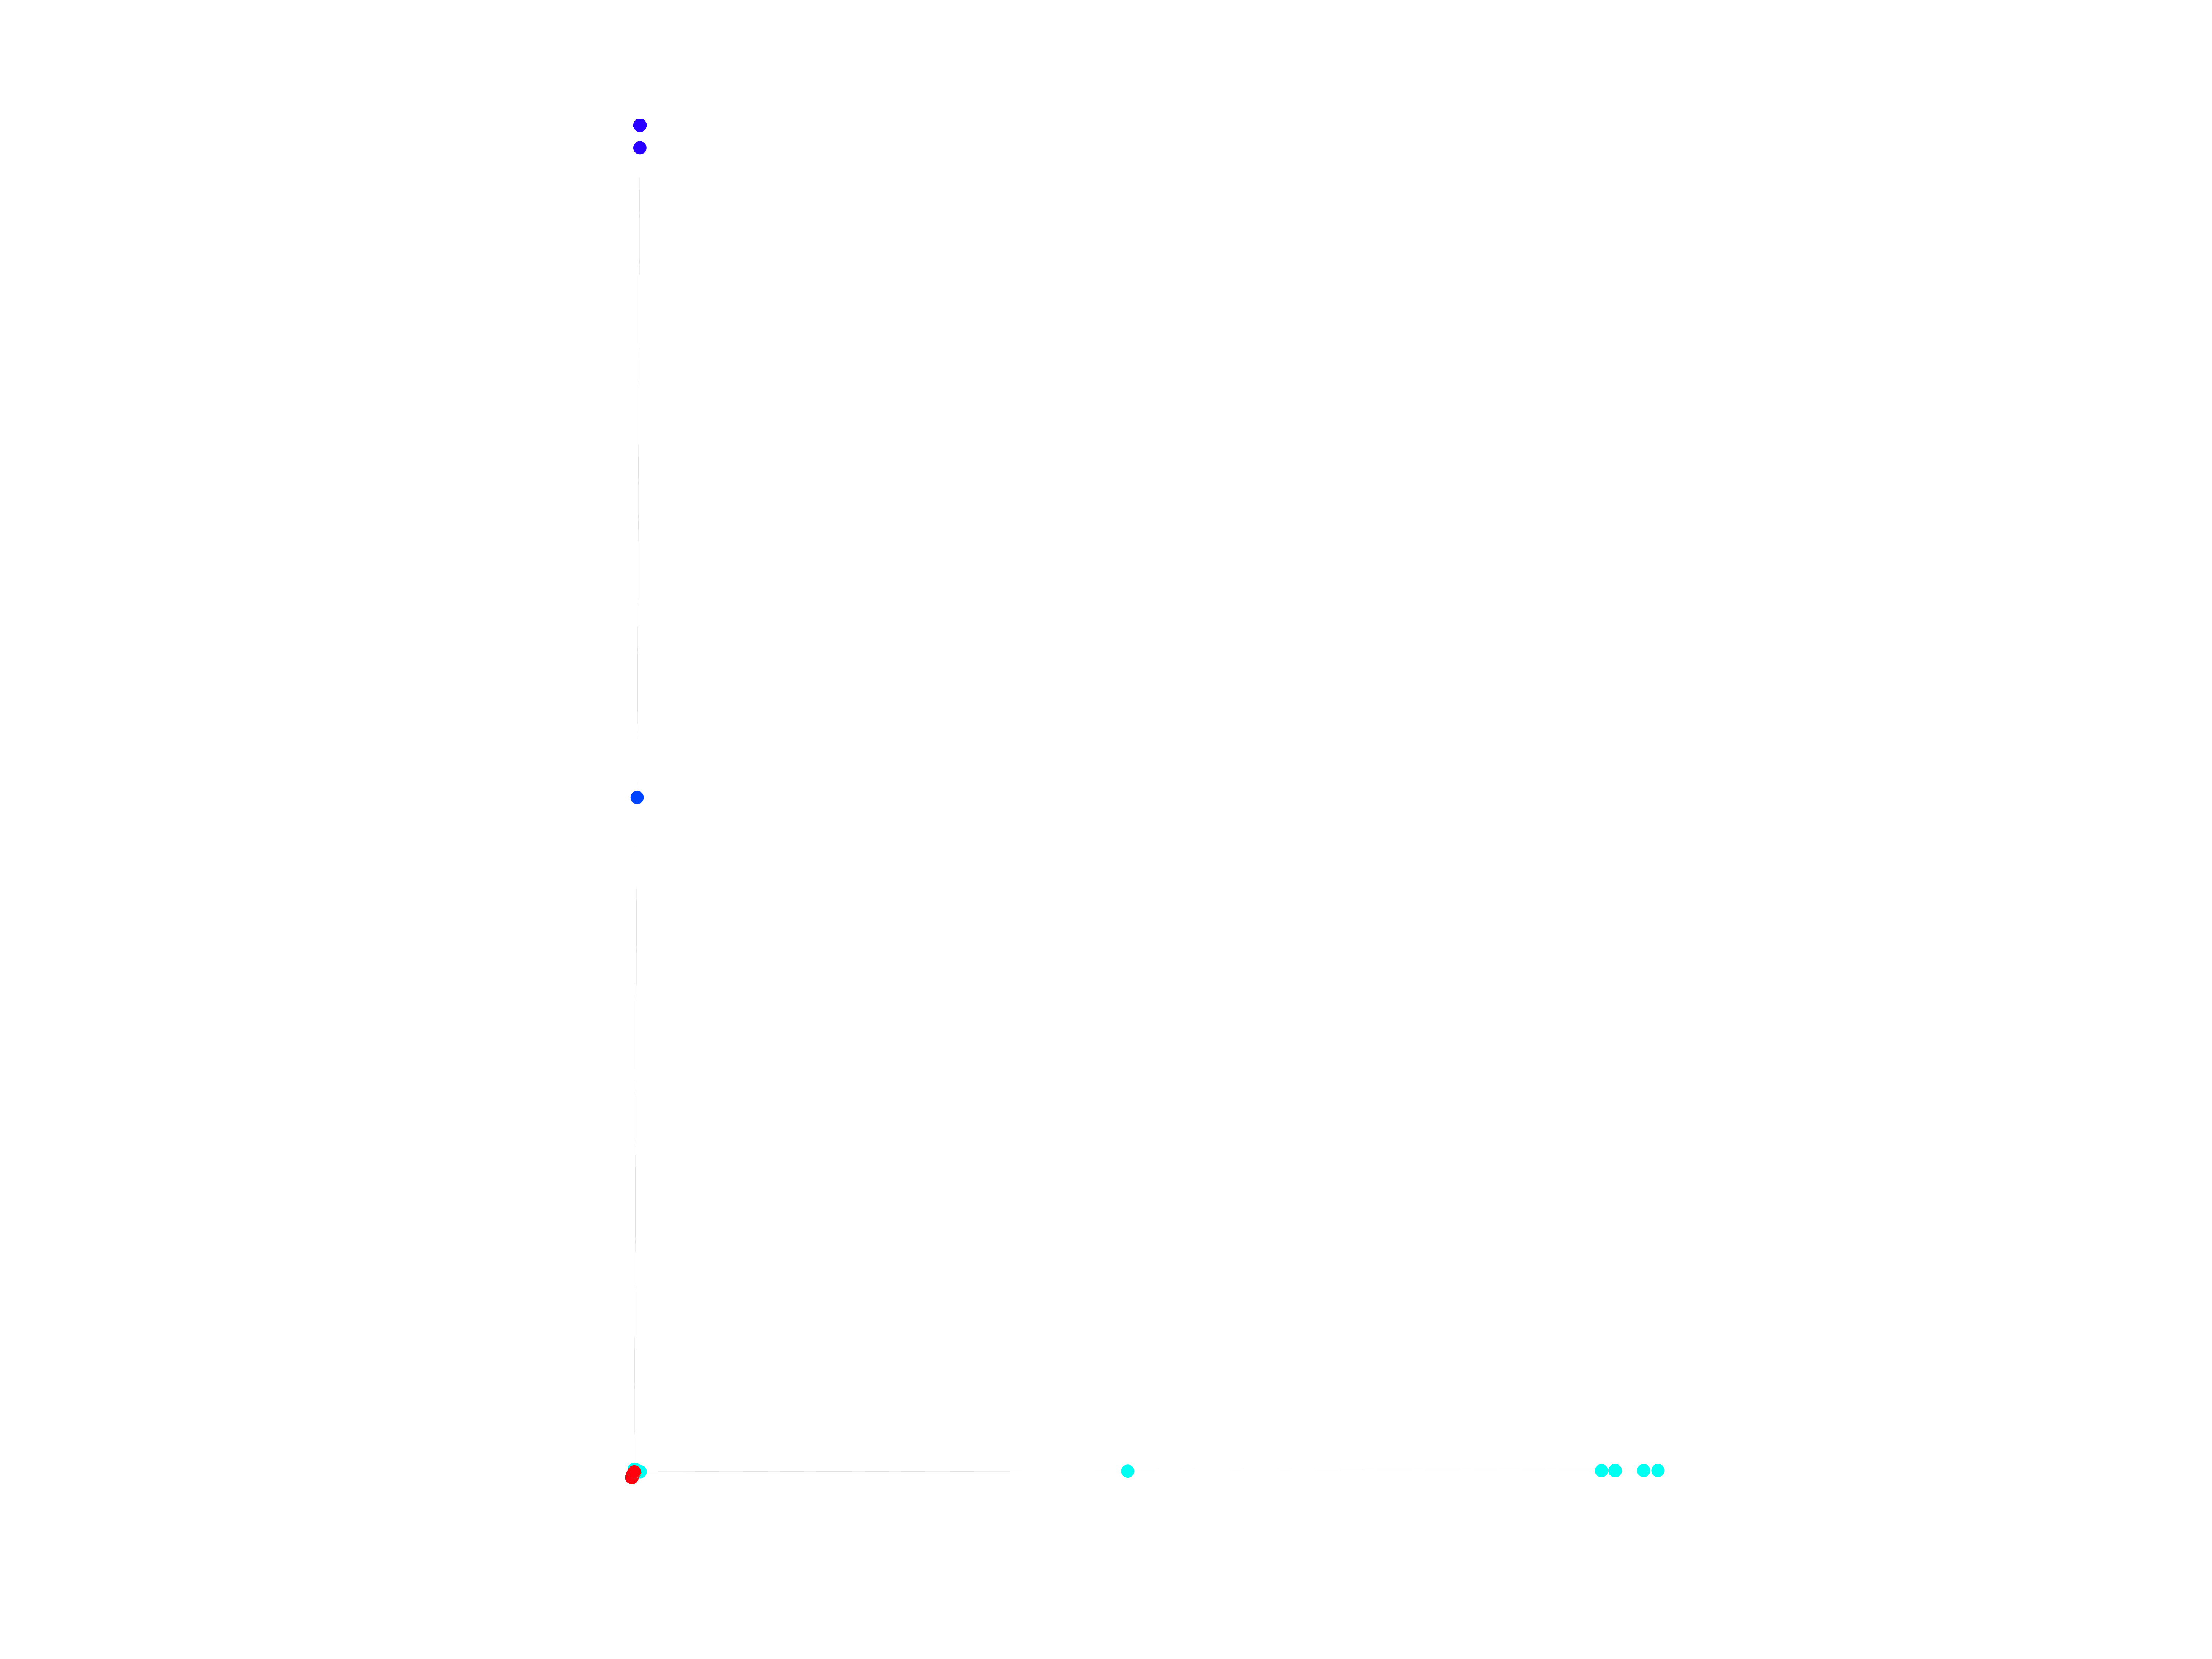
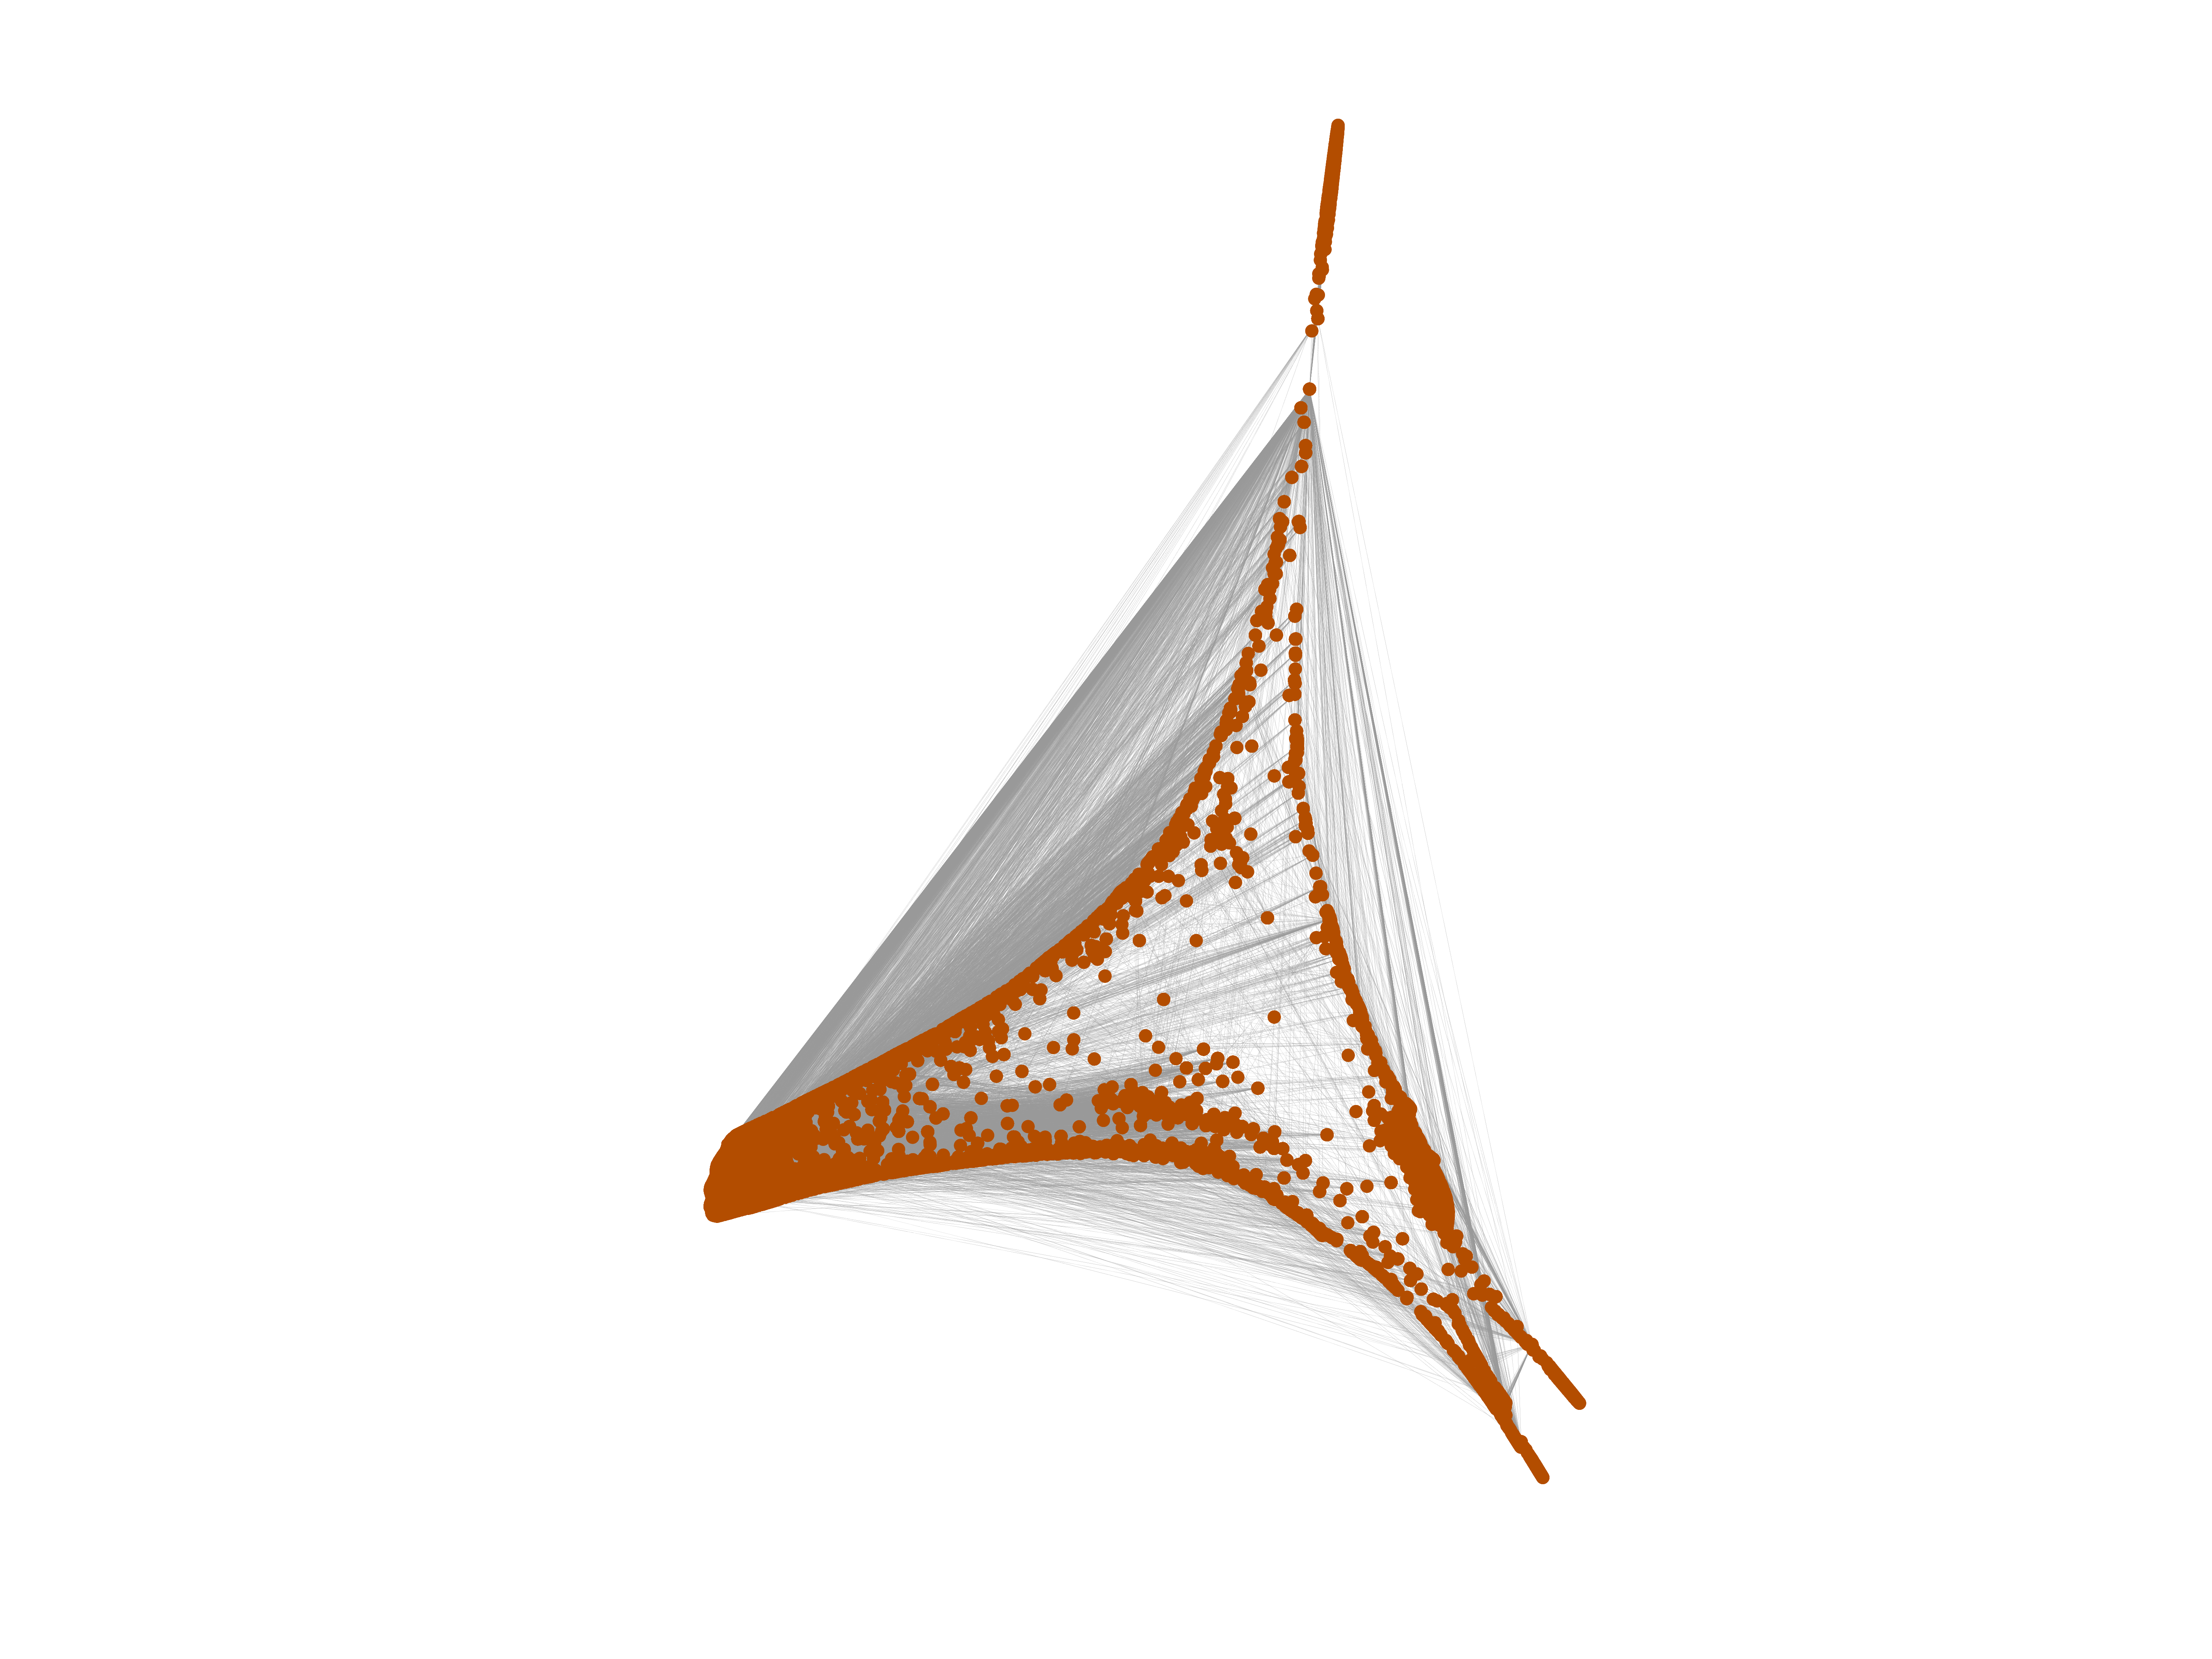
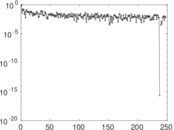
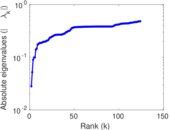
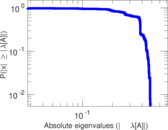
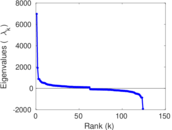
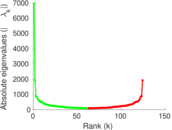
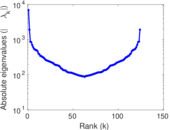
Matrix decompositions plots


Downloads
References
|
[1]
|
Jérôme Kunegis.
KONECT – The Koblenz Network Collection.
In Proc. Int. Conf. on World Wide Web Companion, pages
1343–1350, 2013.
[ http ]
|
|
[2]
|
Wikimedia Foundation.
Wikimedia downloads.
http://dumps.wikimedia.org/, January 2010.
|
 KONECT ‣ Networks ‣
Buy Me a Coffee
KONECT ‣ Networks ‣
Buy Me a Coffee