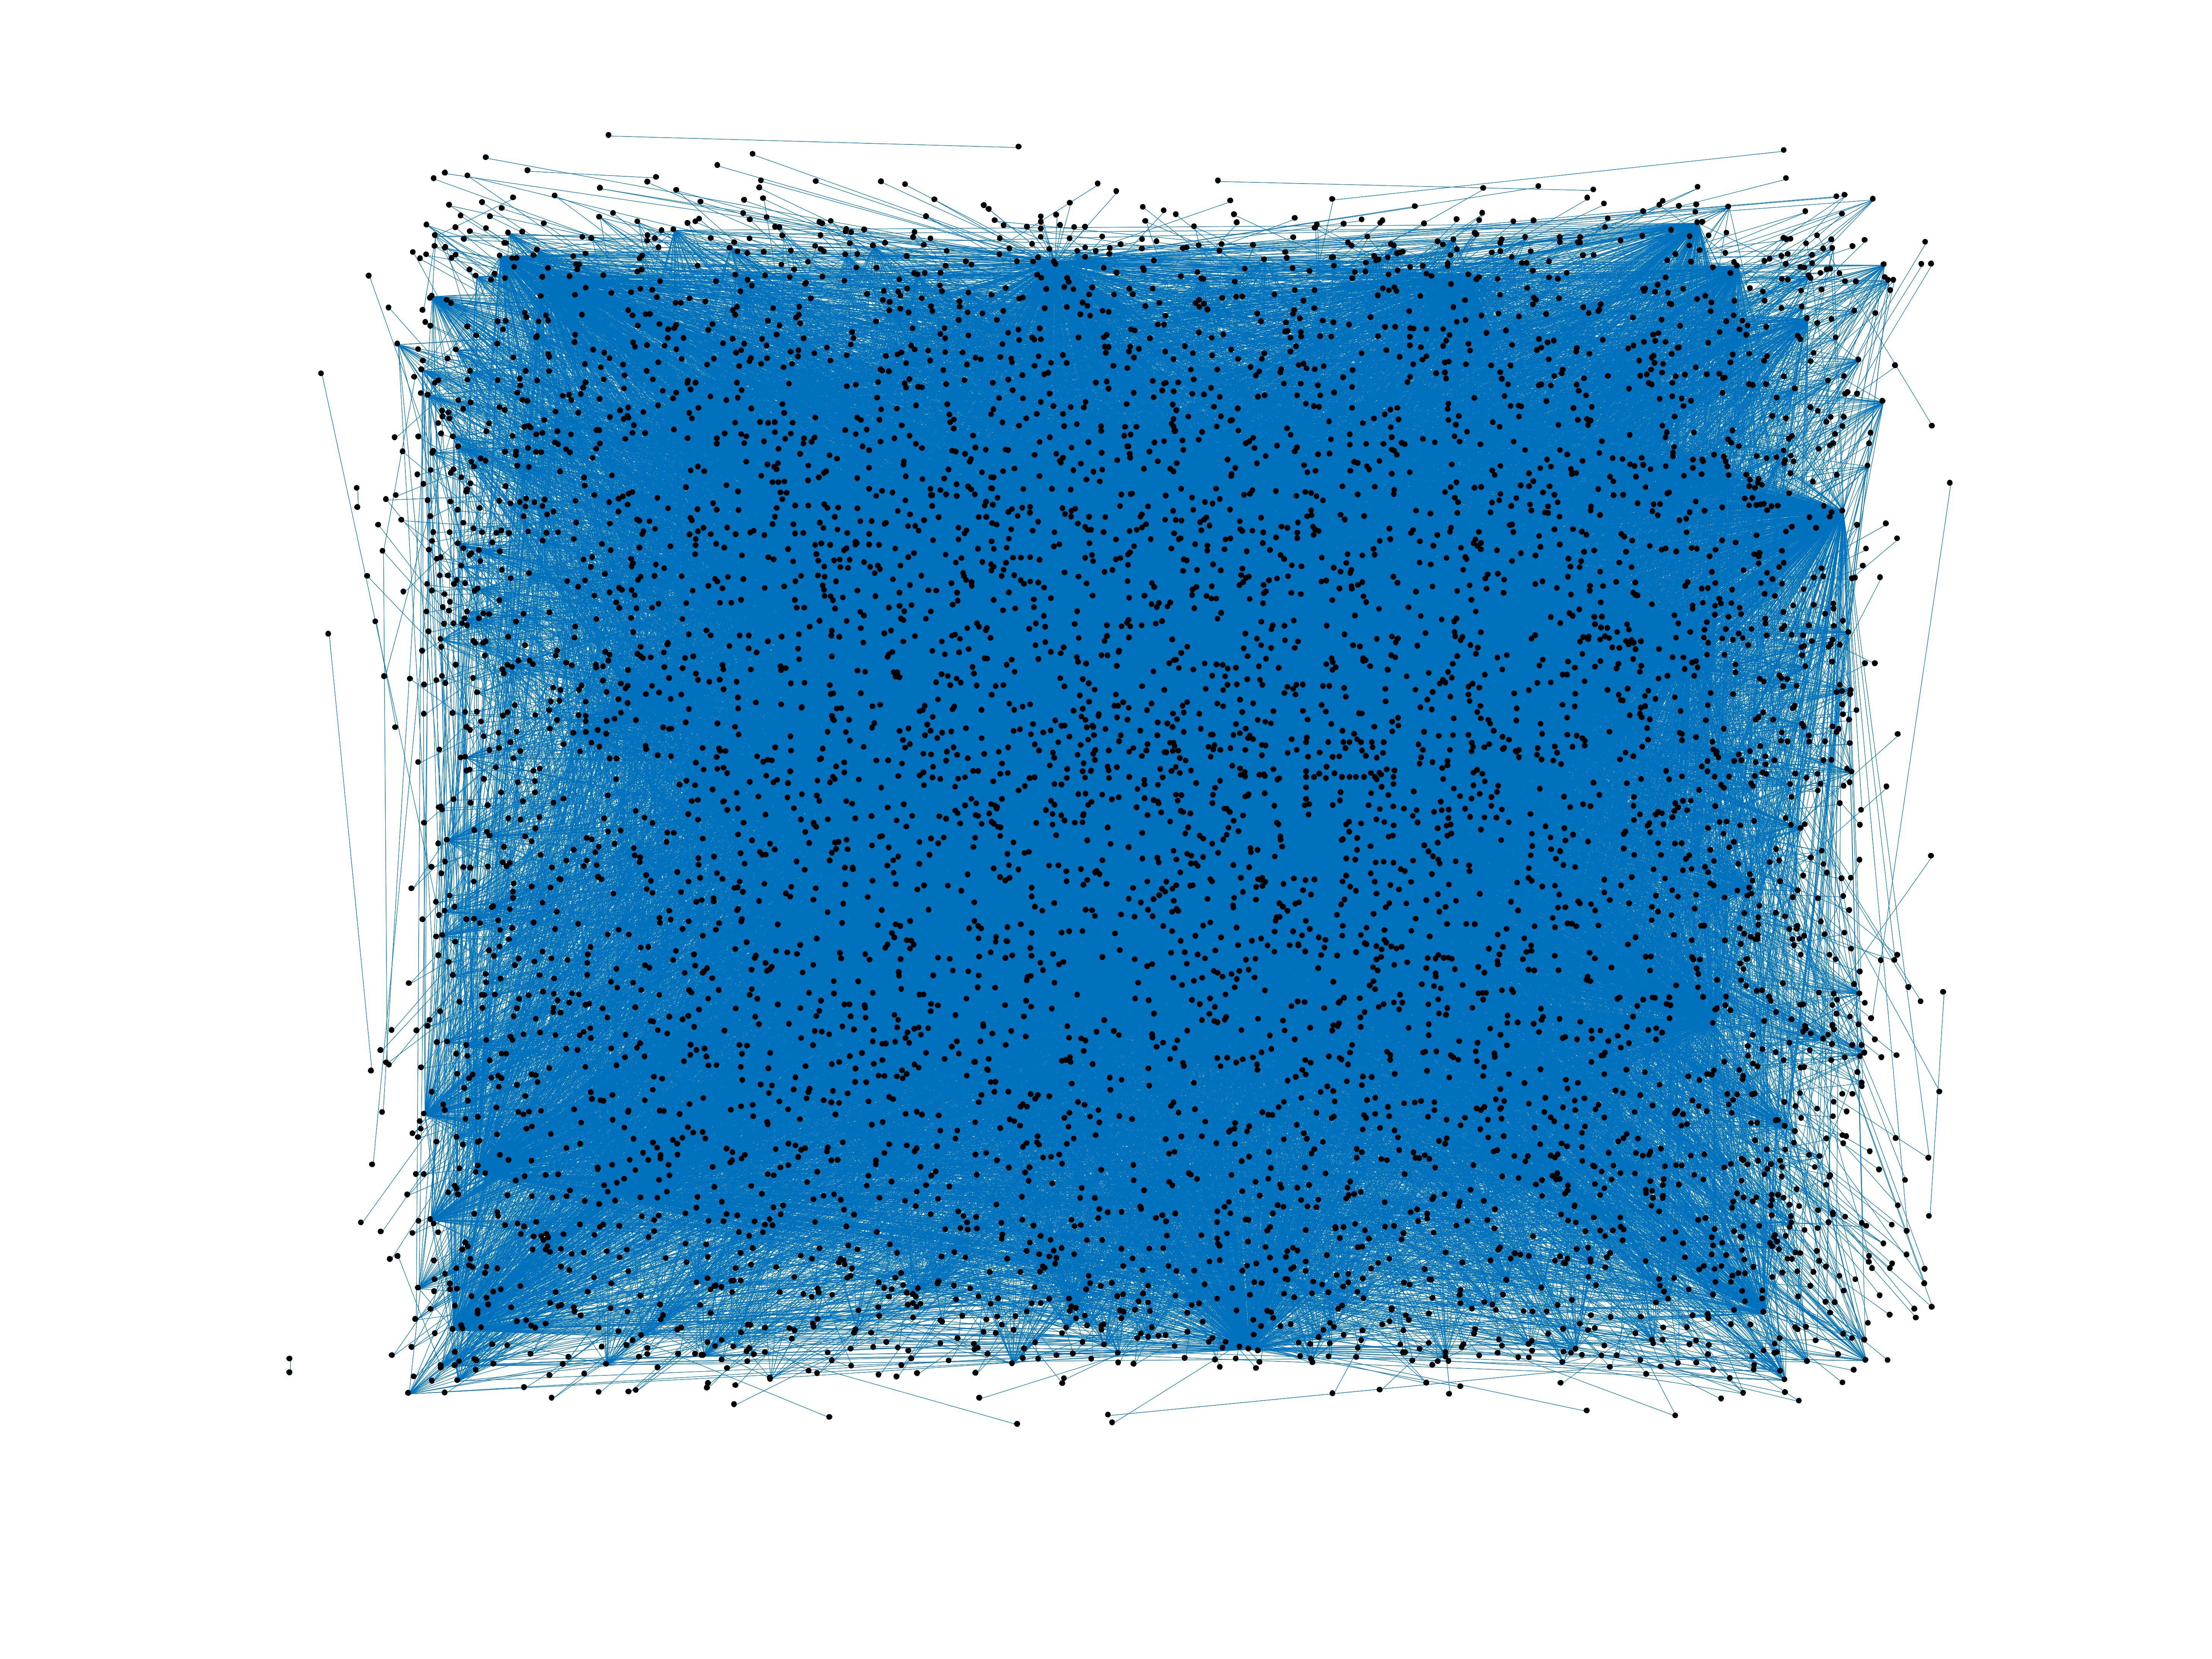
Wikipedia edits (ig)
This is the bipartite edit network of the Igbo Wikipedia. It contains users and
pages from the Igbo Wikipedia, connected by edit events. Each edge represents
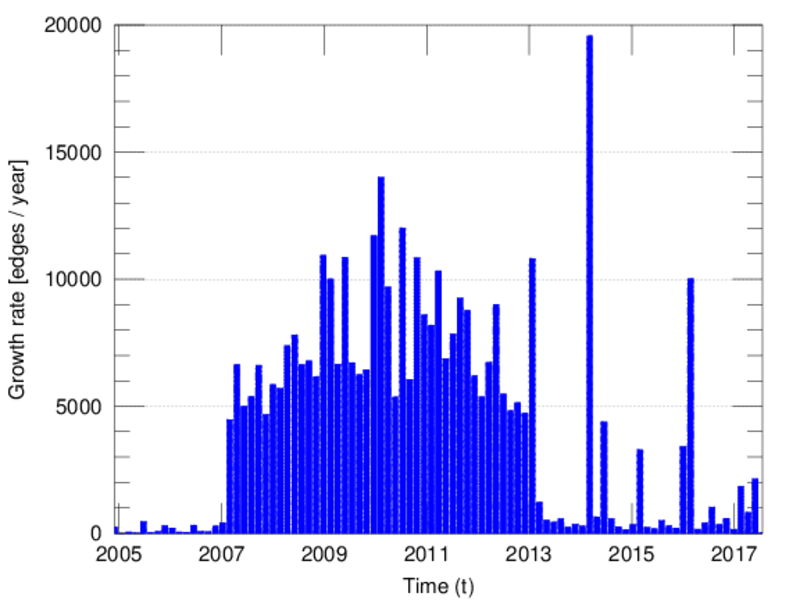
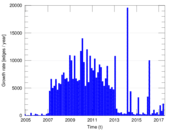
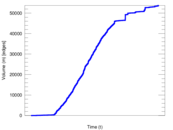
an edit. The dataset includes the timestamp of each edit.
Metadata
Statistics
| Size | n = | 5,978
|
| Left size | n1 = | 772
|
| Right size | n2 = | 5,206
|
| Volume | m = | 53,741
|
| Unique edge count | m̿ = | 25,031
|
| Wedge count | s = | 7,085,578
|
| Claw count | z = | 2,437,913,574
|
| Cross count | x = | 936,759,560,958
|
| Square count | q = | 25,223,170
|
| 4-Tour count | T4 = | 230,184,778
|
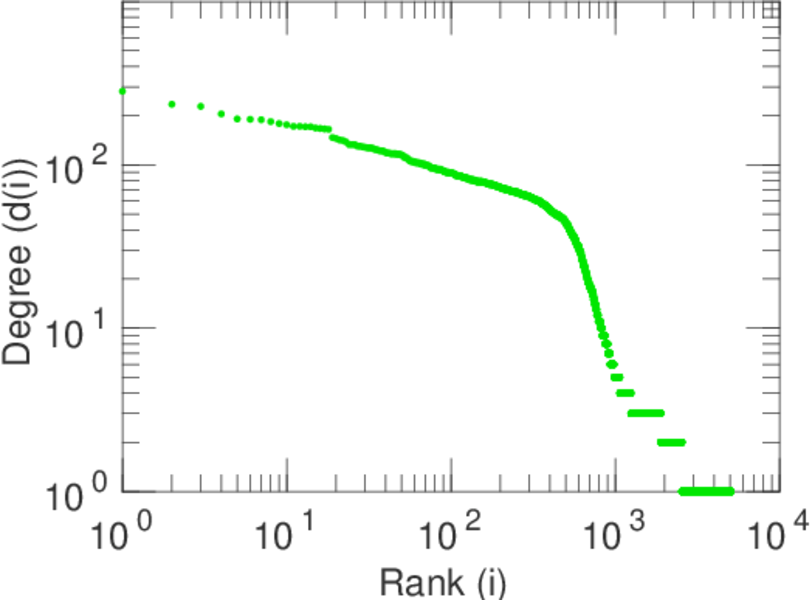
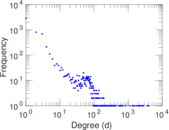
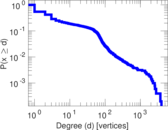
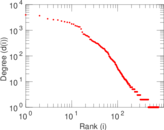
| Maximum degree | dmax = | 3,959
|
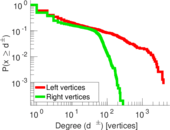
| Maximum left degree | d1max = | 3,959
|
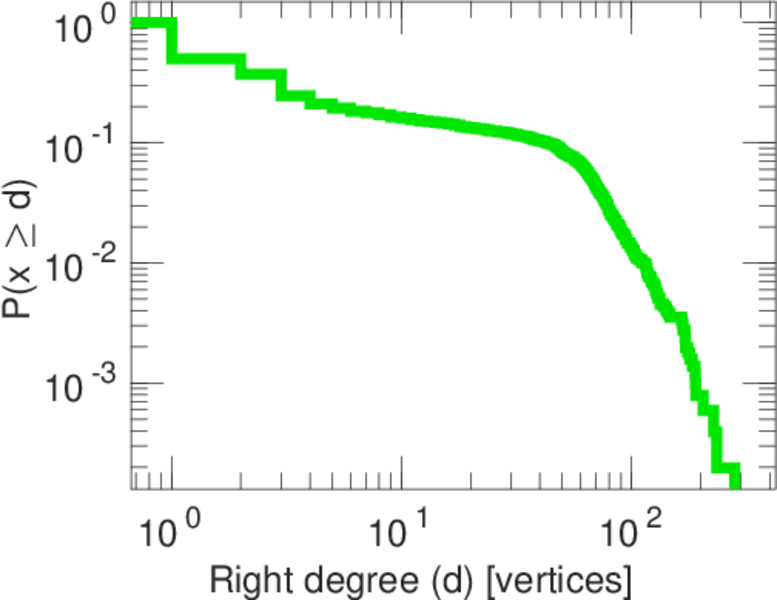
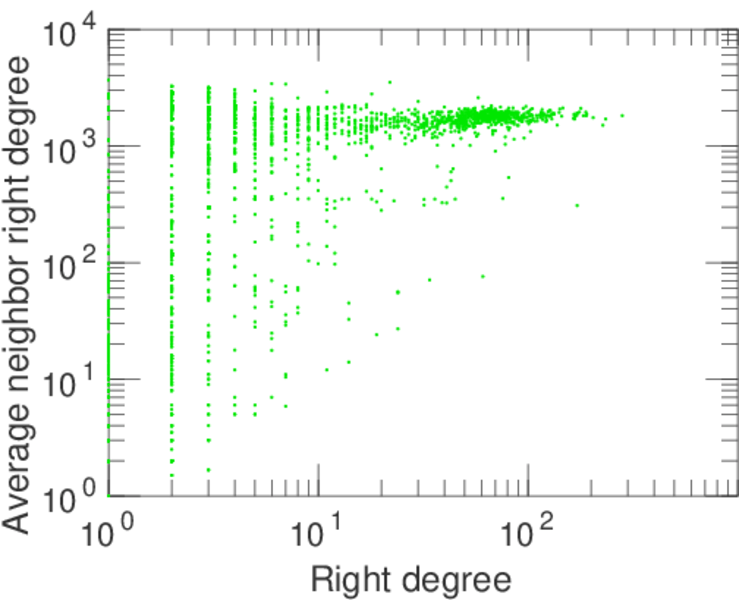
| Maximum right degree | d2max = | 282
|
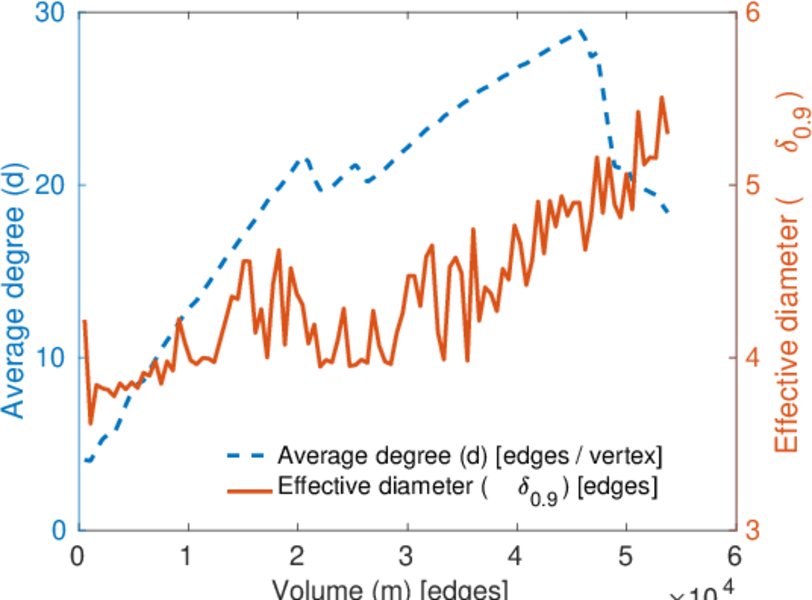
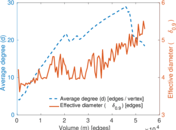
| Average degree | d = | 17.979 6
|
| Average left degree | d1 = | 69.612 7
|
| Average right degree | d2 = | 10.322 9
|
| Fill | p = | 0.006 228 12
|
| Average edge multiplicity | m̃ = | 2.146 98
|
| Size of LCC | N = | 5,218
|
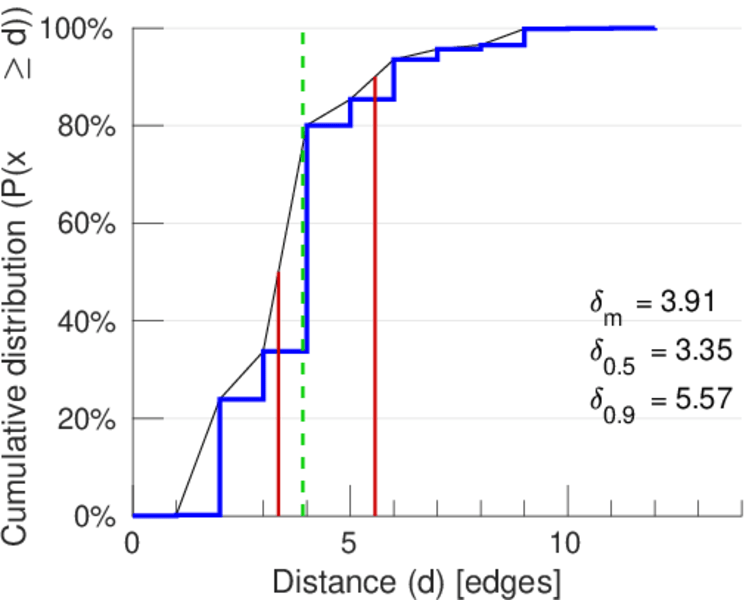
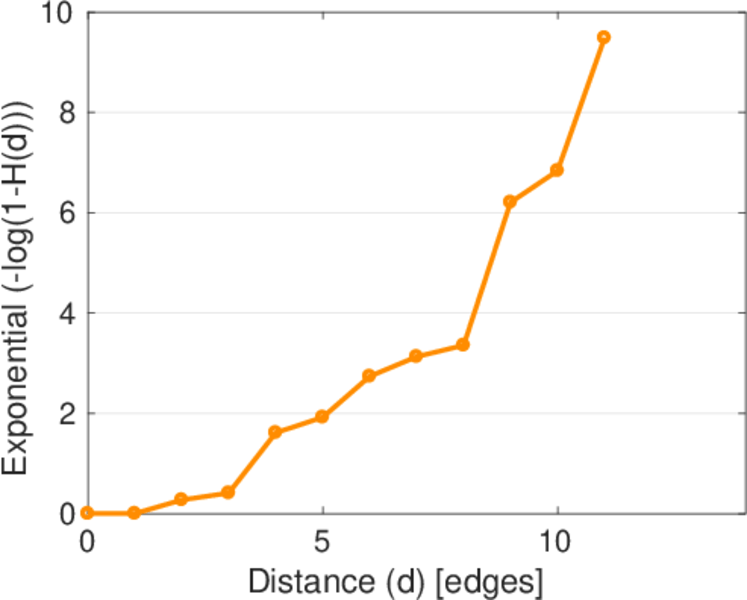
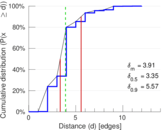
| Diameter | δ = | 12
|
| 50-Percentile effective diameter | δ0.5 = | 3.351 68
|
| 90-Percentile effective diameter | δ0.9 = | 5.569 05
|
| Median distance | δM = | 4
|
| Mean distance | δm = | 3.914 71
|
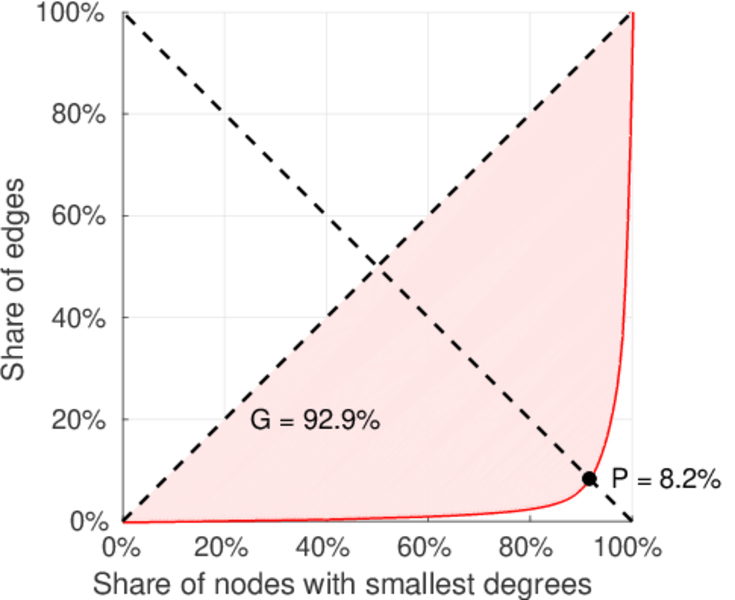
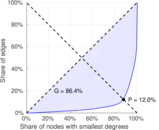
| Gini coefficient | G = | 0.863 283
|
| Balanced inequality ratio | P = | 0.126 831
|
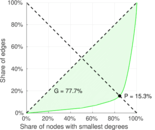
| Left balanced inequality ratio | P1 = | 0.082 153 3
|
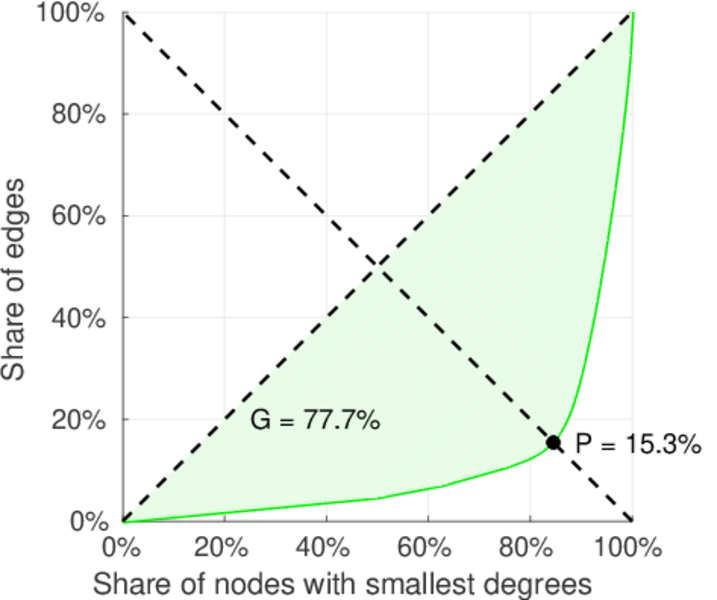
| Right balanced inequality ratio | P2 = | 0.153 012
|
| Relative edge distribution entropy | Her = | 0.770 122
|
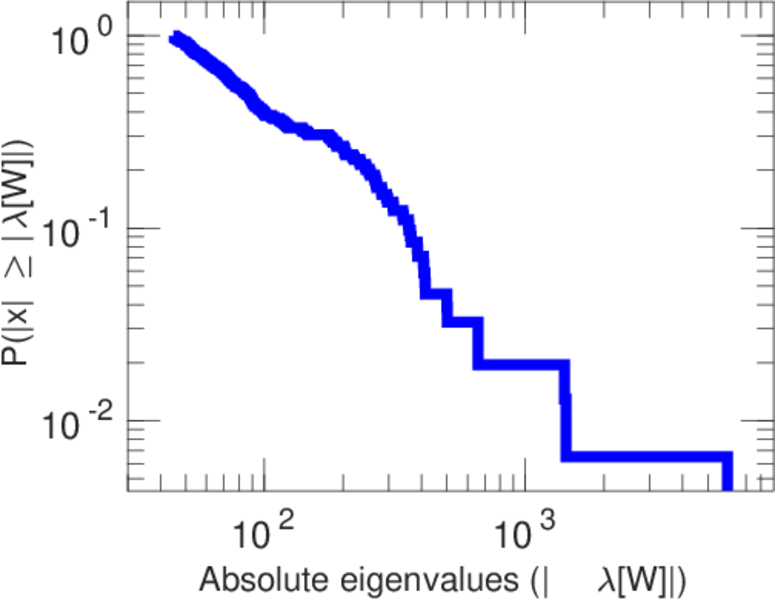
| Power law exponent | γ = | 2.378 99
|
| Tail power law exponent | γt = | 1.851 00
|
| Tail power law exponent with p | γ3 = | 1.851 00
|
| p-value | p = | 0.000 00
|
| Left tail power law exponent with p | γ3,1 = | 1.631 00
|
| Left p-value | p1 = | 0.000 00
|
| Right tail power law exponent with p | γ3,2 = | 8.111 00
|
| Right p-value | p2 = | 0.356 000
|
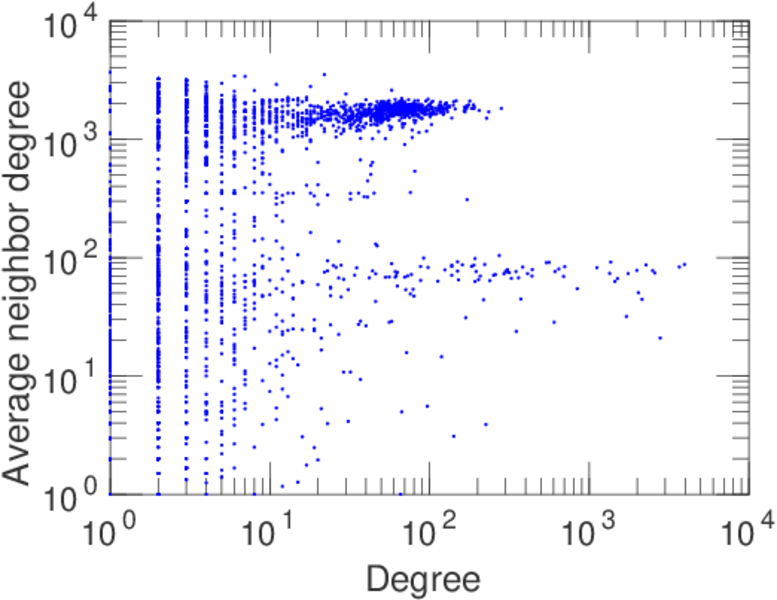
| Degree assortativity | ρ = | −0.305 486
|
| Degree assortativity p-value | pρ = | 0.000 00
|
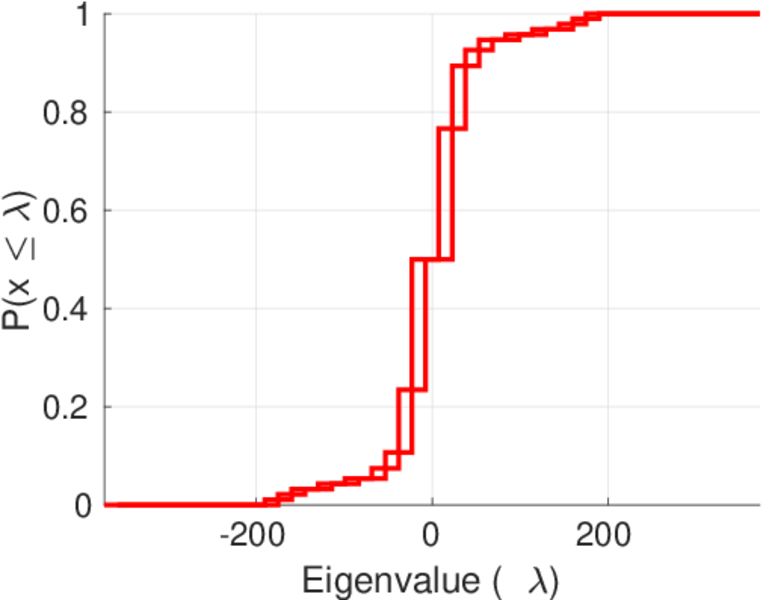
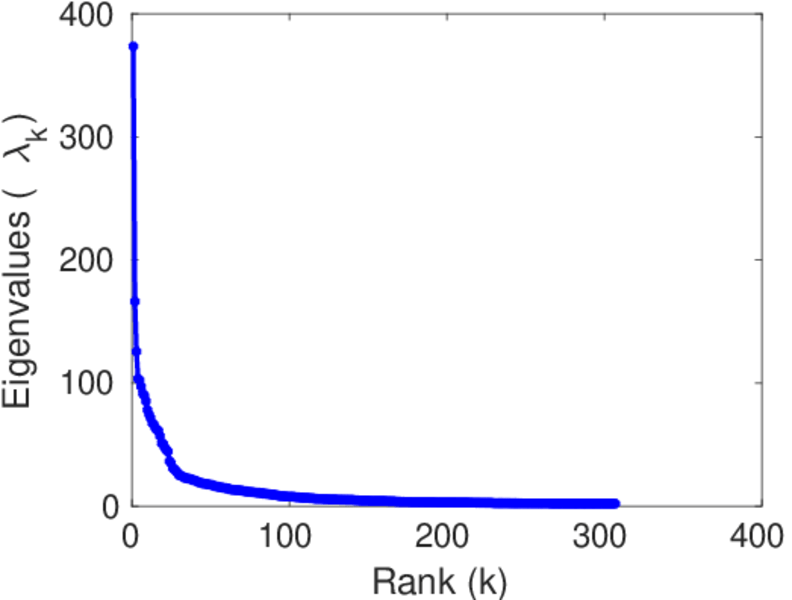
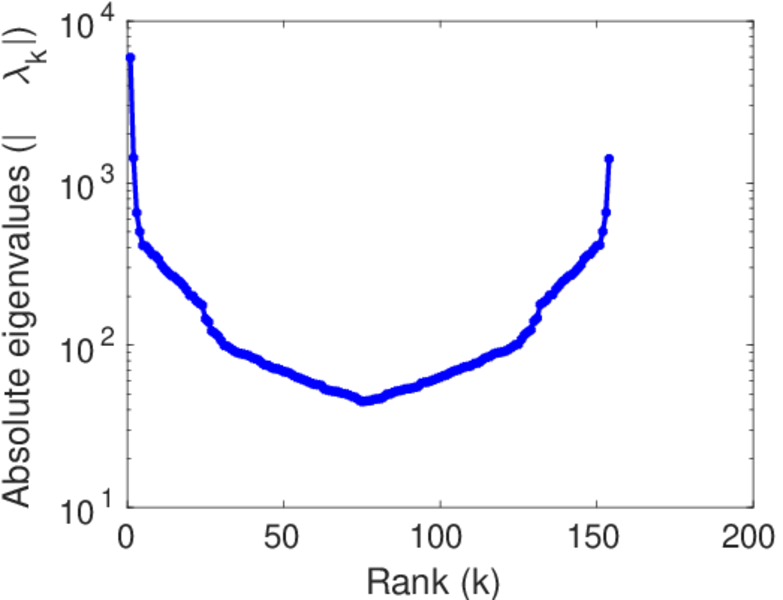
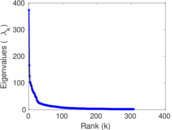
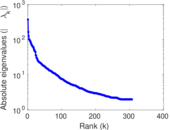
| Spectral norm | α = | 373.313
|
| Algebraic connectivity | a = | 0.031 260 2
|
| Spectral separation | |λ1[A] / λ2[A]| = | 2.246 34
|
| Controllability | C = | 4,402
|
| Relative controllability | Cr = | 0.753 767
|
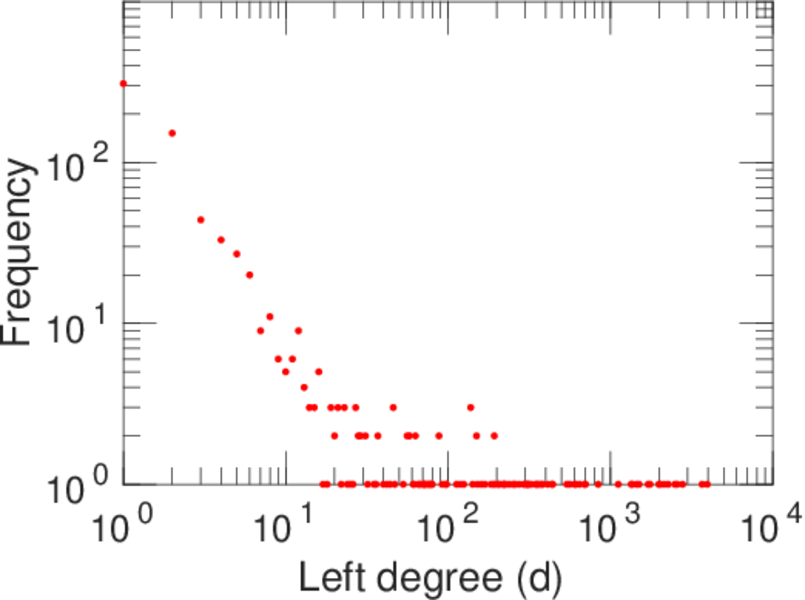
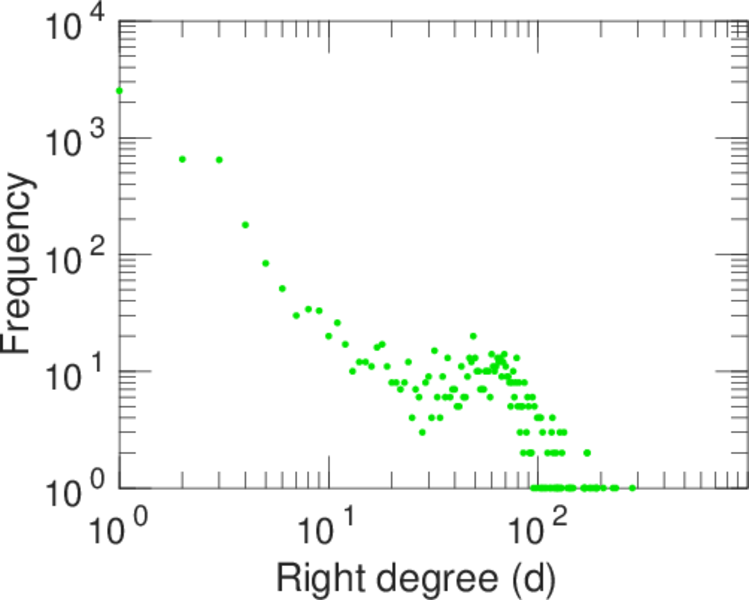
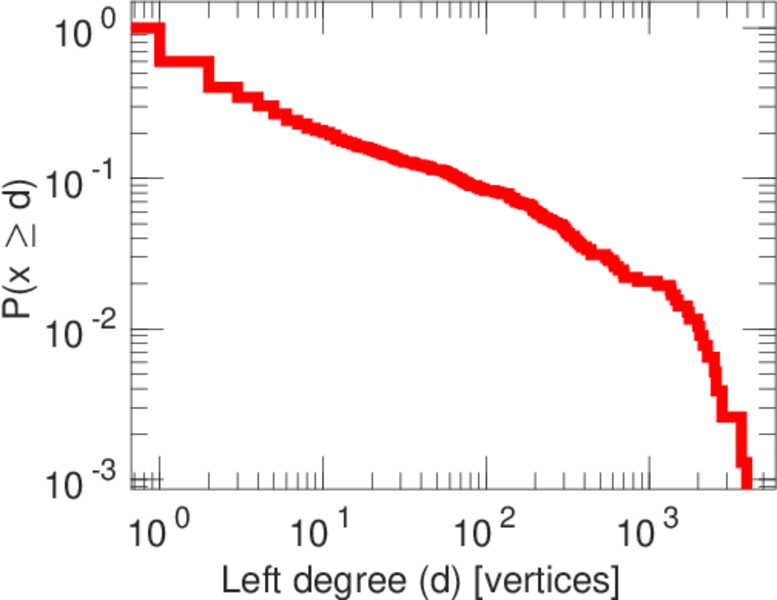
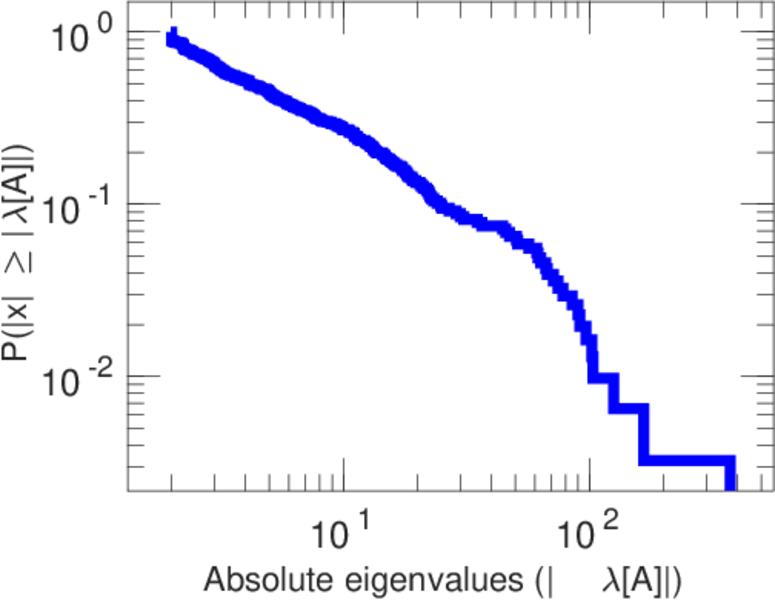
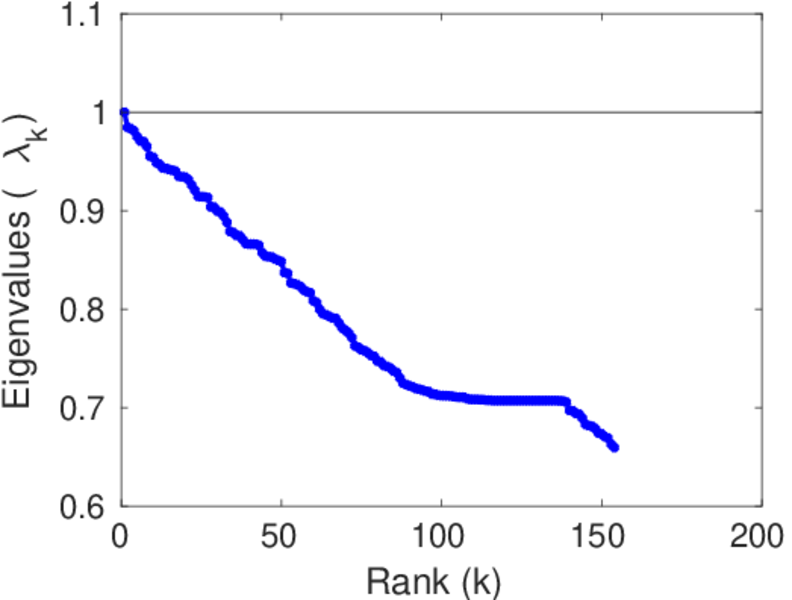
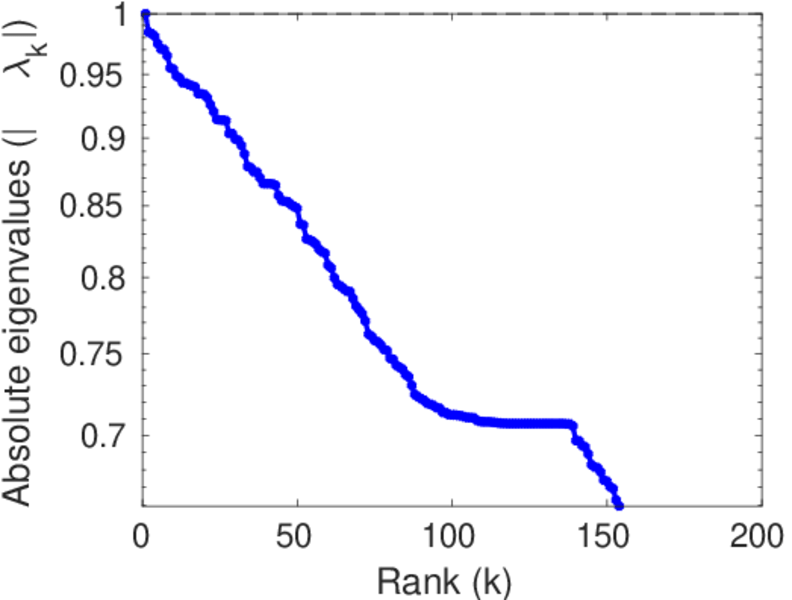
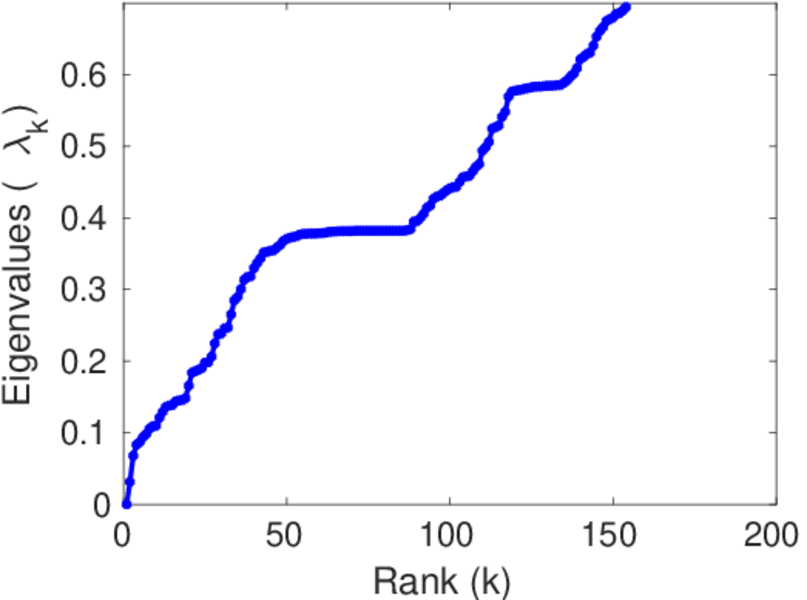
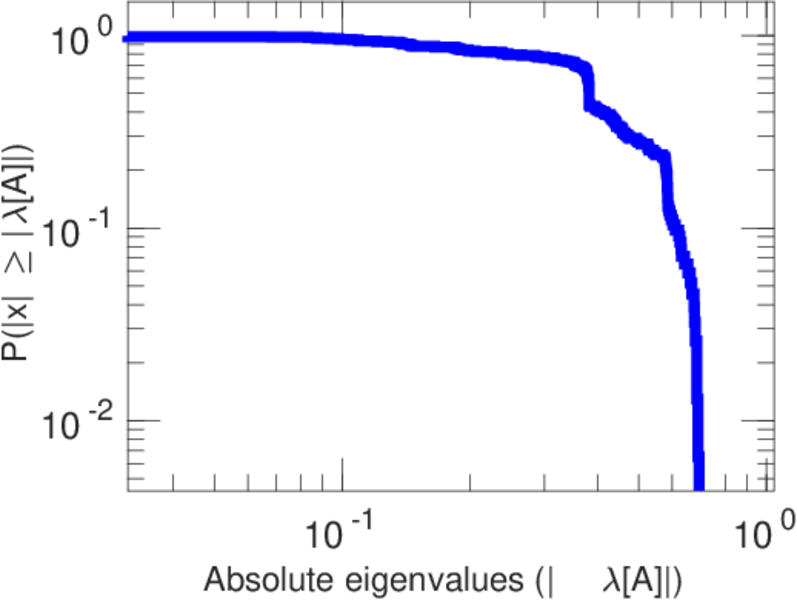
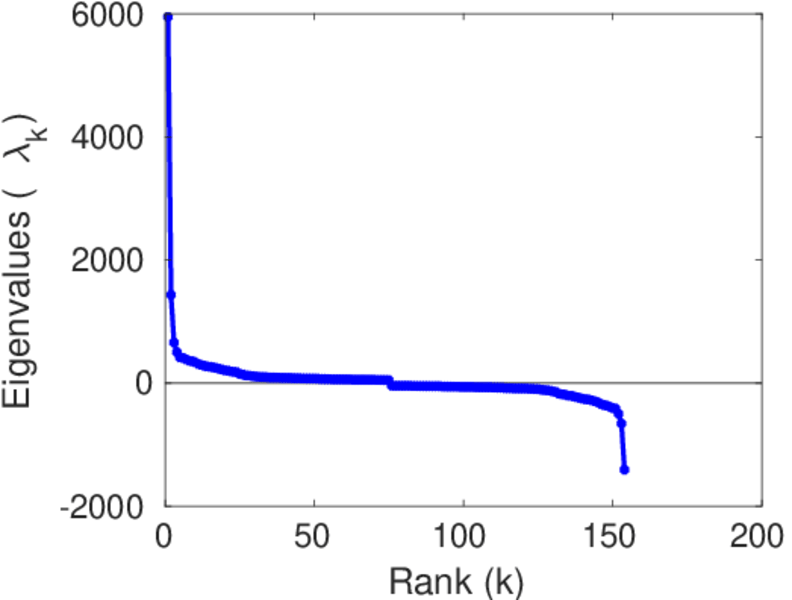
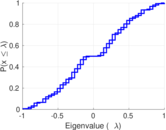
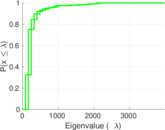
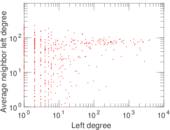
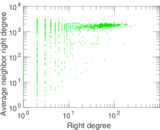
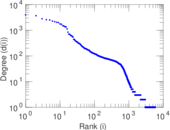
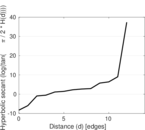
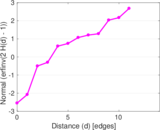
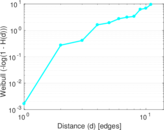
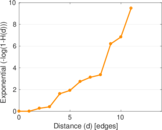
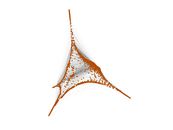
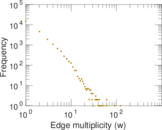
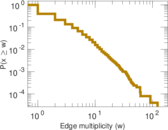
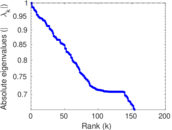
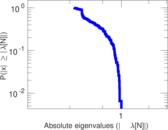
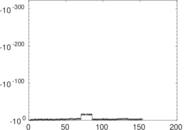
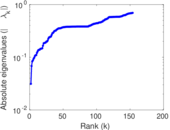
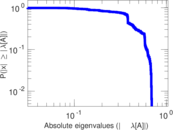
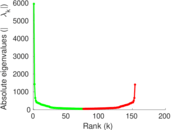
Plots


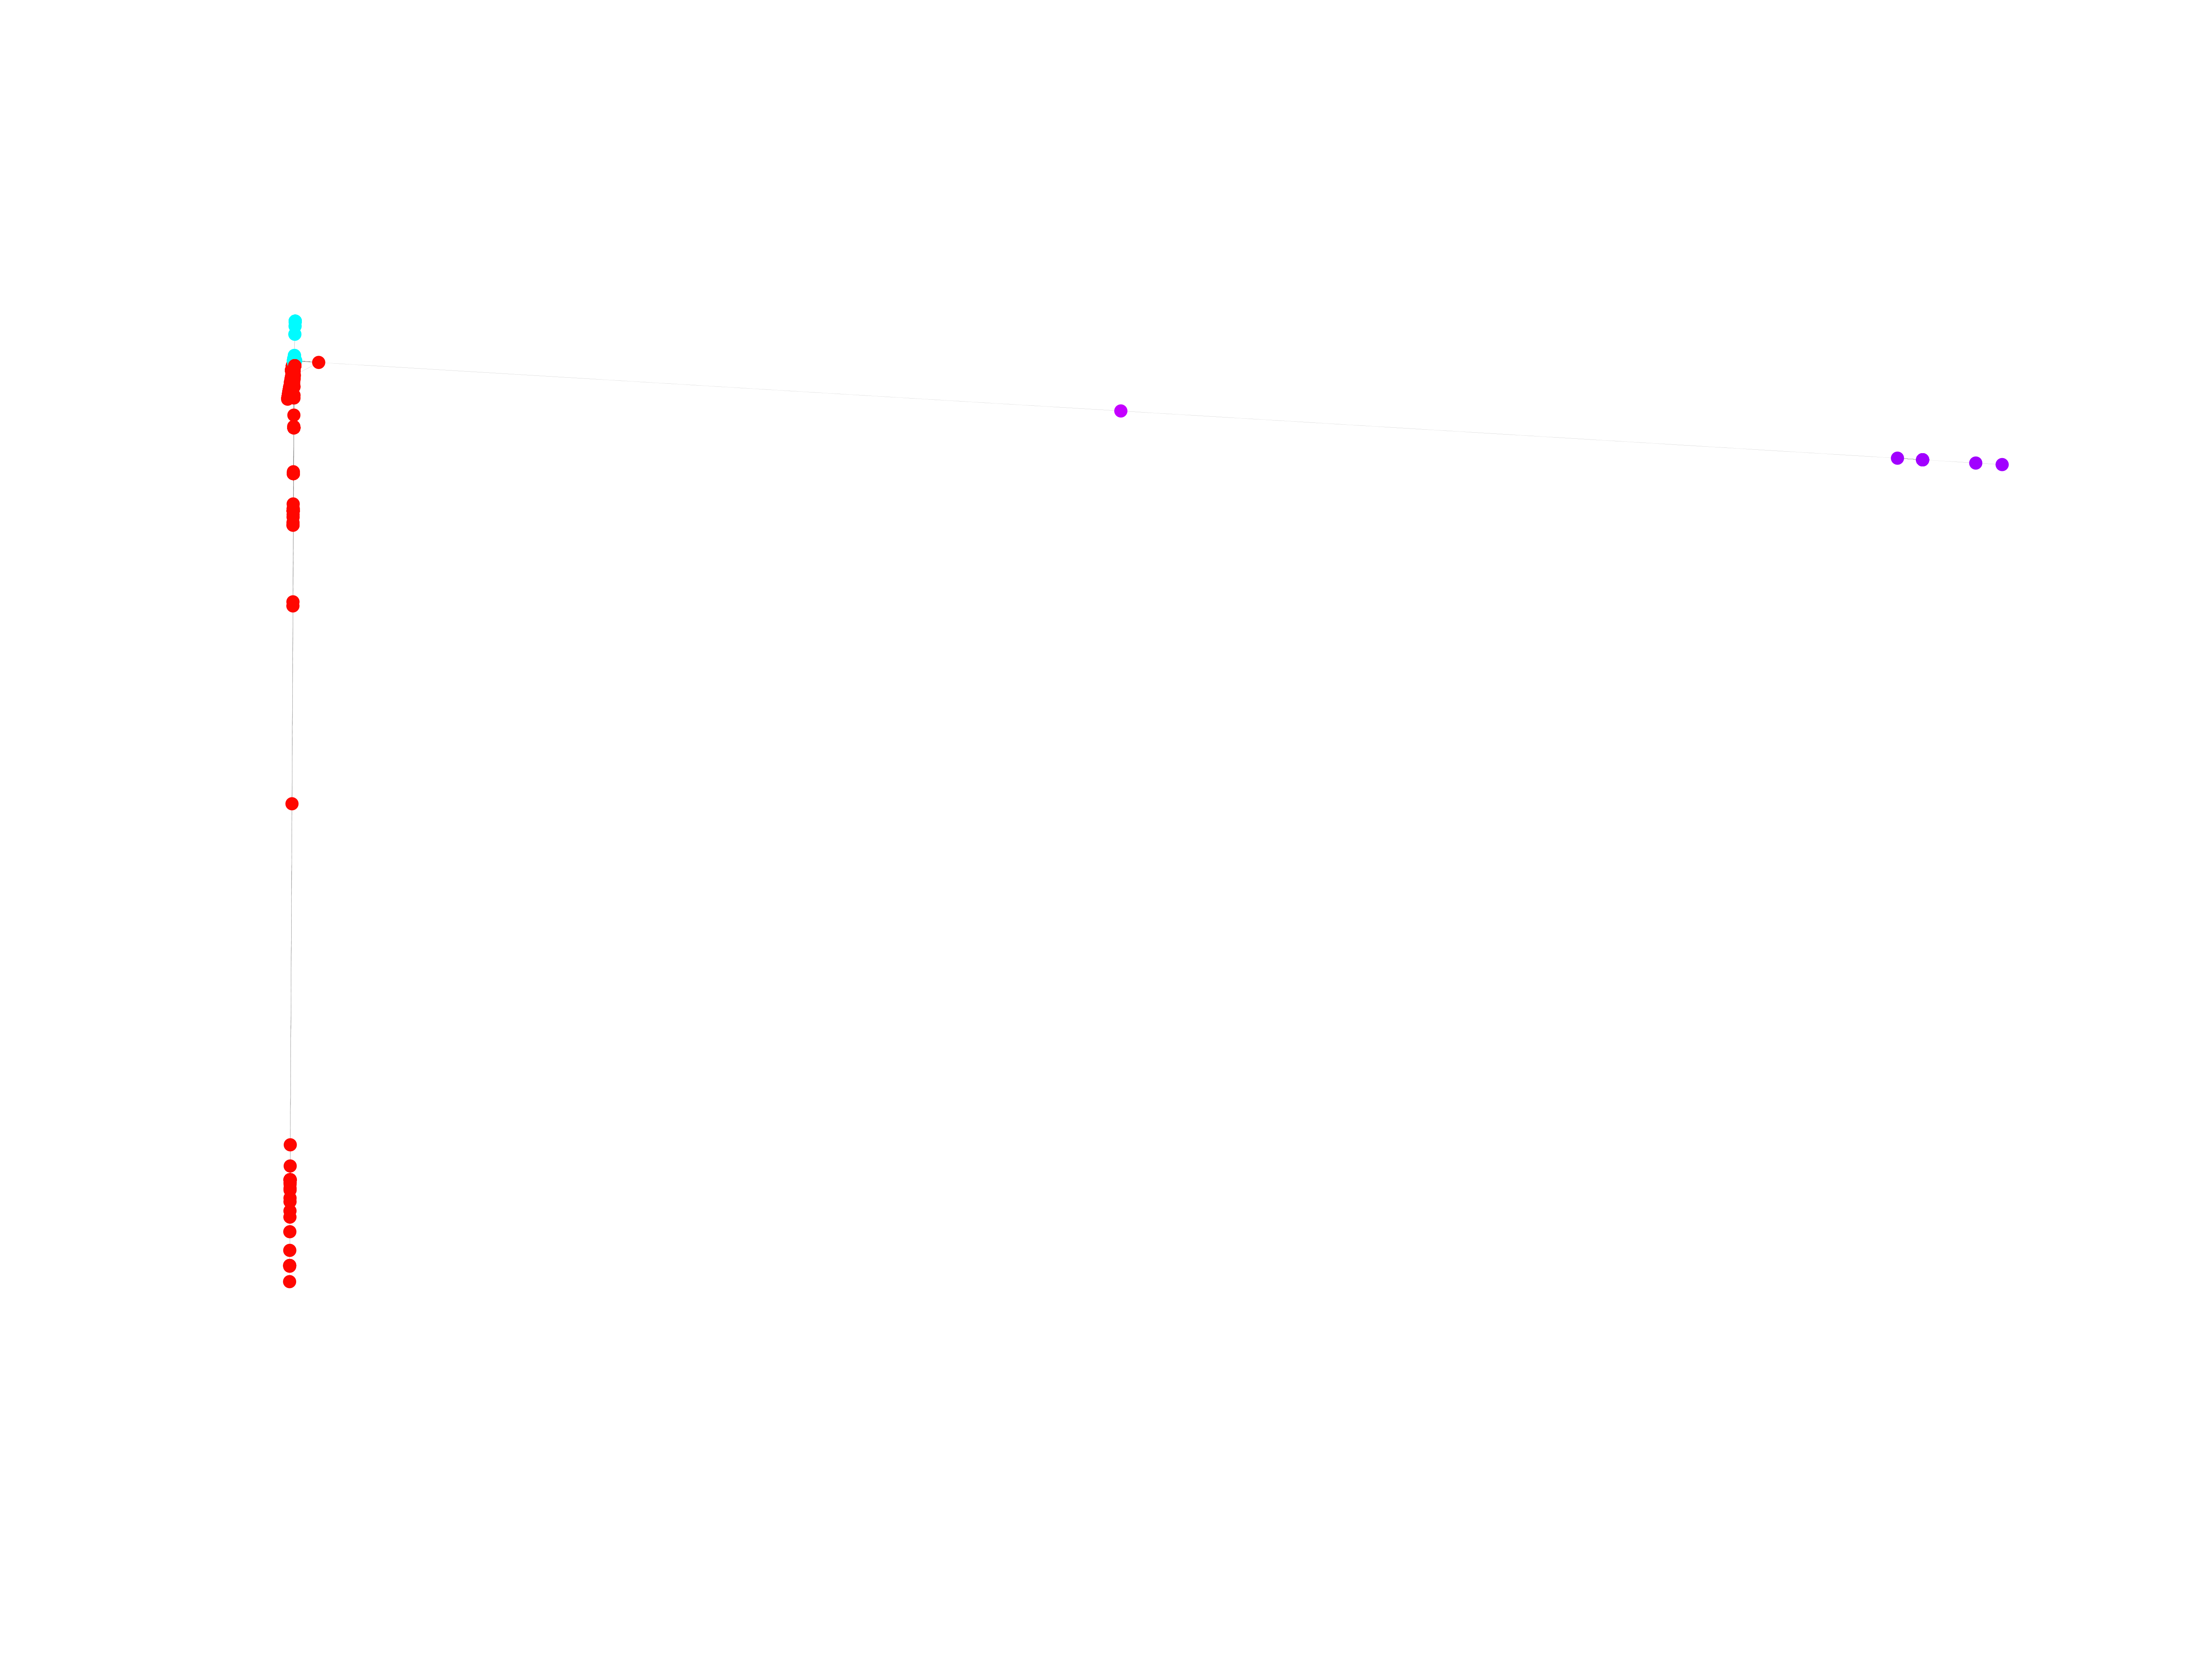
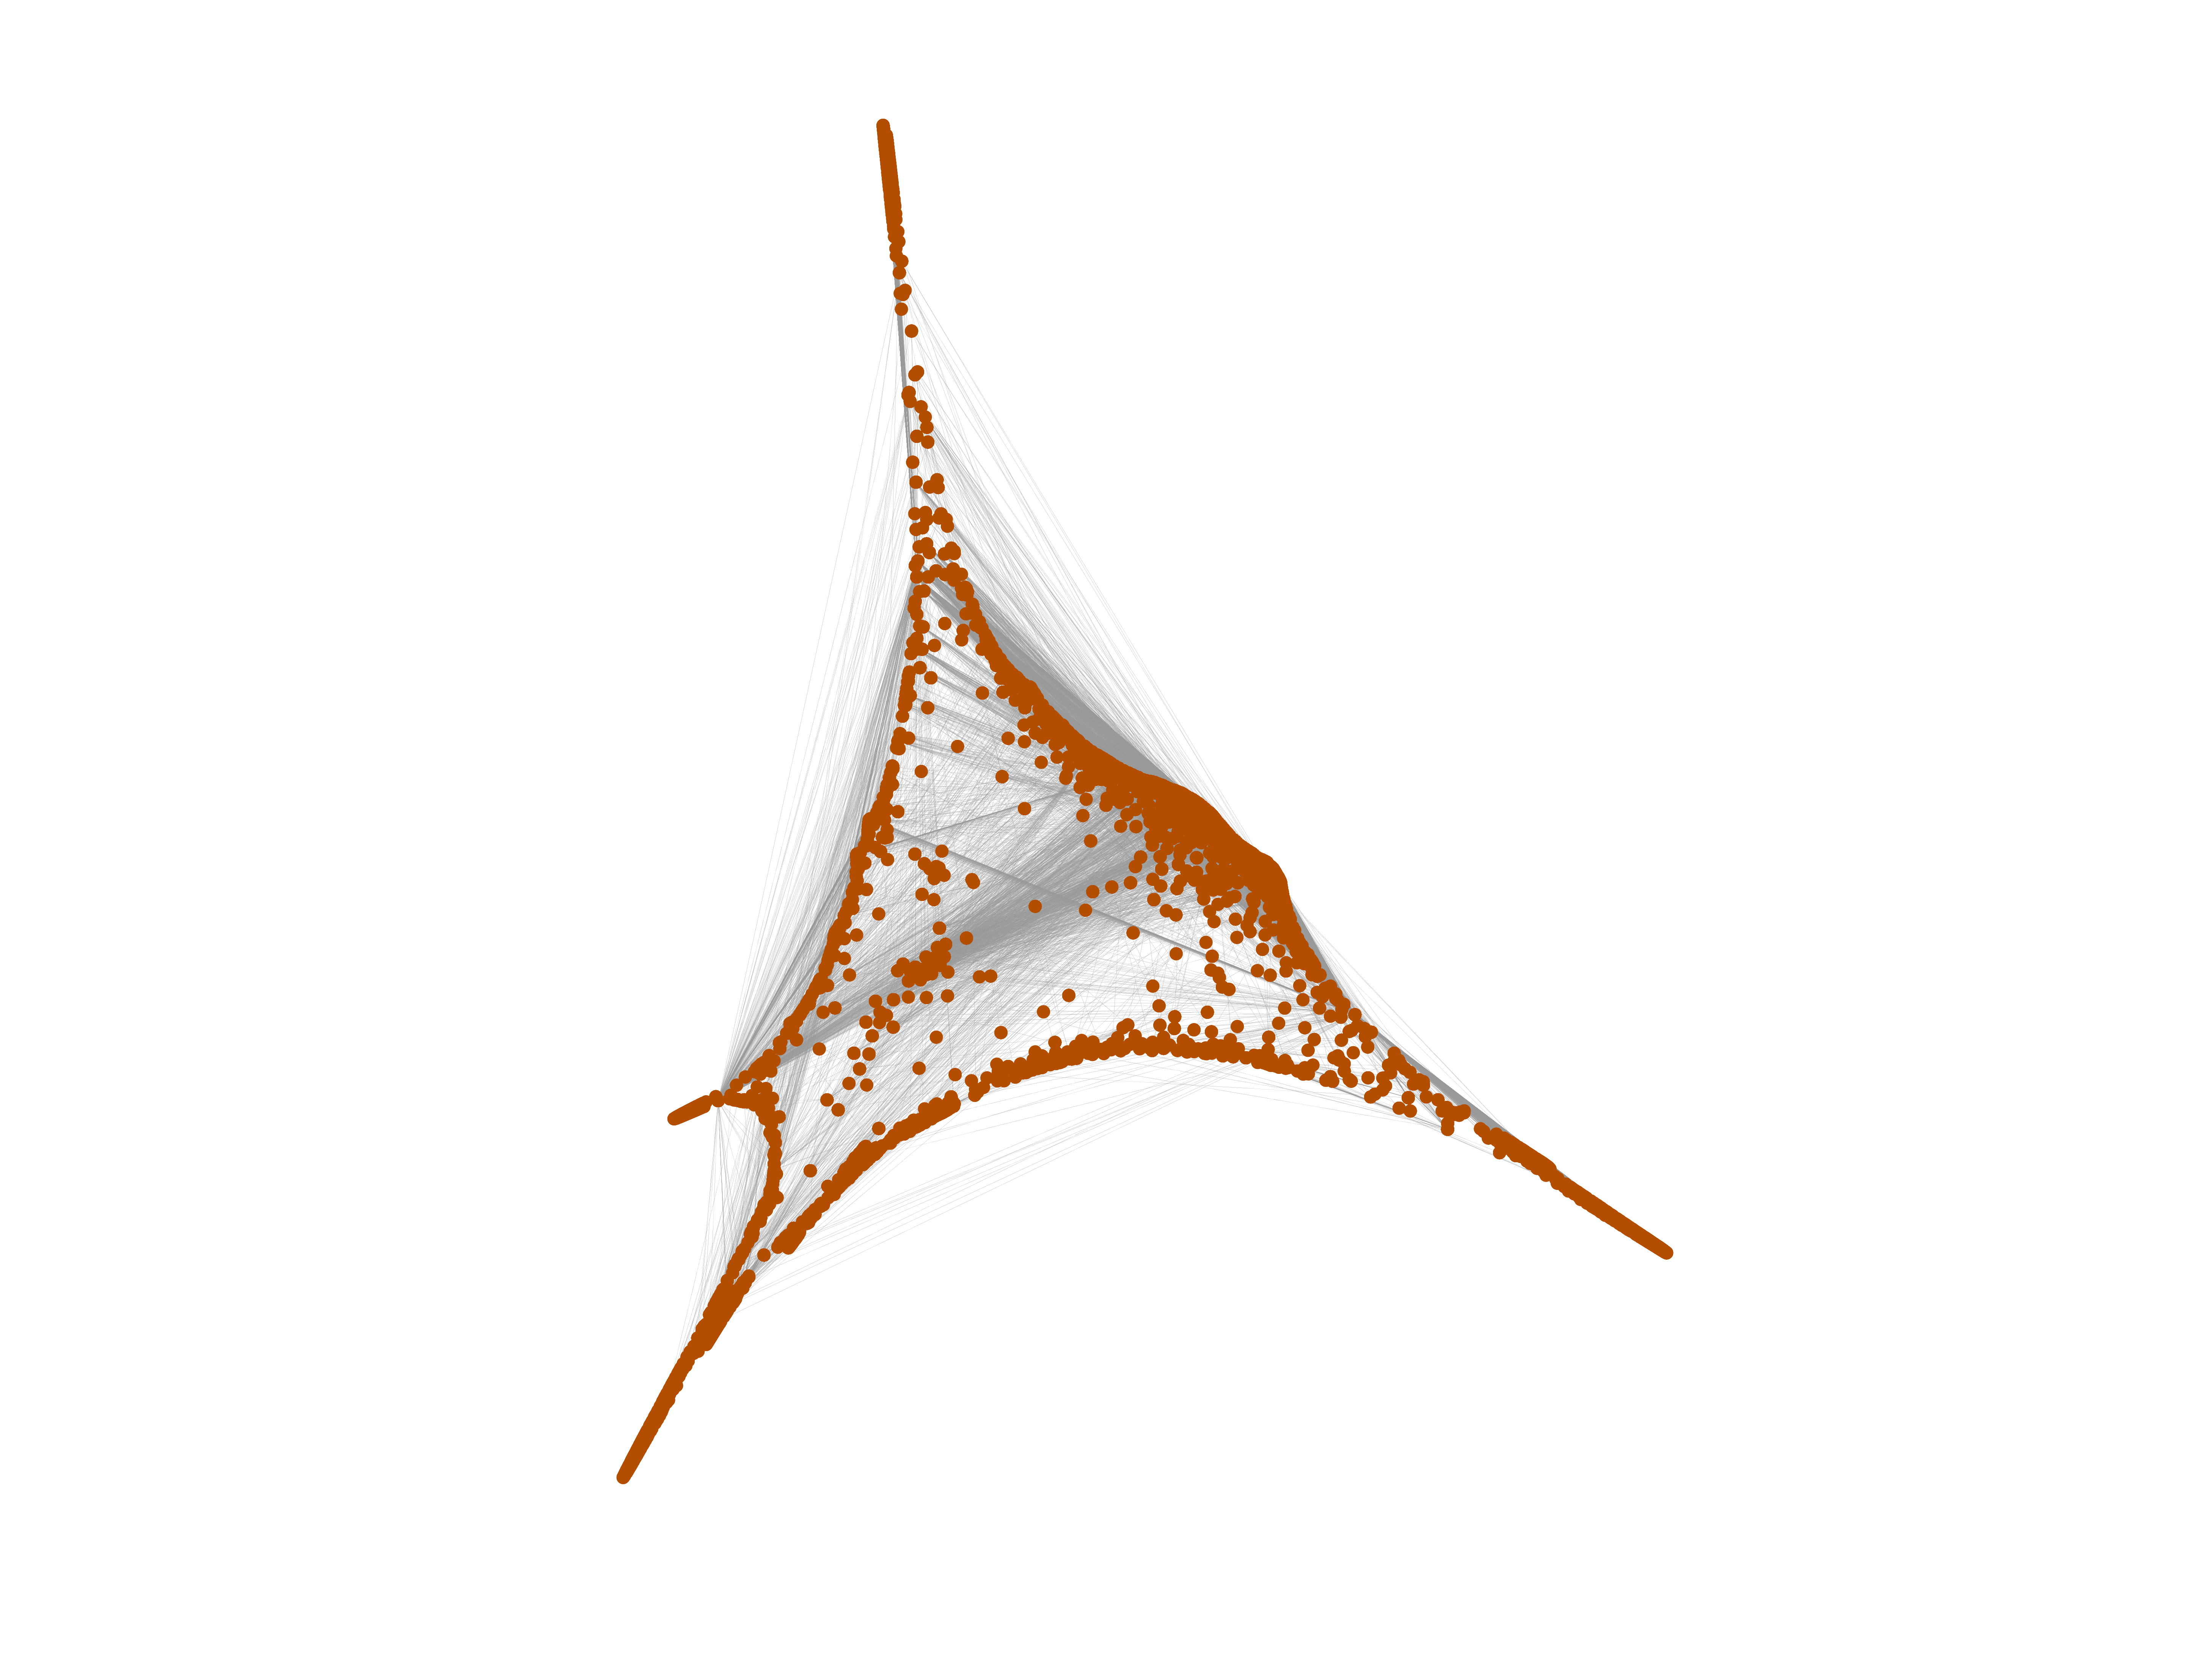
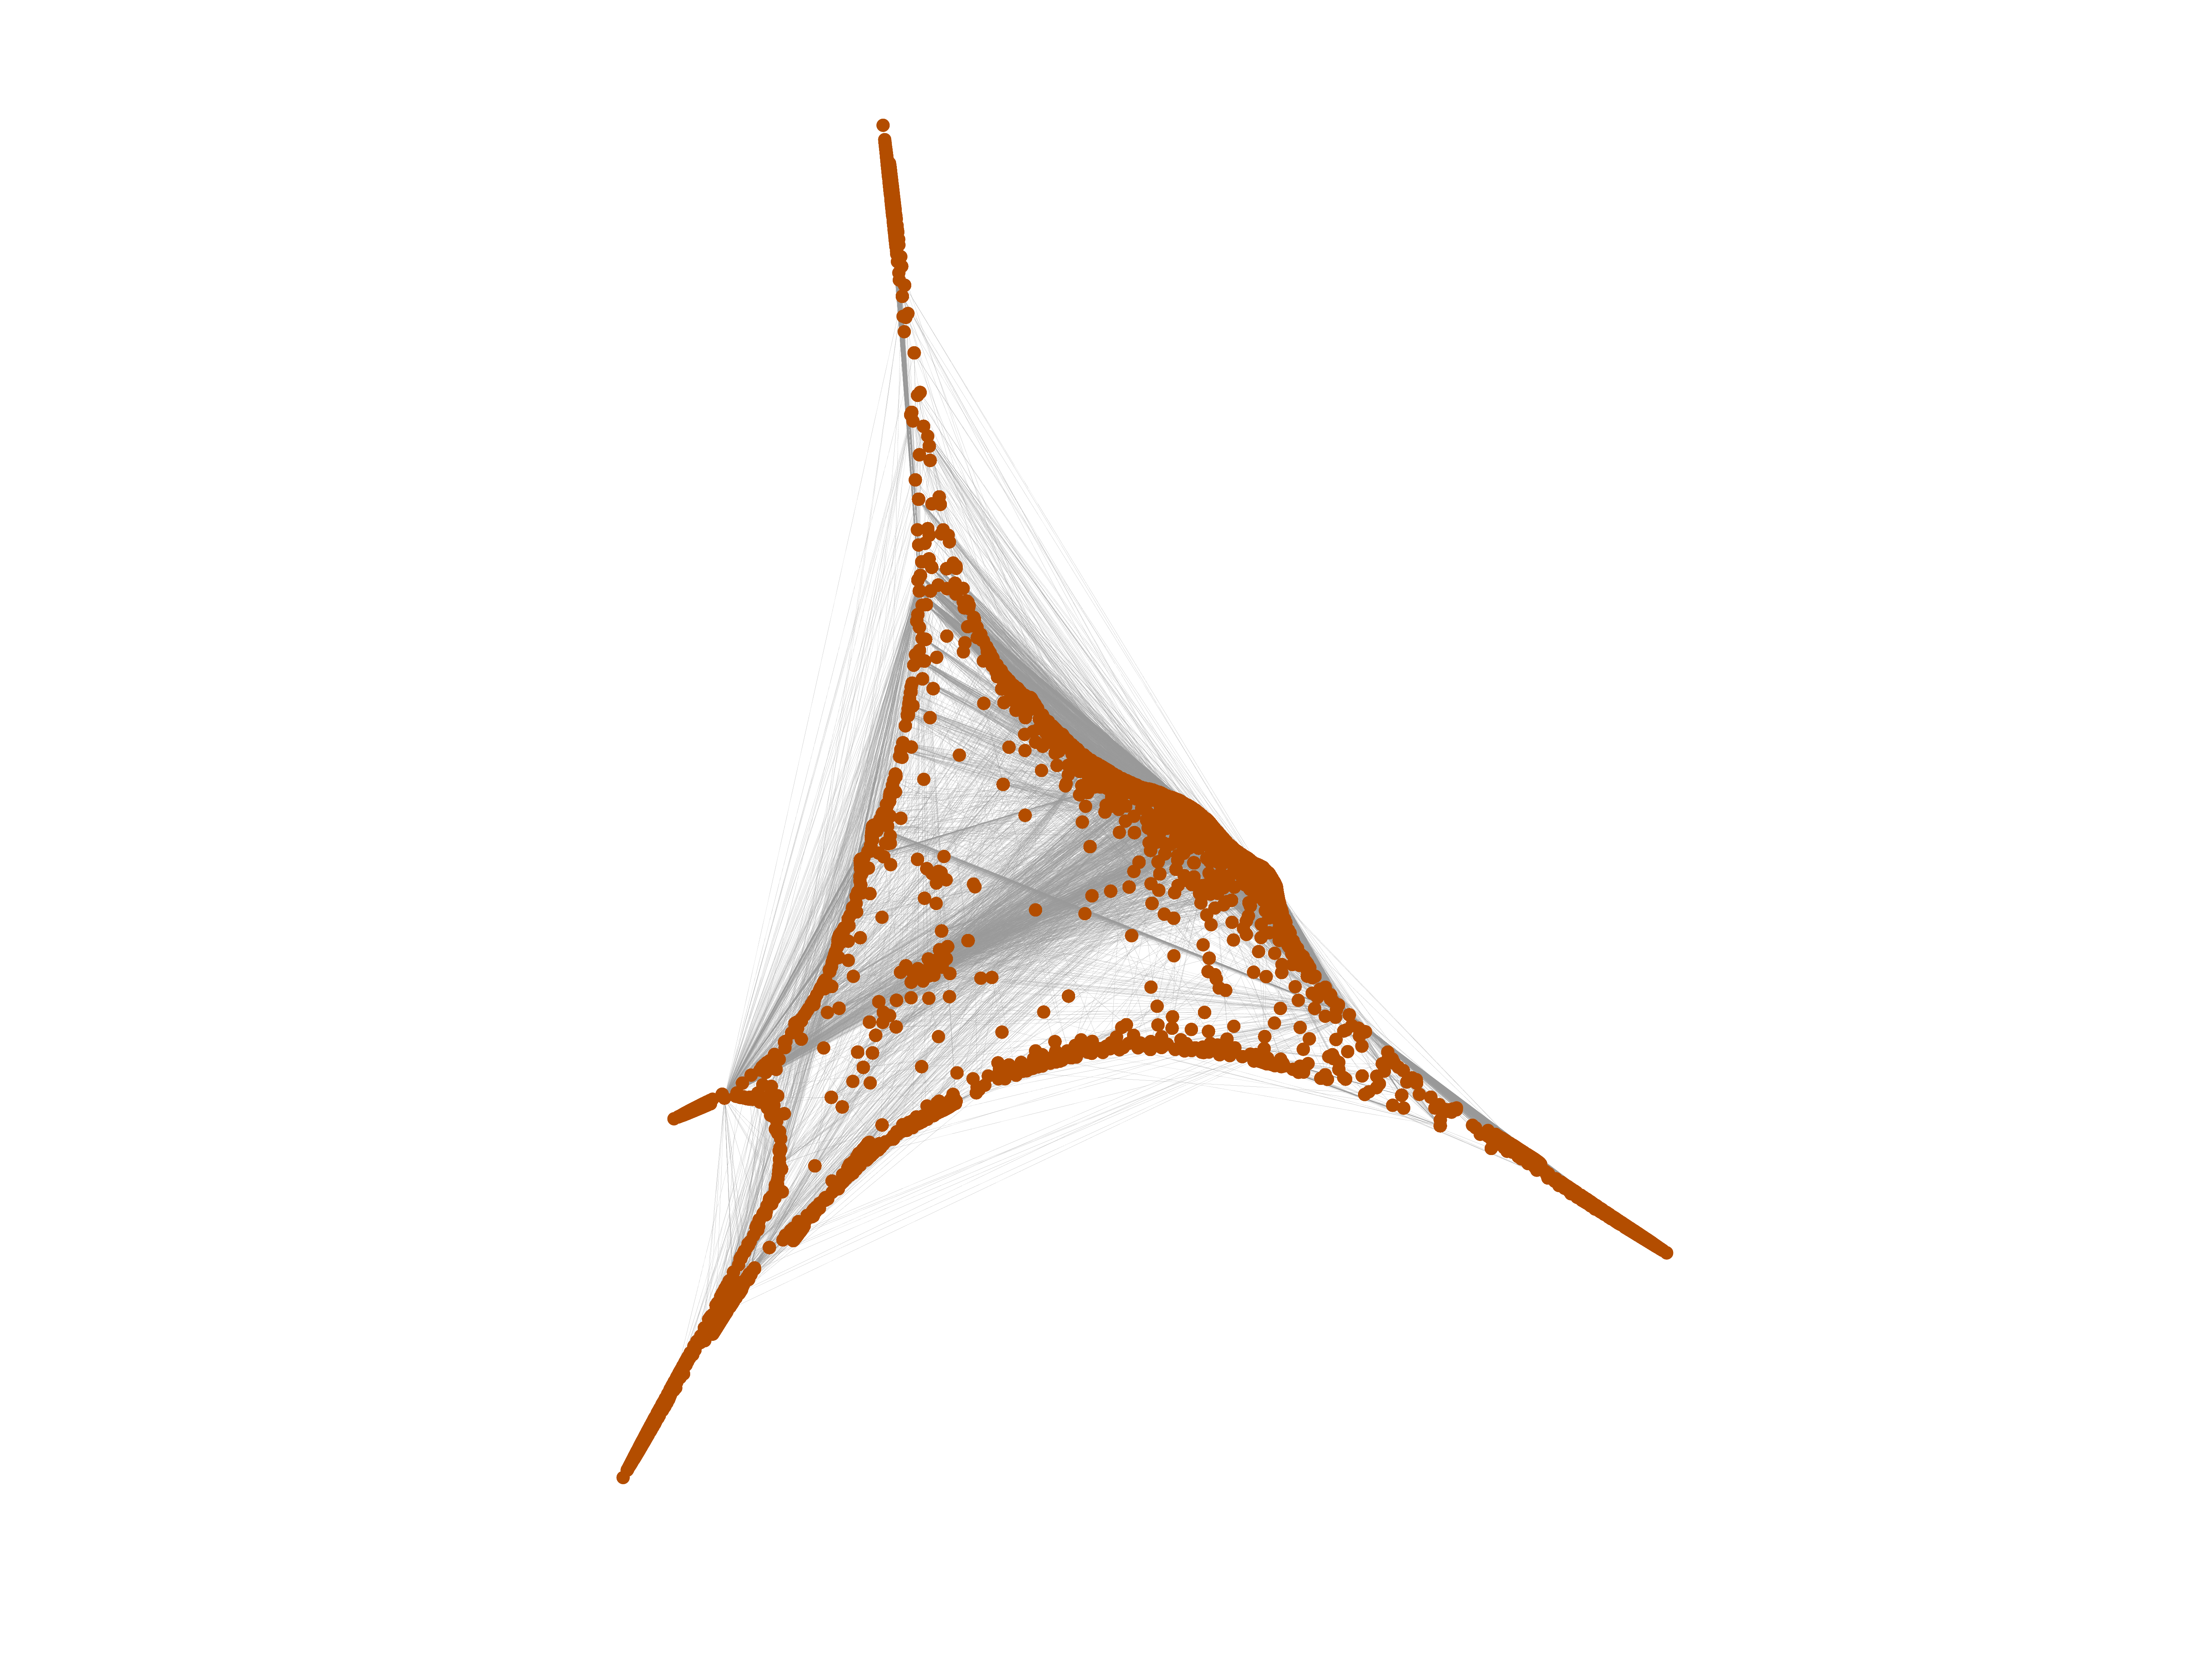
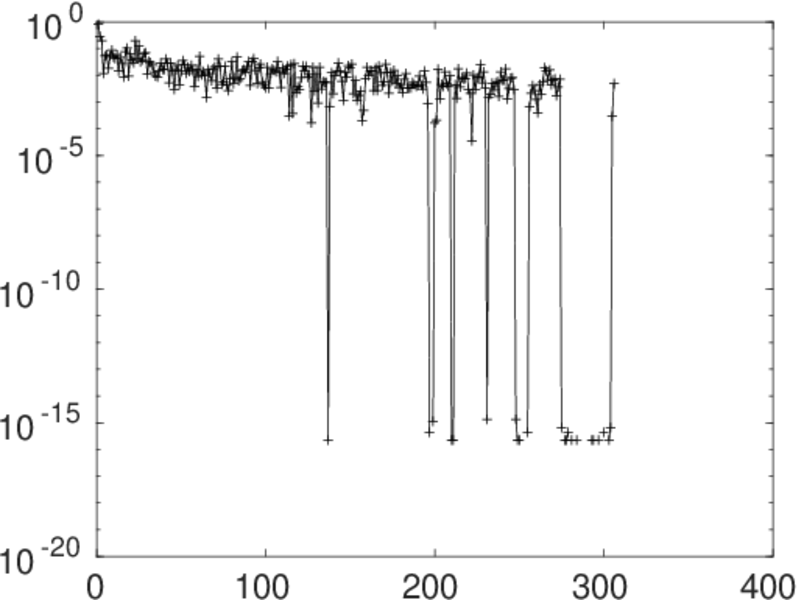
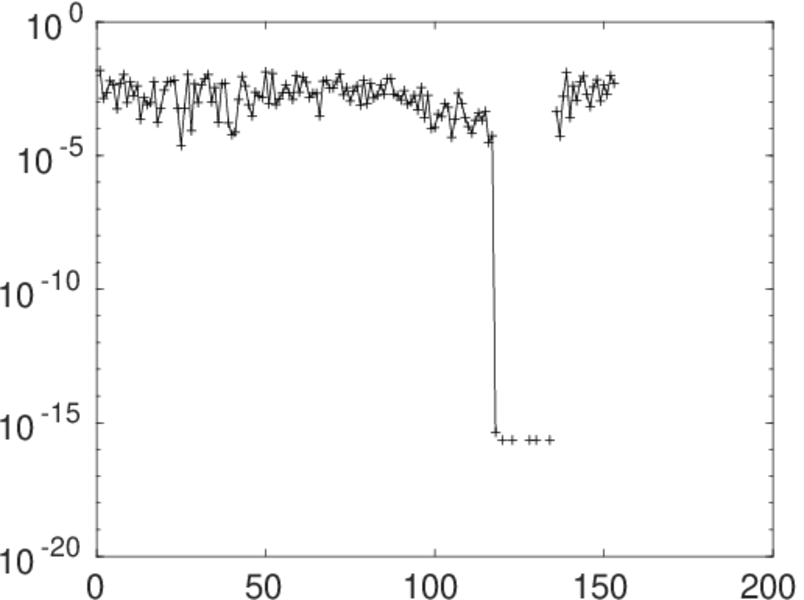
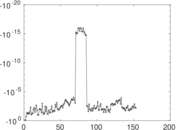
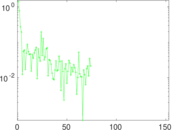
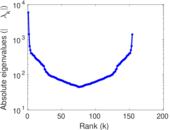
Matrix decompositions plots


Downloads
References
|
[1]
|
Jérôme Kunegis.
KONECT – The Koblenz Network Collection.
In Proc. Int. Conf. on World Wide Web Companion, pages
1343–1350, 2013.
[ http ]
|
|
[2]
|
Wikimedia Foundation.
Wikimedia downloads.
http://dumps.wikimedia.org/, January 2010.
|
 KONECT ‣ Networks ‣
Buy Me a Coffee
KONECT ‣ Networks ‣
Buy Me a Coffee