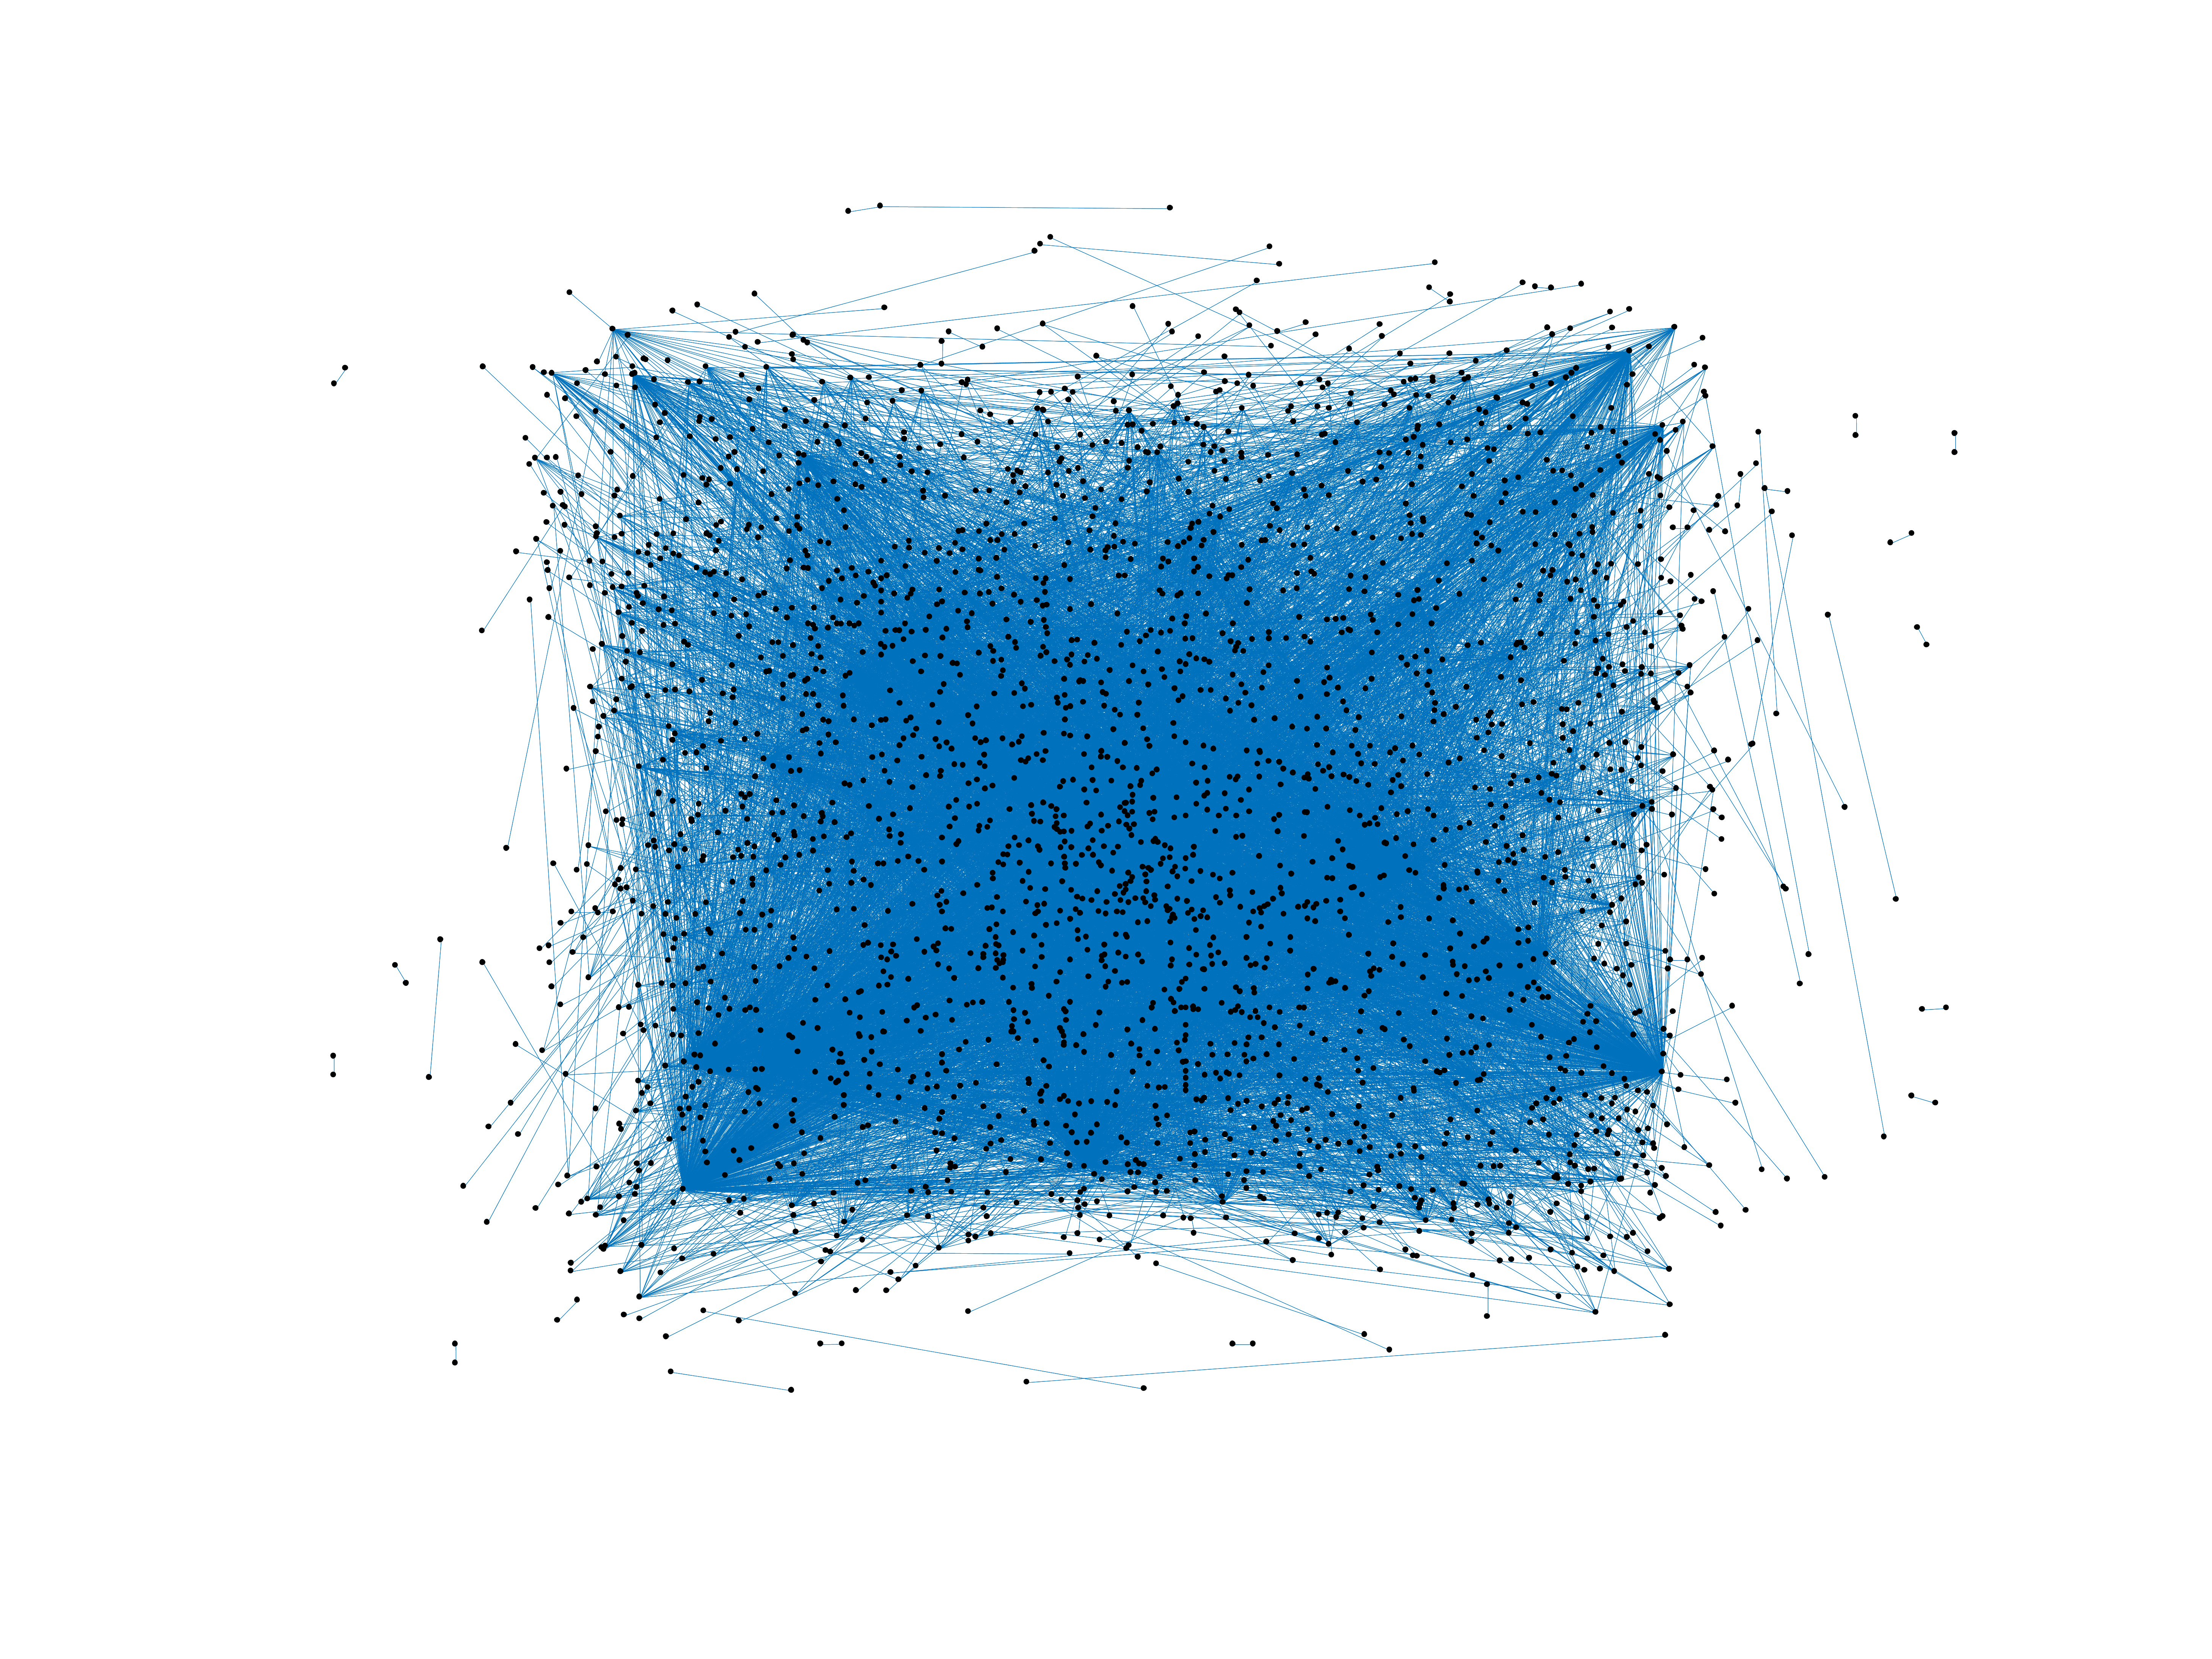
Wikipedia edits (ik)
This is the bipartite edit network of the Inupiaq Wikipedia. It contains users
and pages from the Inupiaq Wikipedia, connected by edit events. Each edge
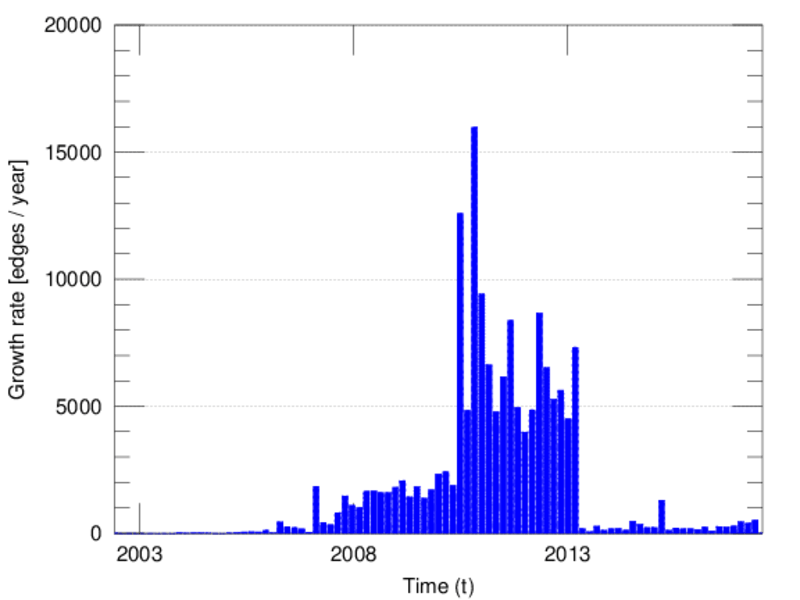
represents an edit. The dataset includes the timestamp of each edit.
Metadata
Statistics
| Size | n = | 2,836
|
| Left size | n1 = | 590
|
| Right size | n2 = | 2,246
|
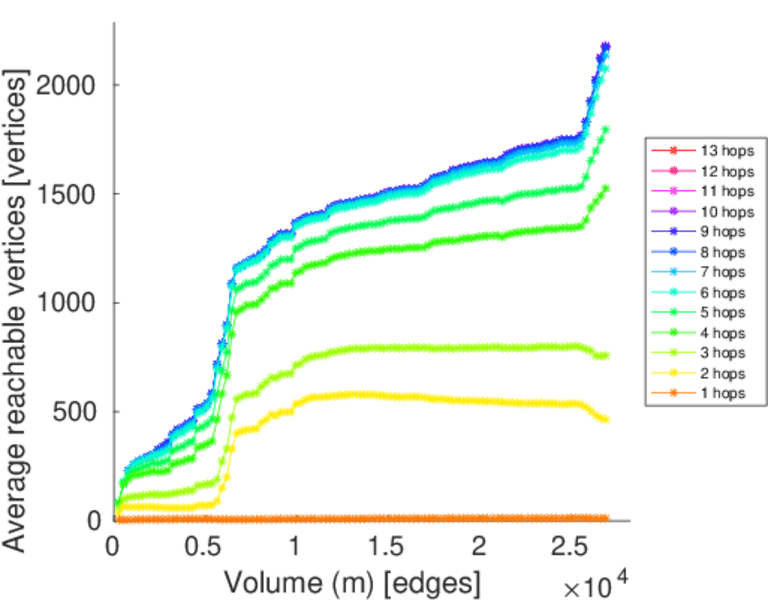
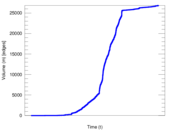
| Volume | m = | 26,843
|
| Unique edge count | m̿ = | 11,165
|
| Wedge count | s = | 1,708,625
|
| Claw count | z = | 287,414,090
|
| Cross count | x = | 46,584,257,365
|
| Square count | q = | 4,733,283
|
| 4-Tour count | T4 = | 44,729,458
|
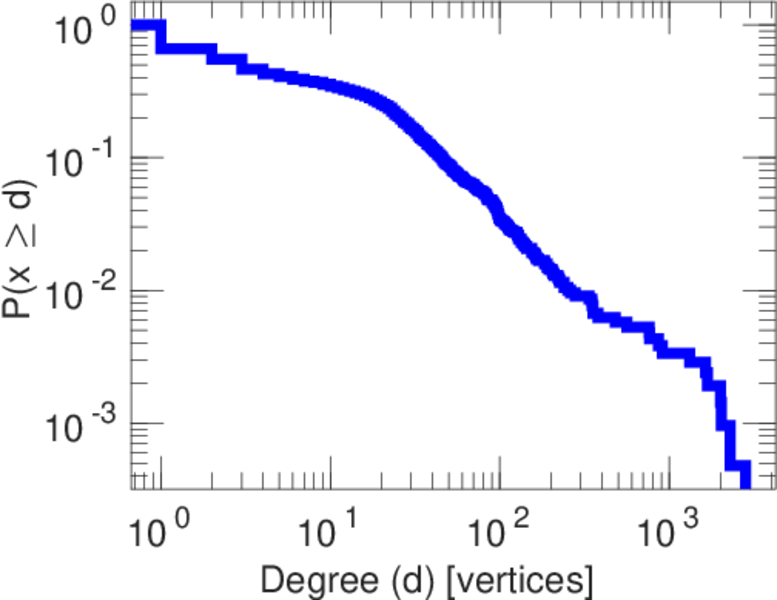
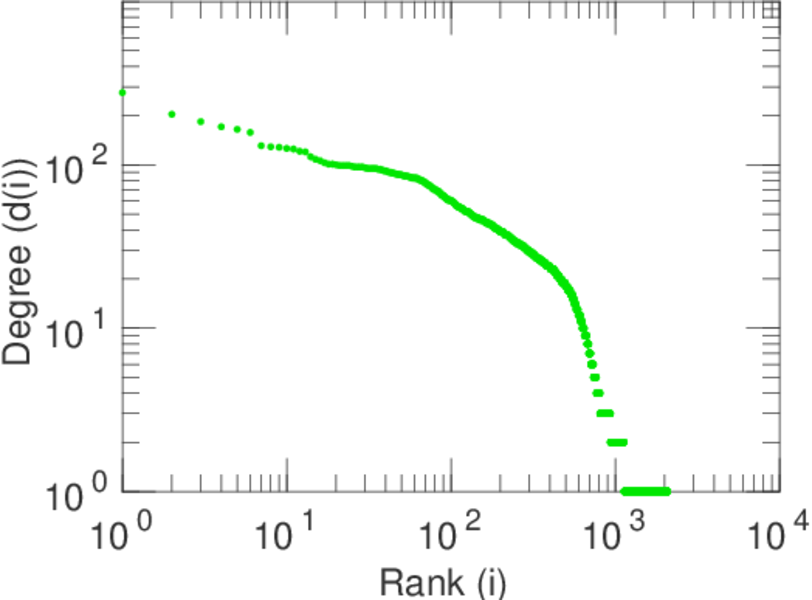
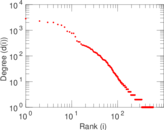
| Maximum degree | dmax = | 2,818
|
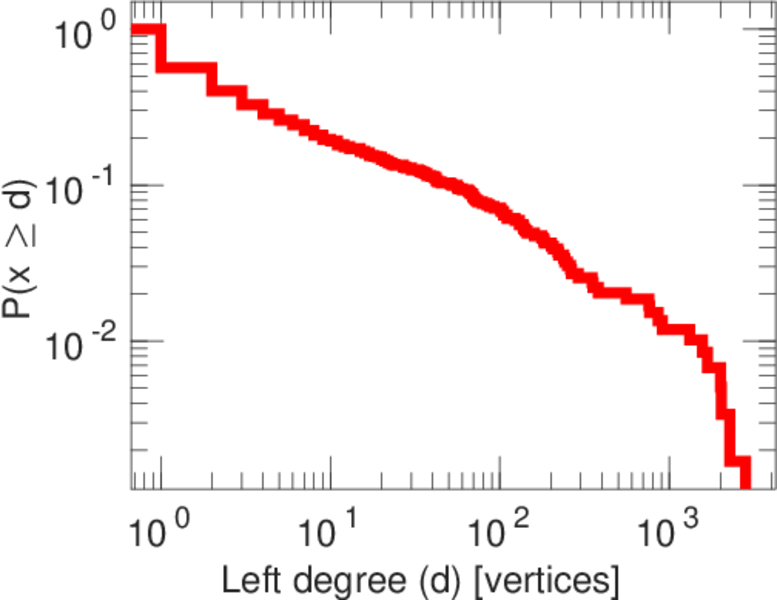
| Maximum left degree | d1max = | 2,818
|
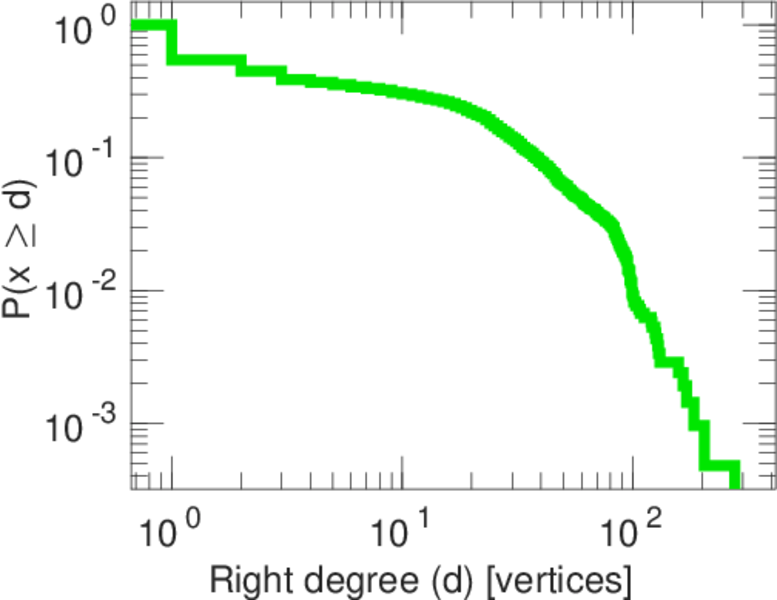
| Maximum right degree | d2max = | 277
|
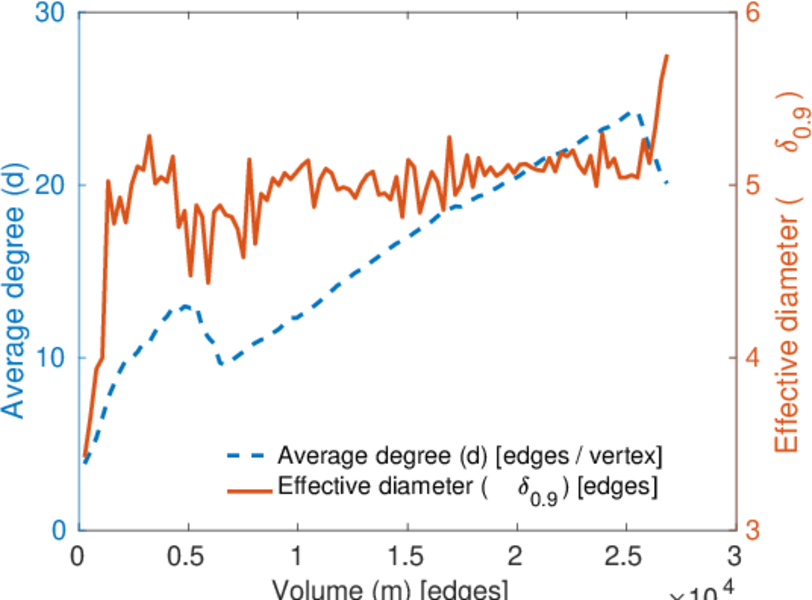
| Average degree | d = | 18.930 2
|
| Average left degree | d1 = | 45.496 6
|
| Average right degree | d2 = | 11.951 5
|
| Fill | p = | 0.008 425 52
|
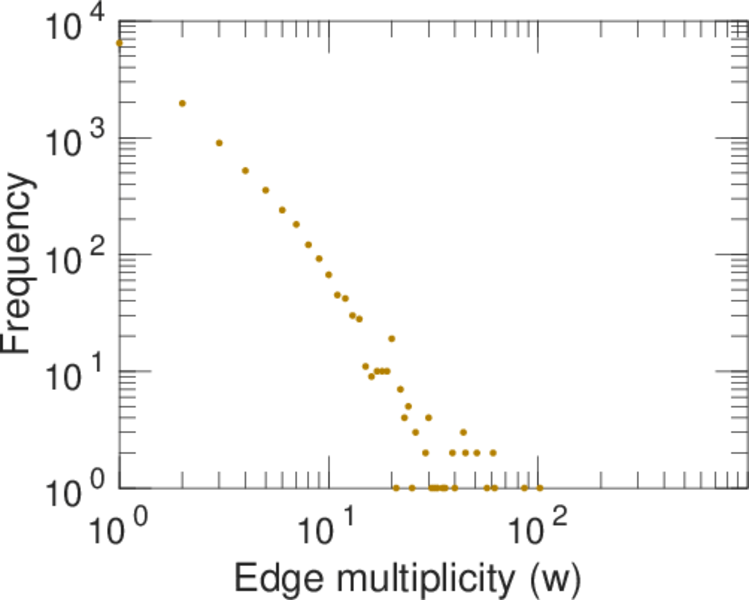
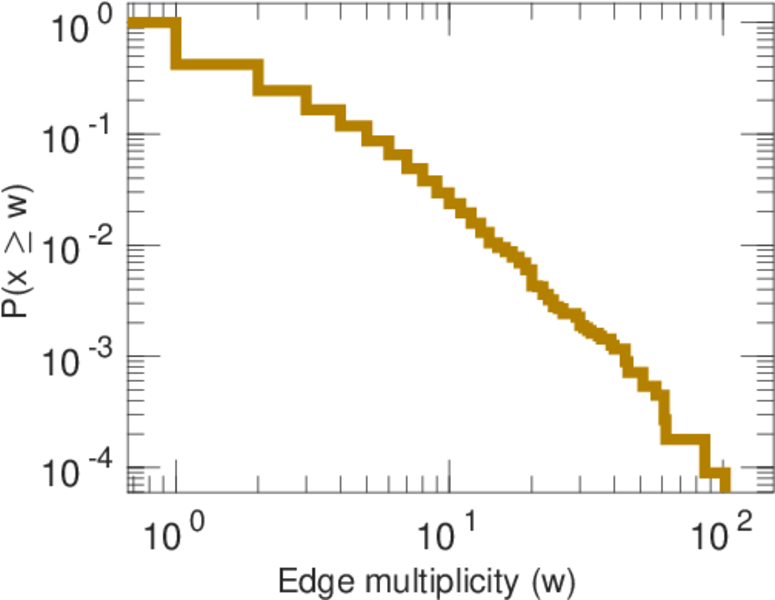
| Average edge multiplicity | m̃ = | 2.404 21
|
| Size of LCC | N = | 2,174
|
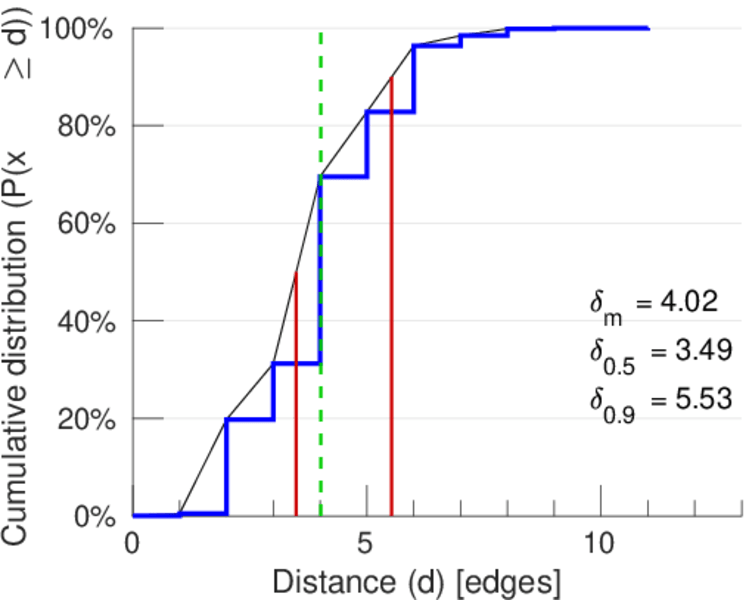
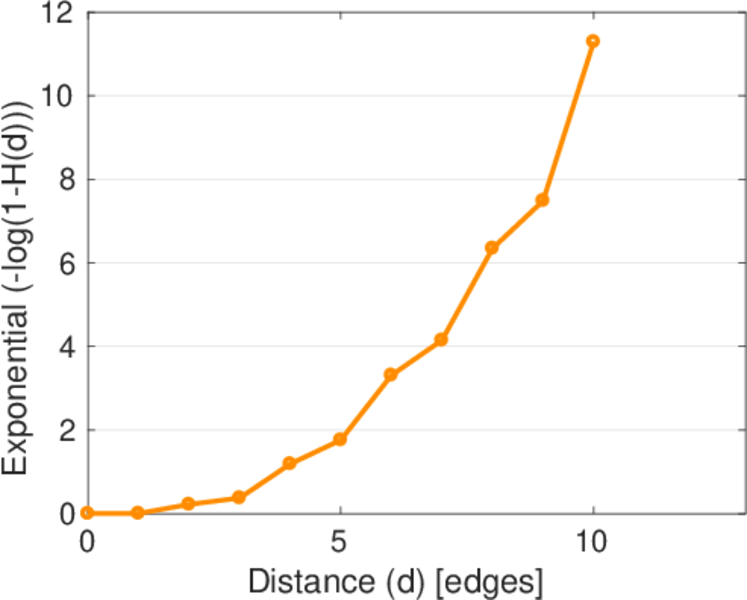
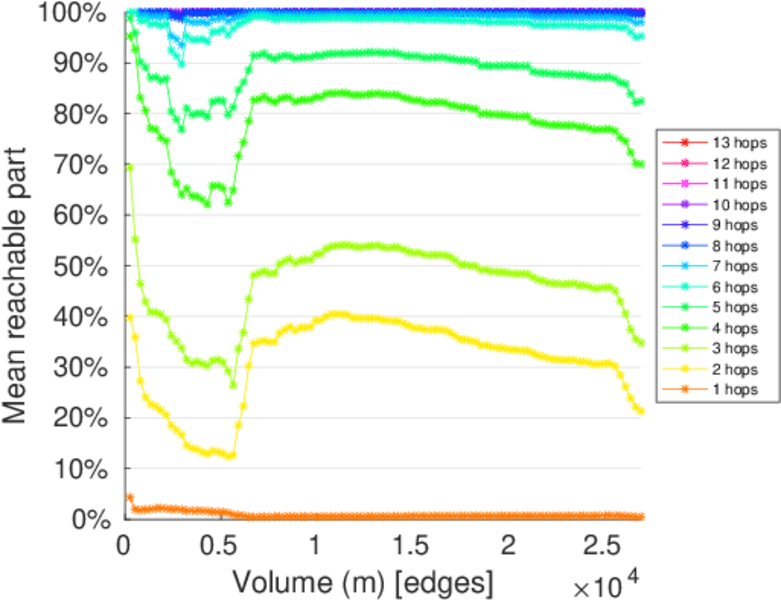
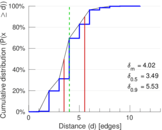
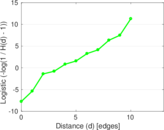
| Diameter | δ = | 13
|
| 50-Percentile effective diameter | δ0.5 = | 3.490 36
|
| 90-Percentile effective diameter | δ0.9 = | 5.531 20
|
| Median distance | δM = | 4
|
| Mean distance | δm = | 4.016 73
|
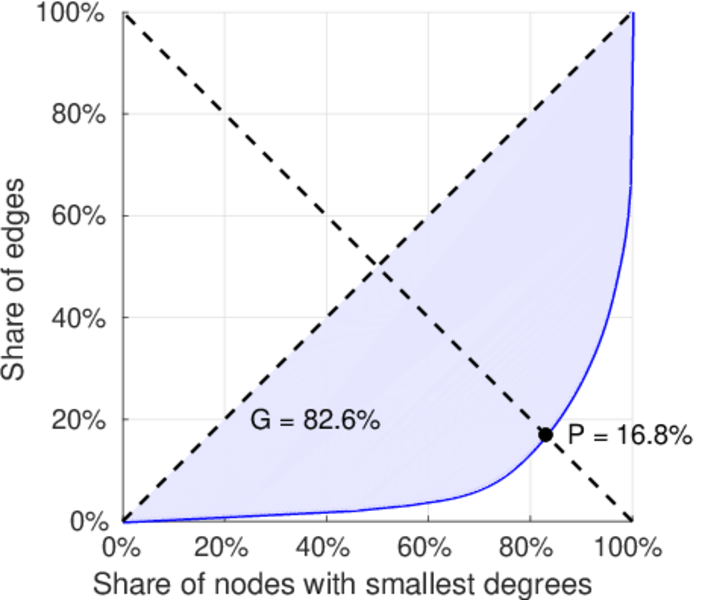
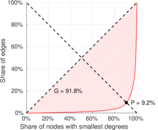
| Gini coefficient | G = | 0.812 377
|
| Balanced inequality ratio | P = | 0.179 749
|
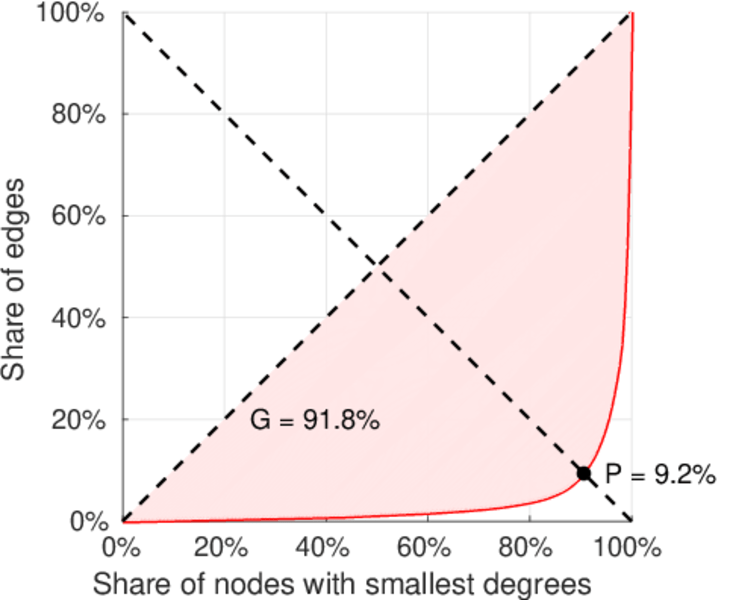
| Left balanced inequality ratio | P1 = | 0.092 314 6
|
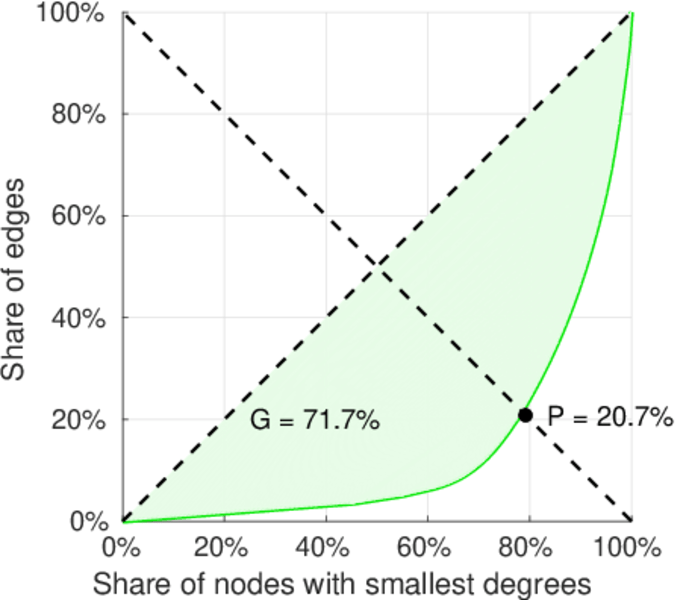
| Right balanced inequality ratio | P2 = | 0.206 572
|
| Relative edge distribution entropy | Her = | 0.804 119
|
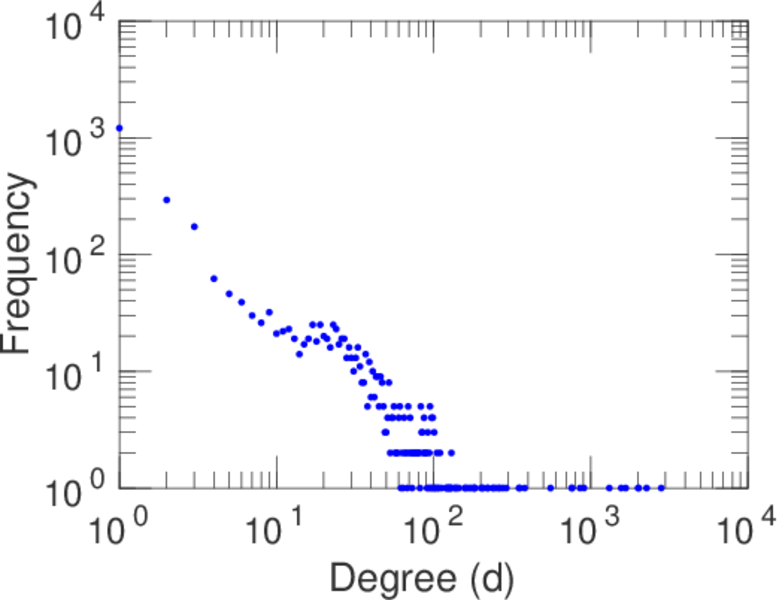
| Power law exponent | γ = | 2.067 61
|
| Tail power law exponent | γt = | 2.471 00
|
| Tail power law exponent with p | γ3 = | 2.471 00
|
| p-value | p = | 0.000 00
|
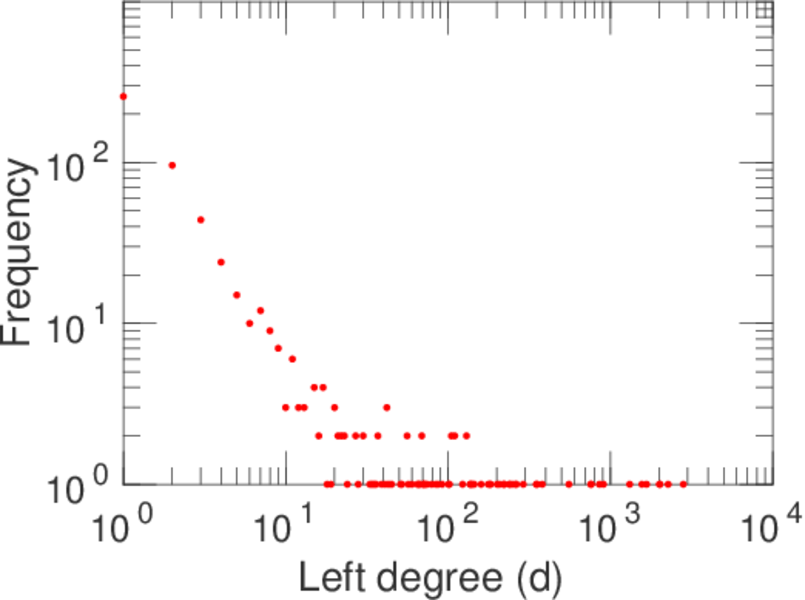
| Left tail power law exponent with p | γ3,1 = | 1.671 00
|
| Left p-value | p1 = | 0.003 000 00
|
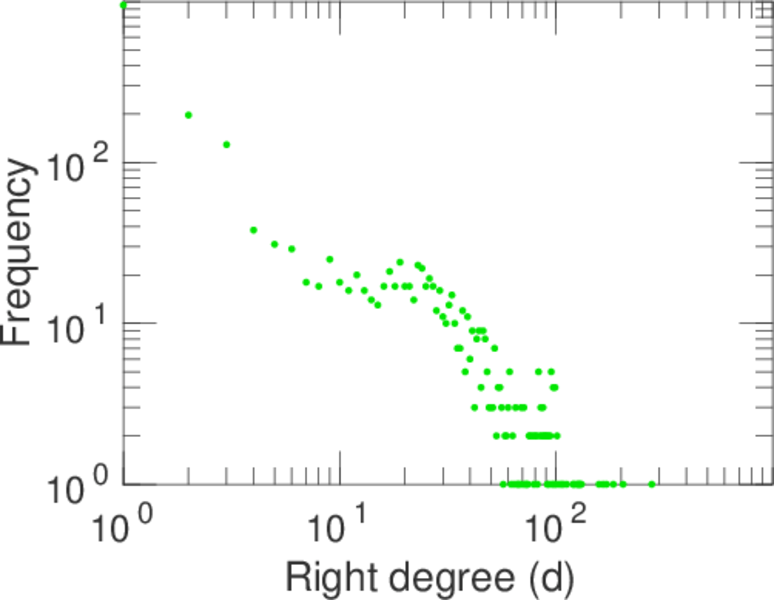
| Right tail power law exponent with p | γ3,2 = | 3.461 00
|
| Right p-value | p2 = | 0.001 000 00
|
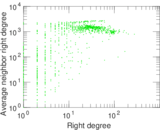
| Degree assortativity | ρ = | −0.151 708
|
| Degree assortativity p-value | pρ = | 1.793 60 × 10−58
|
| Spectral norm | α = | 259.391
|
| Algebraic connectivity | a = | 0.027 838 8
|
| Spectral separation | |λ1[A] / λ2[A]| = | 1.288 93
|
| Controllability | C = | 1,574
|
| Relative controllability | Cr = | 0.589 072
|
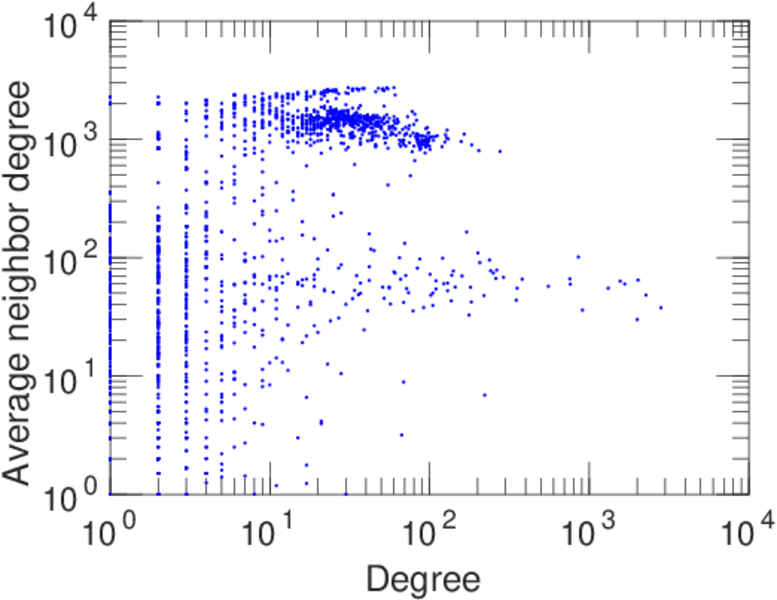
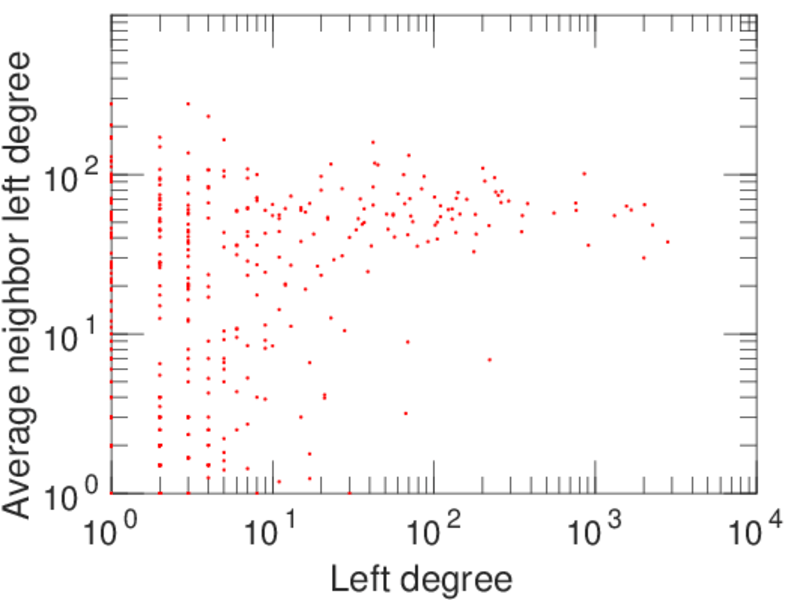
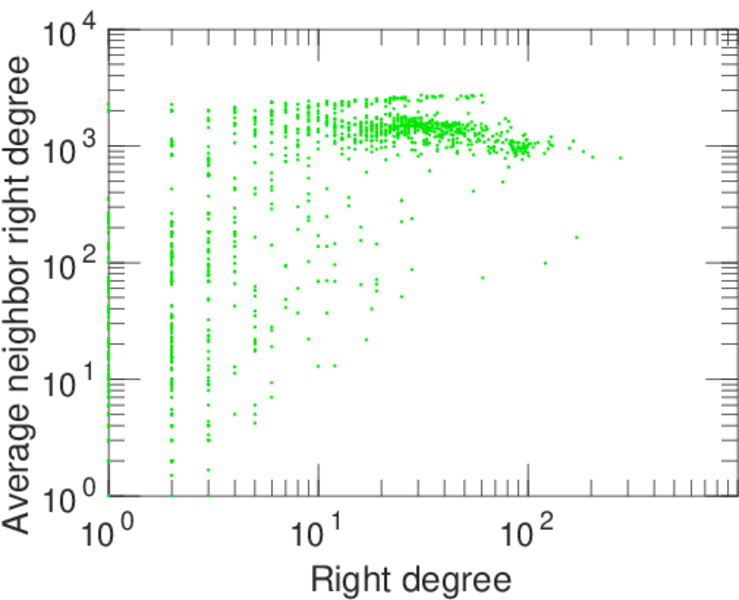
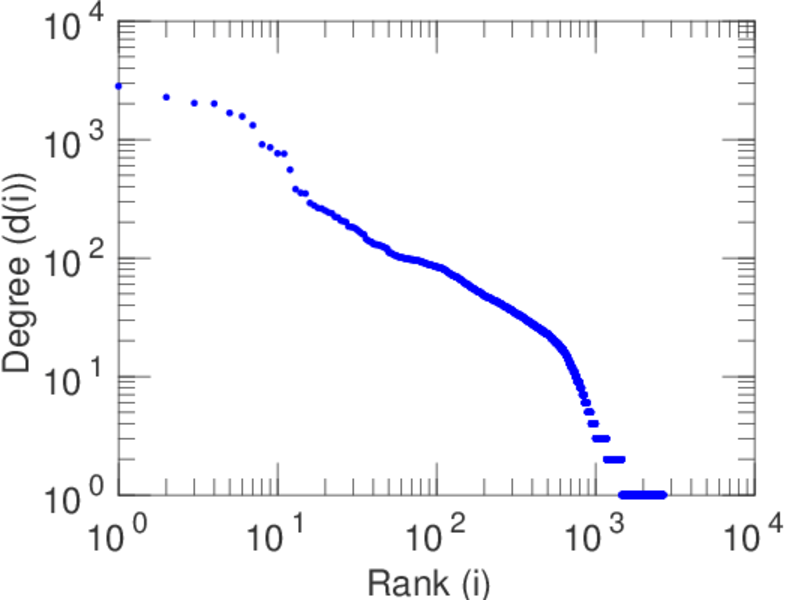
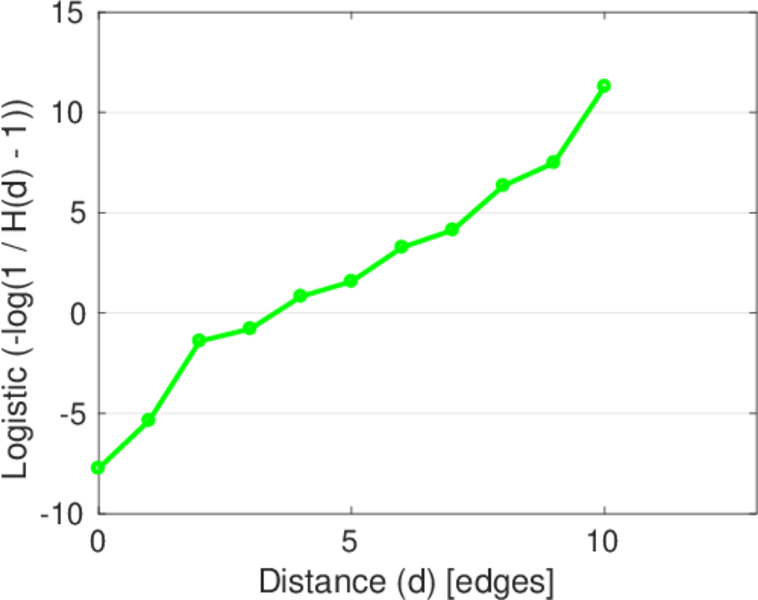
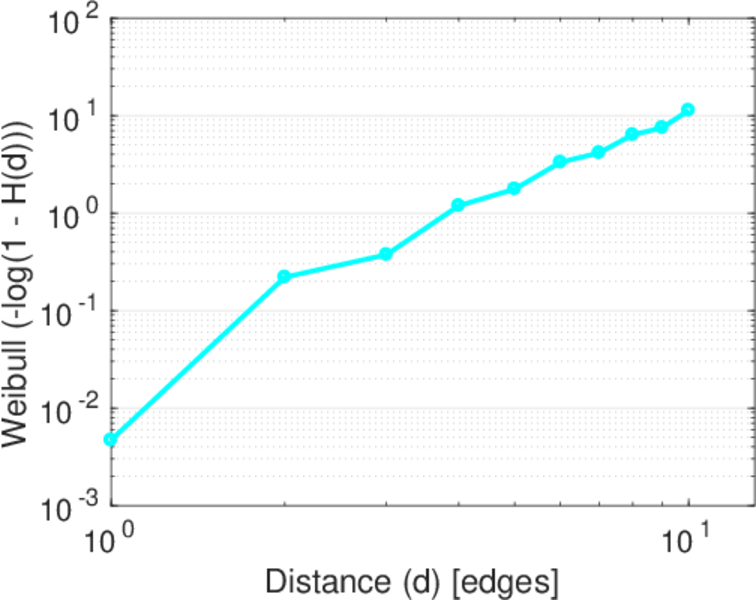
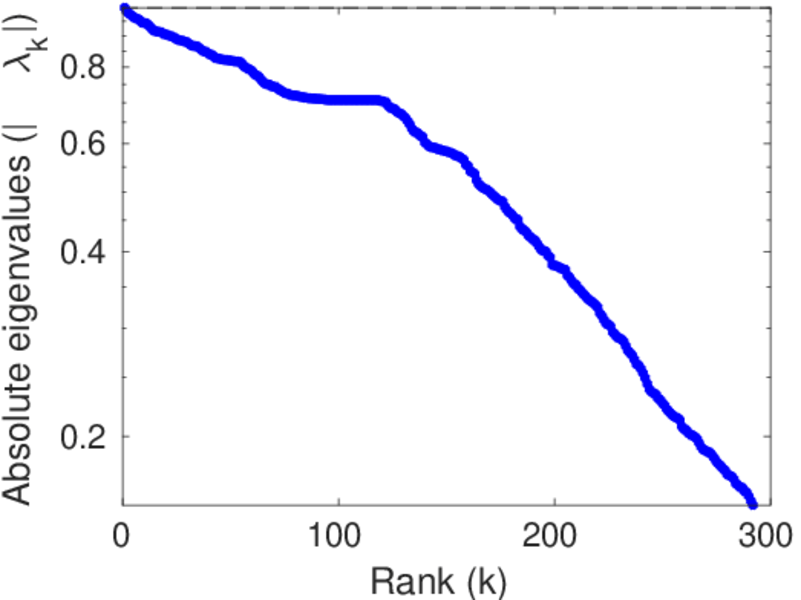
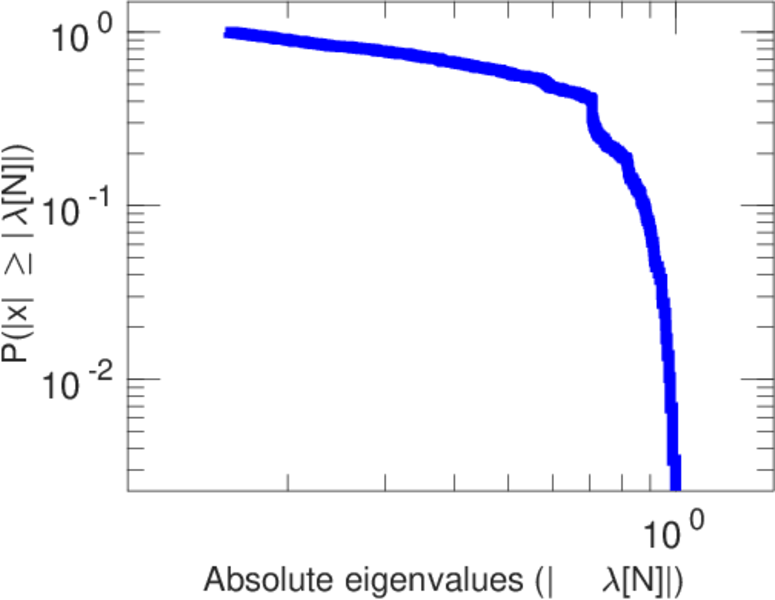
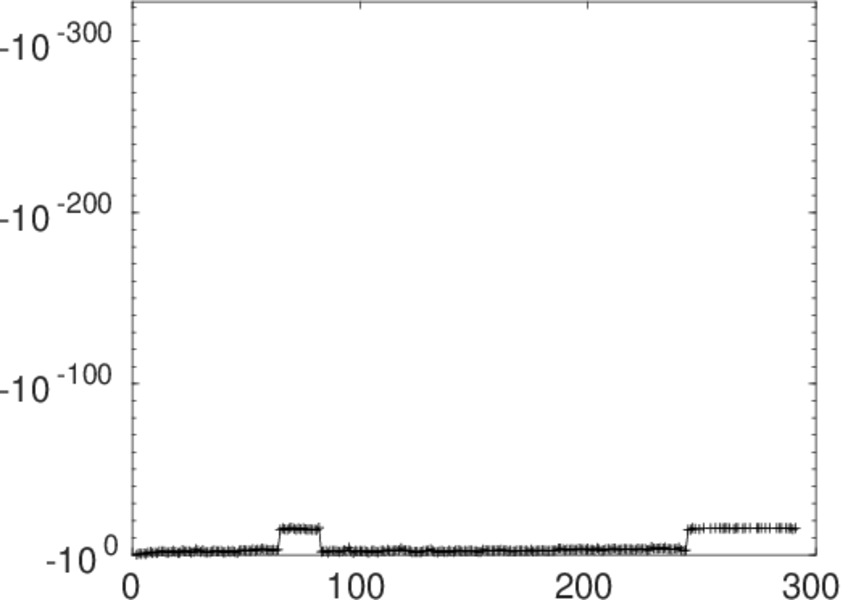
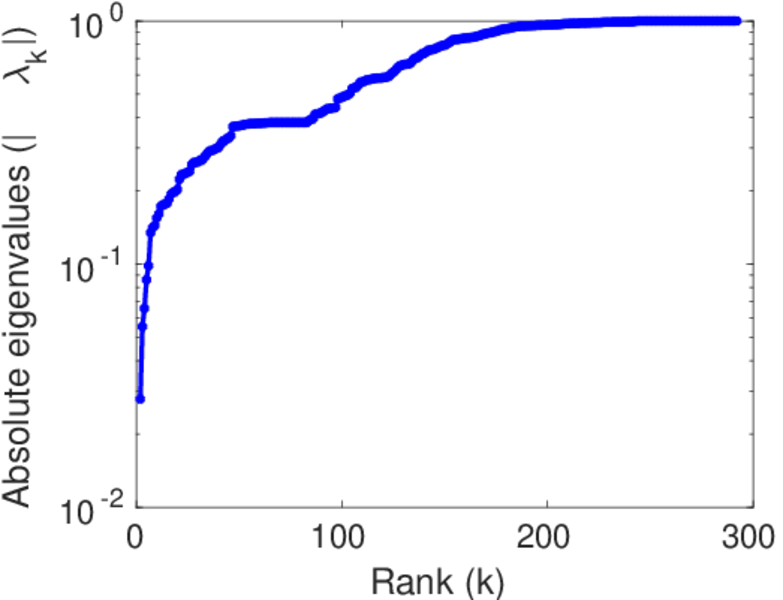
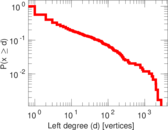
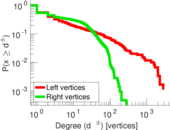
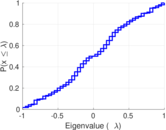
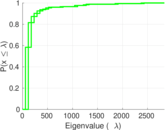
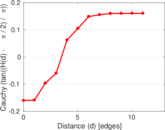
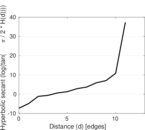
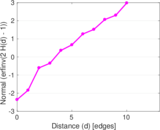
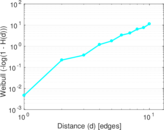
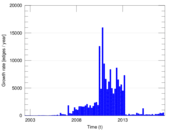
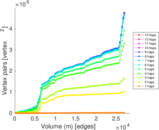
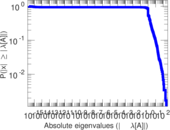
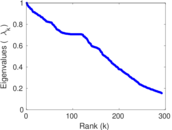
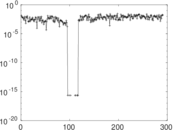
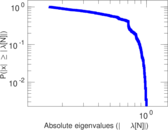
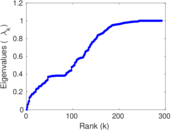
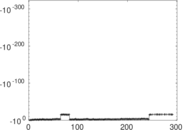
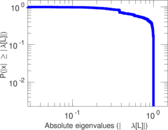
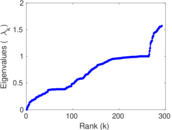
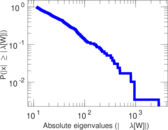
Plots


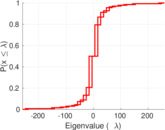
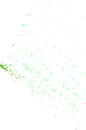


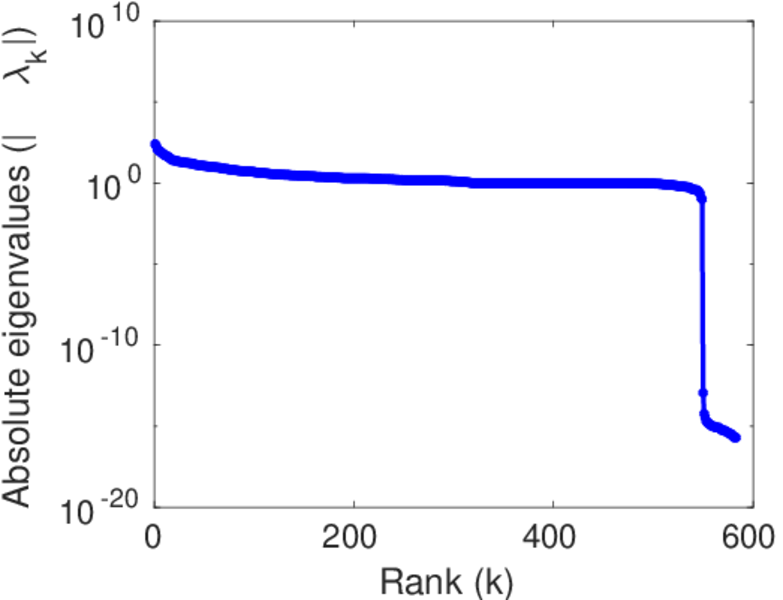
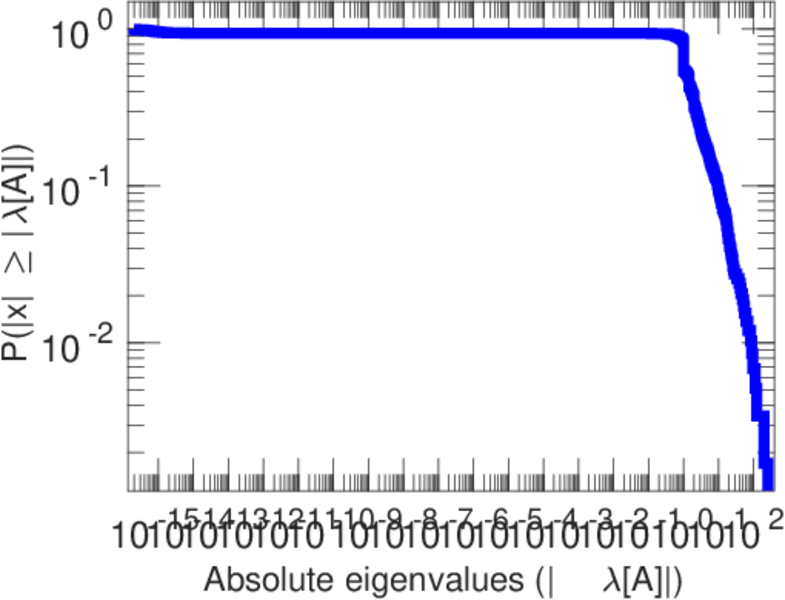
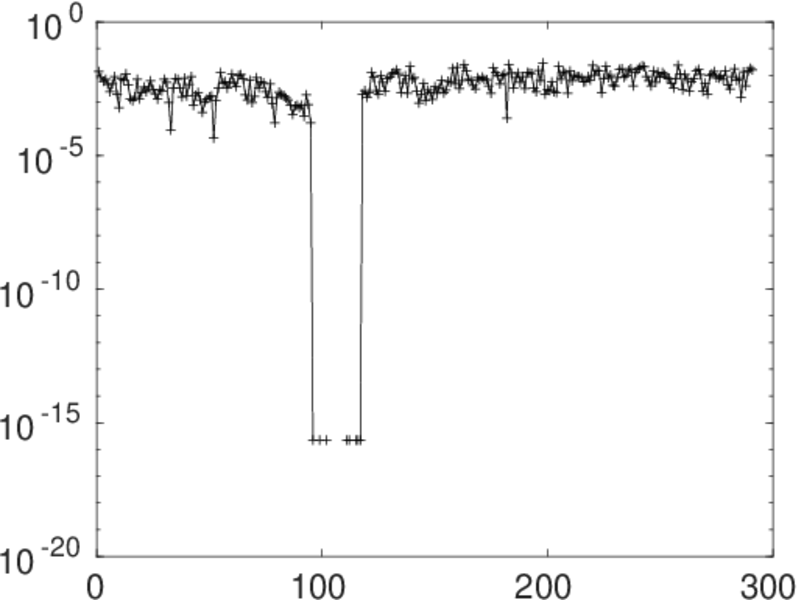
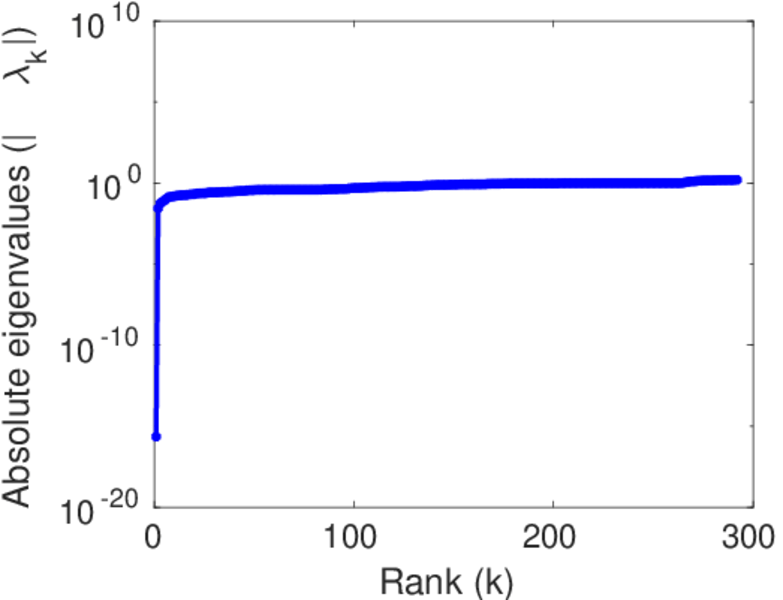
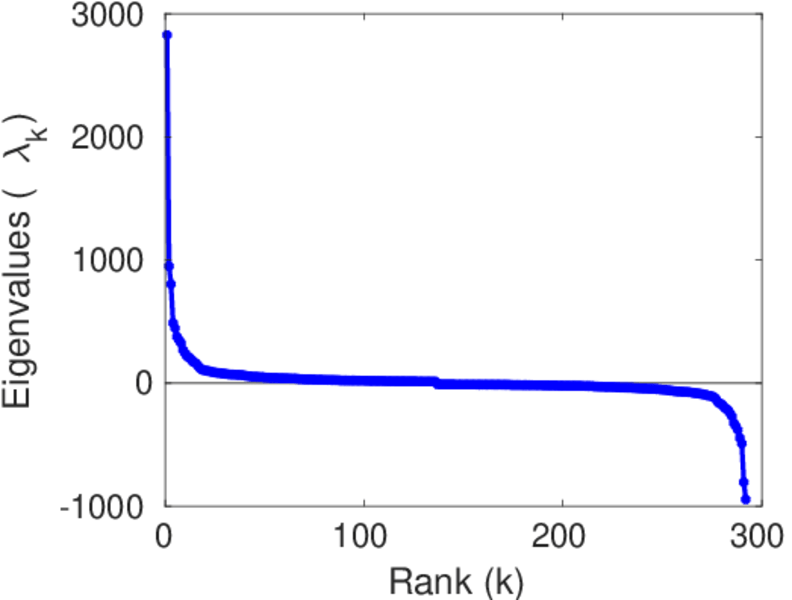
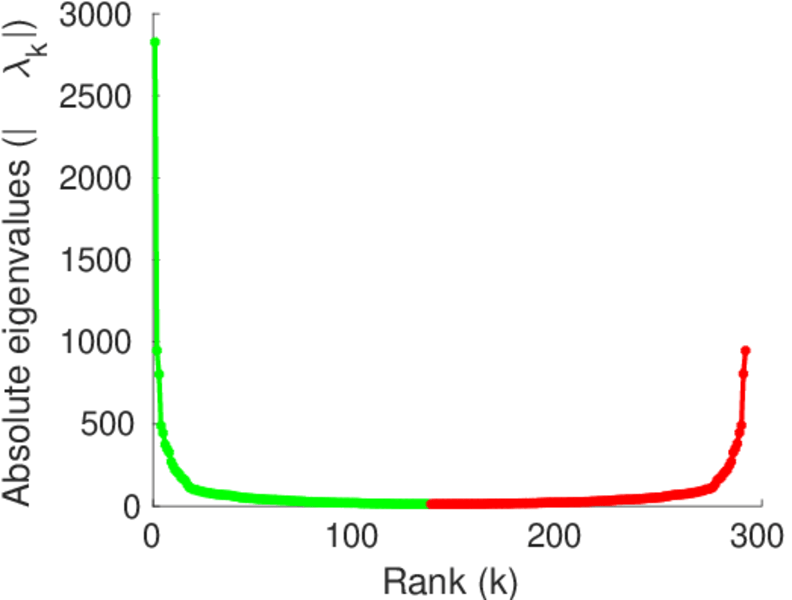
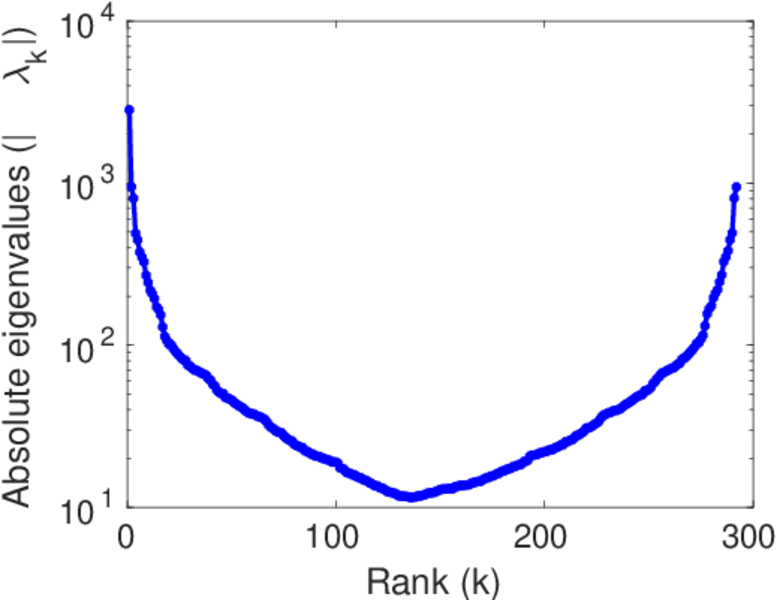
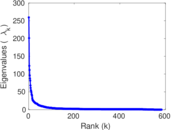
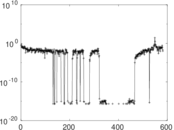
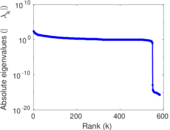
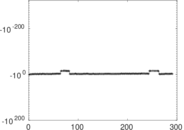
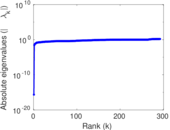
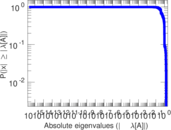
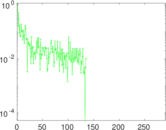
Matrix decompositions plots


Downloads
References
|
[1]
|
Jérôme Kunegis.
KONECT – The Koblenz Network Collection.
In Proc. Int. Conf. on World Wide Web Companion, pages
1343–1350, 2013.
[ http ]
|
|
[2]
|
Wikimedia Foundation.
Wikimedia downloads.
http://dumps.wikimedia.org/, January 2010.
|
 KONECT ‣ Networks ‣
Buy Me a Coffee
KONECT ‣ Networks ‣
Buy Me a Coffee