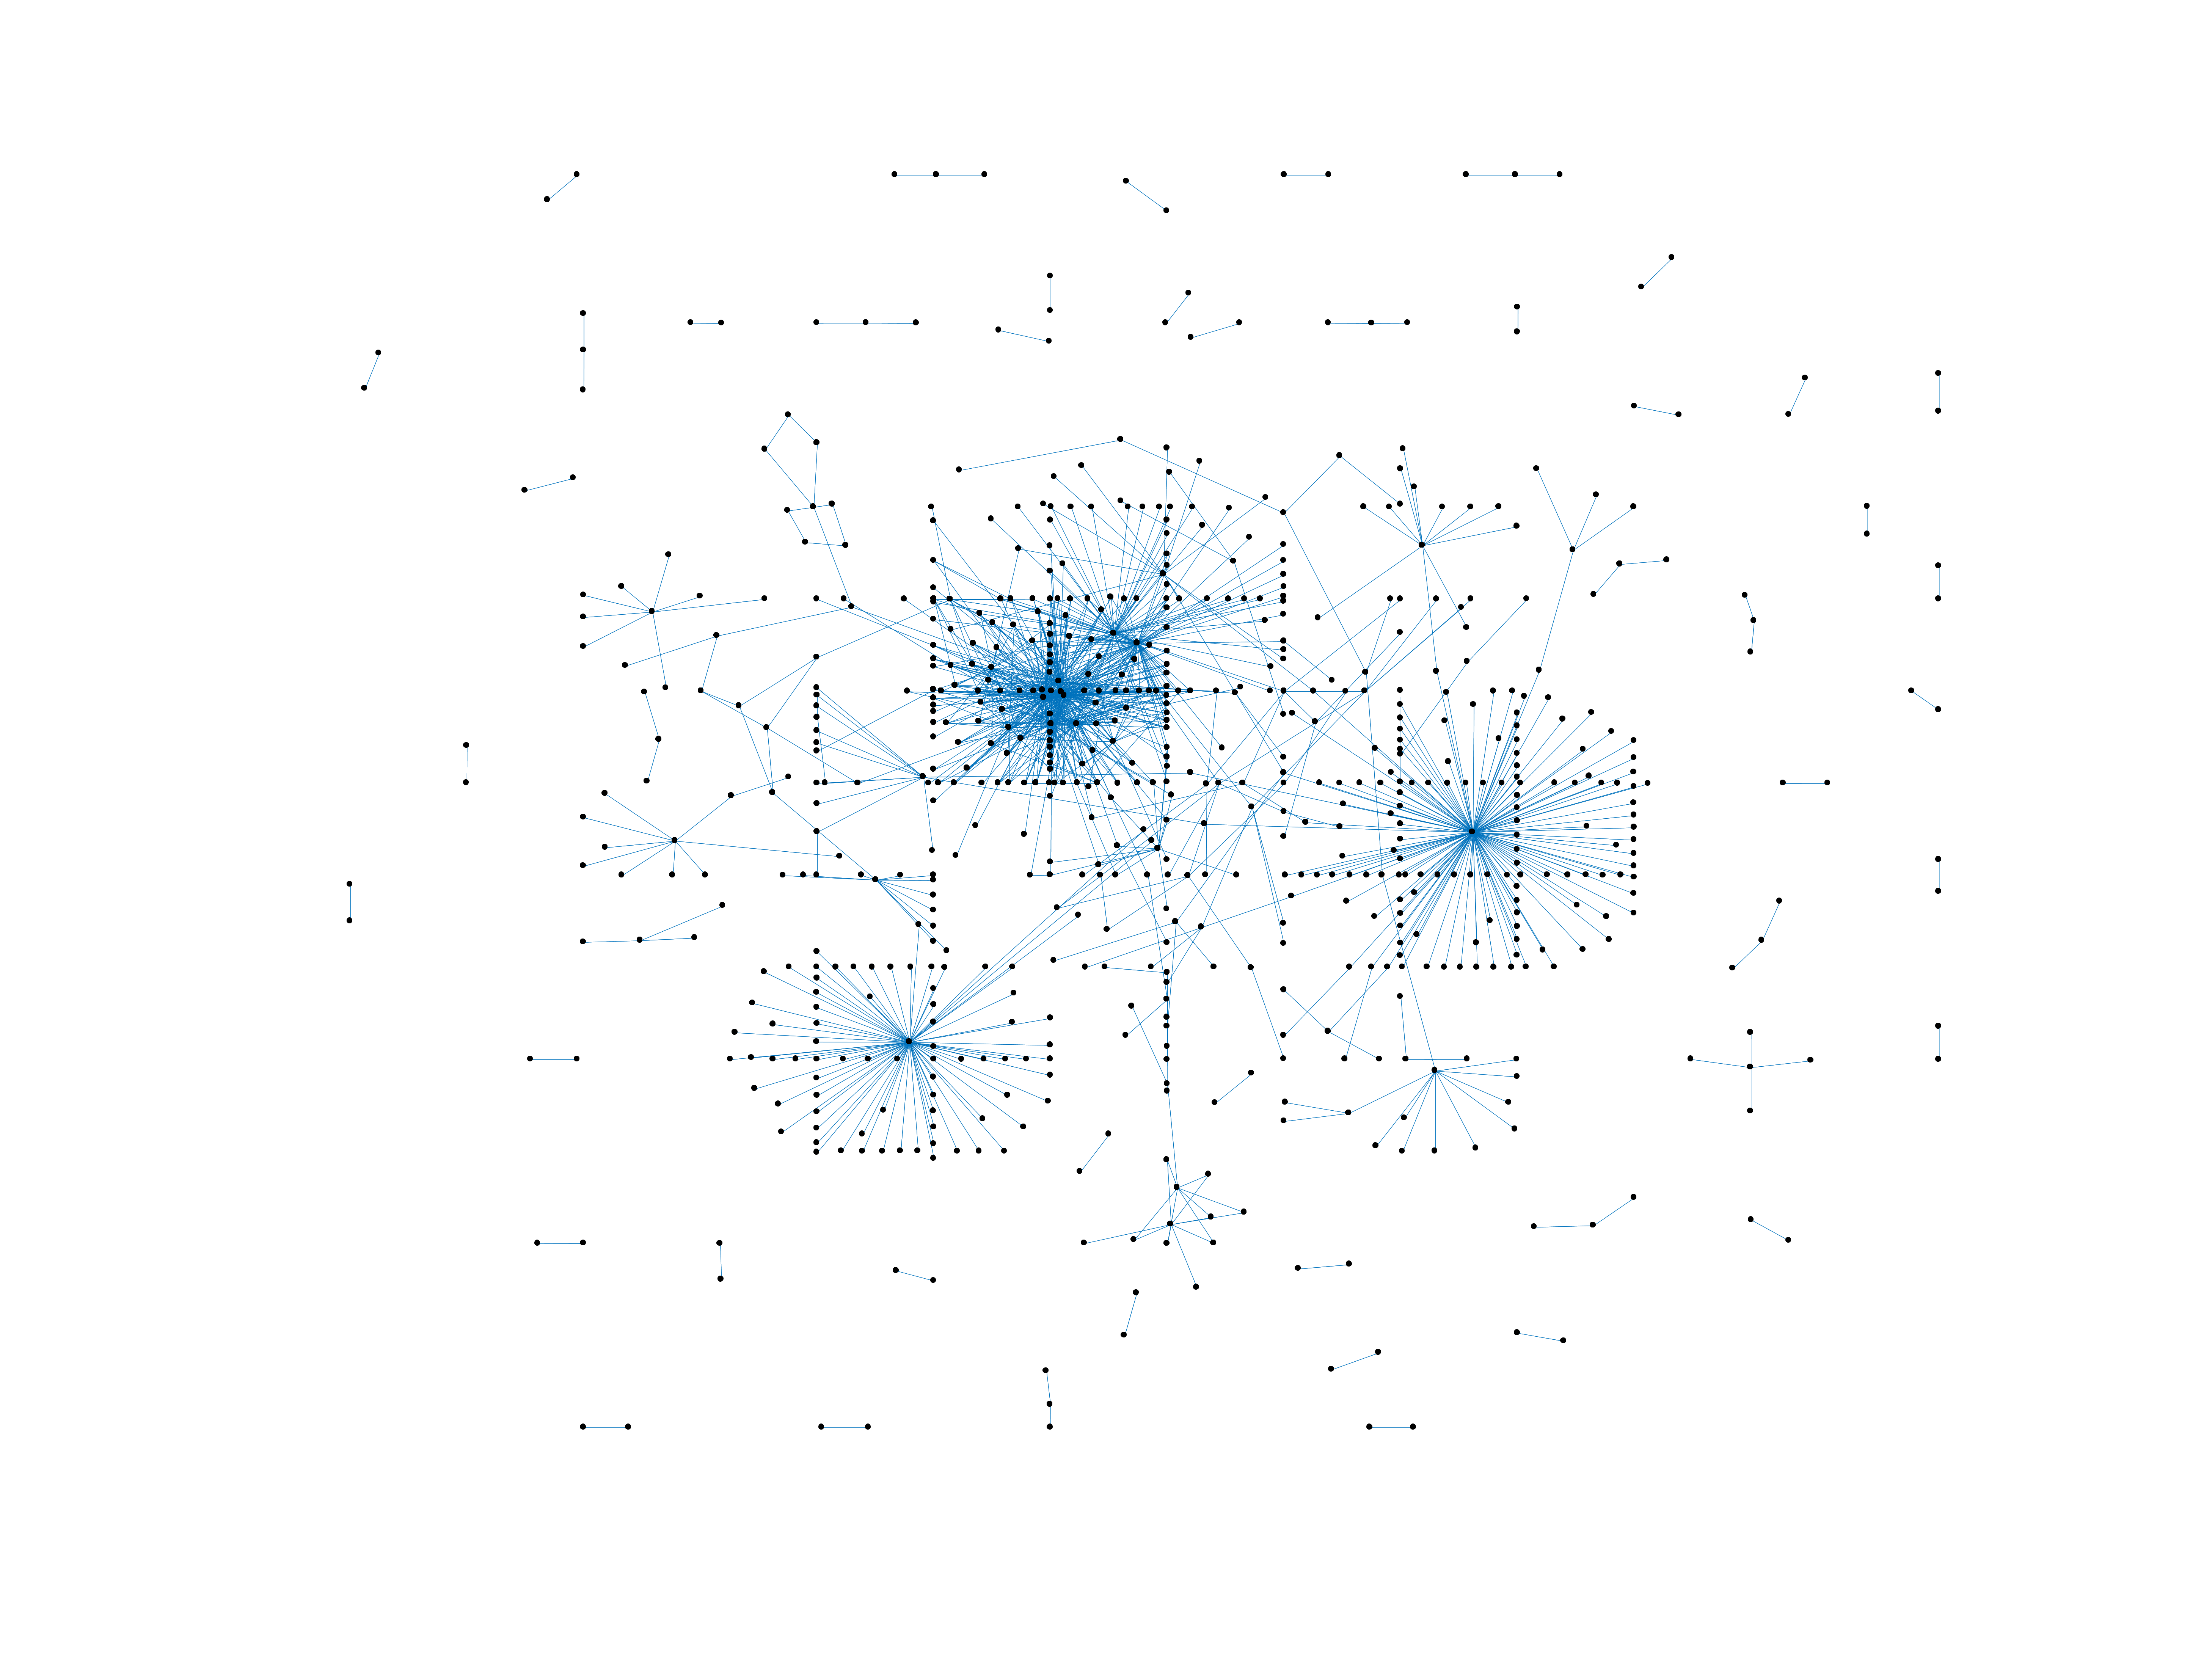
Wiktionary edits (ik)
This is the bipartite edit network of the Inupiaq Wiktionary. It contains users
and pages from the Inupiaq Wiktionary, connected by edit events. Each edge
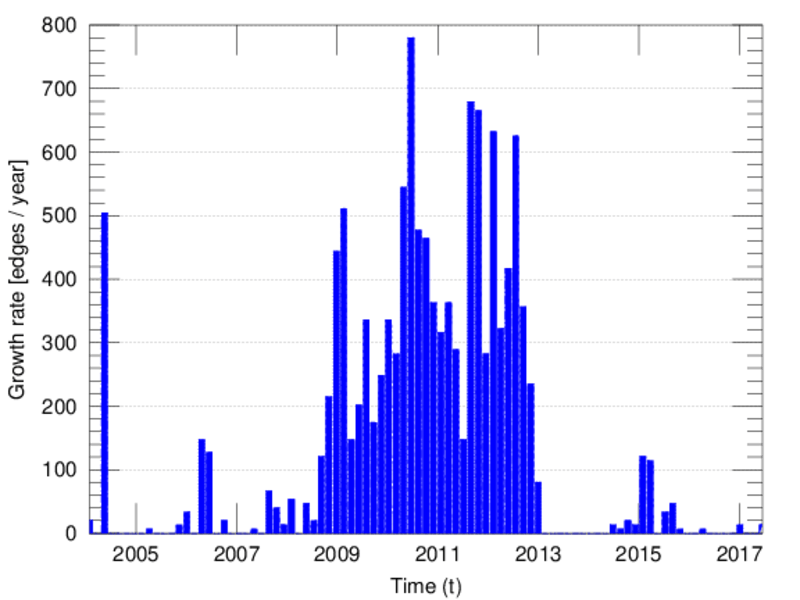
represents an edit. The dataset includes the timestamp of each edit.
Metadata
Statistics
| Size | n = | 741
|
| Left size | n1 = | 126
|
| Right size | n2 = | 615
|
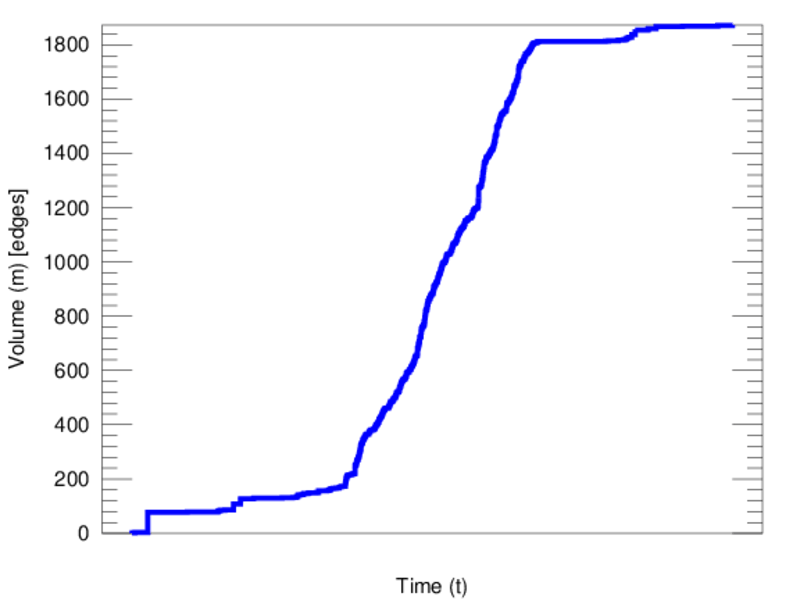
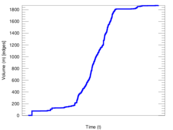
| Volume | m = | 1,873
|
| Unique edge count | m̿ = | 1,119
|
| Wedge count | s = | 34,176
|
| Claw count | z = | 982,289
|
| Cross count | x = | 24,885,020
|
| Square count | q = | 19,645
|
| 4-Tour count | T4 = | 296,410
|
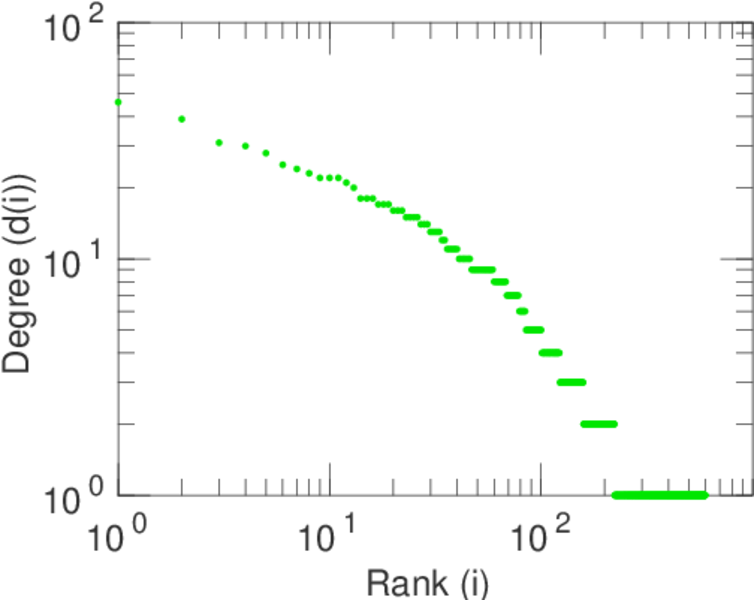
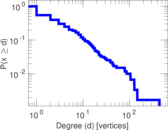
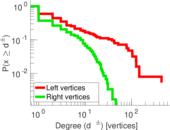
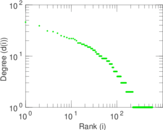
| Maximum degree | dmax = | 444
|
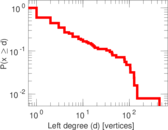
| Maximum left degree | d1max = | 444
|
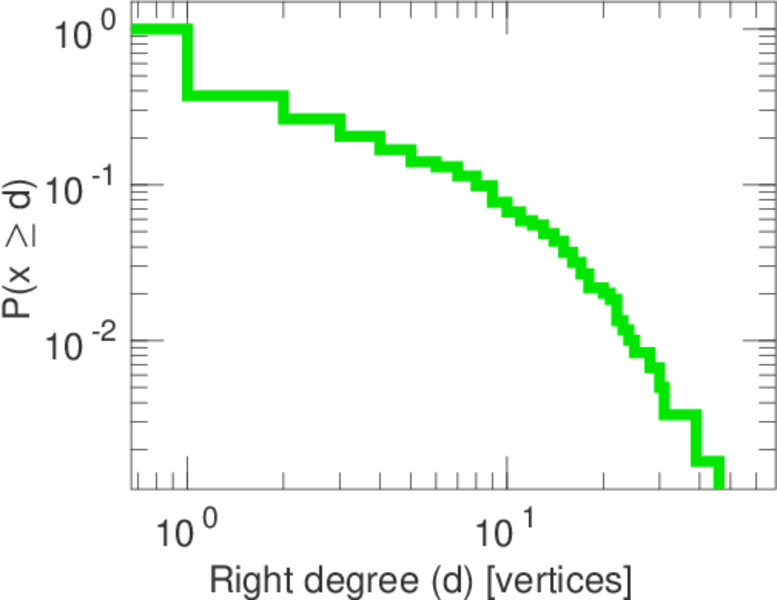
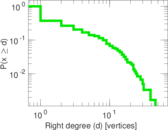
| Maximum right degree | d2max = | 46
|
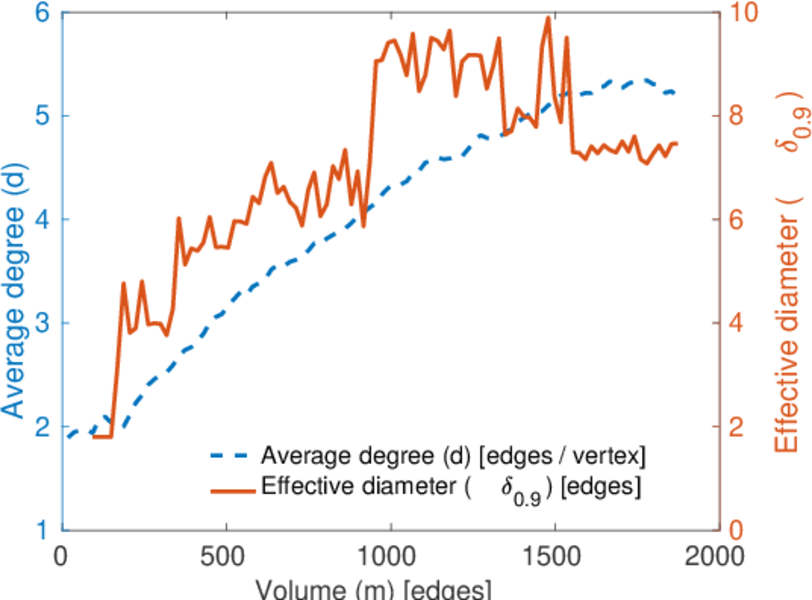
| Average degree | d = | 5.055 33
|
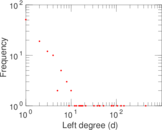
| Average left degree | d1 = | 14.865 1
|
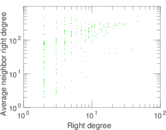
| Average right degree | d2 = | 3.045 53
|
| Fill | p = | 0.014 440 6
|
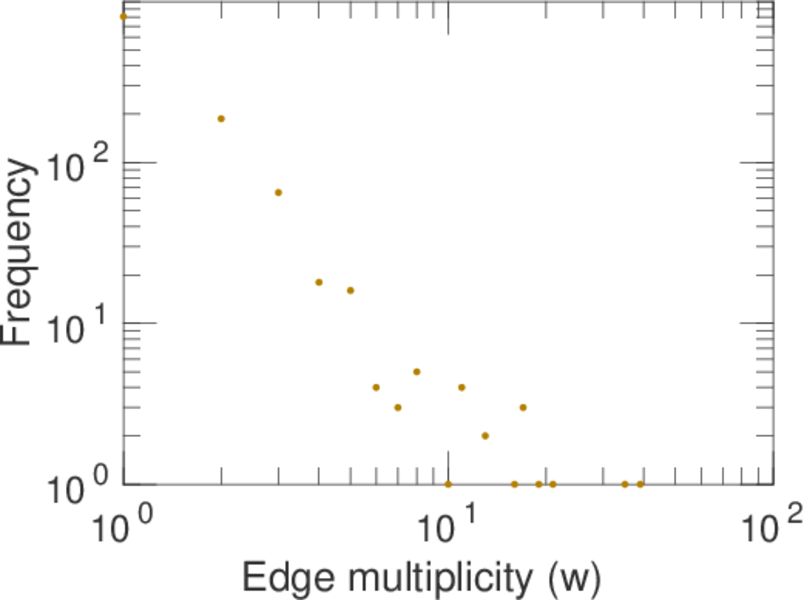
| Average edge multiplicity | m̃ = | 1.673 82
|
| Size of LCC | N = | 456
|
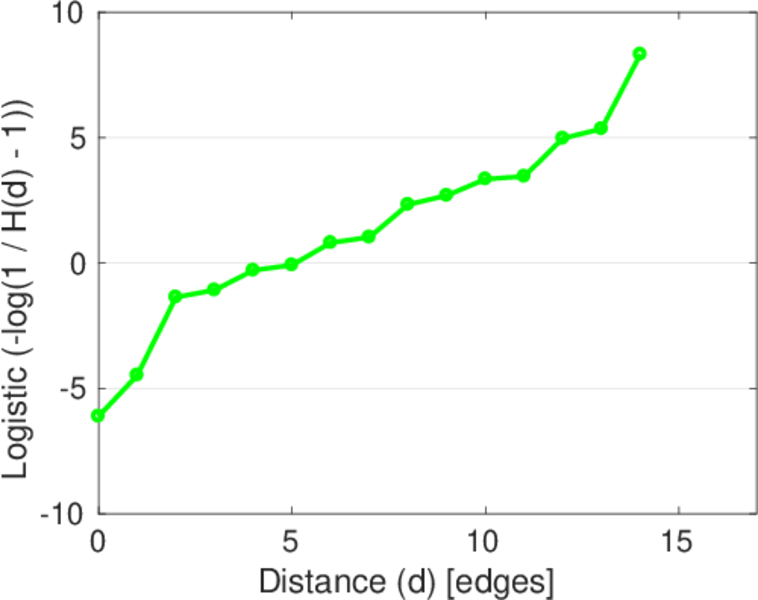
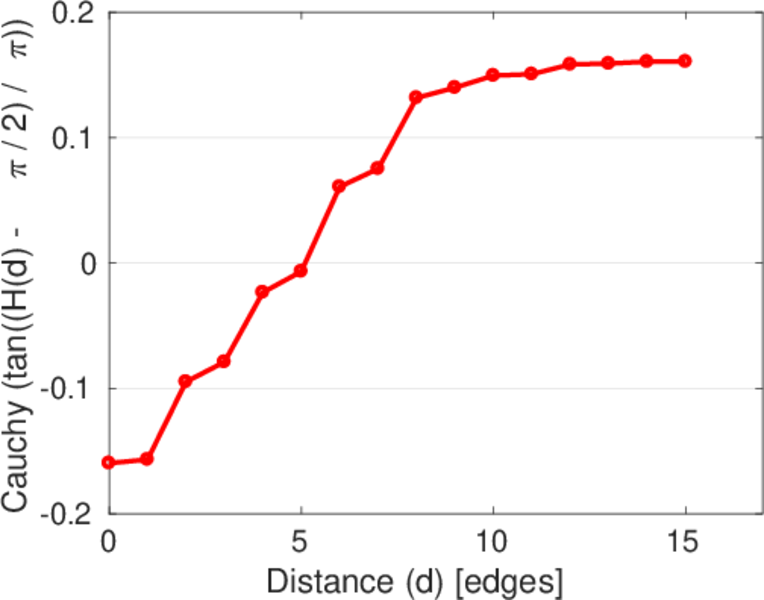
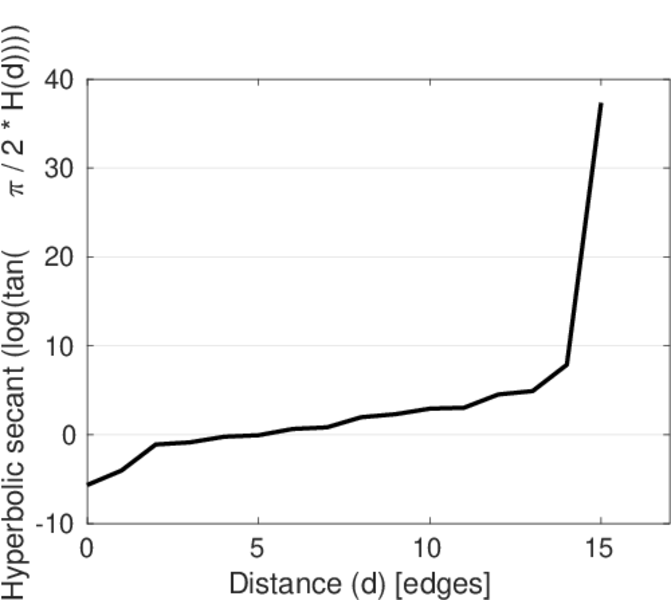
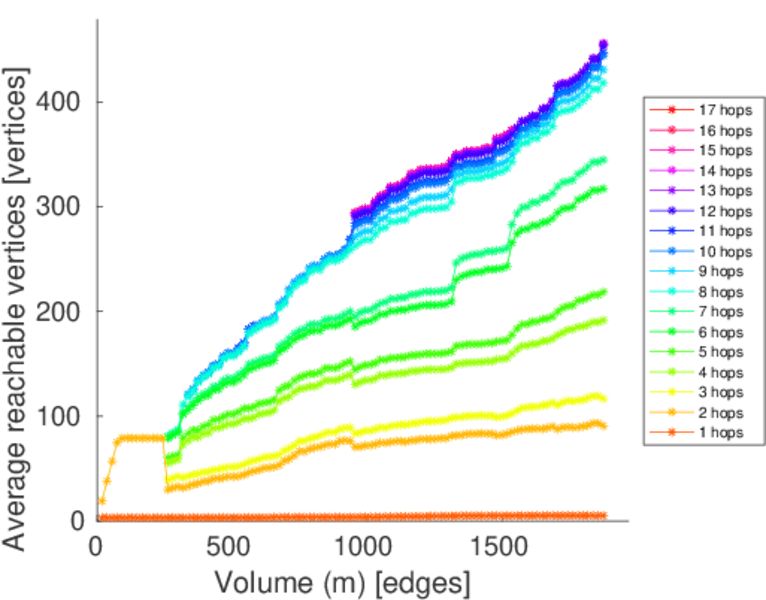
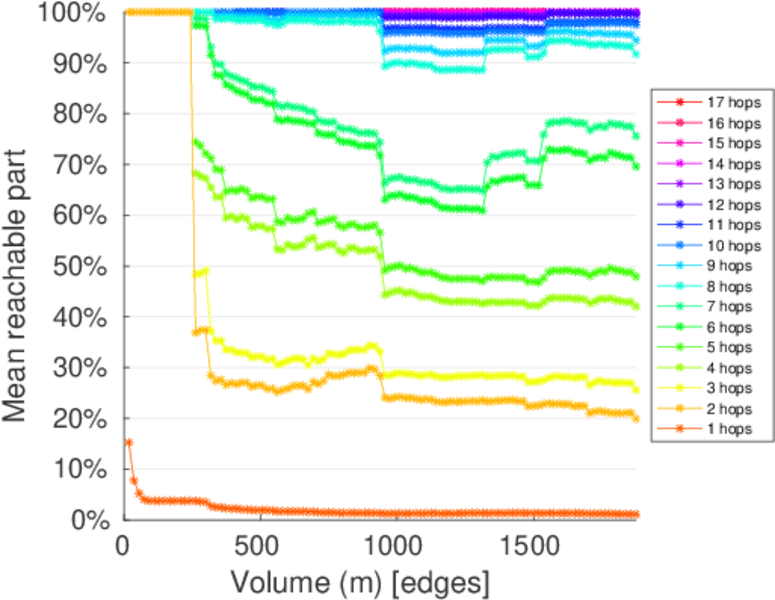
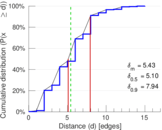
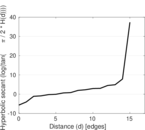
| Diameter | δ = | 15
|
| 50-Percentile effective diameter | δ0.5 = | 5.102 01
|
| 90-Percentile effective diameter | δ0.9 = | 7.937 20
|
| Median distance | δM = | 6
|
| Mean distance | δm = | 5.431 25
|
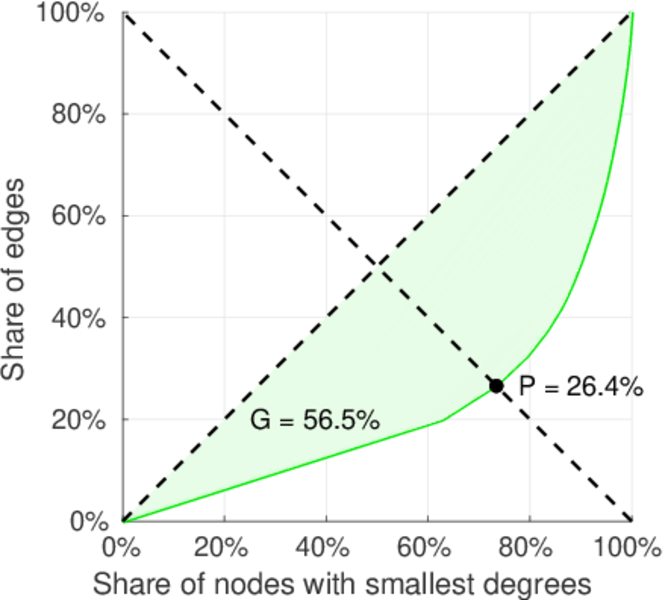
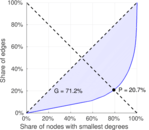
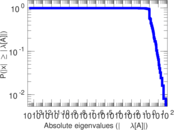
| Gini coefficient | G = | 0.707 050
|
| Balanced inequality ratio | P = | 0.217 032
|
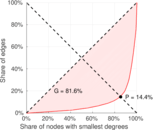
| Left balanced inequality ratio | P1 = | 0.144 154
|
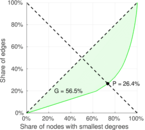
| Right balanced inequality ratio | P2 = | 0.264 282
|
| Relative edge distribution entropy | Her = | 0.834 648
|
| Power law exponent | γ = | 3.123 04
|
| Tail power law exponent | γt = | 2.131 00
|
| Tail power law exponent with p | γ3 = | 2.131 00
|
| p-value | p = | 0.000 00
|
| Left tail power law exponent with p | γ3,1 = | 1.701 00
|
| Left p-value | p1 = | 0.867 000
|
| Right tail power law exponent with p | γ3,2 = | 2.311 00
|
| Right p-value | p2 = | 0.000 00
|
| Degree assortativity | ρ = | −0.017 797 1
|
| Degree assortativity p-value | pρ = | 0.552 031
|
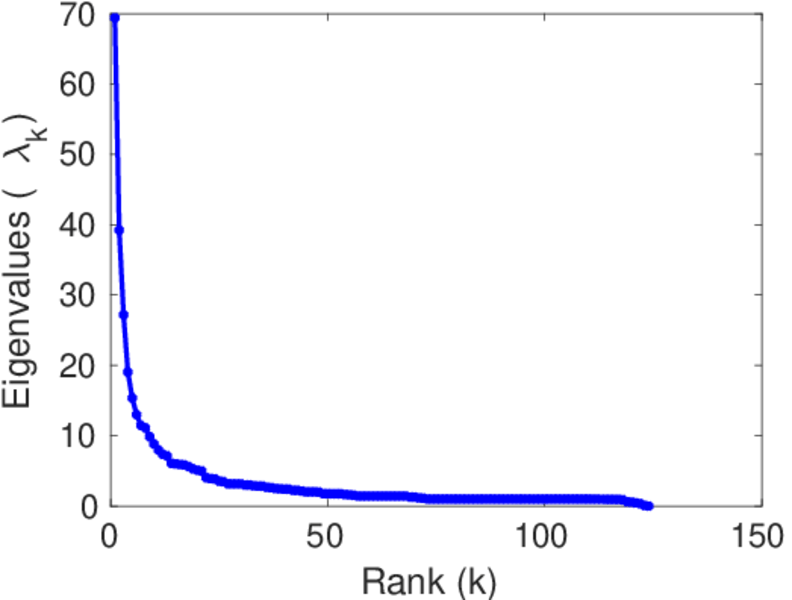
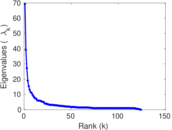
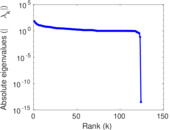
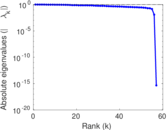
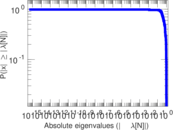
| Spectral norm | α = | 69.390 2
|
| Algebraic connectivity | a = | 0.014 564 6
|
| Spectral separation | |λ1[A] / λ2[A]| = | 1.769 38
|
| Controllability | C = | 475
|
| Relative controllability | Cr = | 0.656 985
|
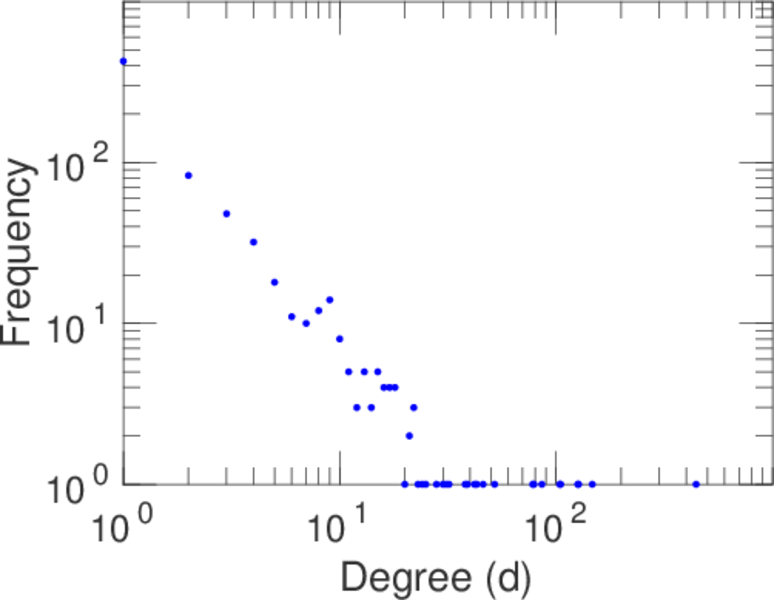
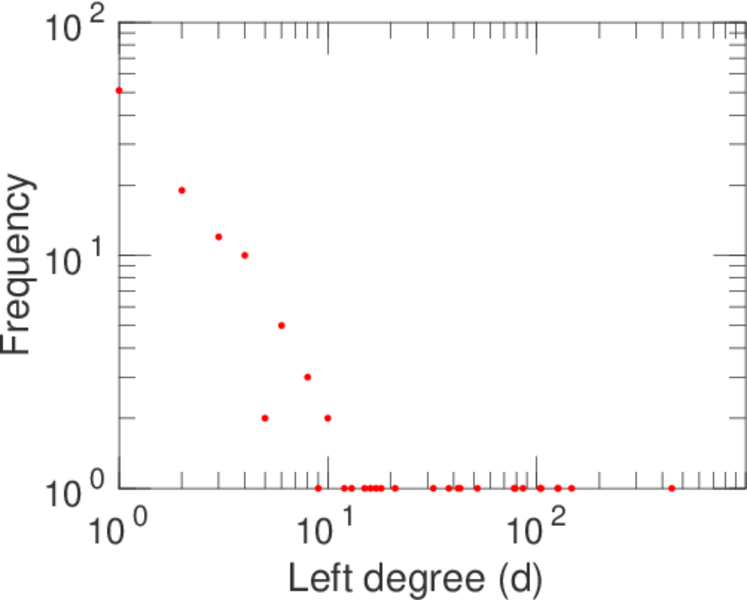
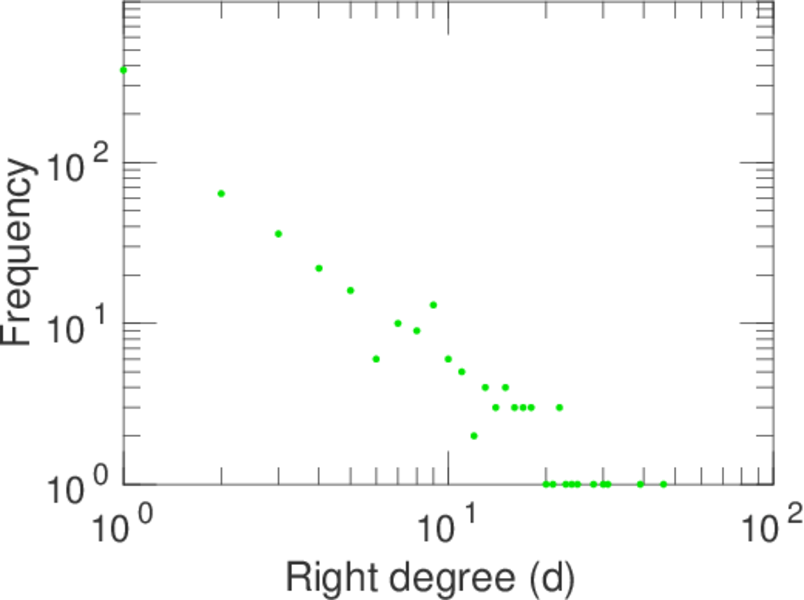
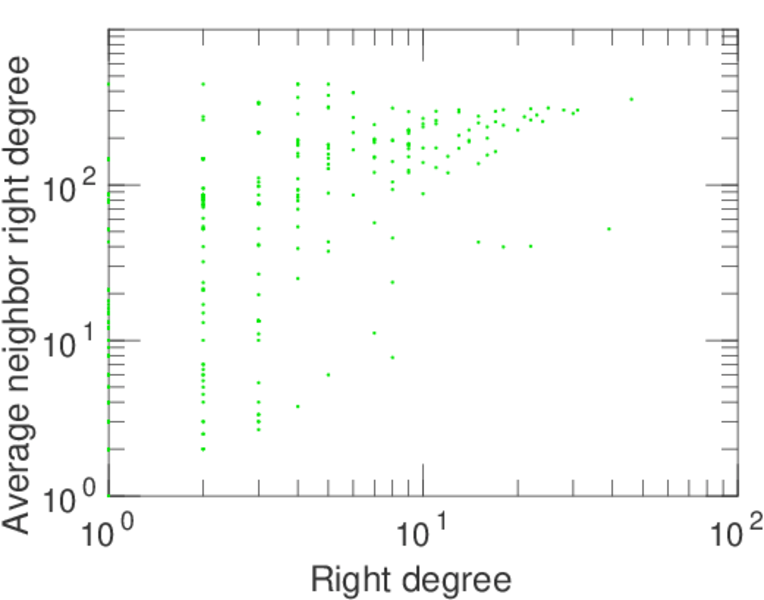
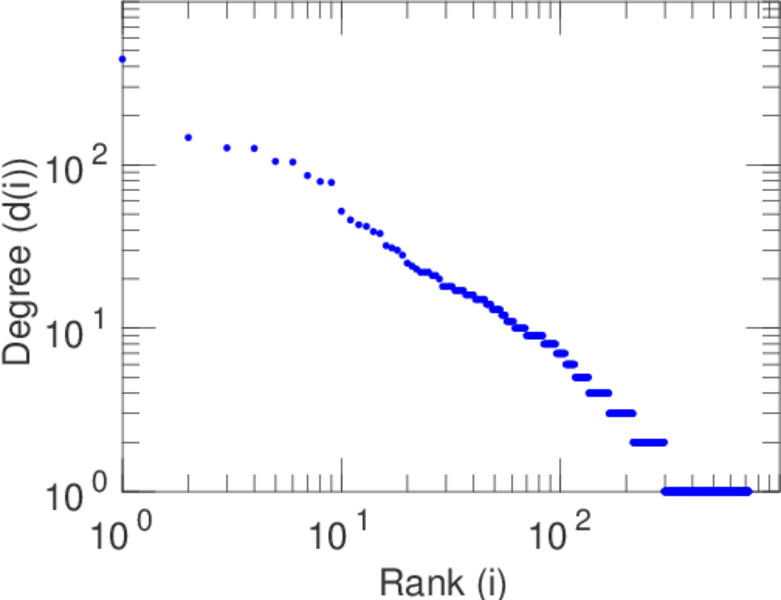
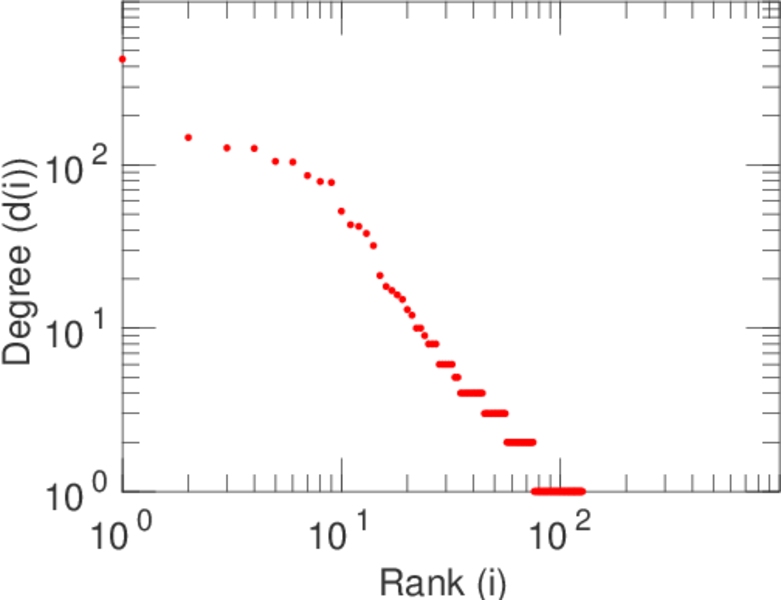
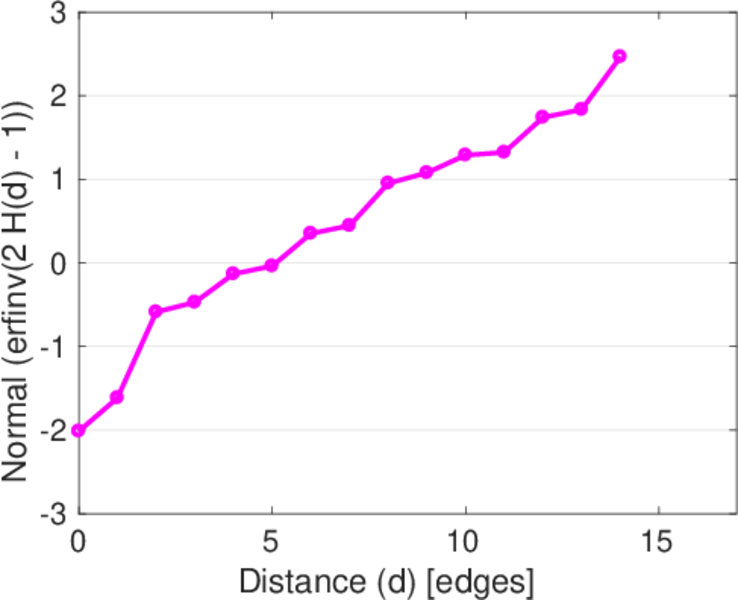
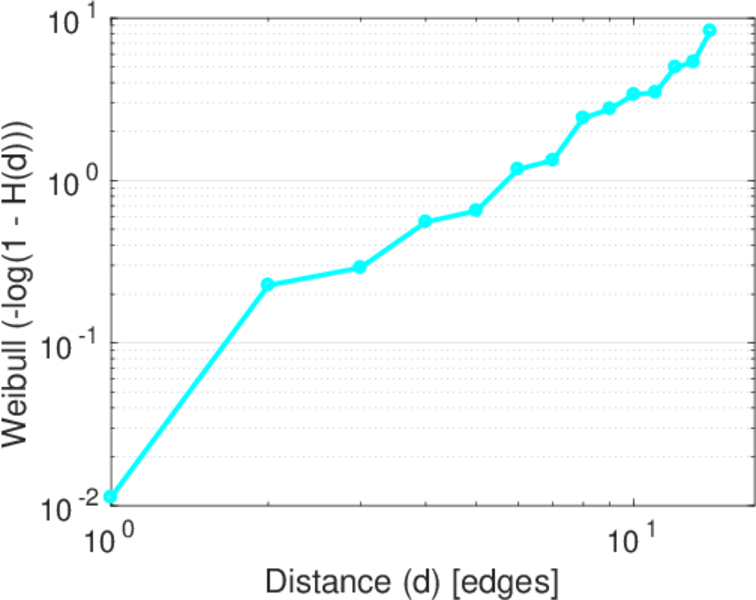
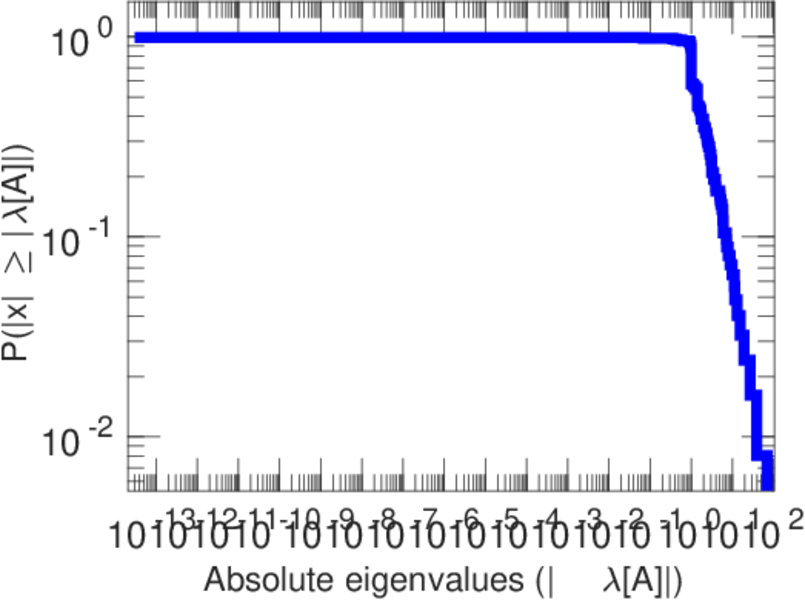
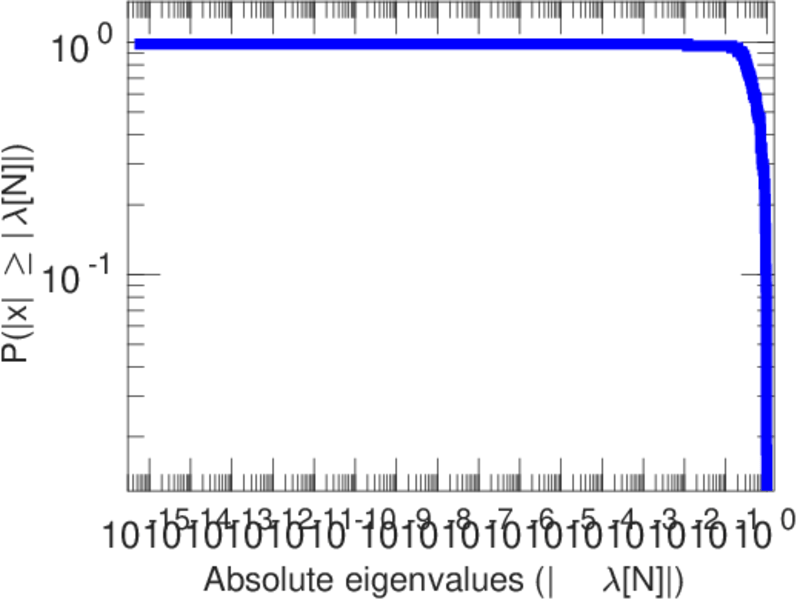
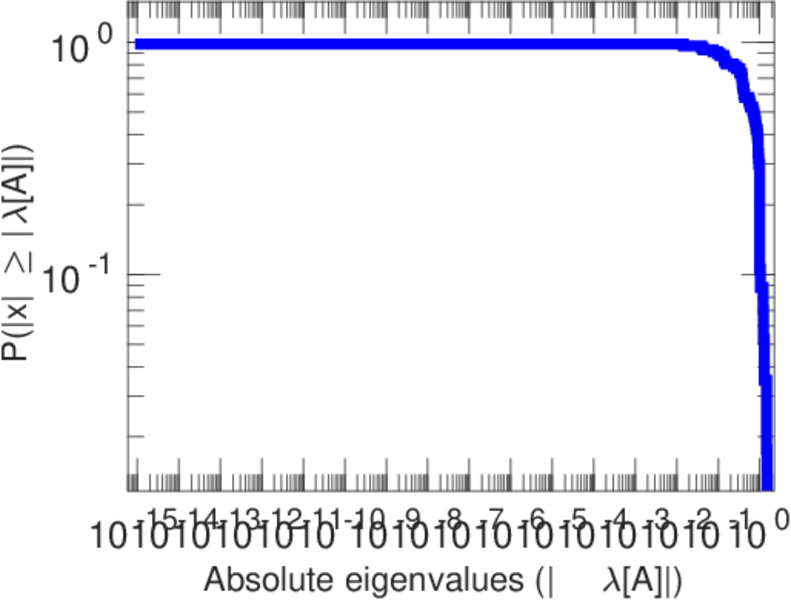
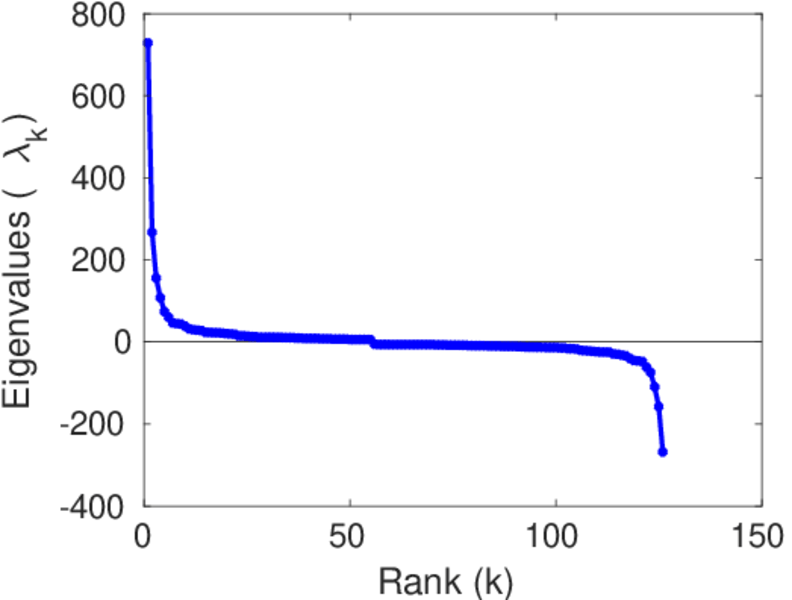
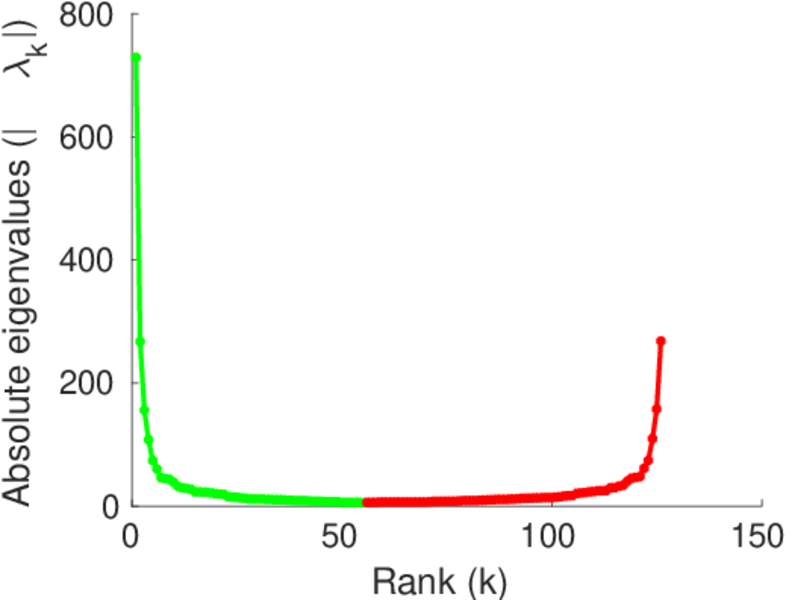
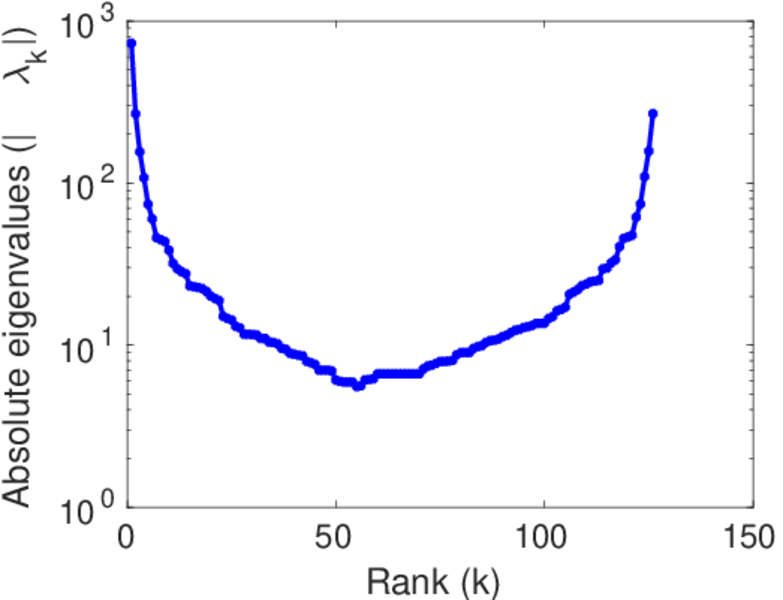
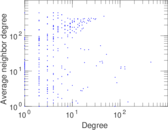
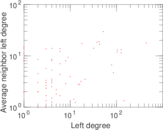
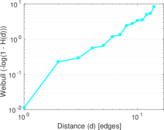
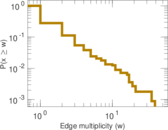
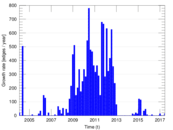
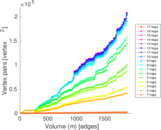
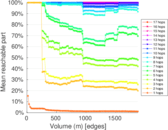
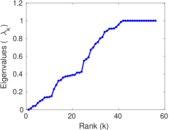
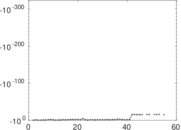
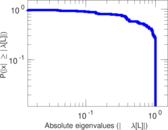
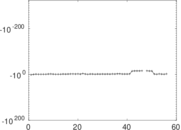
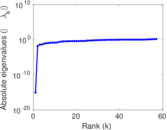
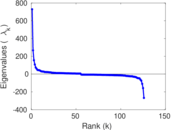
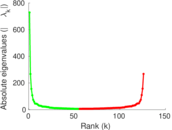
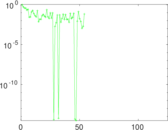
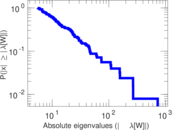
Plots


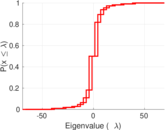
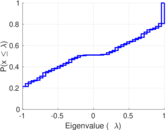
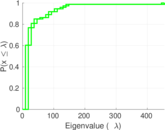


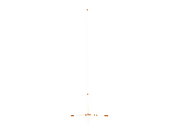
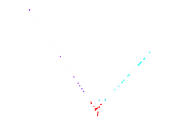
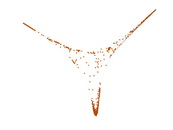


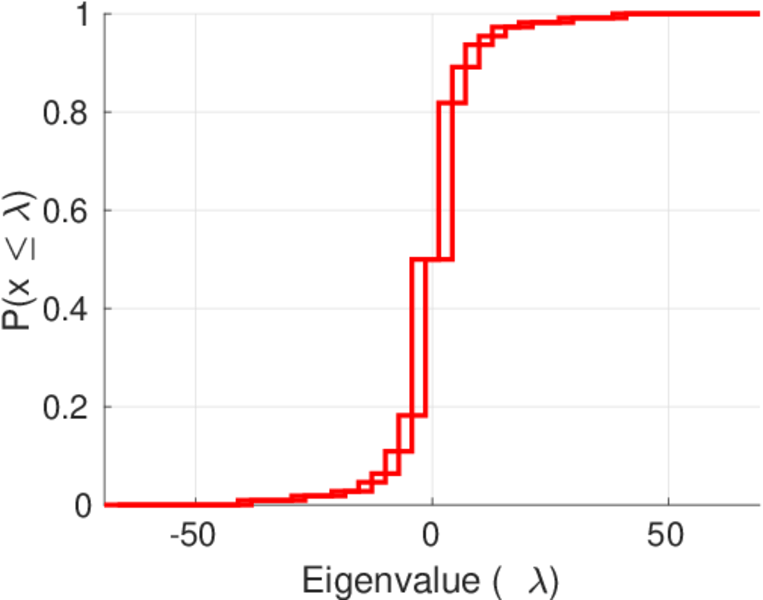
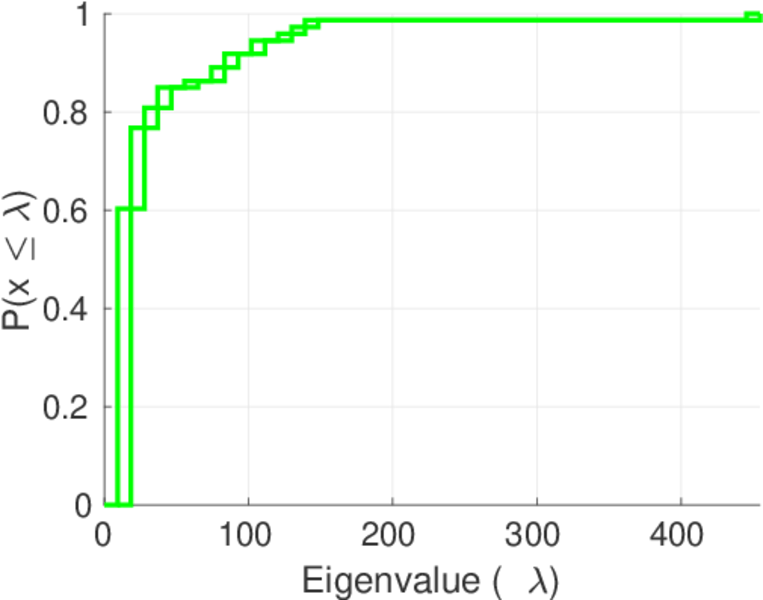
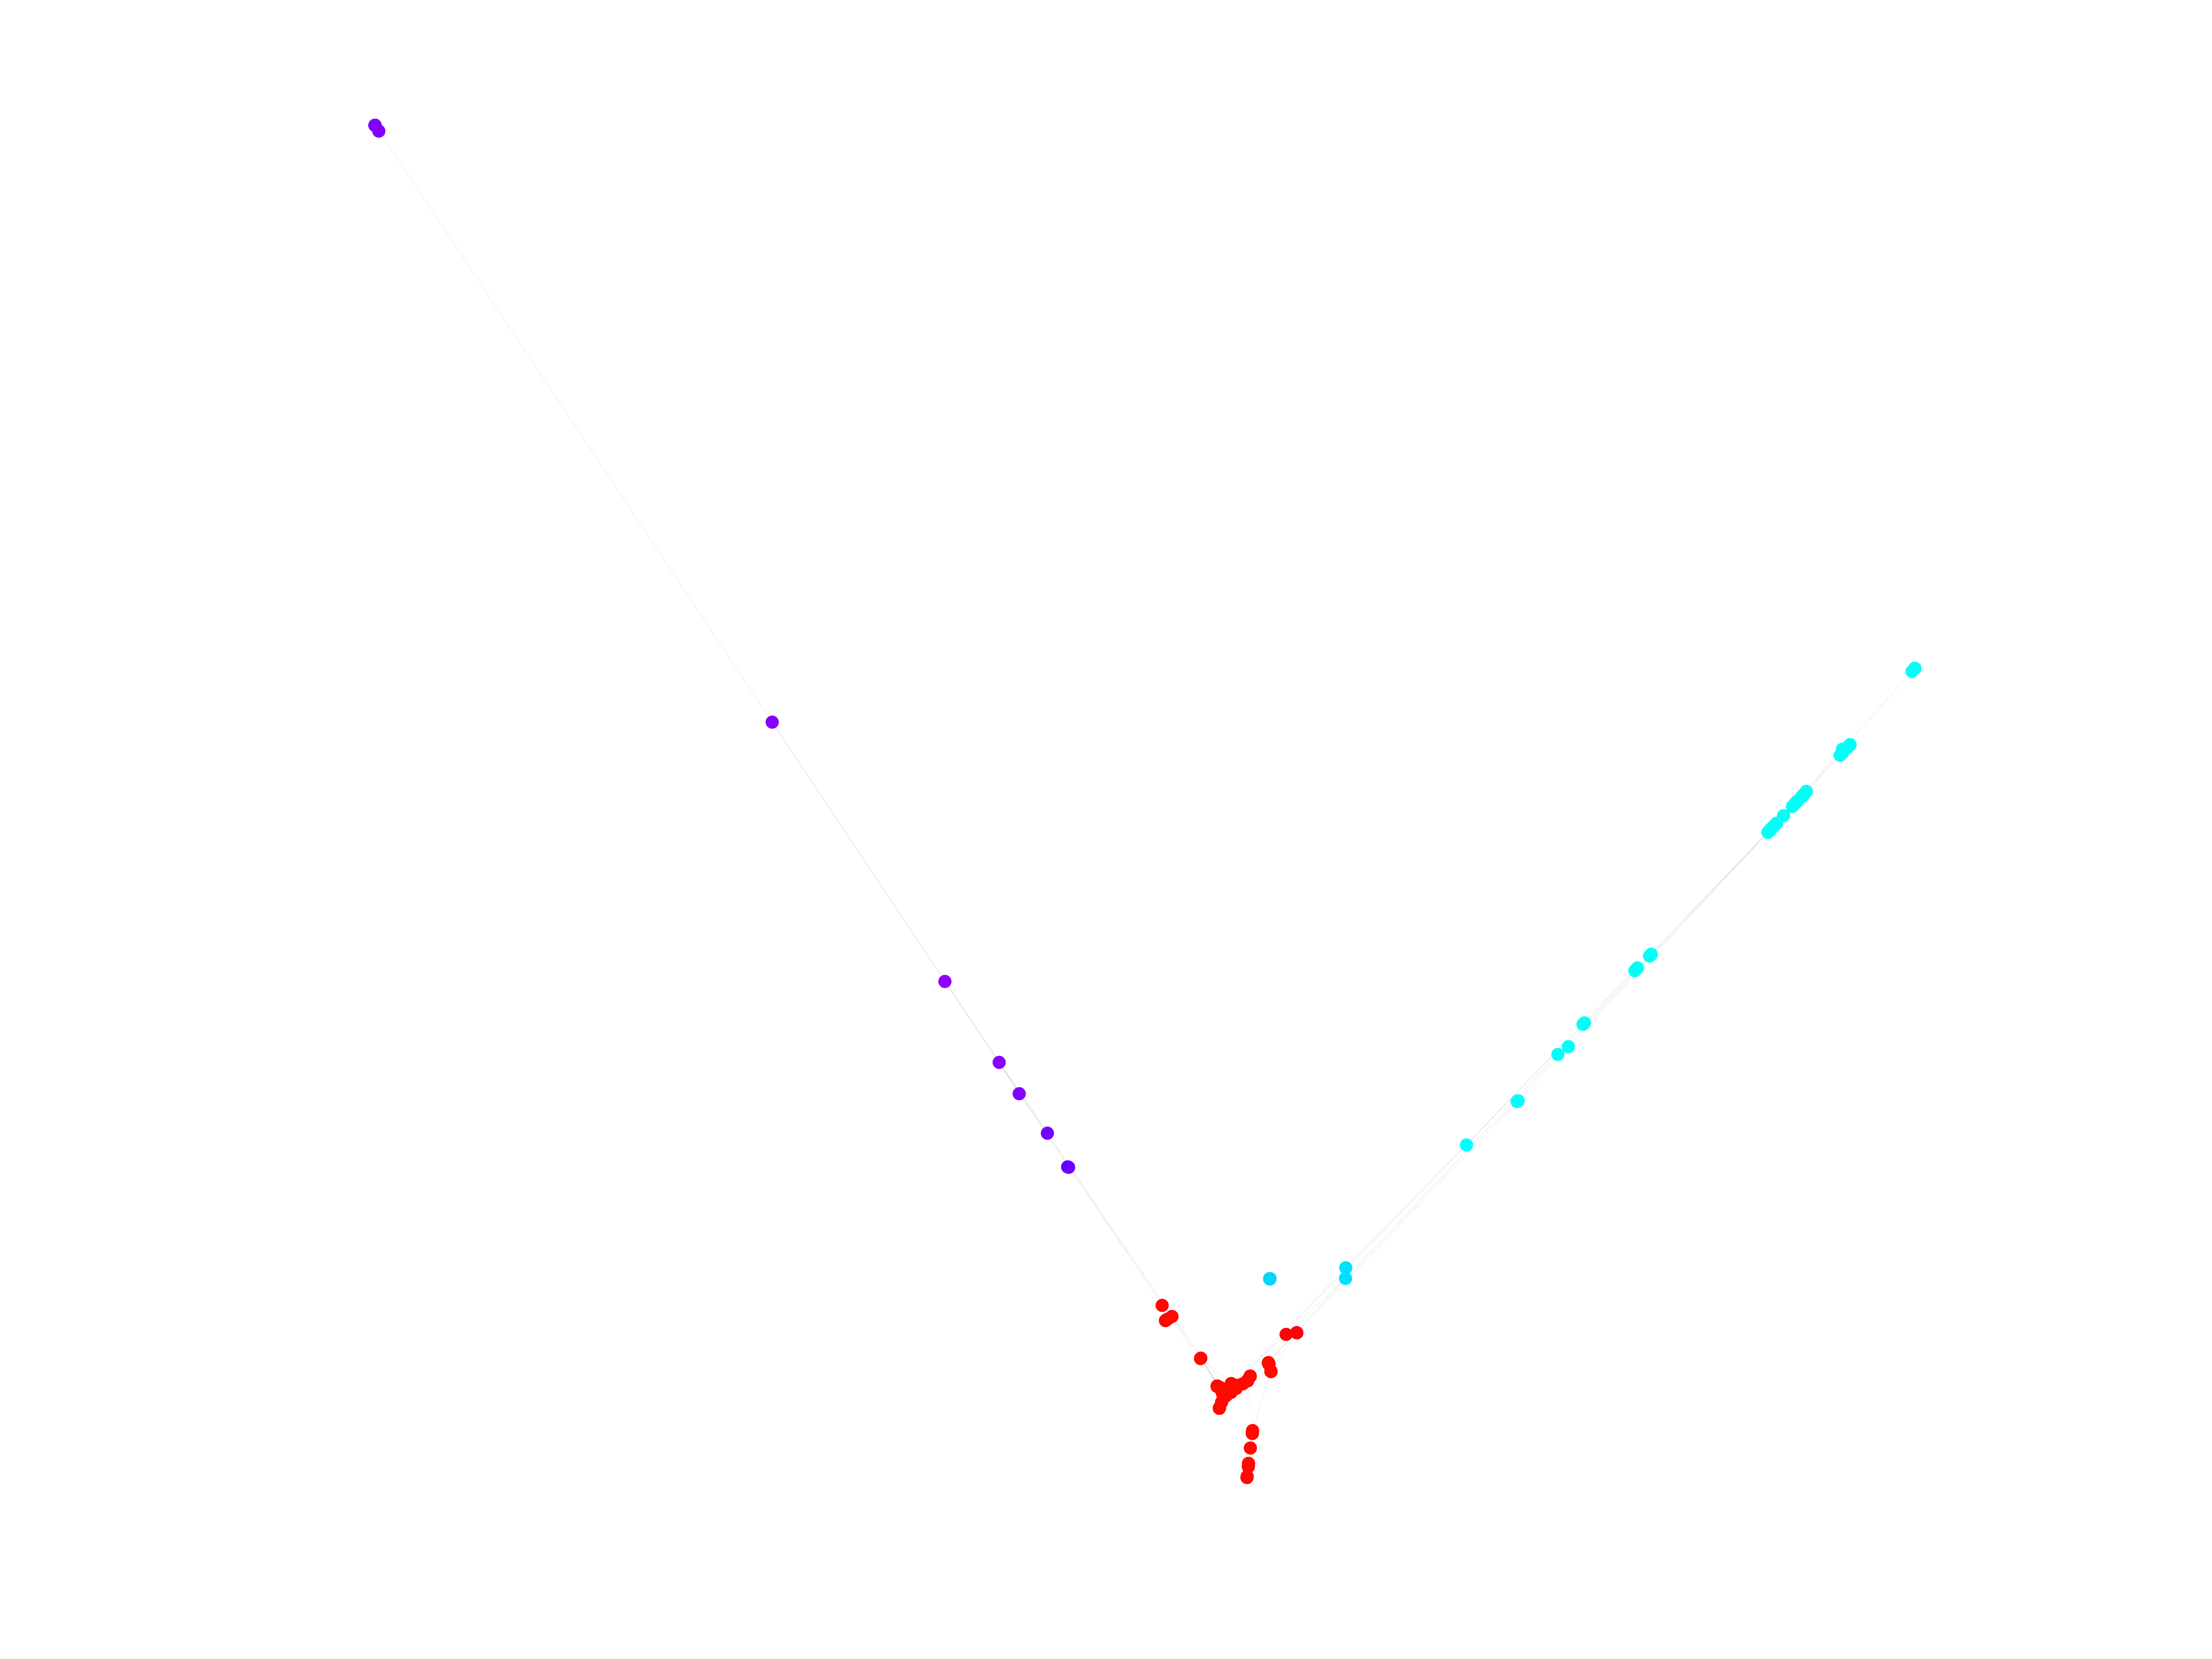
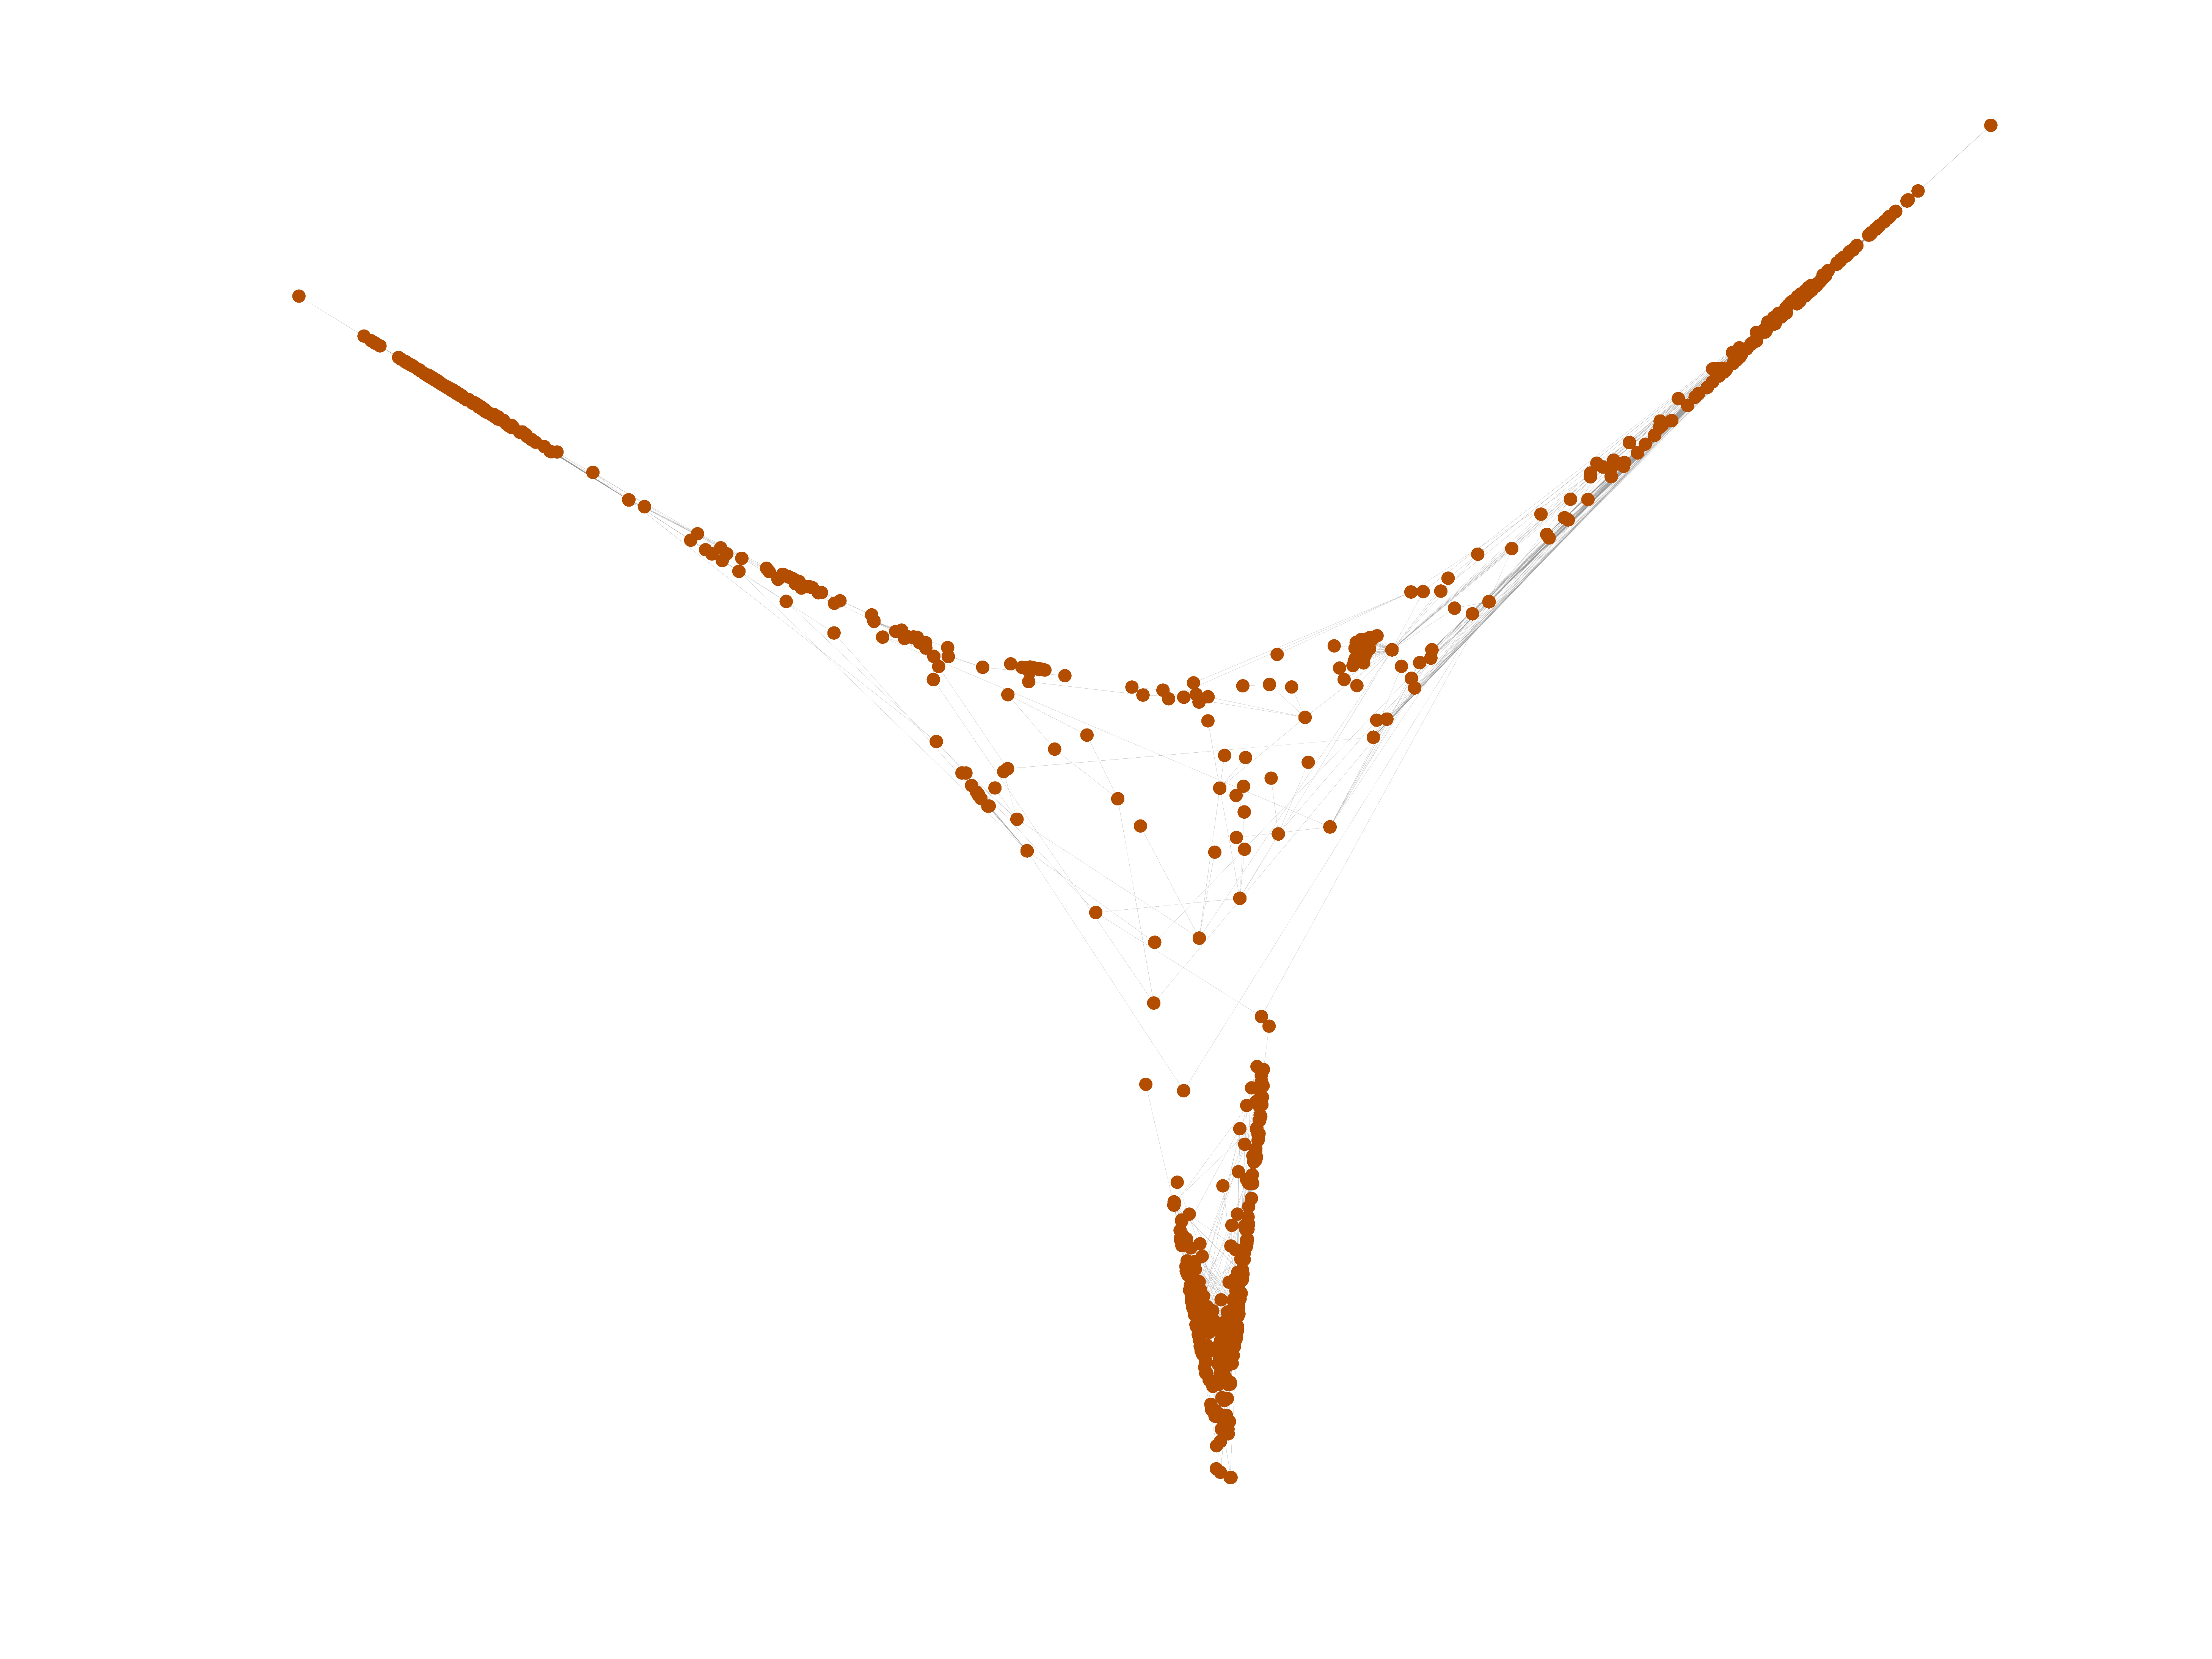
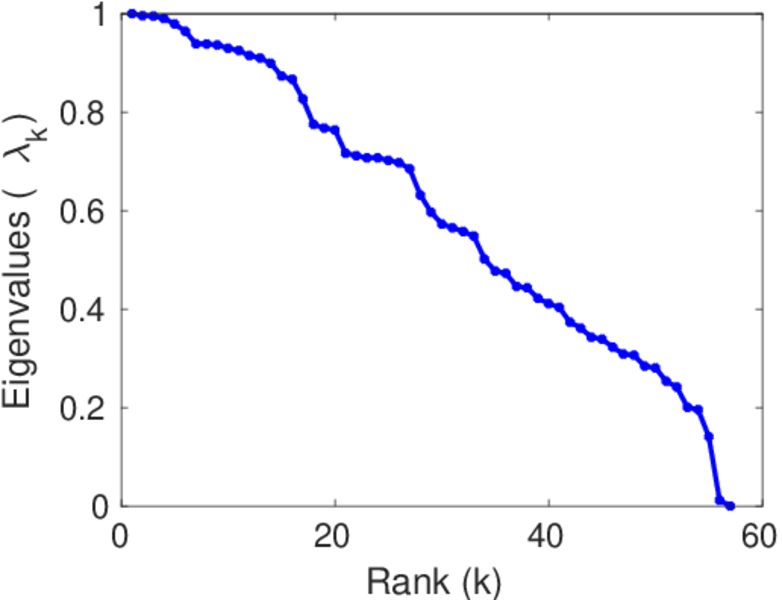
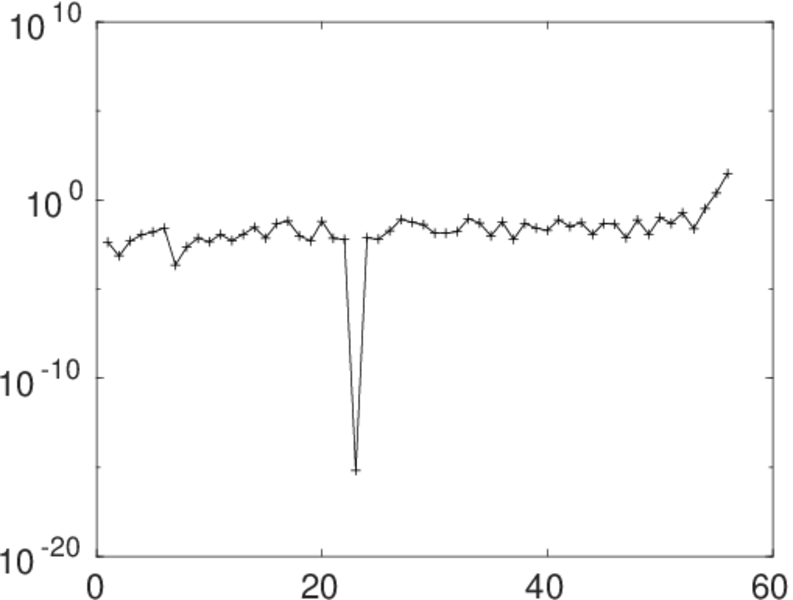
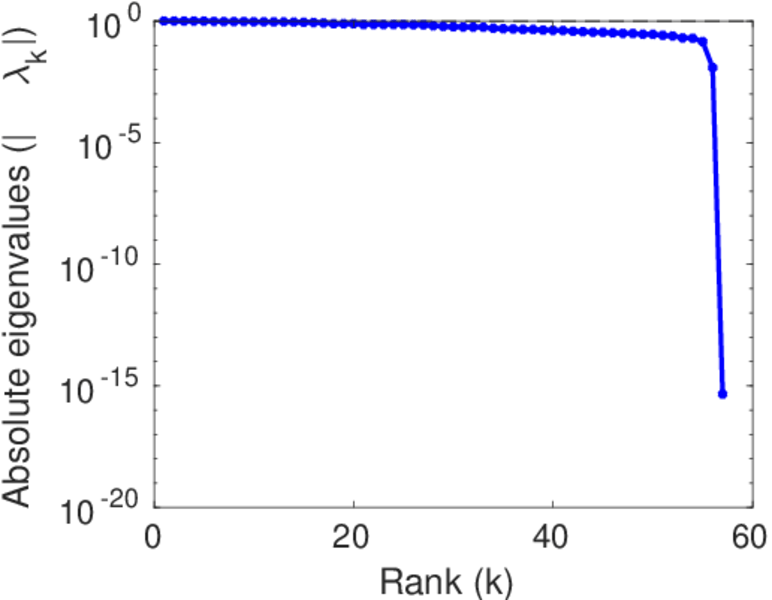
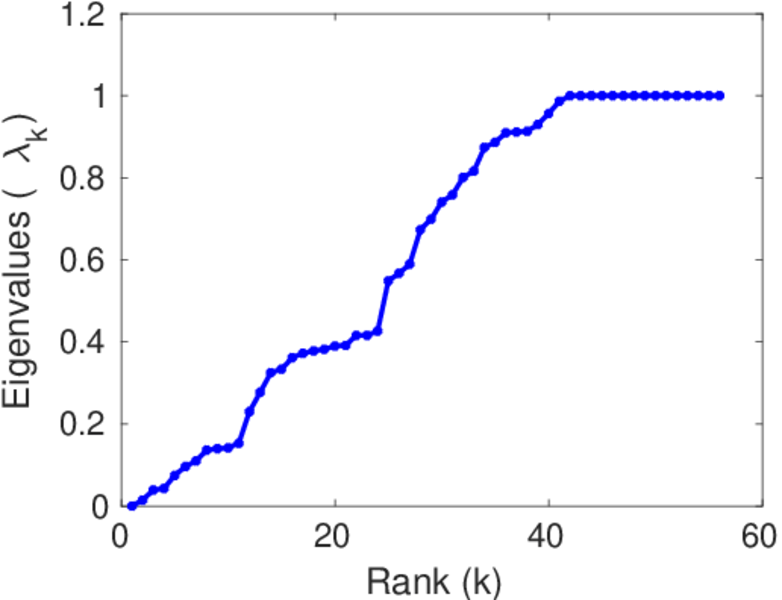
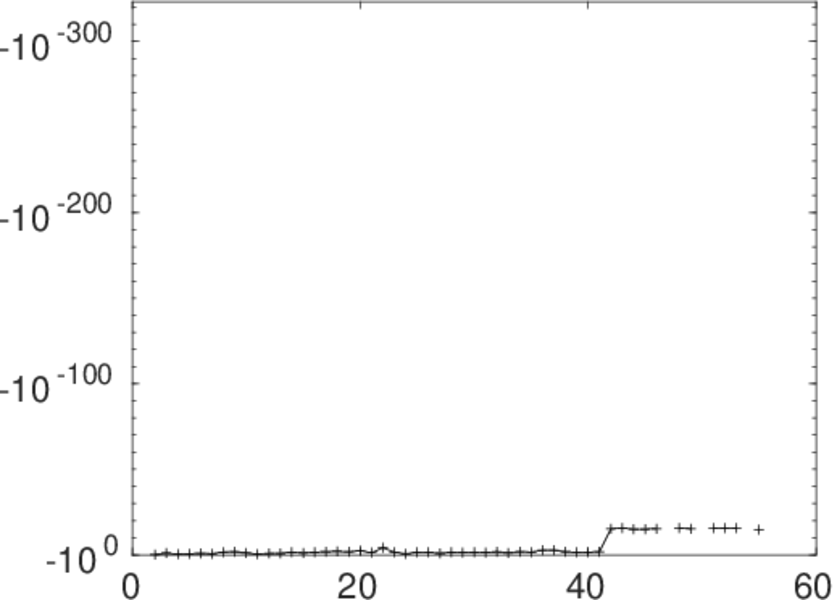
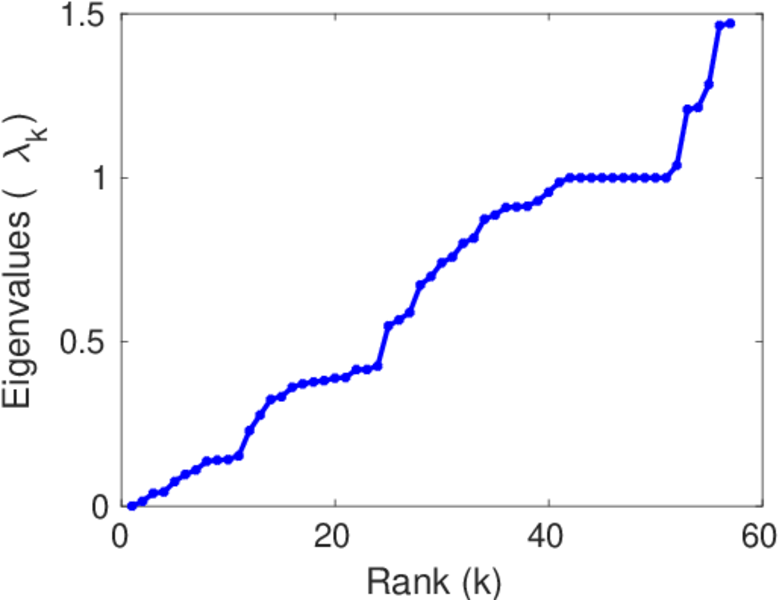
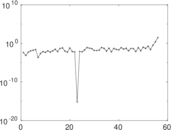
Matrix decompositions plots


Downloads
References
|
[1]
|
Jérôme Kunegis.
KONECT – The Koblenz Network Collection.
In Proc. Int. Conf. on World Wide Web Companion, pages
1343–1350, 2013.
[ http ]
|
|
[2]
|
Wikimedia Foundation.
Wikimedia downloads.
http://dumps.wikimedia.org/, January 2010.
|
 KONECT ‣ Networks ‣
Buy Me a Coffee
KONECT ‣ Networks ‣
Buy Me a Coffee