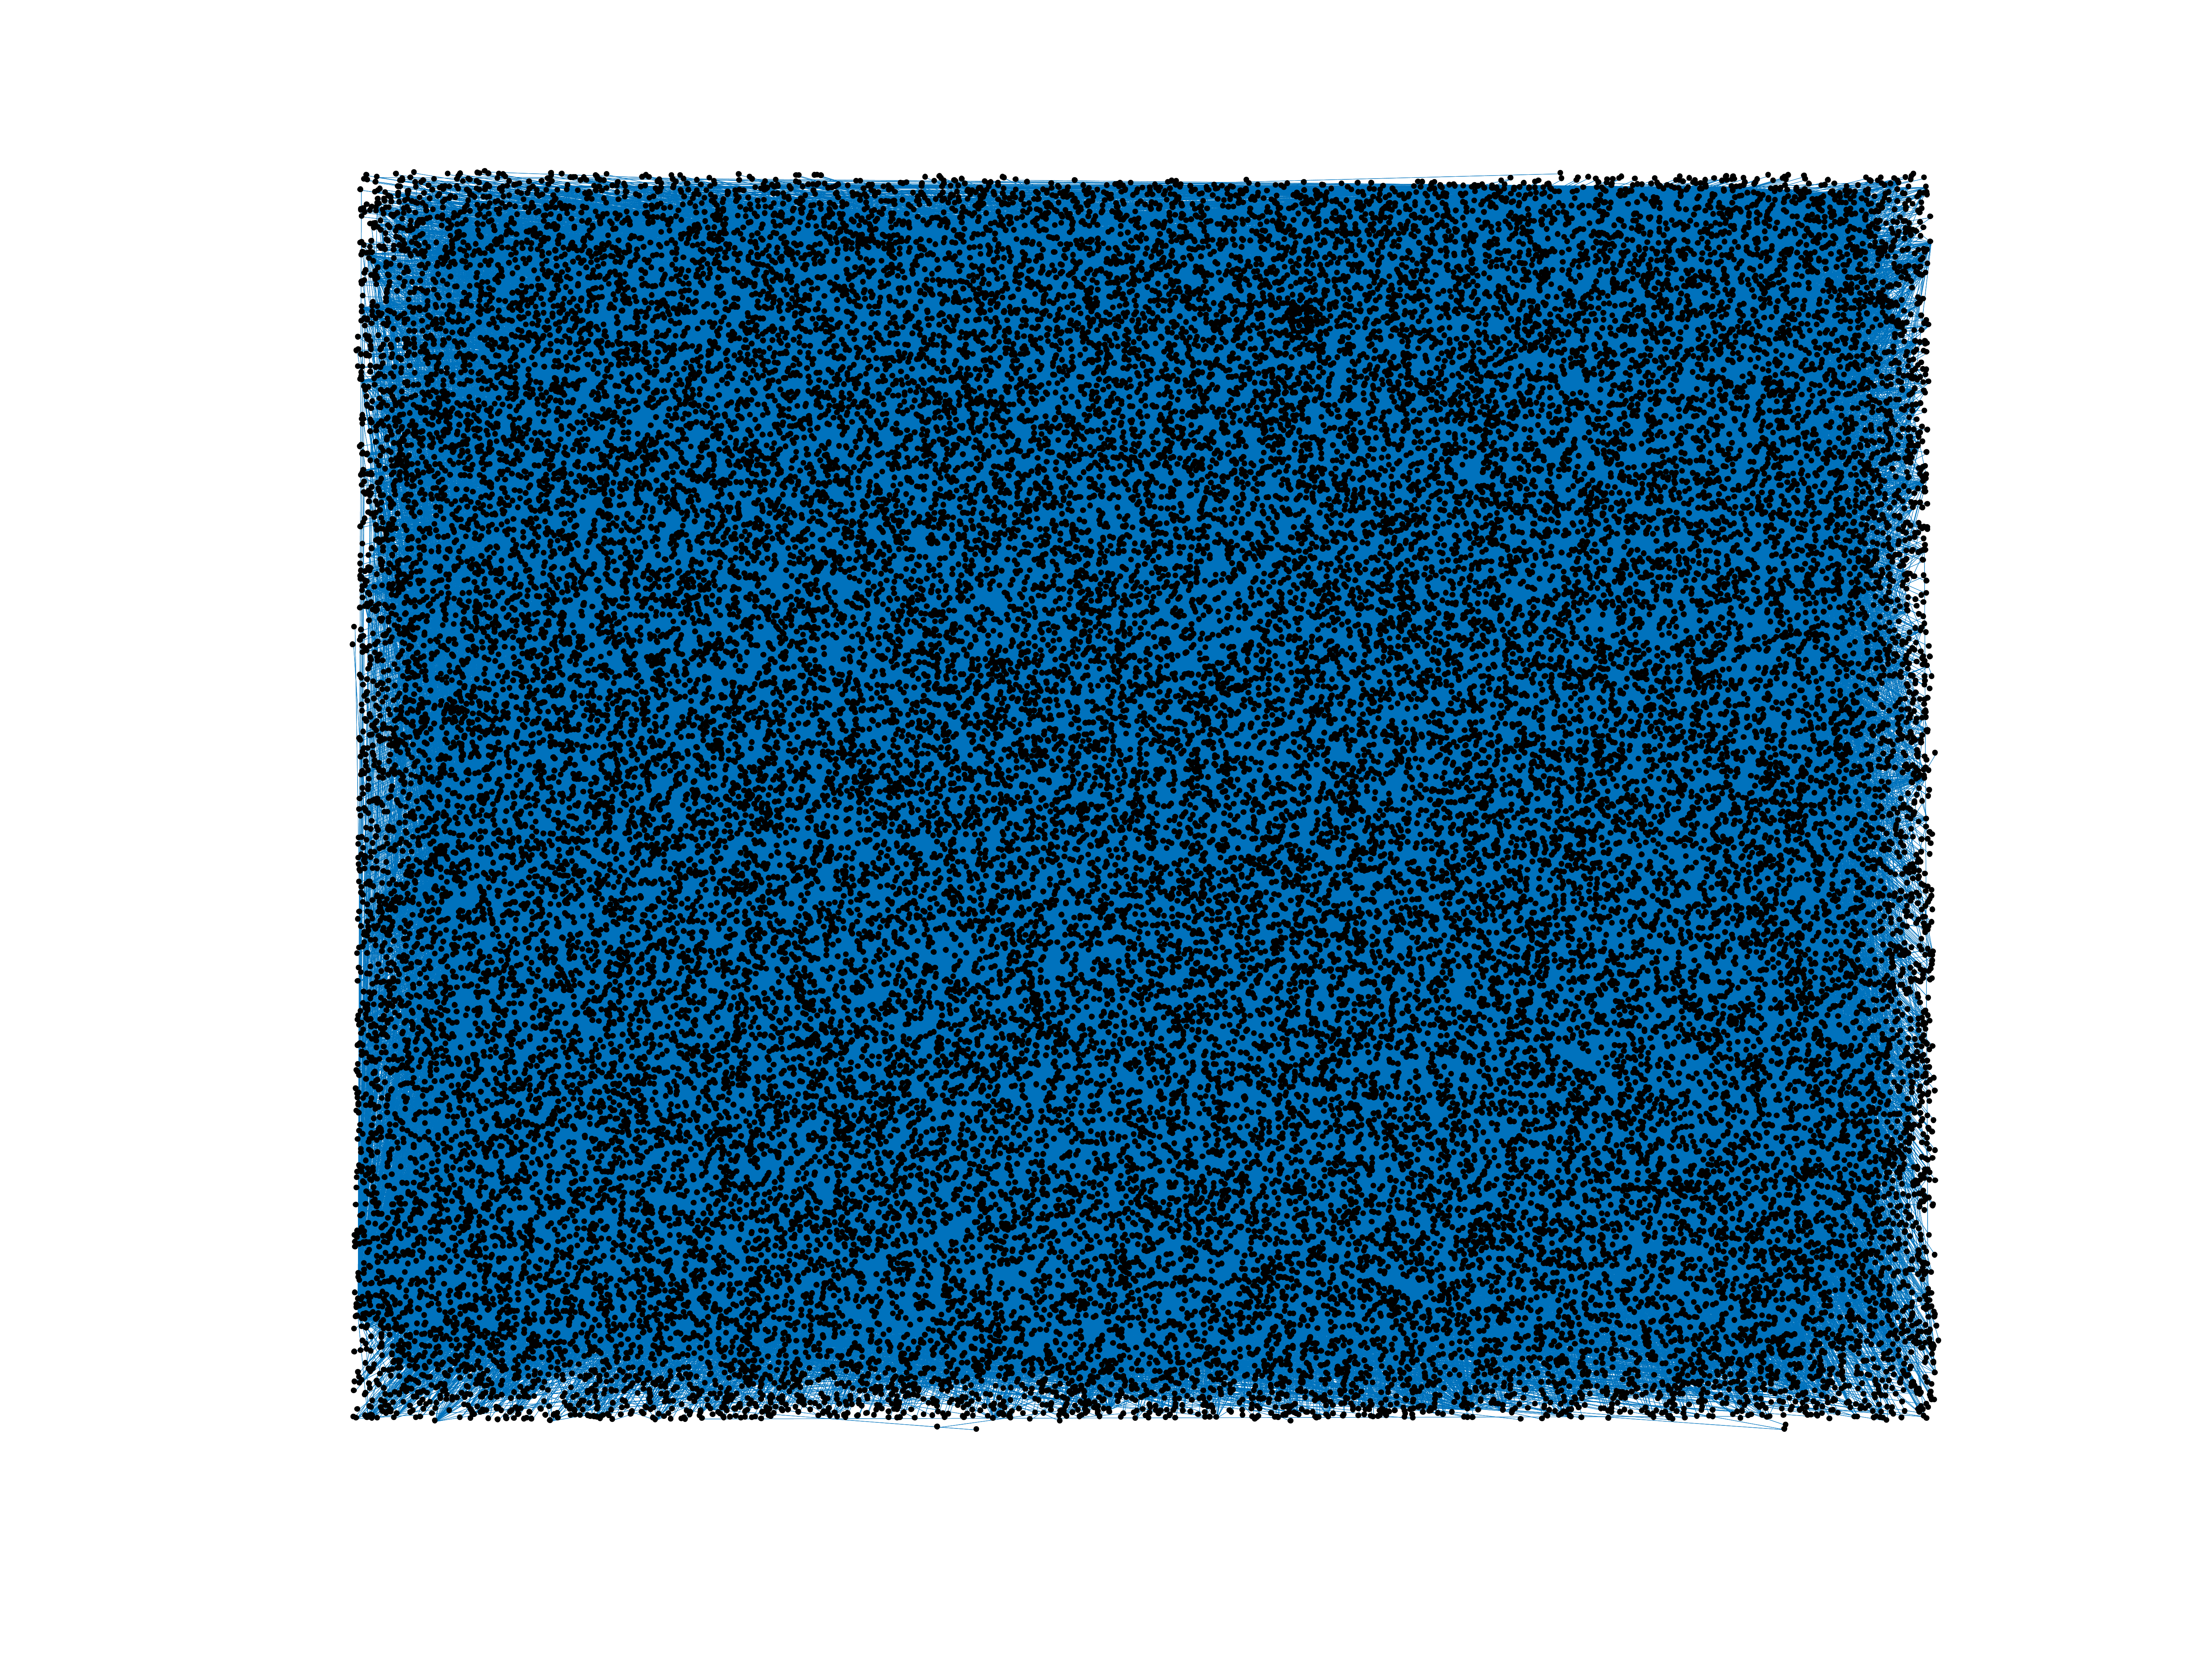
Wikipedia edits (ilo)
This is the bipartite edit network of the Iloko Wikipedia. It contains users
and pages from the Iloko Wikipedia, connected by edit events. Each edge
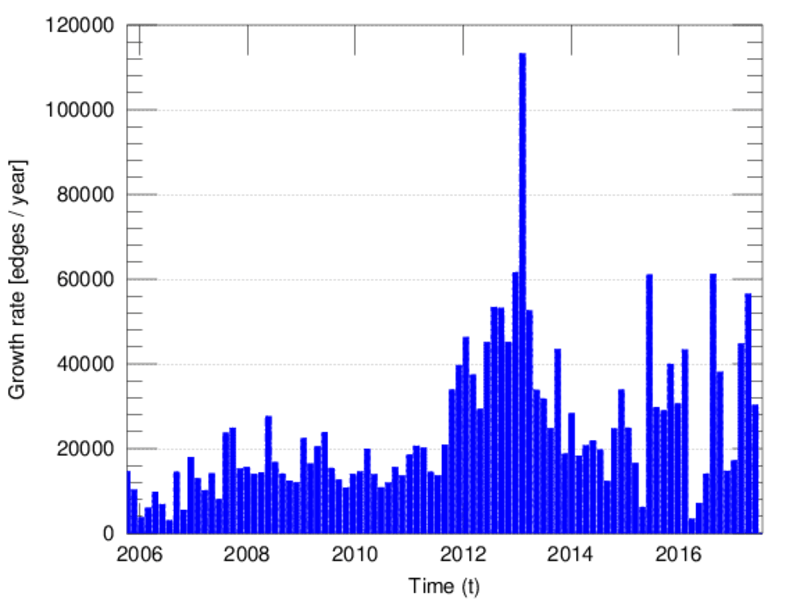
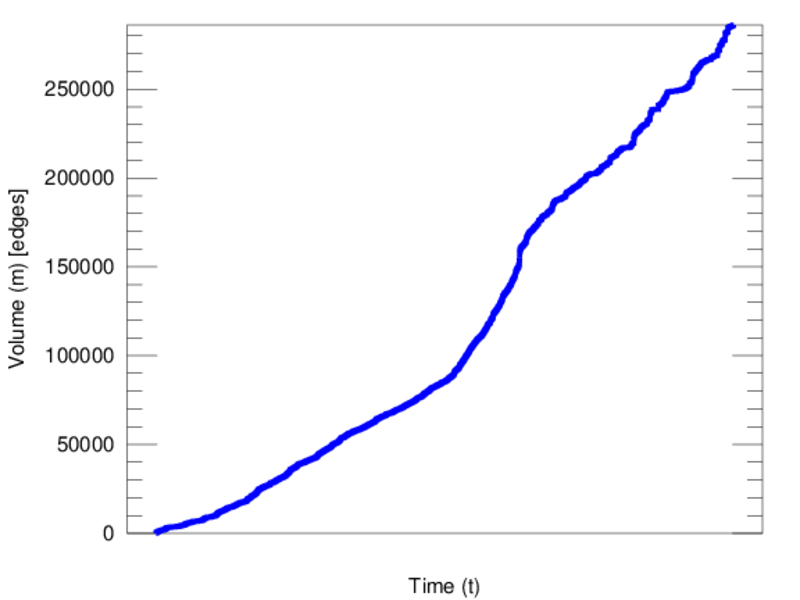
represents an edit. The dataset includes the timestamp of each edit.
Metadata
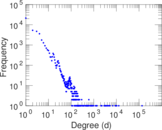
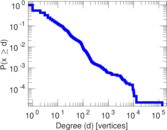
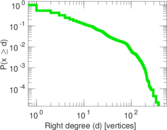
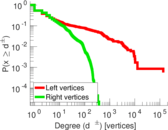
Statistics
| Size | n = | 46,658
|
| Left size | n1 = | 1,170
|
| Right size | n2 = | 45,488
|
| Volume | m = | 286,084
|
| Unique edge count | m̿ = | 119,023
|
| Wedge count | s = | 1,058,460,698
|
| Claw count | z = | 14,134,428,091,214
|
| Cross count | x = | 152,846,753,099,497,280
|
| Square count | q = | 283,772,312
|
| 4-Tour count | T4 = | 6,504,525,602
|
| Maximum degree | dmax = | 135,872
|
| Maximum left degree | d1max = | 135,872
|
| Maximum right degree | d2max = | 374
|
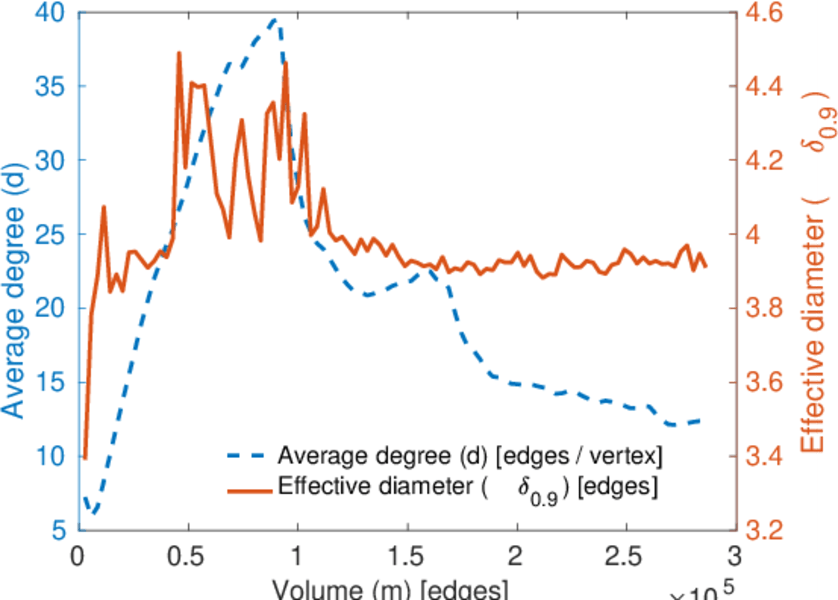
| Average degree | d = | 12.263 0
|
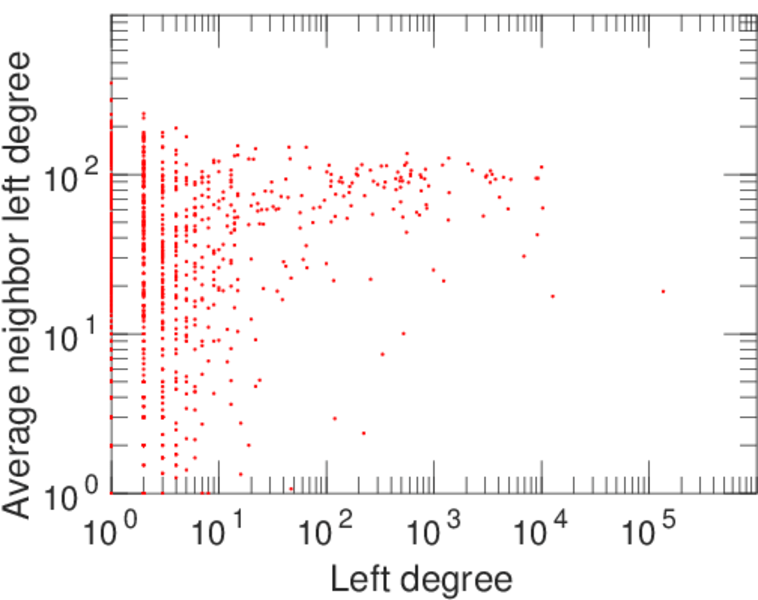
| Average left degree | d1 = | 244.516
|
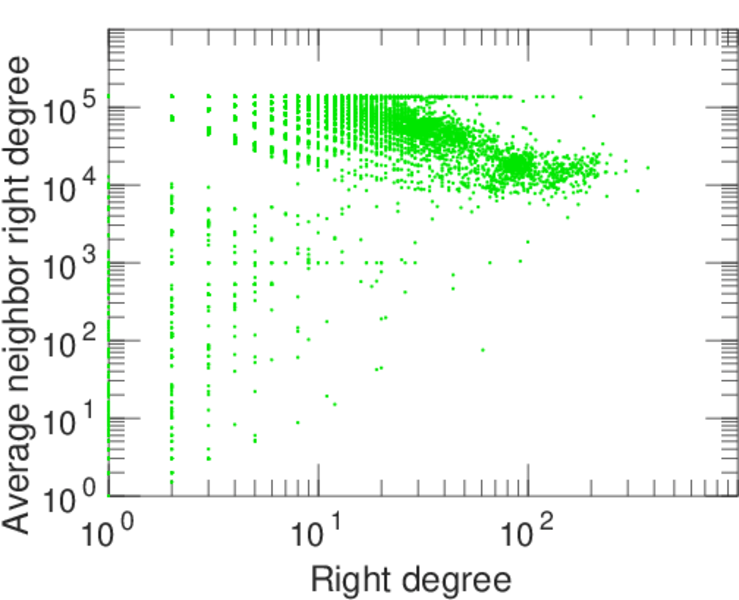
| Average right degree | d2 = | 6.289 22
|
| Fill | p = | 0.002 236 39
|
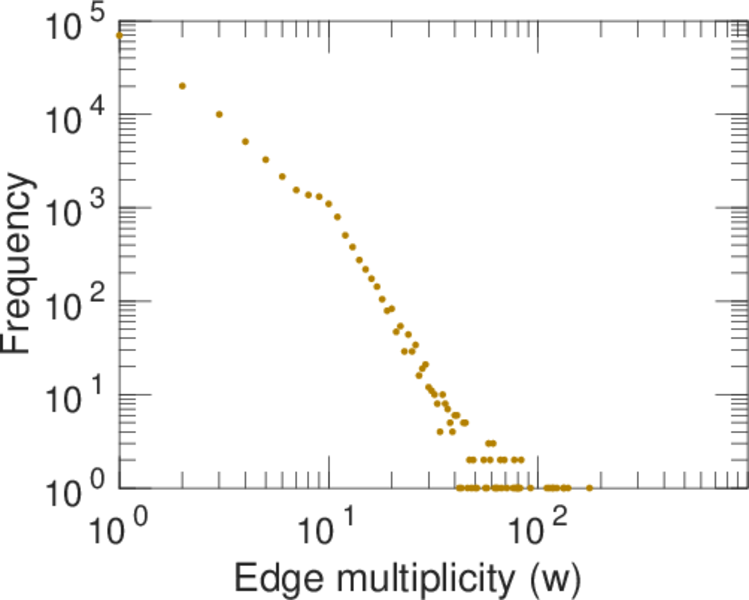
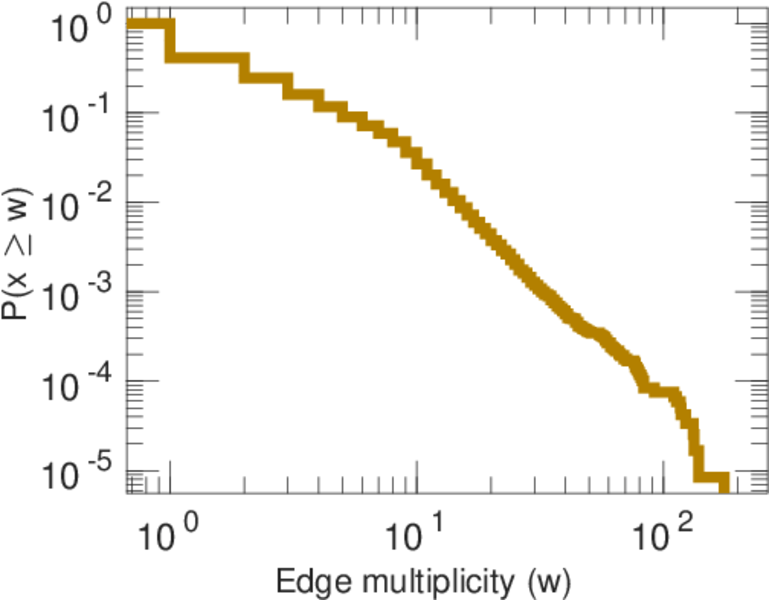
| Average edge multiplicity | m̃ = | 2.403 60
|
| Size of LCC | N = | 45,972
|
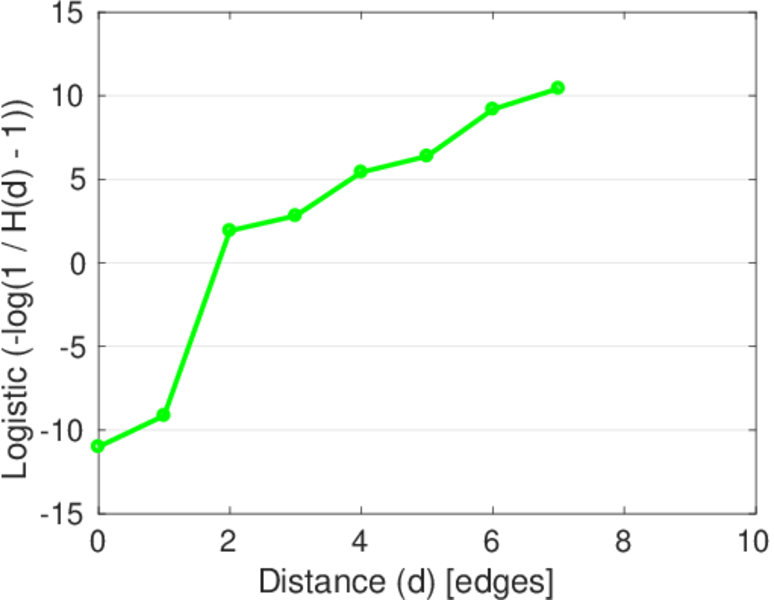
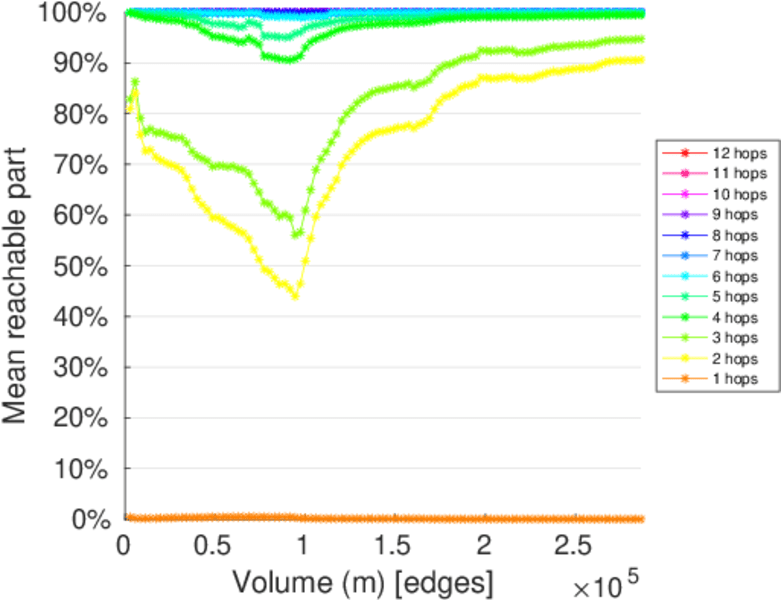
| Diameter | δ = | 10
|
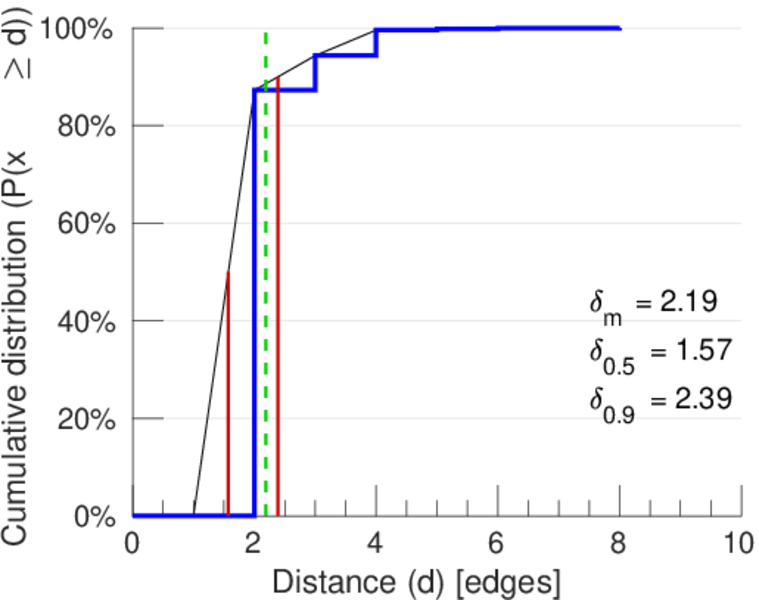
| 50-Percentile effective diameter | δ0.5 = | 1.573 05
|
| 90-Percentile effective diameter | δ0.9 = | 2.388 41
|
| Median distance | δM = | 2
|
| Mean distance | δm = | 2.190 27
|
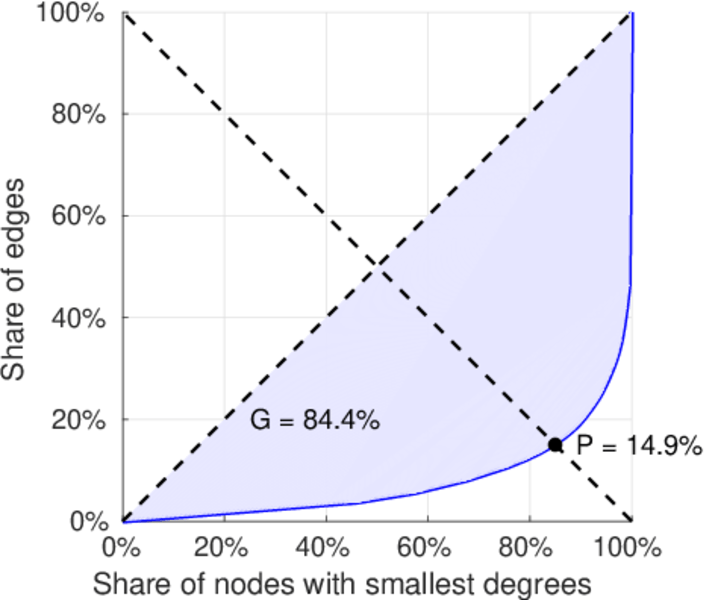
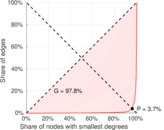
| Gini coefficient | G = | 0.847 121
|
| Balanced inequality ratio | P = | 0.149 232
|
| Left balanced inequality ratio | P1 = | 0.036 723 5
|
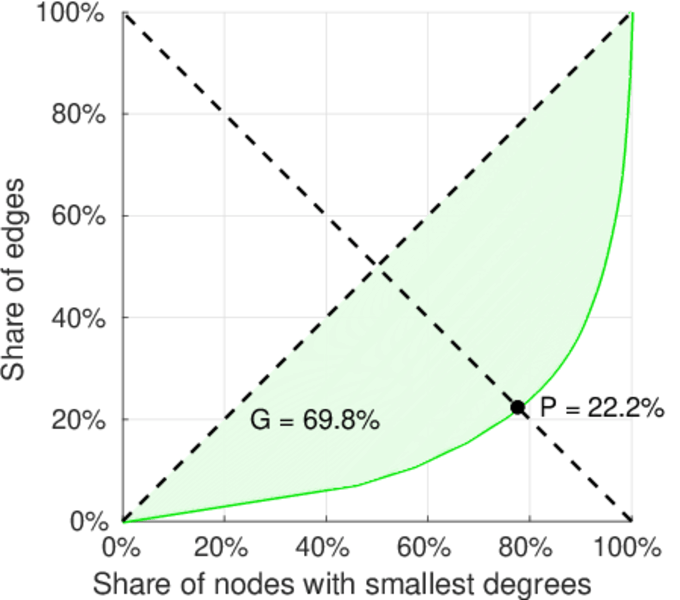
| Right balanced inequality ratio | P2 = | 0.222 309
|
| Relative edge distribution entropy | Her = | 0.677 308
|
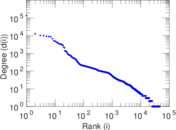
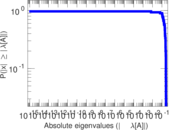
| Power law exponent | γ = | 3.368 12
|
| Tail power law exponent | γt = | 2.201 00
|
| Tail power law exponent with p | γ3 = | 2.201 00
|
| p-value | p = | 0.000 00
|
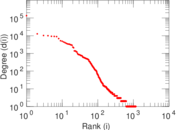
| Left tail power law exponent with p | γ3,1 = | 1.681 00
|
| Left p-value | p1 = | 0.000 00
|
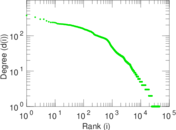
| Right tail power law exponent with p | γ3,2 = | 2.231 00
|
| Right p-value | p2 = | 0.000 00
|
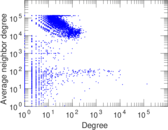
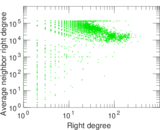
| Degree assortativity | ρ = | −0.597 229
|
| Degree assortativity p-value | pρ = | 0.000 00
|
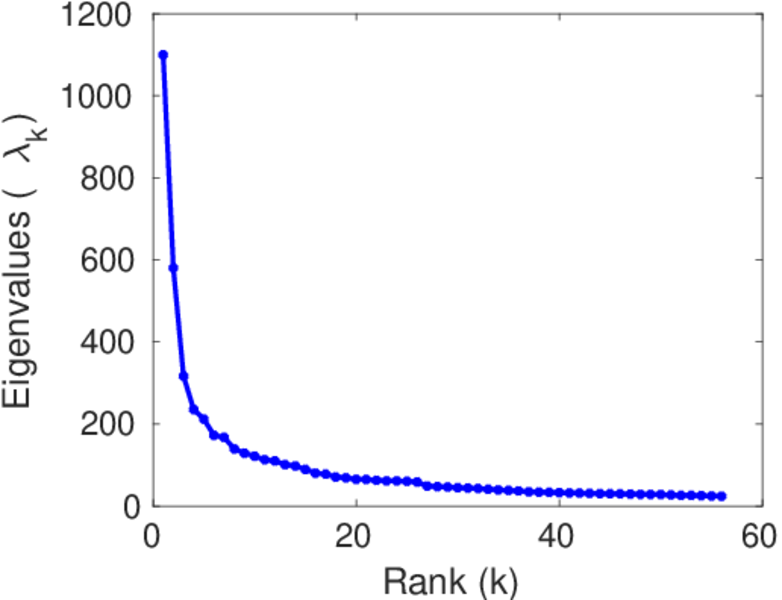
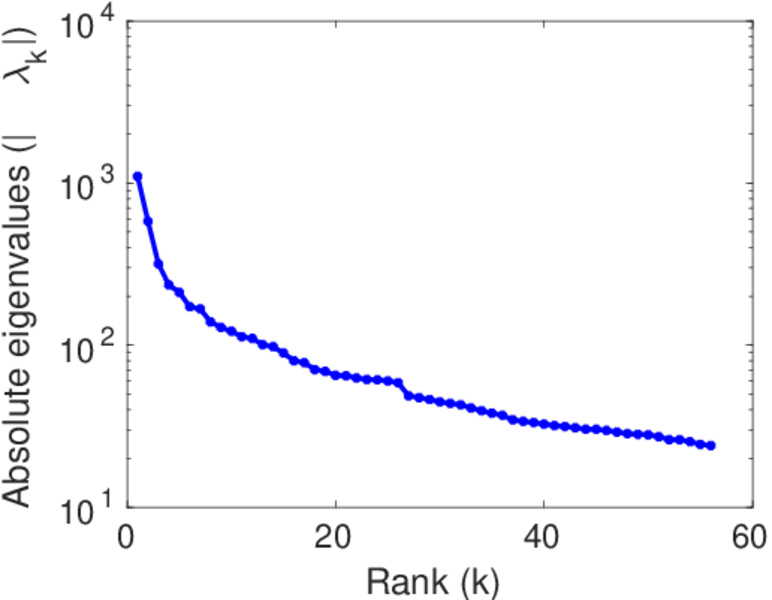
| Spectral norm | α = | 1,099.40
|
| Algebraic connectivity | a = | 0.007 034 65
|
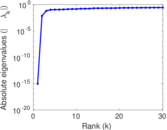
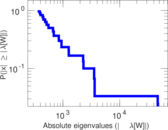
| Spectral separation | |λ1[A] / λ2[A]| = | 1.894 72
|
| Controllability | C = | 44,169
|
| Relative controllability | Cr = | 0.953 583
|
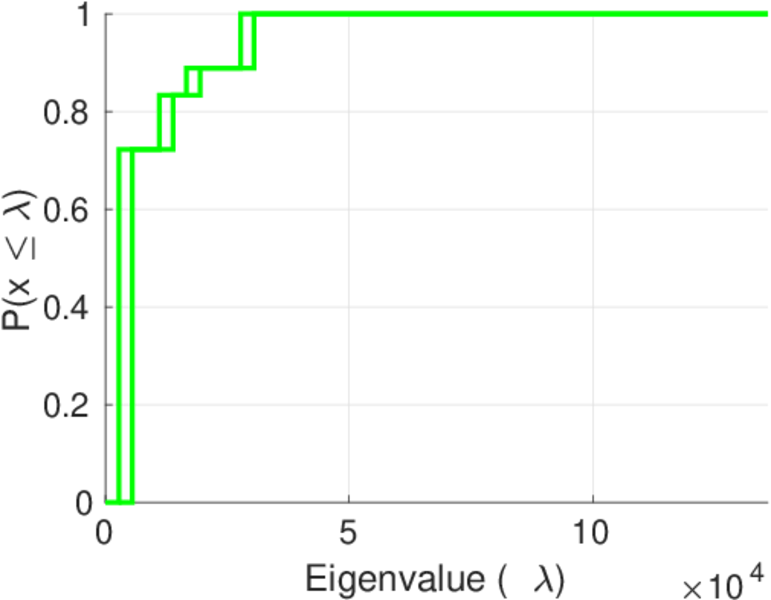
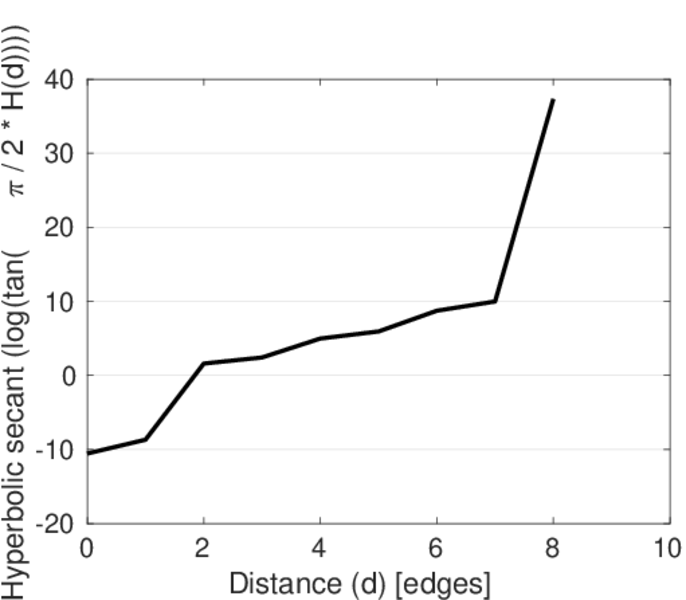
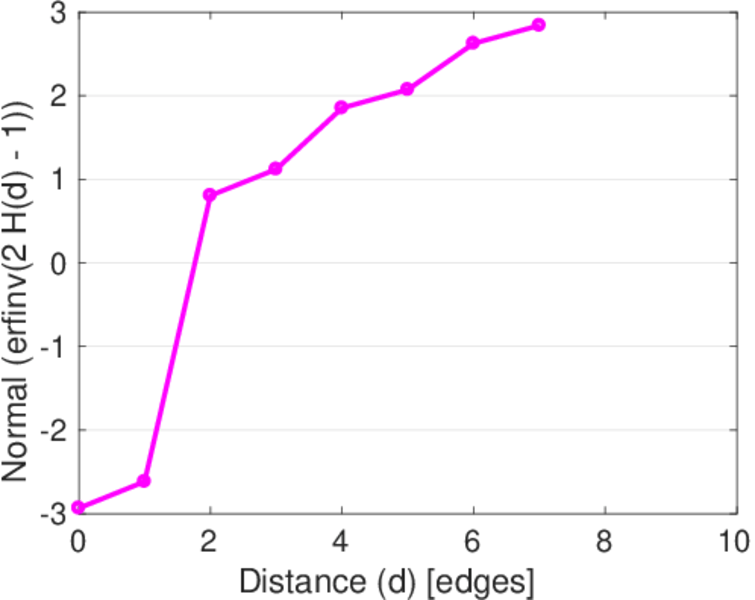
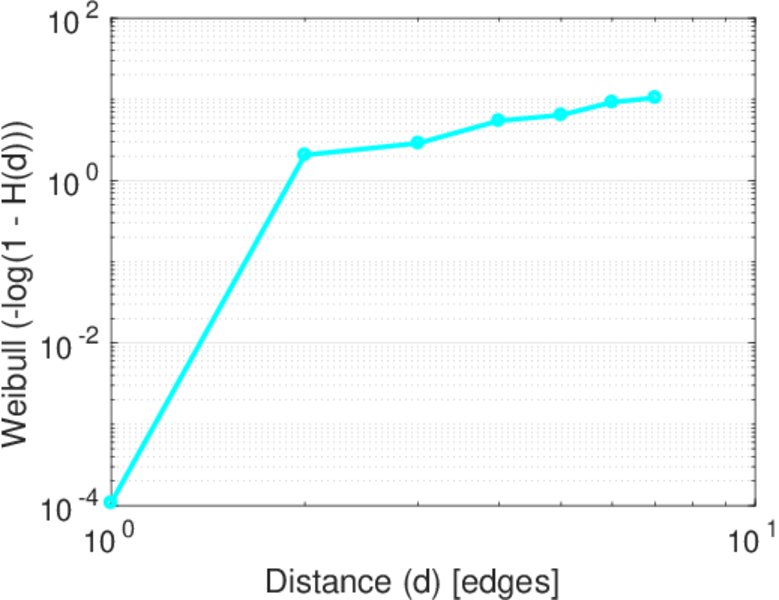
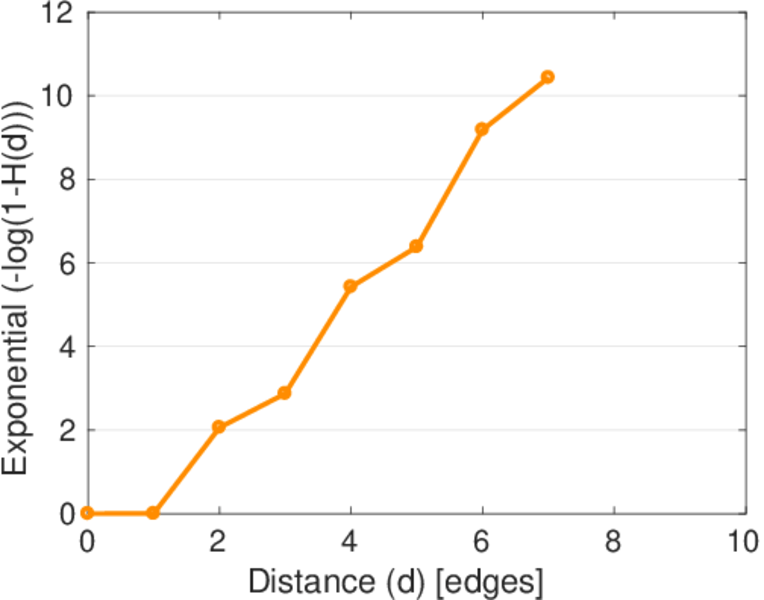
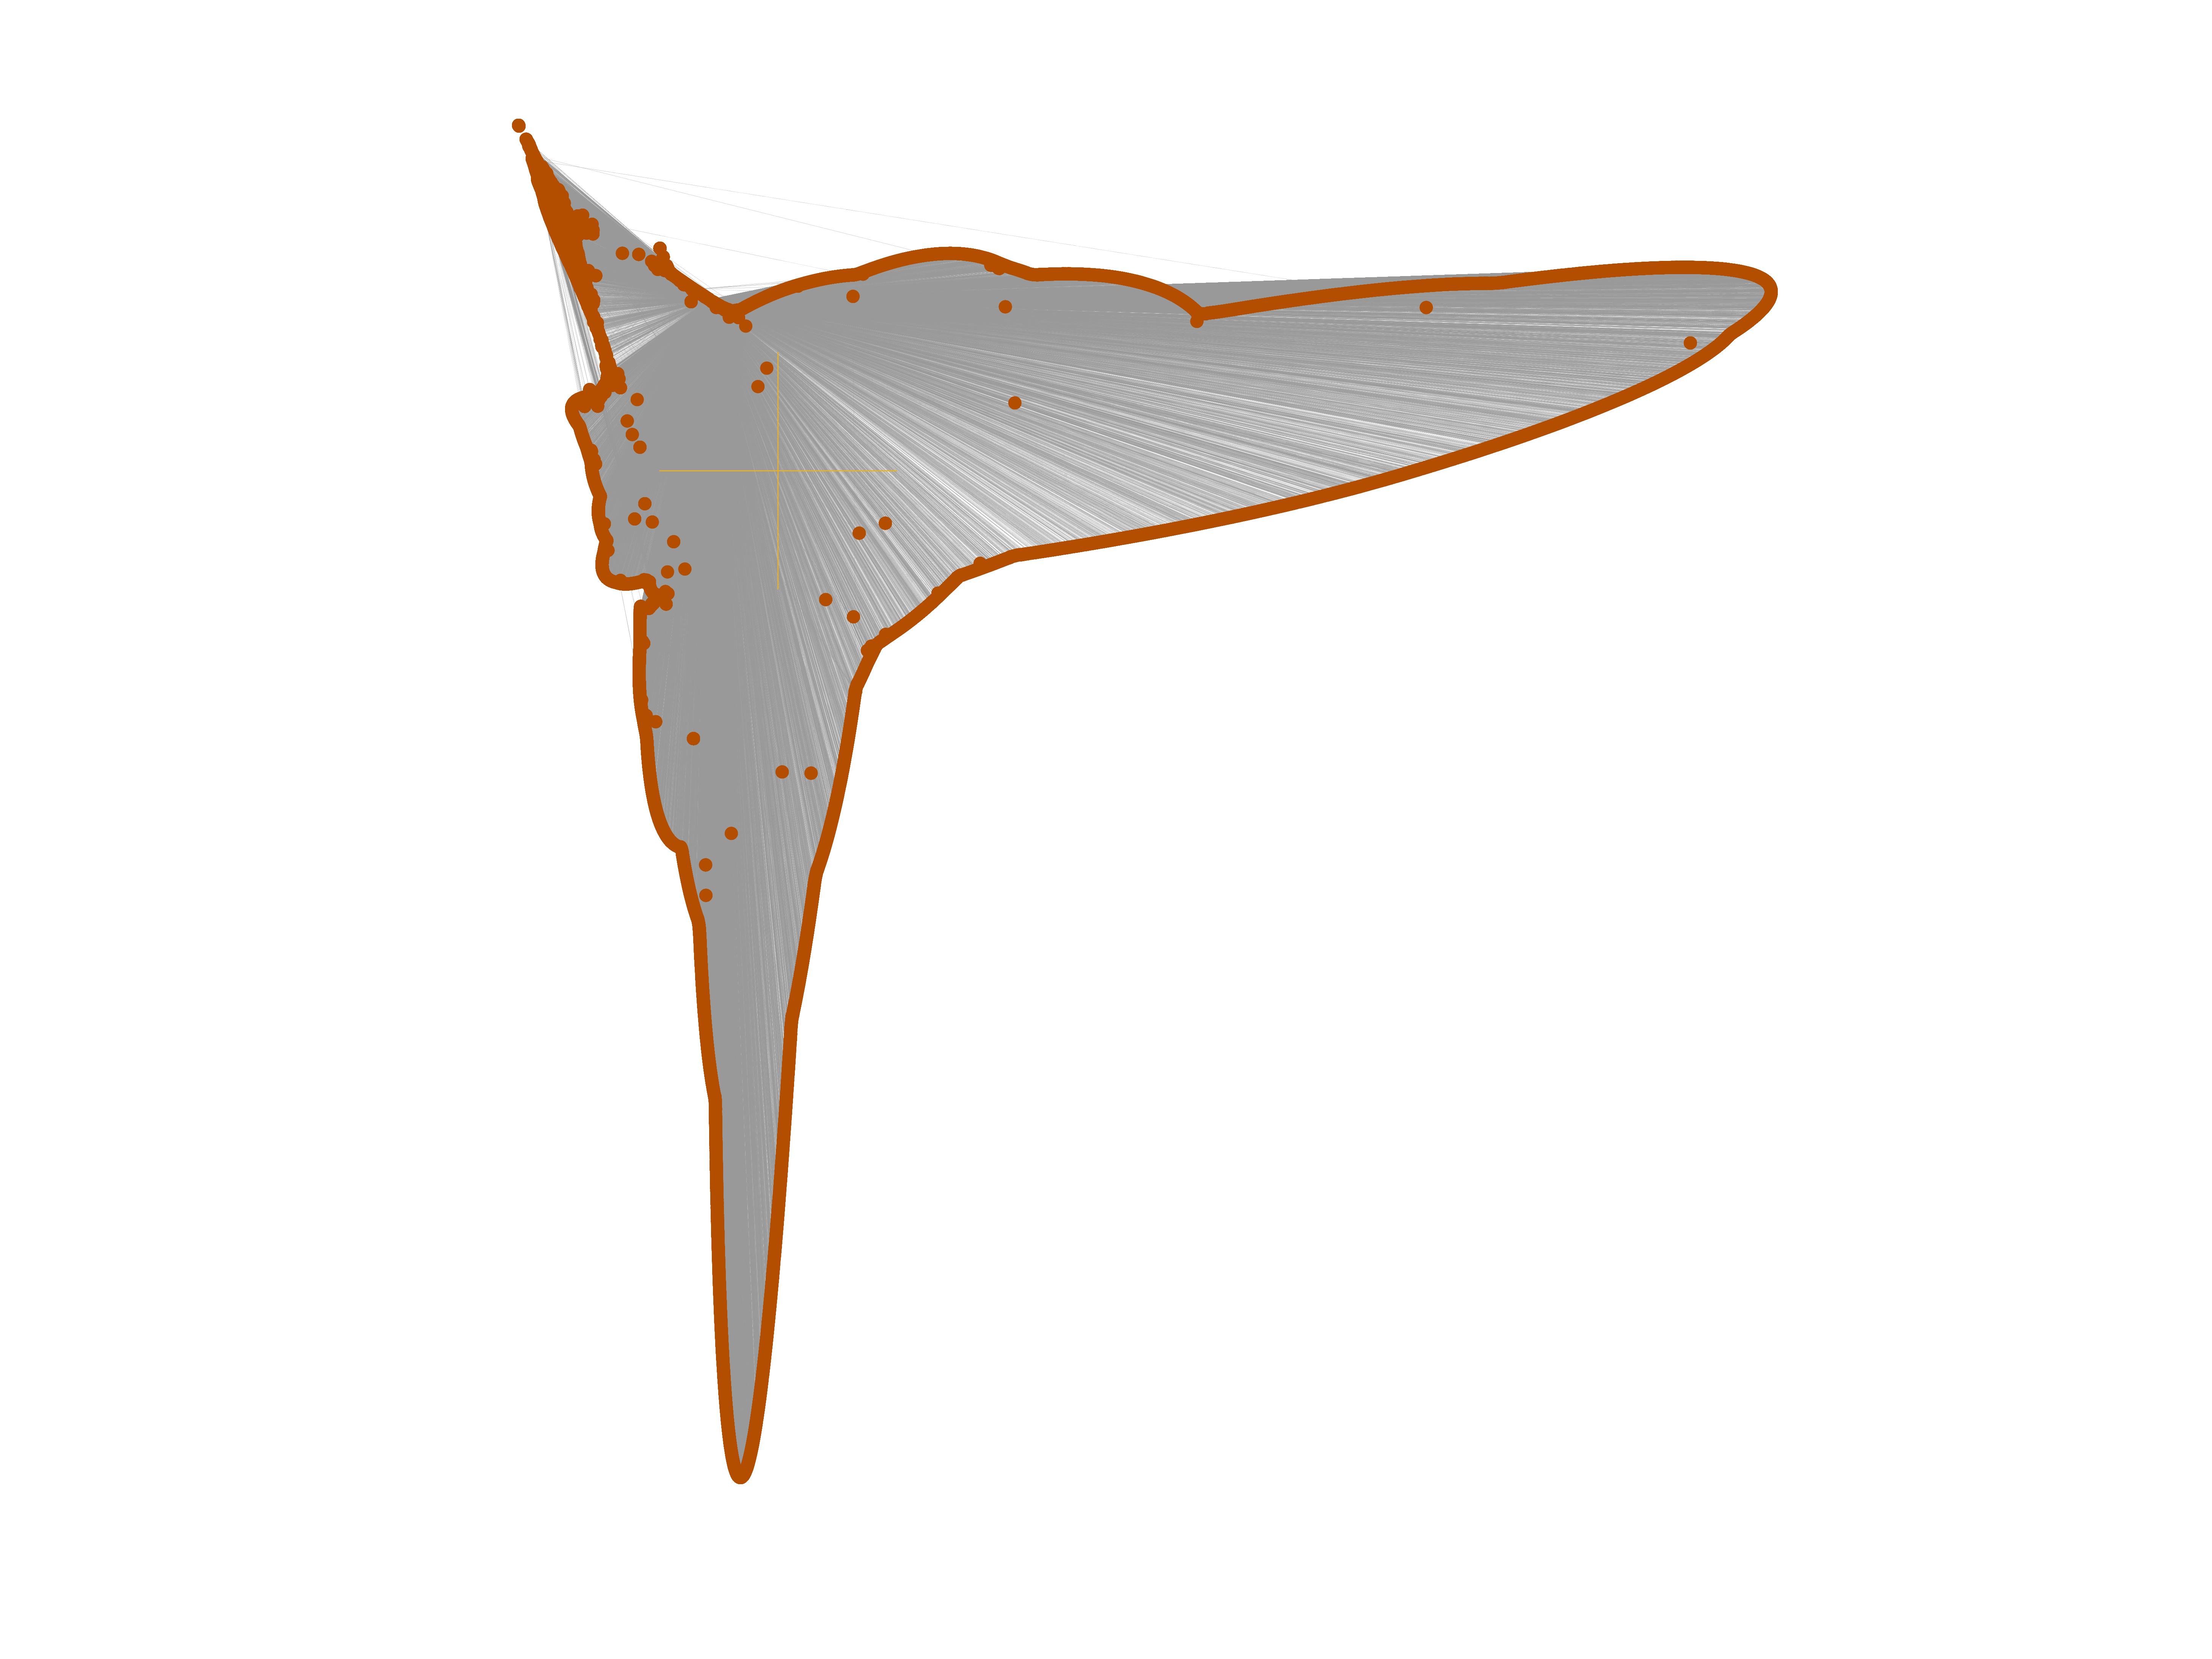
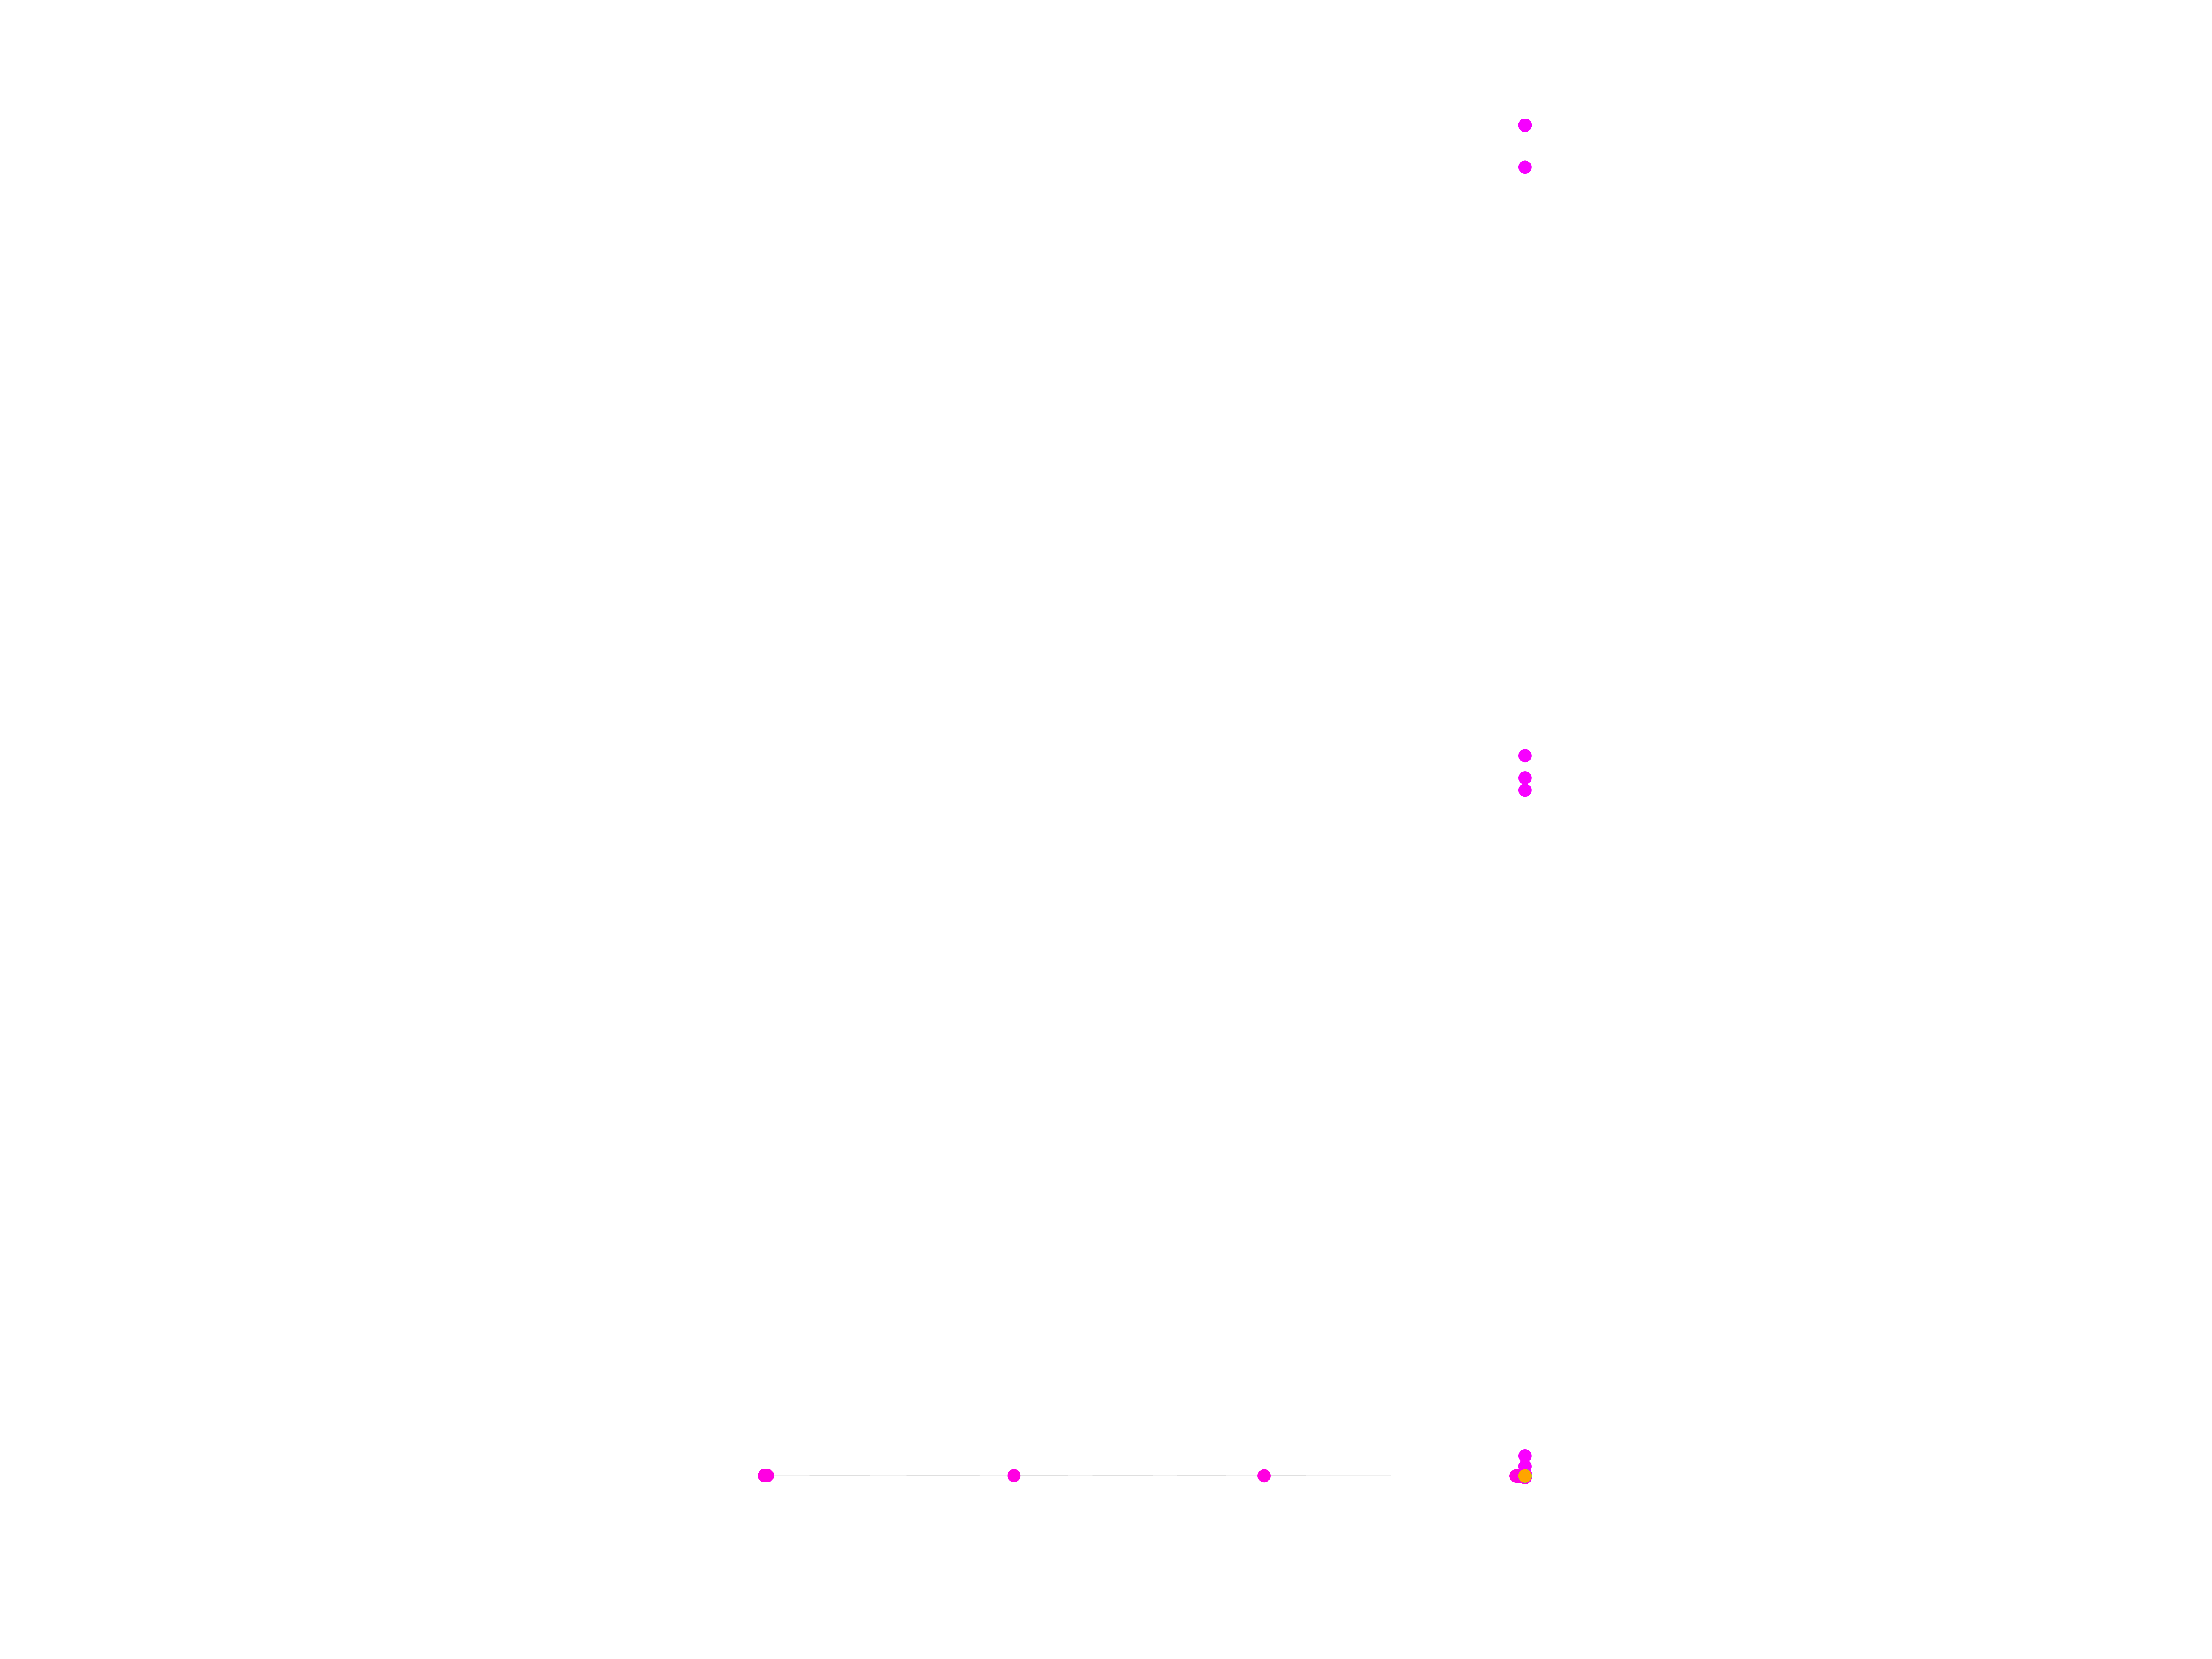
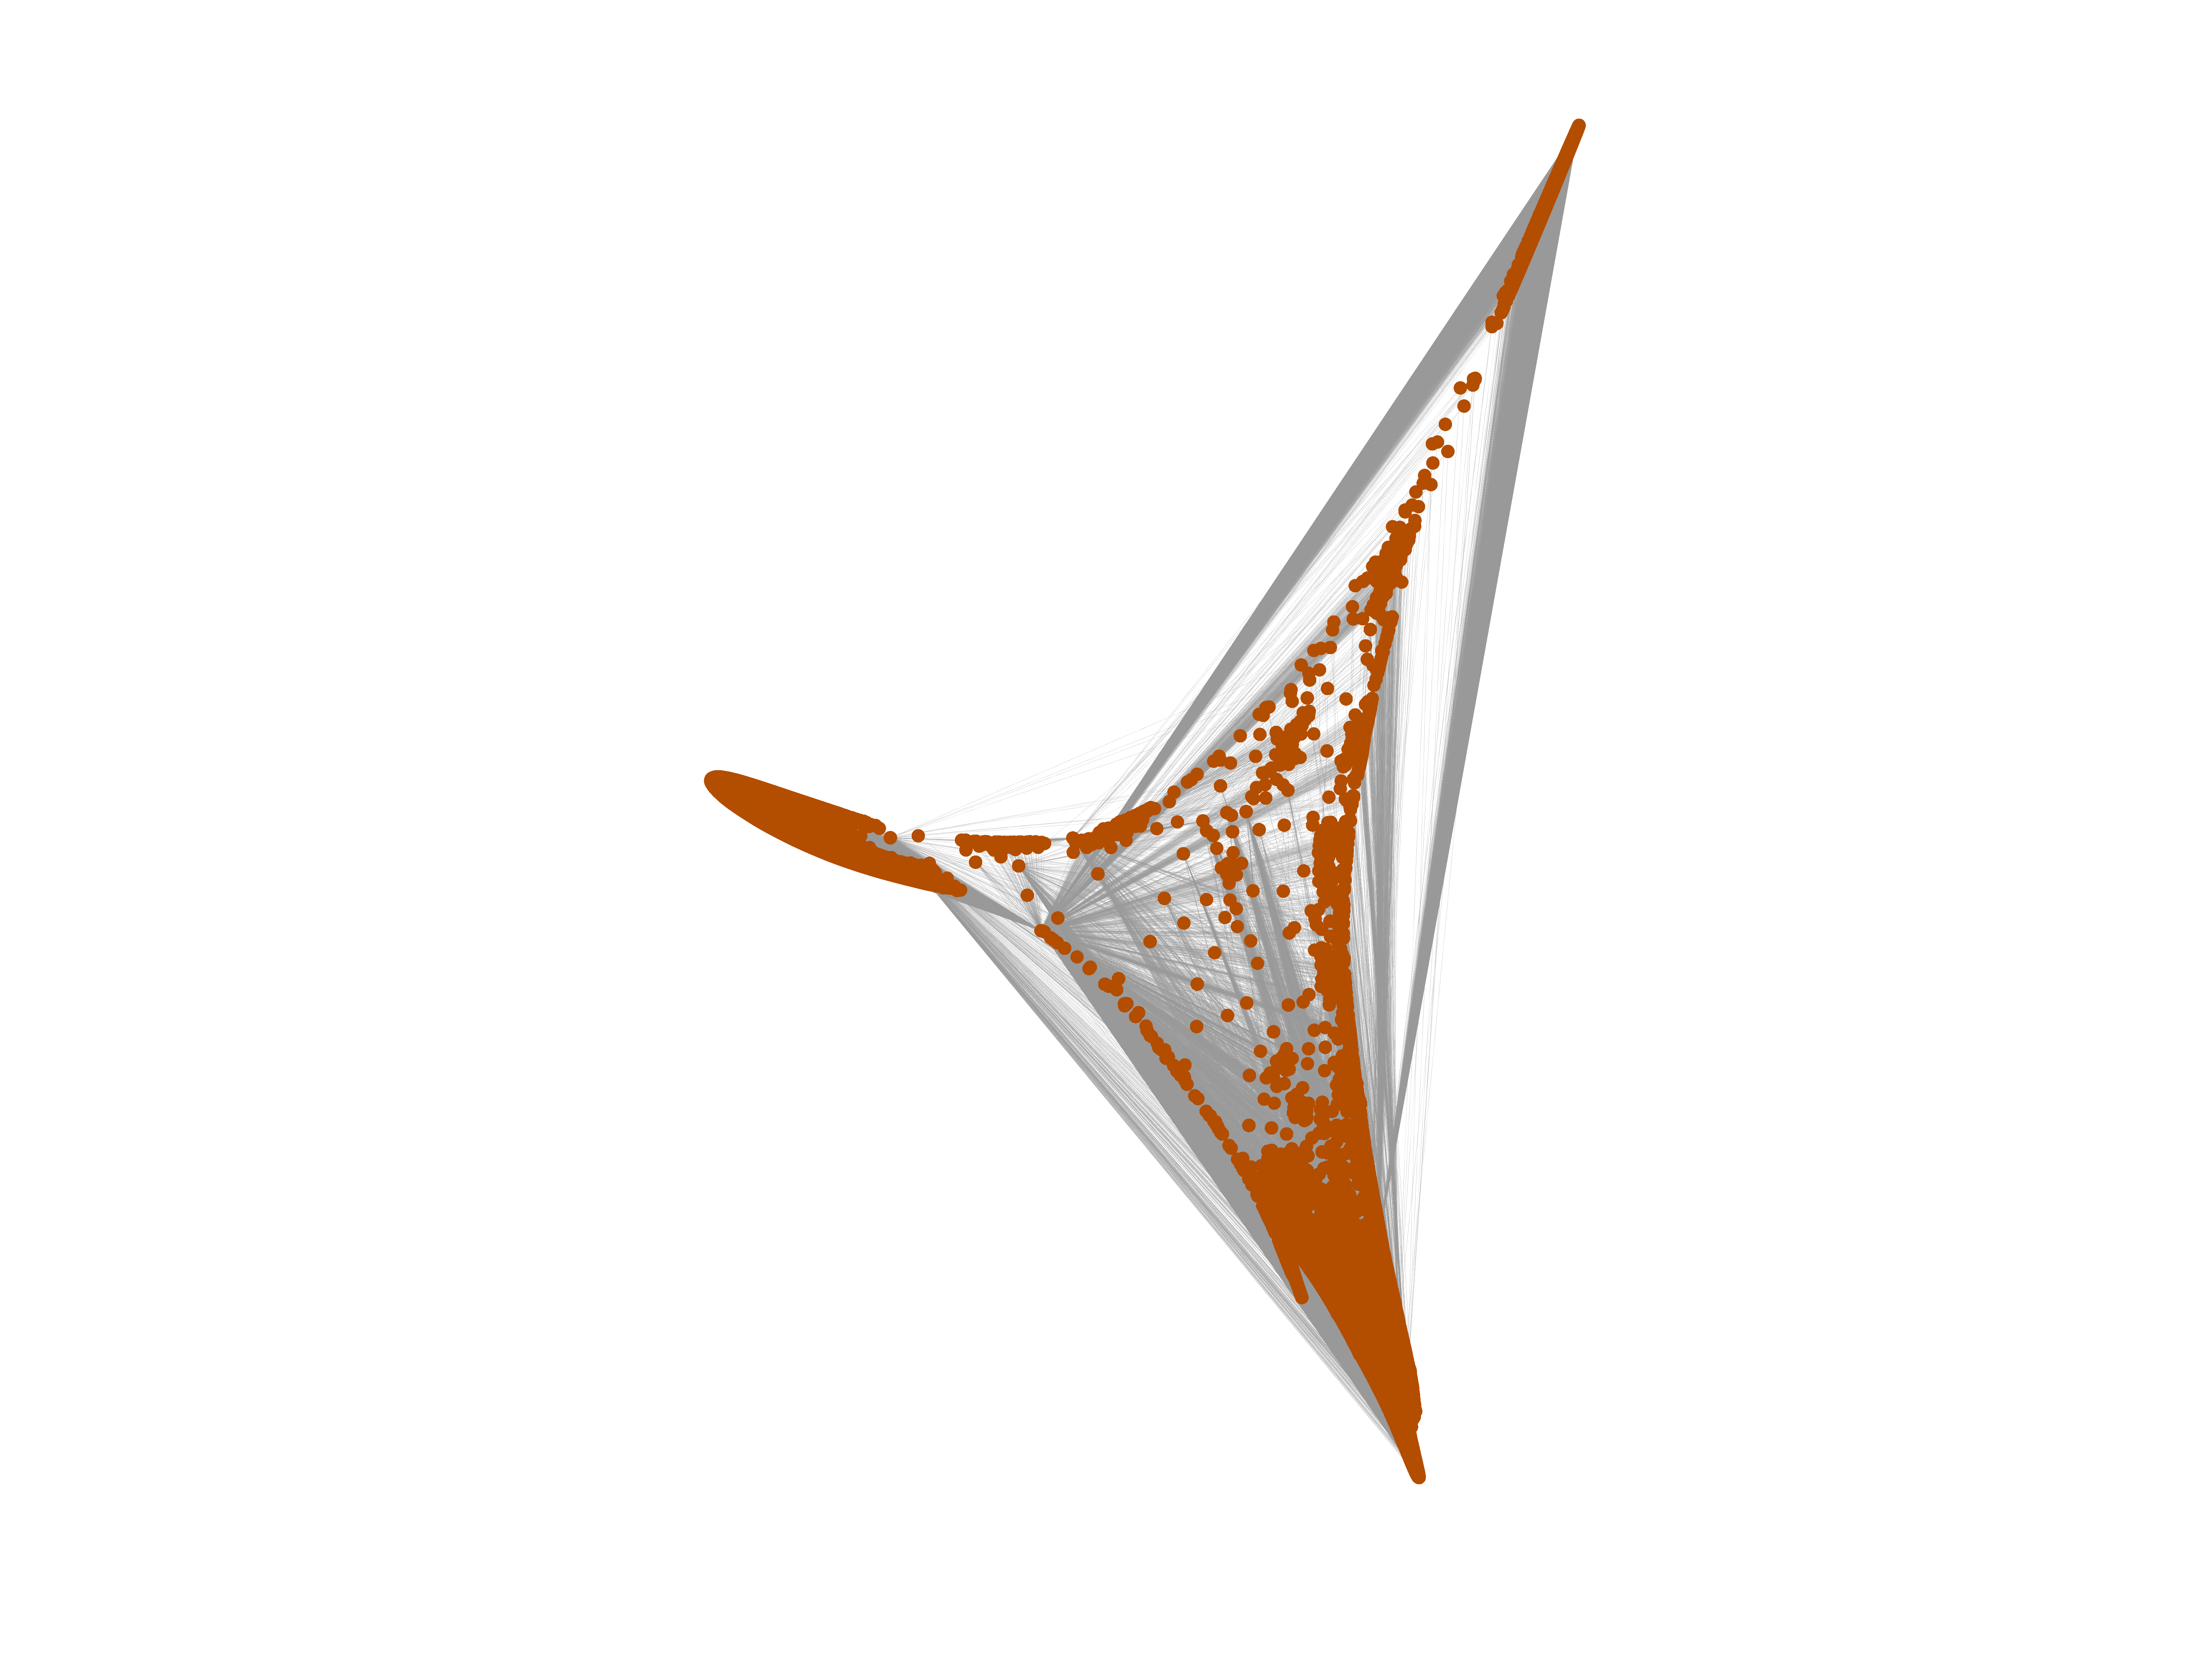
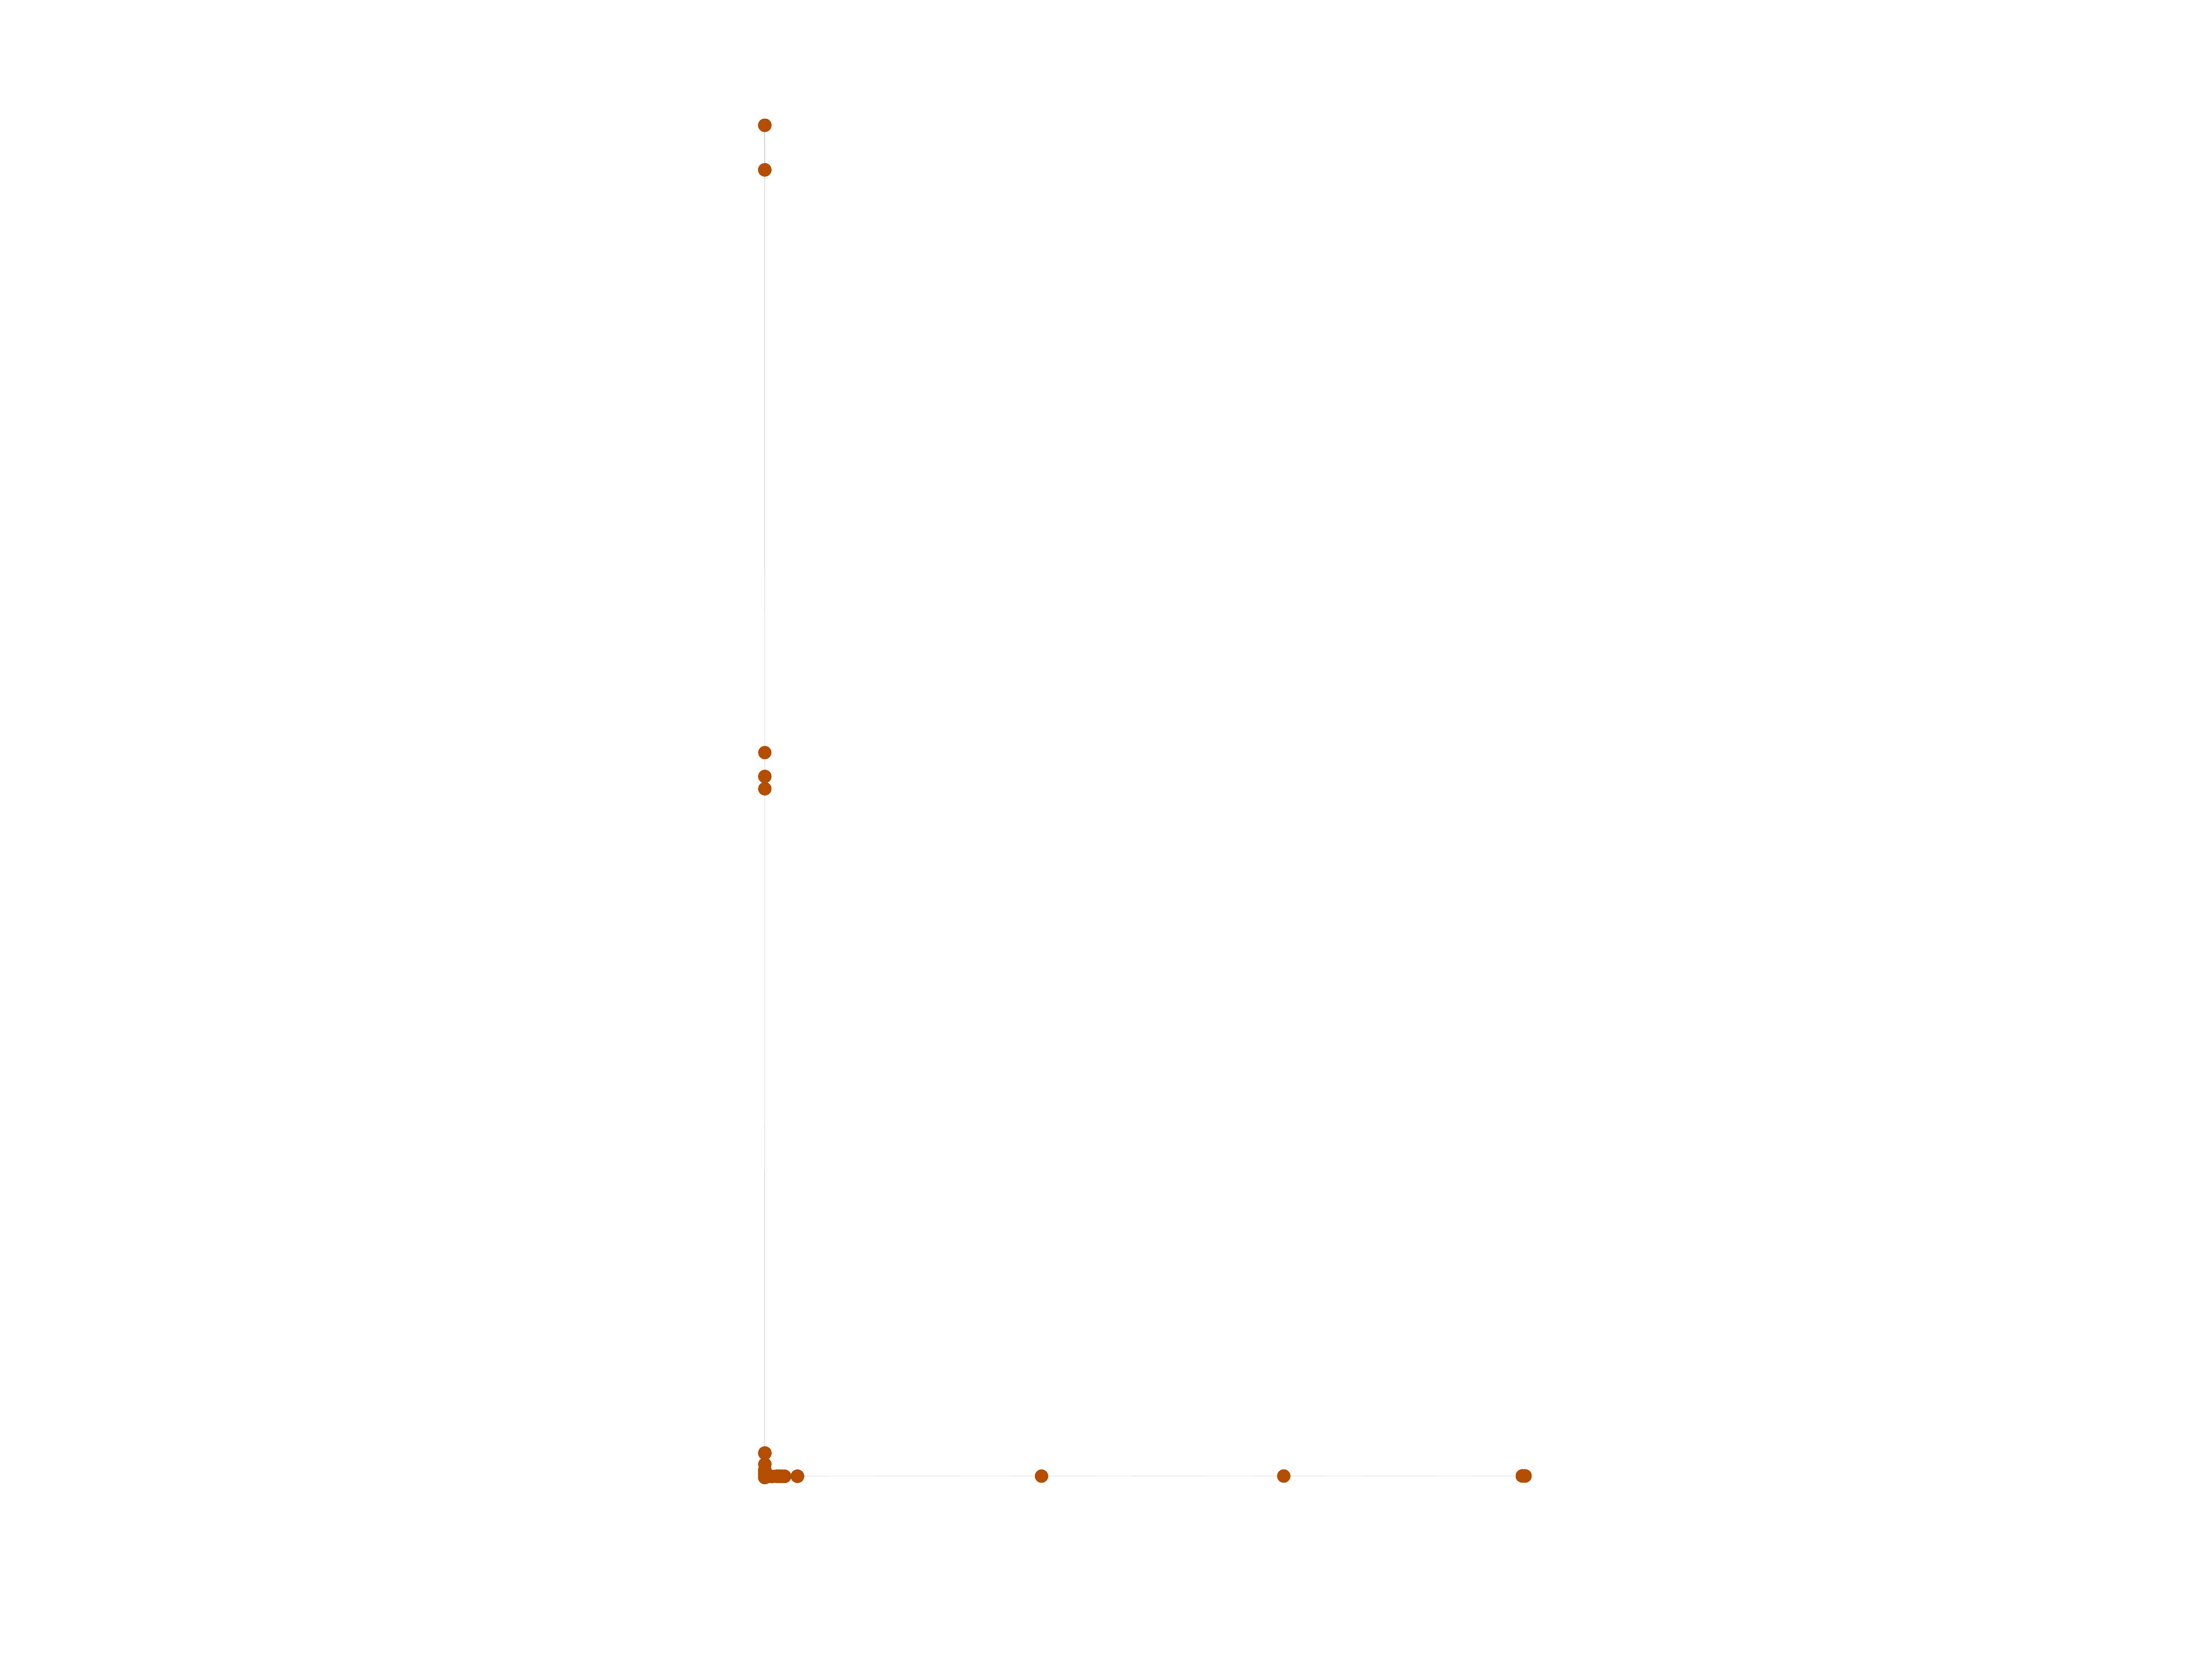
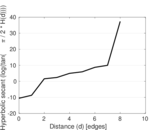
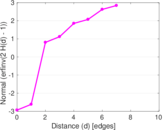
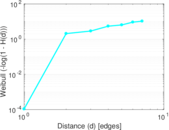
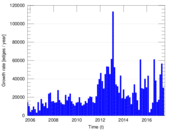
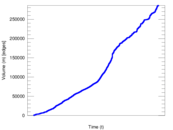
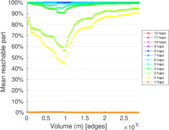
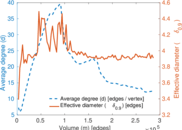
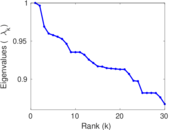
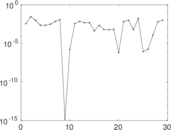
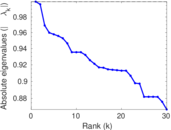
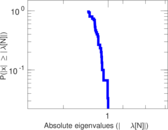
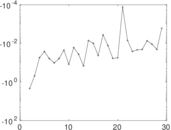
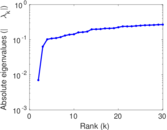
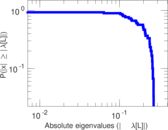
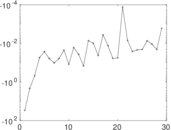
Plots


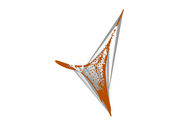


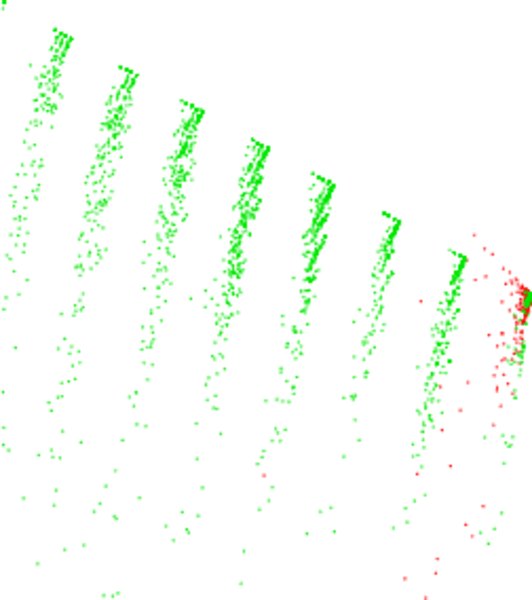
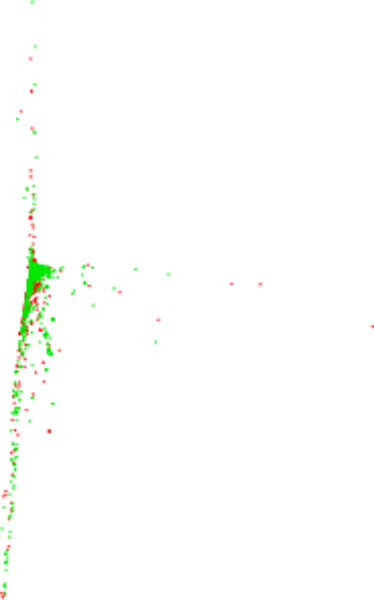
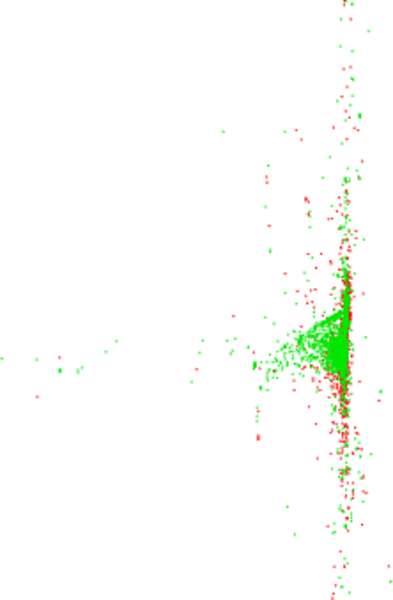
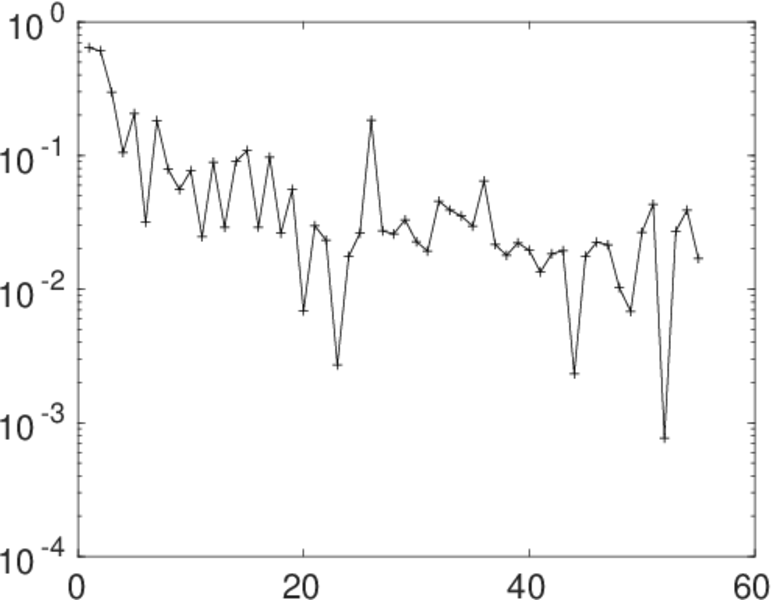
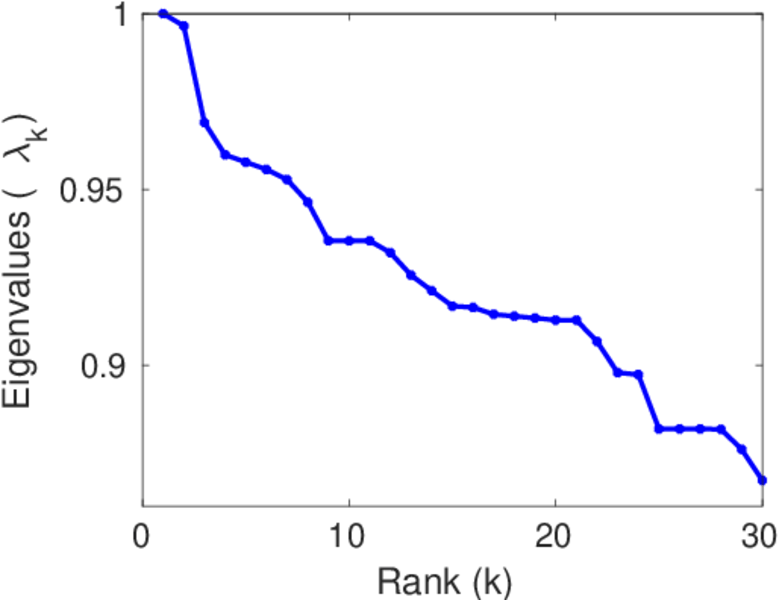
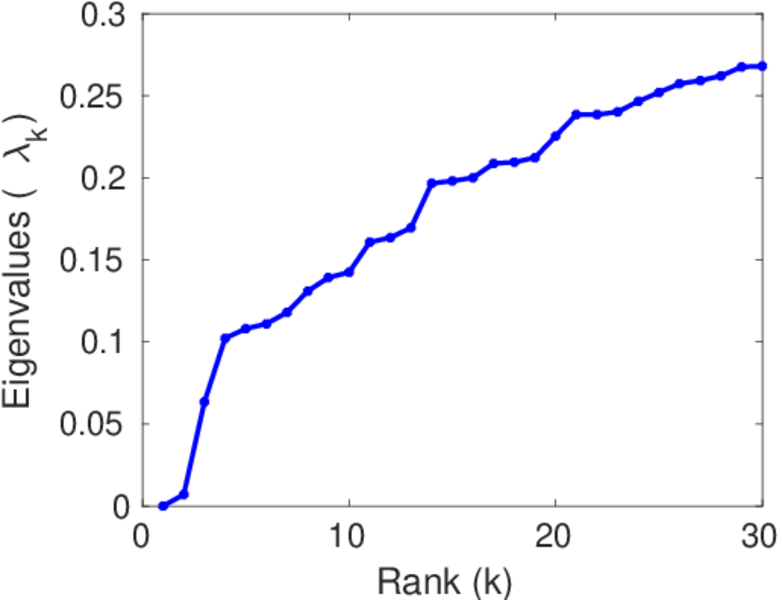
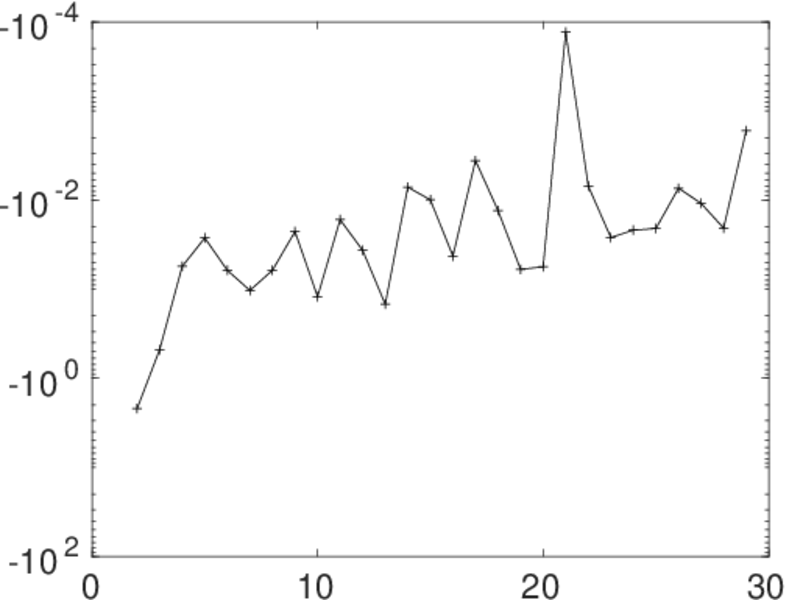
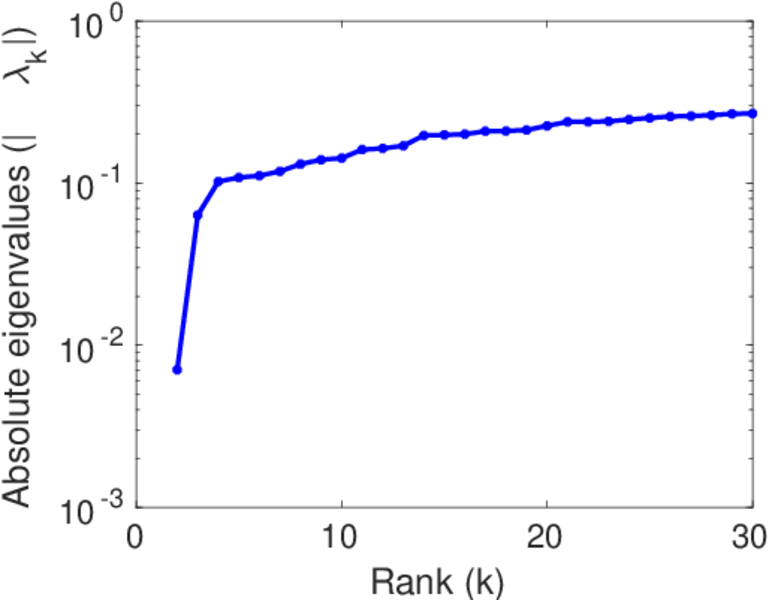
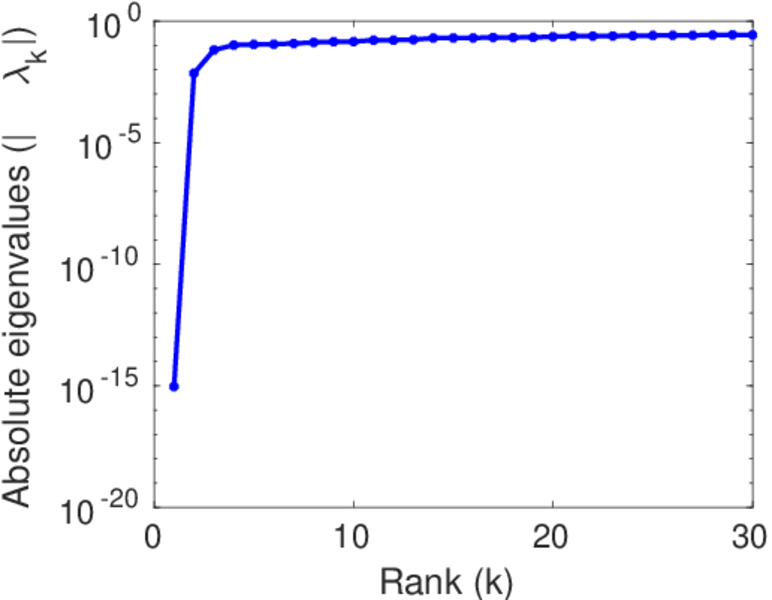
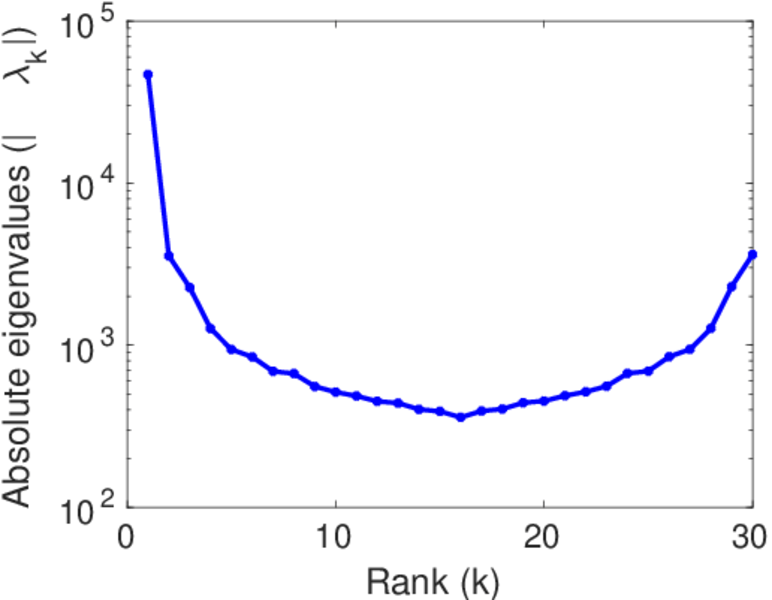
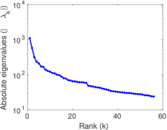
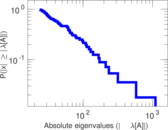
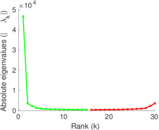
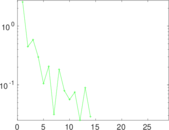
Matrix decompositions plots


Downloads
References
|
[1]
|
Jérôme Kunegis.
KONECT – The Koblenz Network Collection.
In Proc. Int. Conf. on World Wide Web Companion, pages
1343–1350, 2013.
[ http ]
|
|
[2]
|
Wikimedia Foundation.
Wikimedia downloads.
http://dumps.wikimedia.org/, January 2010.
|
 KONECT ‣ Networks ‣
Buy Me a Coffee
KONECT ‣ Networks ‣
Buy Me a Coffee