Wikipedia edits (io)
This is the bipartite edit network of the Ido Wikipedia. It contains users and
pages from the Ido Wikipedia, connected by edit events. Each edge represents an
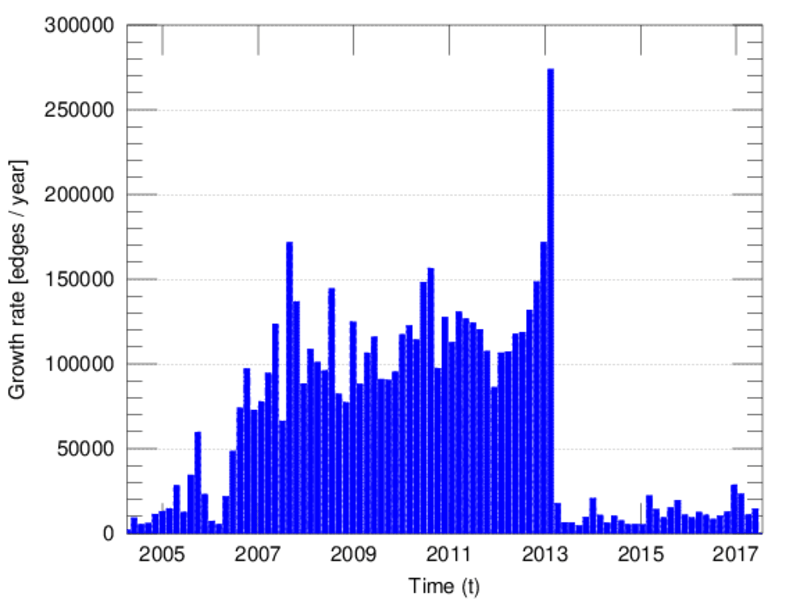
edit. The dataset includes the timestamp of each edit.
Metadata
Statistics
| Size | n = | 43,718
|
| Left size | n1 = | 2,797
|
| Right size | n2 = | 40,921
|
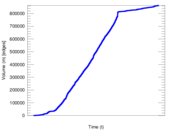
| Volume | m = | 863,473
|
| Unique edge count | m̿ = | 424,078
|
| Wedge count | s = | 2,354,915,543
|
| Claw count | z = | 13,665,461,973,792
|
| Cross count | x = | 69,853,069,214,684,440
|
| Square count | q = | 7,567,877,905
|
| 4-Tour count | T4 = | 69,963,554,720
|
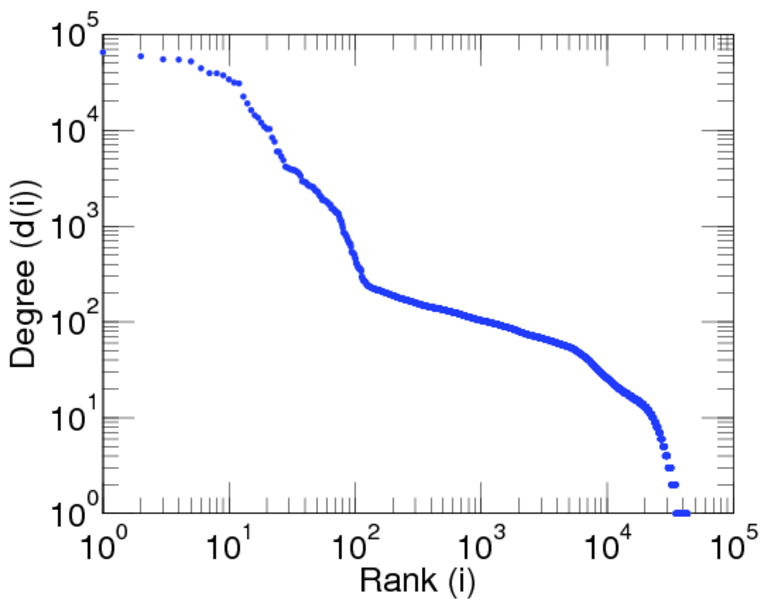
| Maximum degree | dmax = | 65,098
|
| Maximum left degree | d1max = | 65,098
|
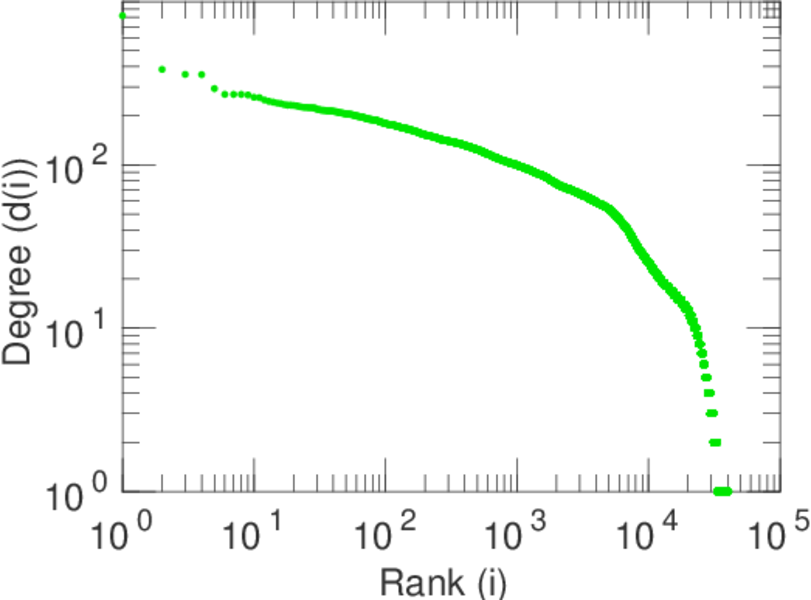
| Maximum right degree | d2max = | 819
|
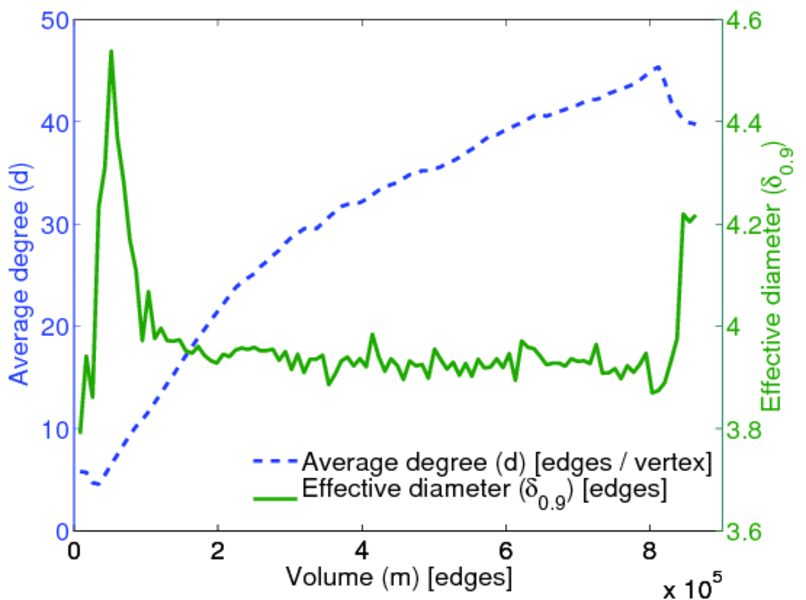
| Average degree | d = | 39.501 9
|
| Average left degree | d1 = | 308.714
|
| Average right degree | d2 = | 21.101 0
|
| Fill | p = | 0.003 705 16
|
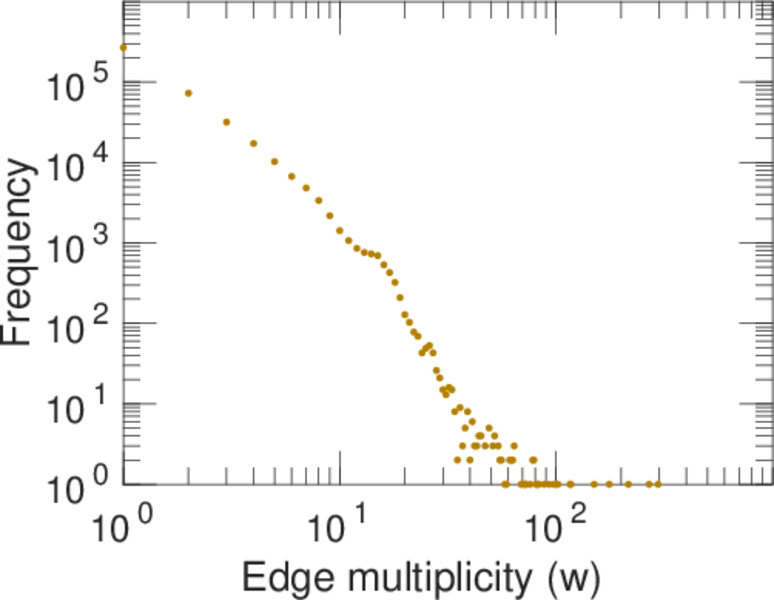
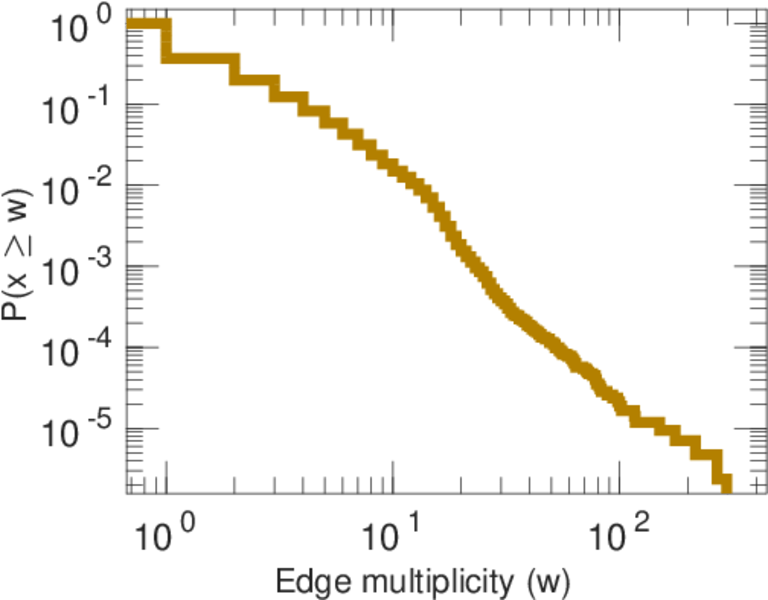
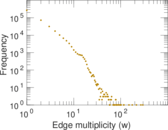
| Average edge multiplicity | m̃ = | 2.036 12
|
| Size of LCC | N = | 42,747
|
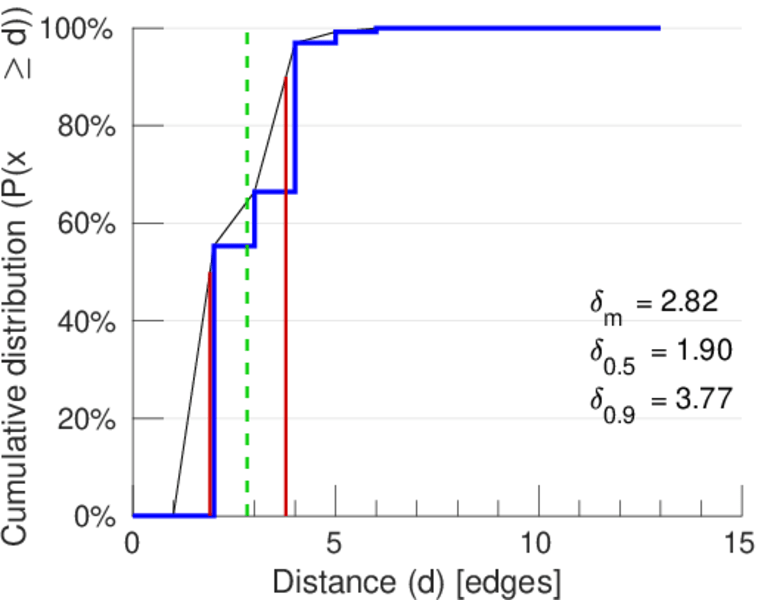
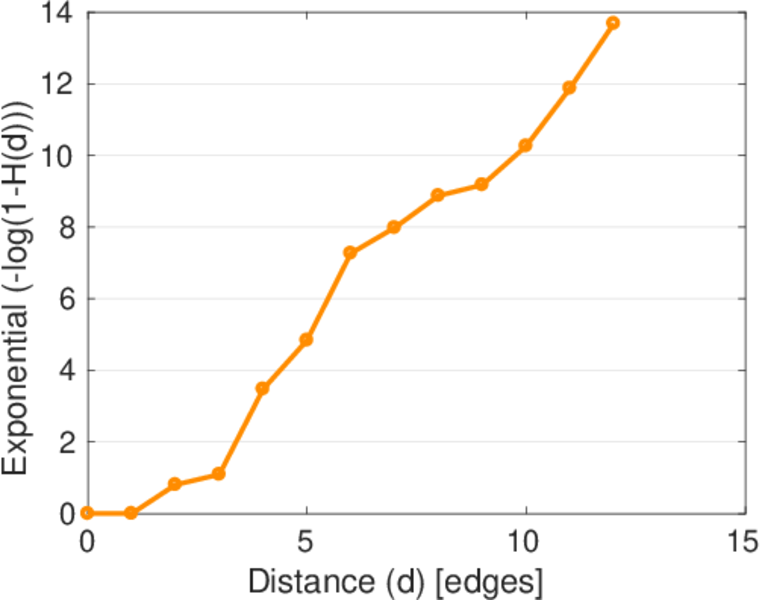
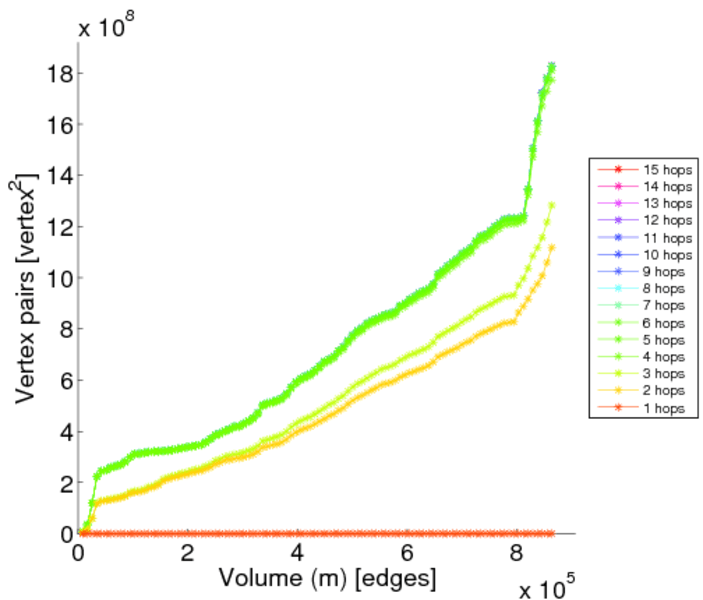
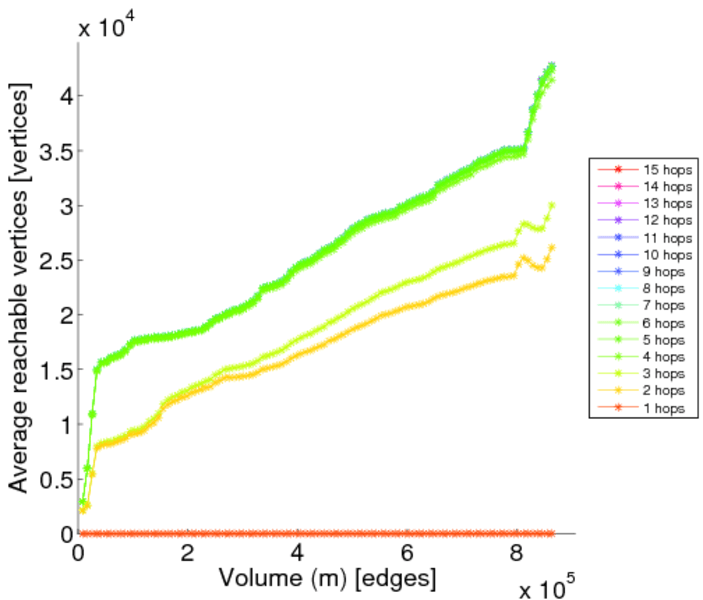
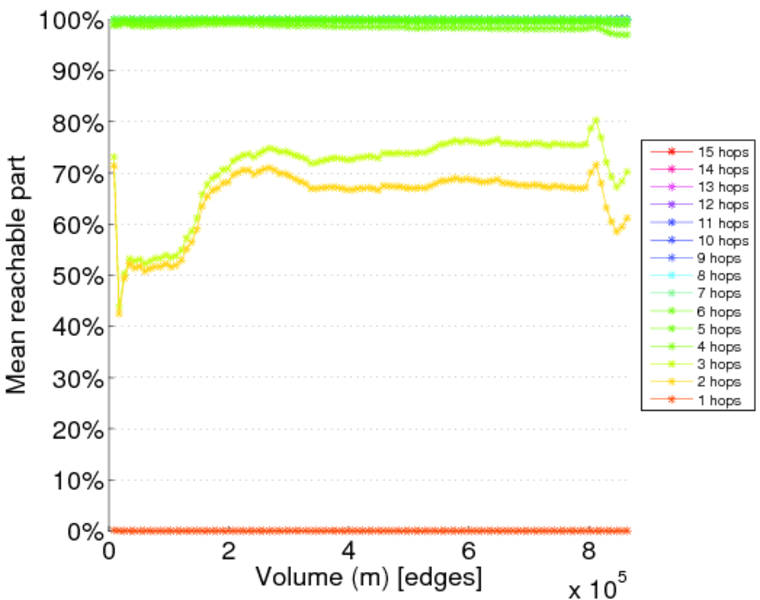
| Diameter | δ = | 15
|
| 50-Percentile effective diameter | δ0.5 = | 1.903 22
|
| 90-Percentile effective diameter | δ0.9 = | 3.773 08
|
| Median distance | δM = | 2
|
| Mean distance | δm = | 2.821 59
|
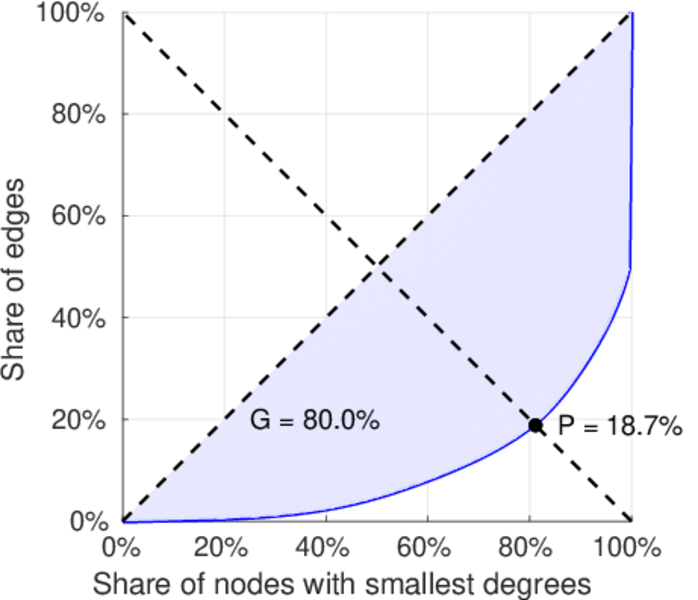
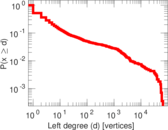
| Balanced inequality ratio | P = | 0.193 059
|
| Left balanced inequality ratio | P1 = | 0.025 194 8
|
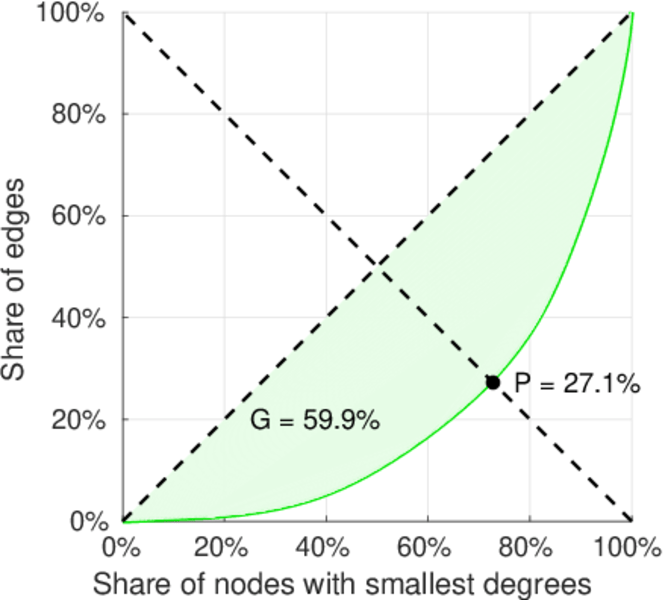
| Right balanced inequality ratio | P2 = | 0.270 761
|
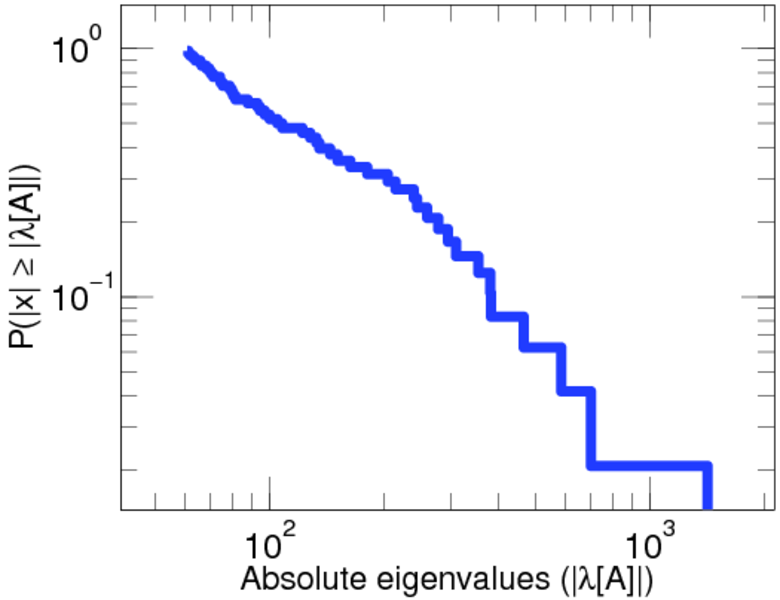
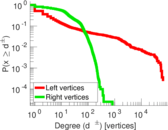
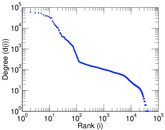
| Tail power law exponent | γt = | 3.631 00
|
| Tail power law exponent with p | γ3 = | 3.631 00
|
| p-value | p = | 0.000 00
|
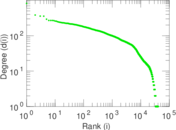
| Left tail power law exponent with p | γ3,1 = | 1.721 00
|
| Left p-value | p1 = | 0.000 00
|
| Right tail power law exponent with p | γ3,2 = | 8.911 00
|
| Right p-value | p2 = | 0.039 000 0
|
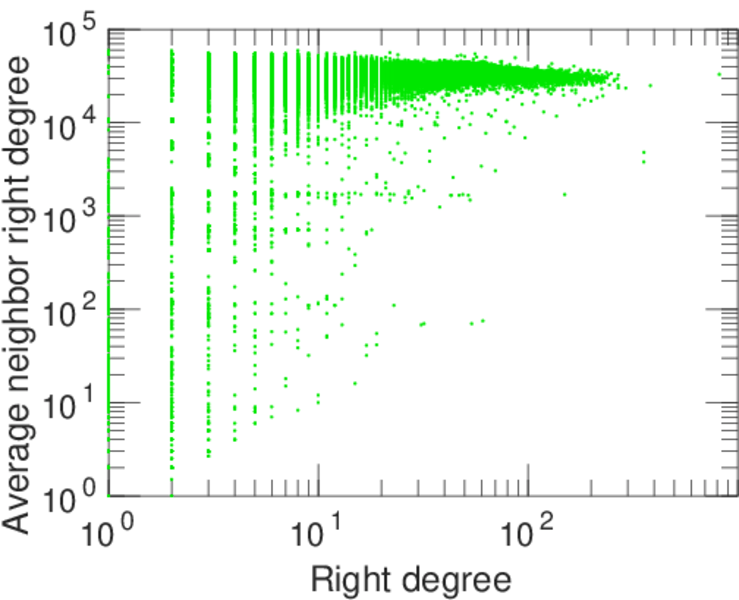
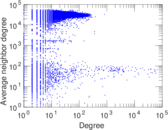
| Degree assortativity | ρ = | −0.283 691
|
| Degree assortativity p-value | pρ = | 0.000 00
|
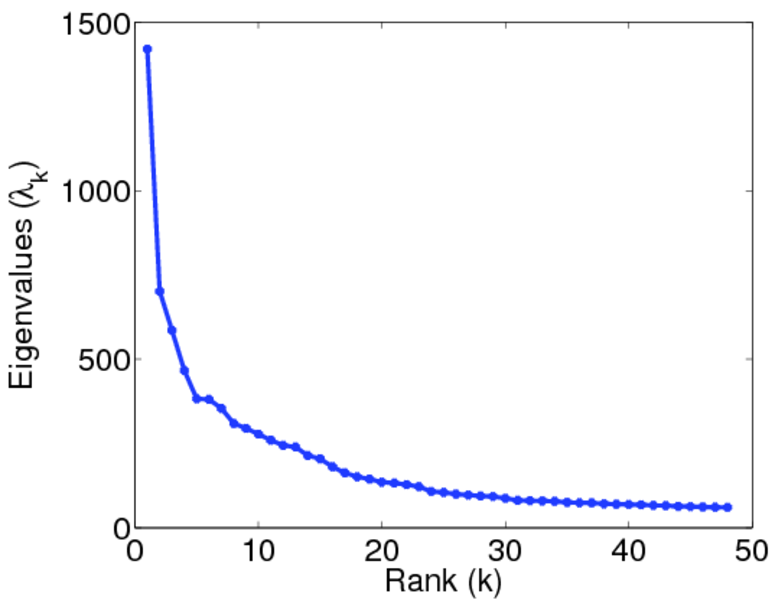
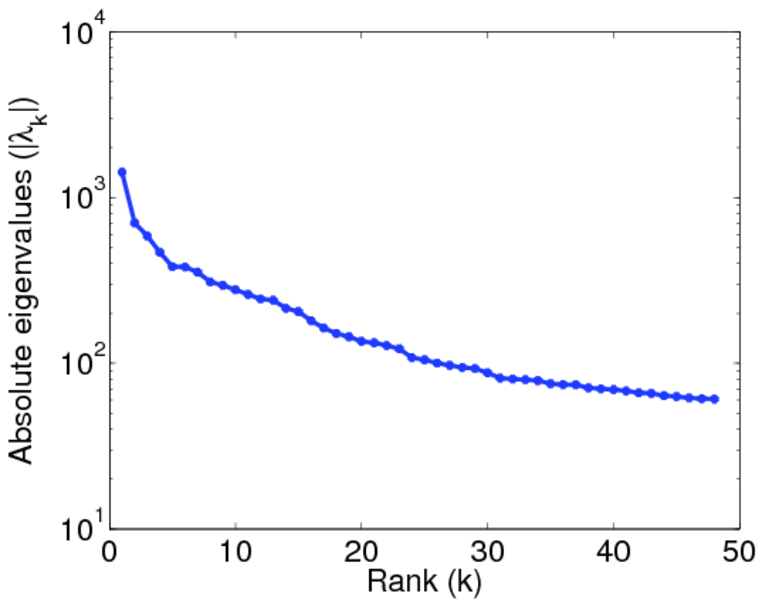
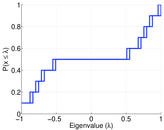
| Spectral norm | α = | 1,420.36
|
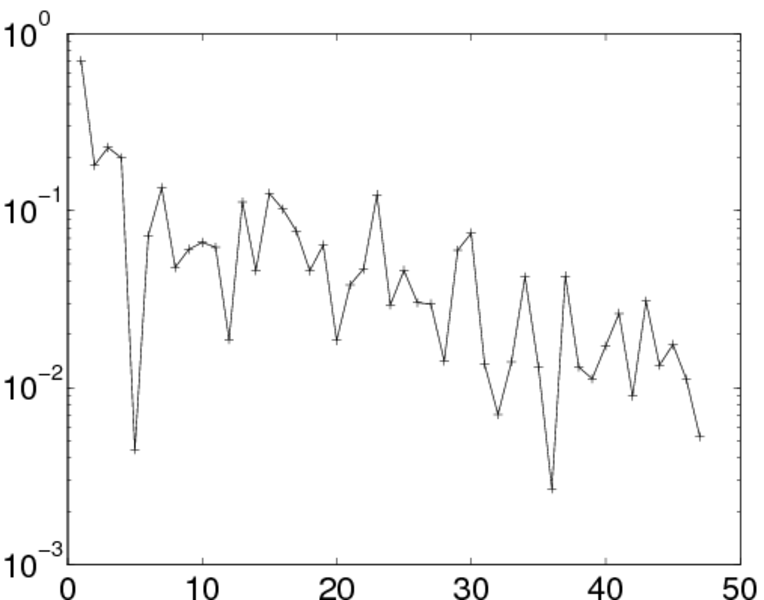
| Algebraic connectivity | a = | 0.030 116 8
|
| Spectral separation | |λ1[A] / λ2[A]| = | 2.023 32
|
| Controllability | C = | 38,163
|
| Relative controllability | Cr = | 0.878 563
|
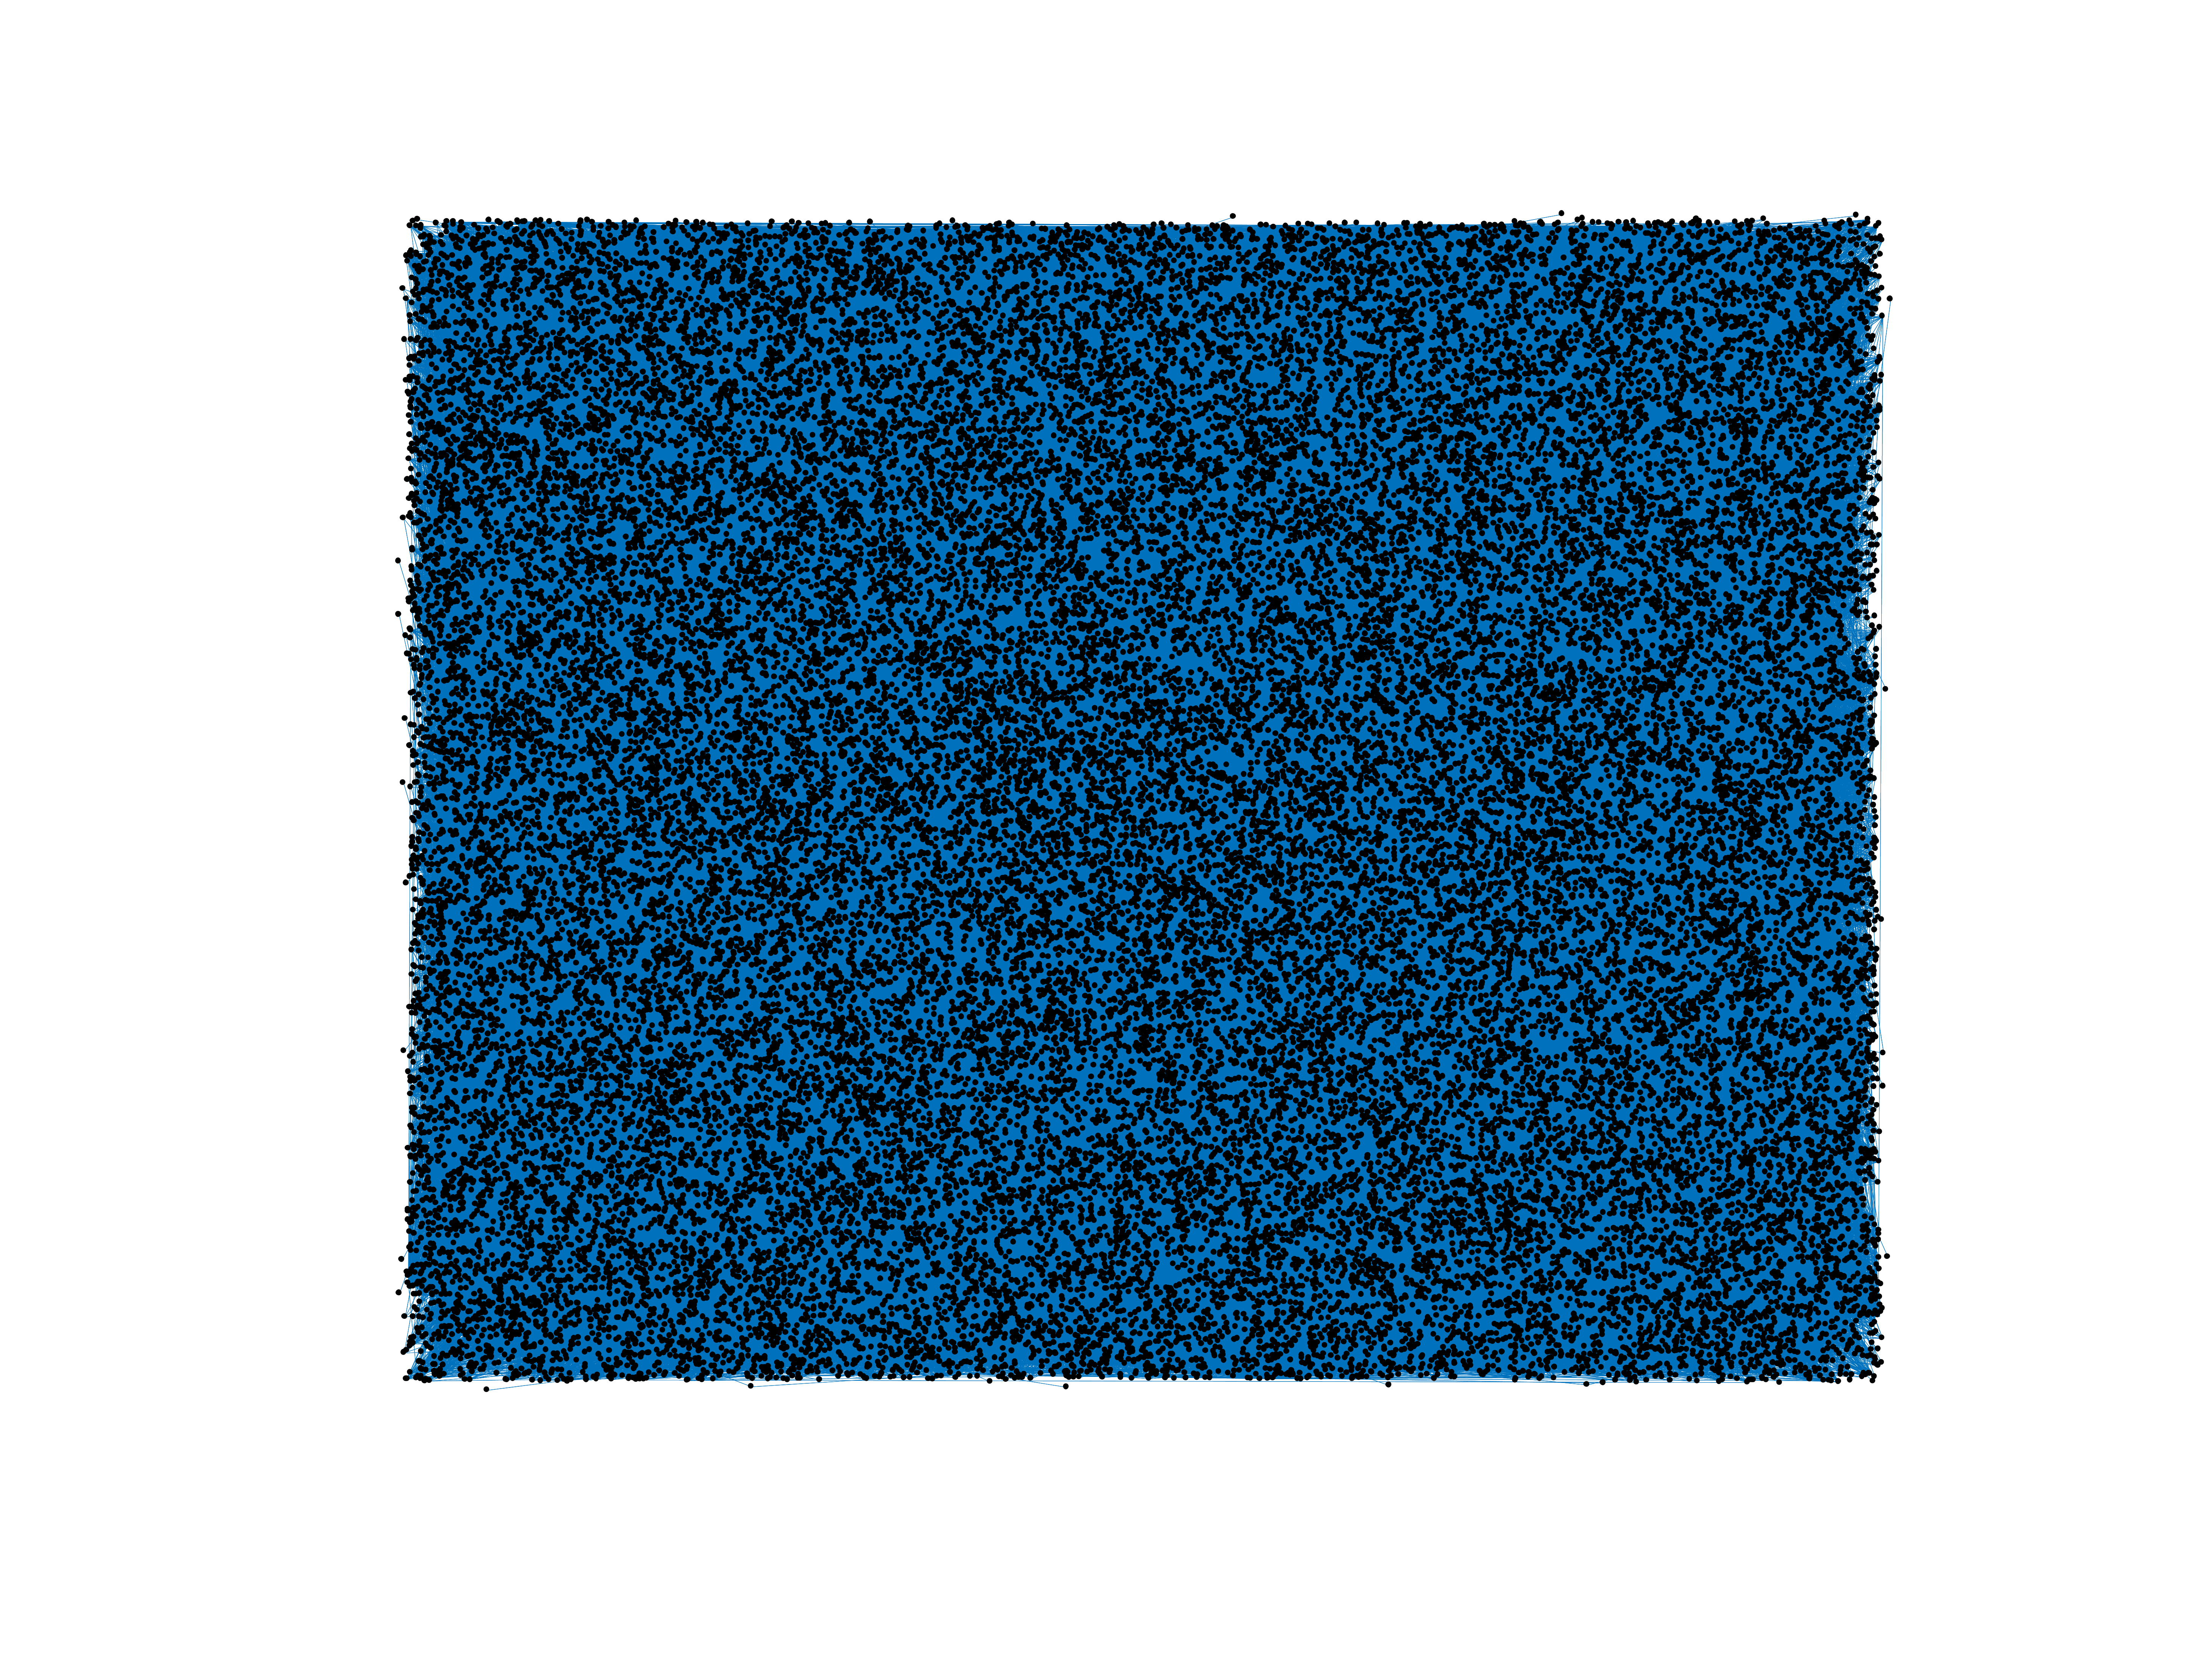
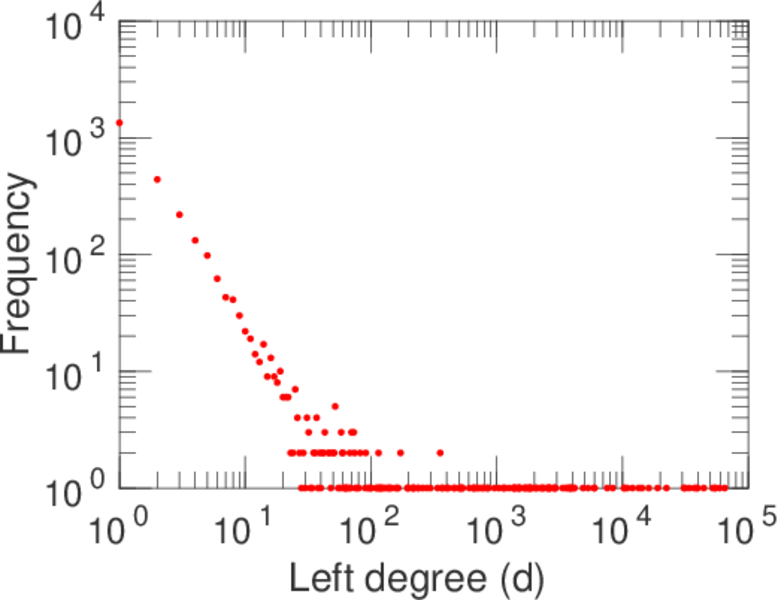
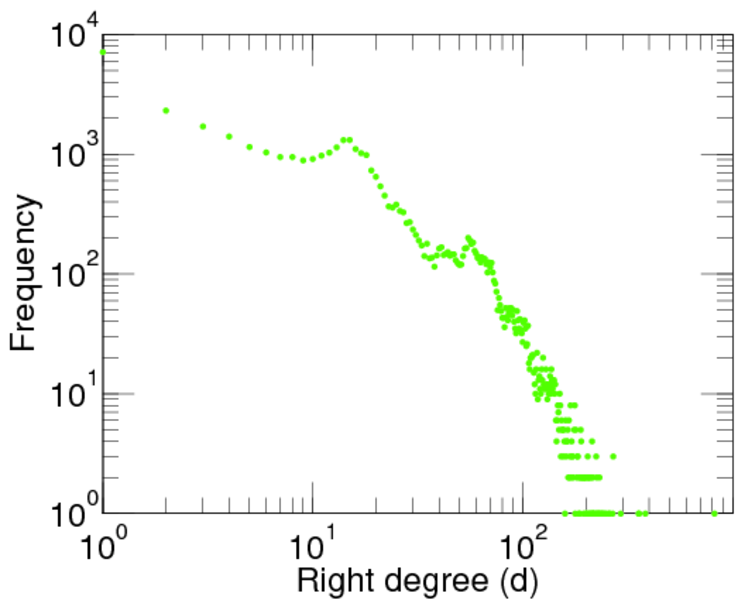
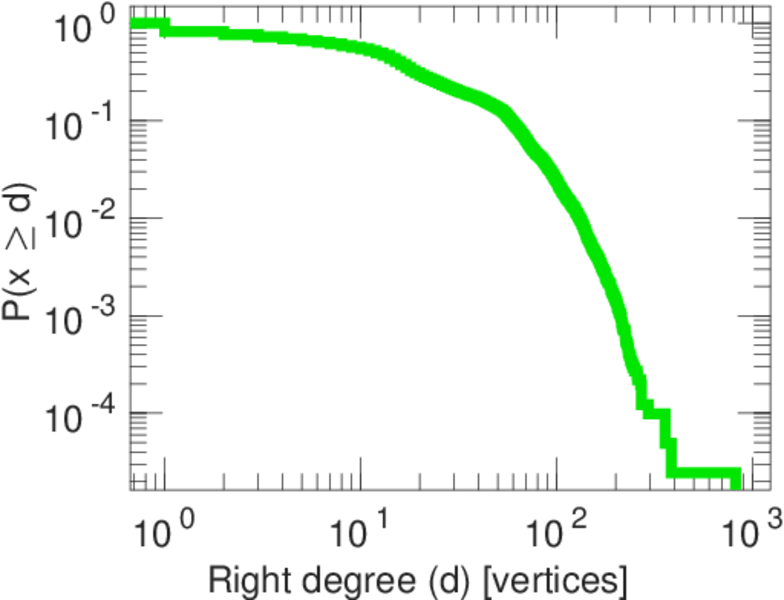
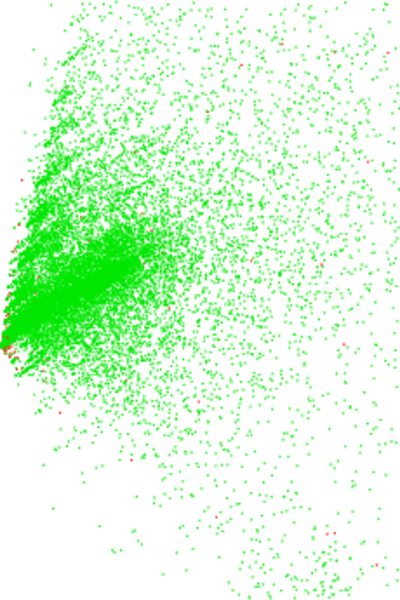
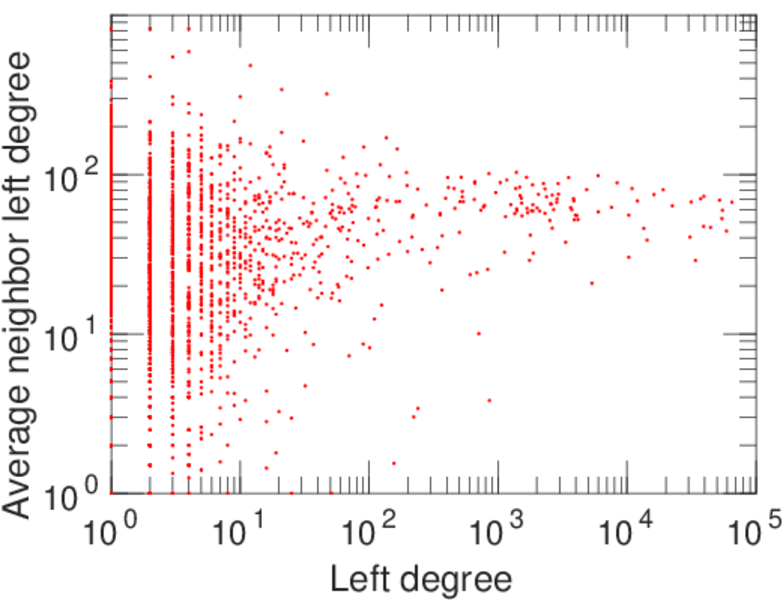
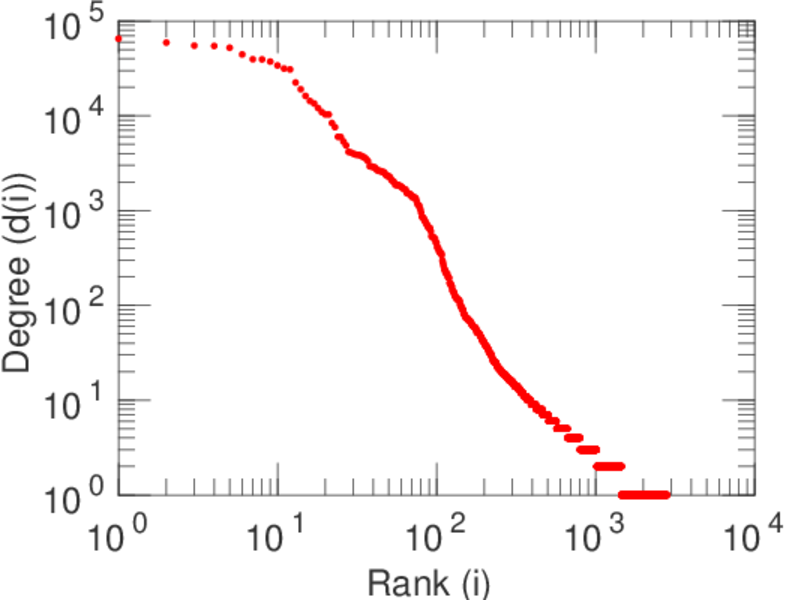
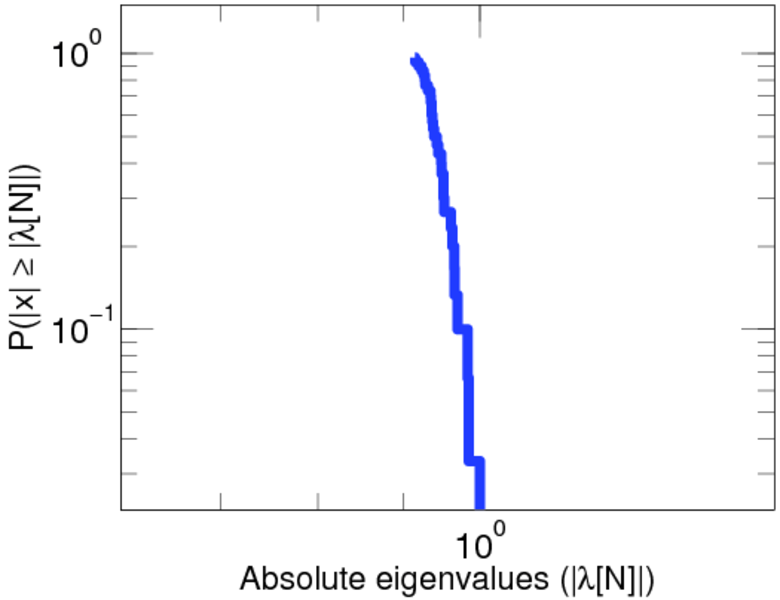
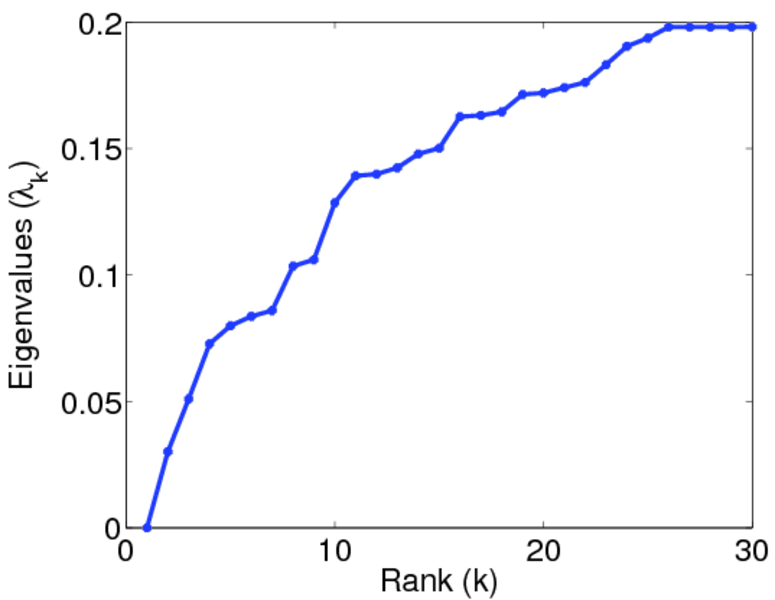
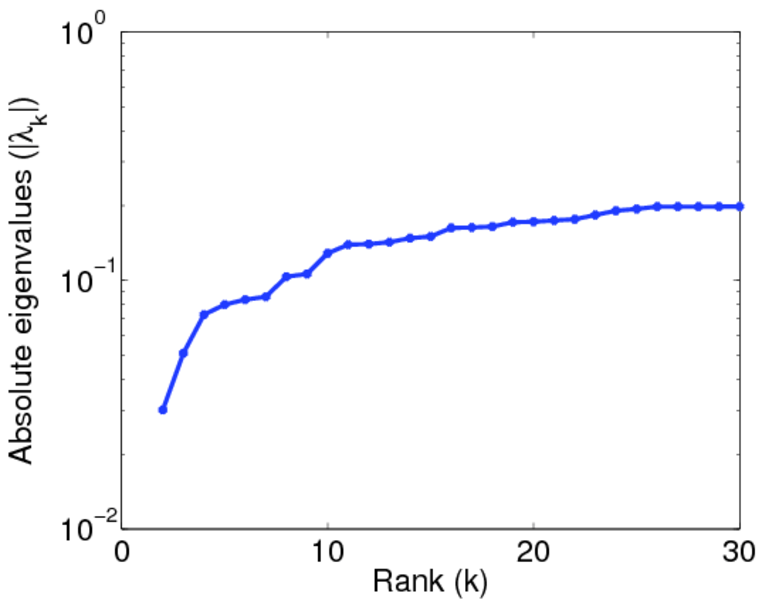
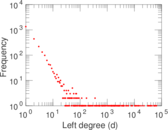
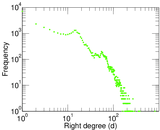
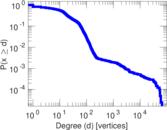
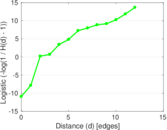
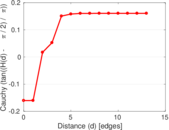
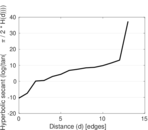
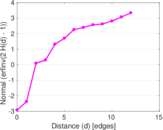
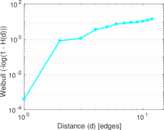
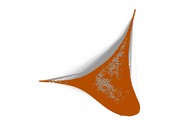
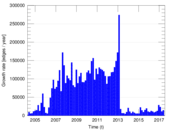
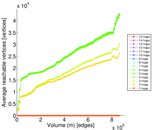
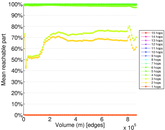
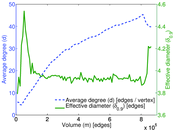
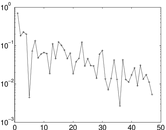
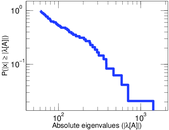
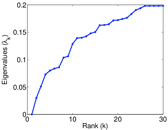
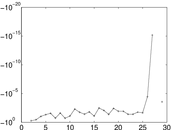
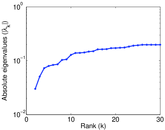
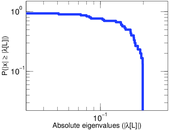
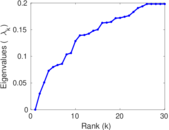
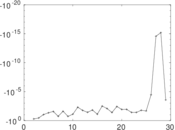
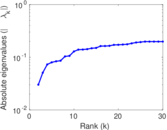
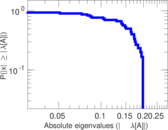
Plots


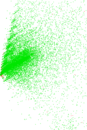


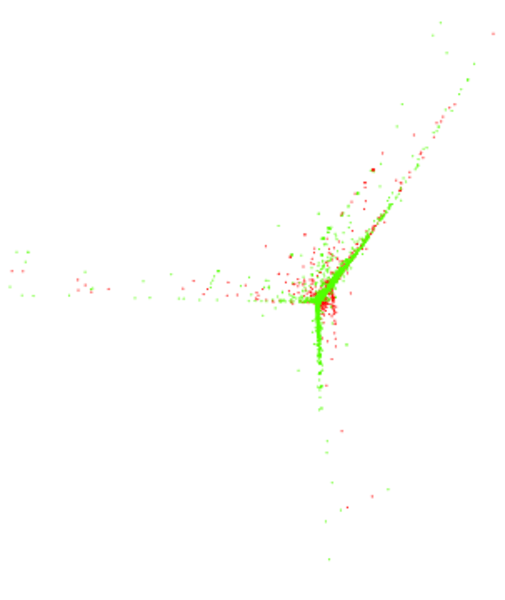
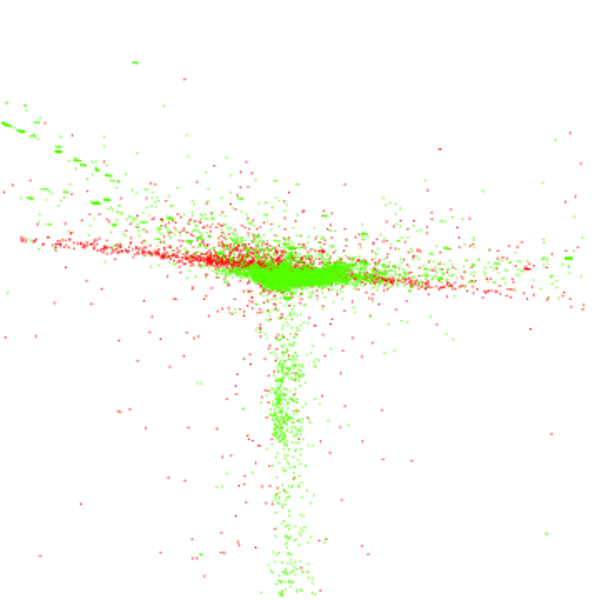
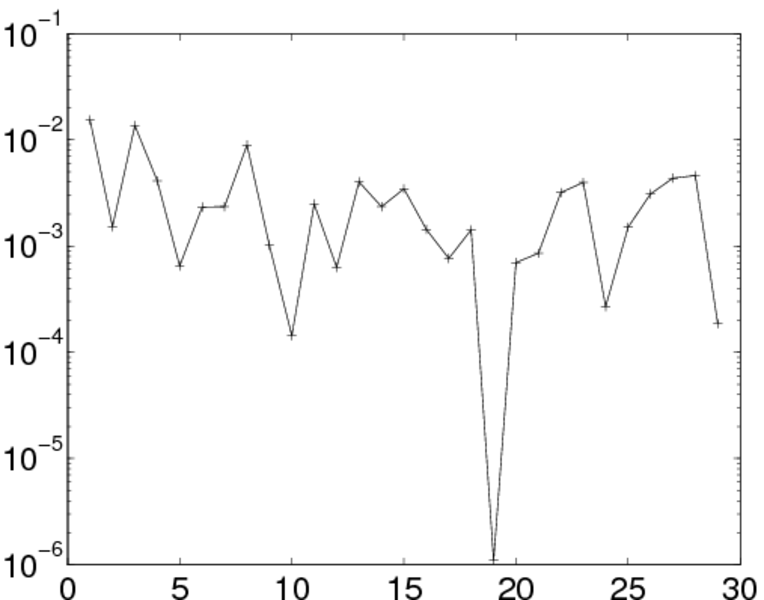
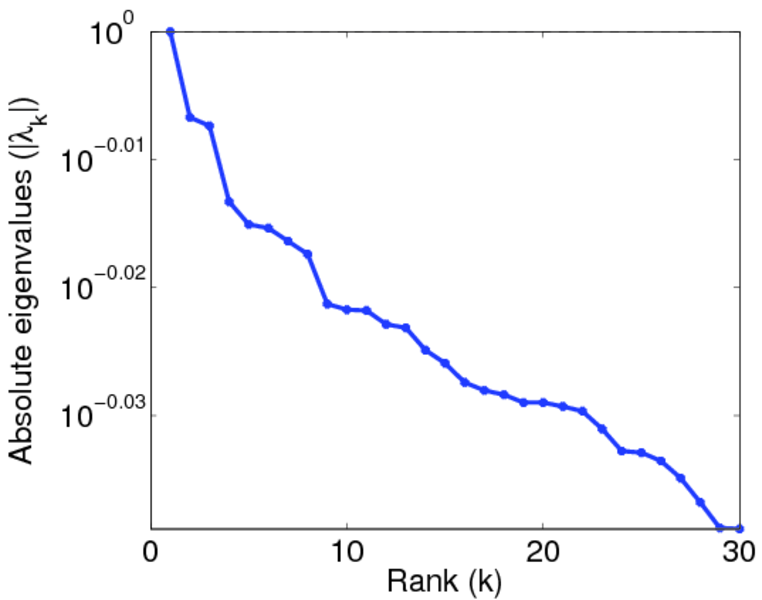
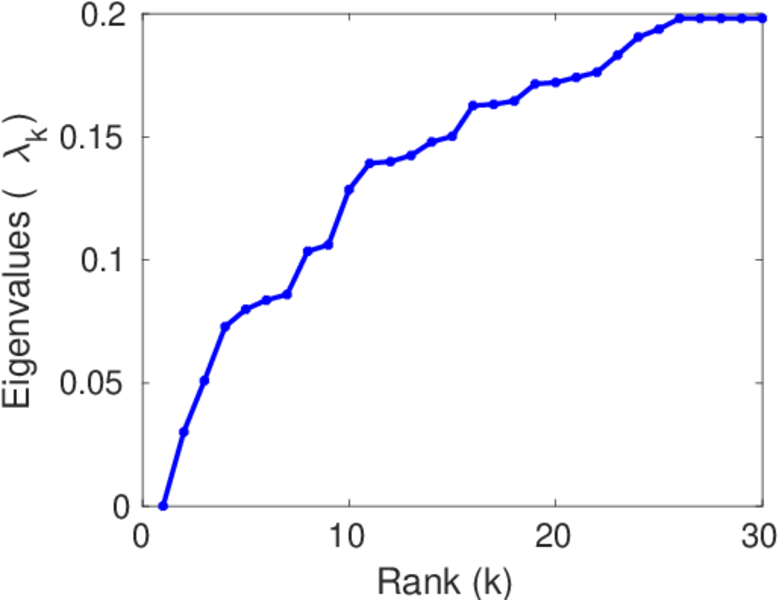
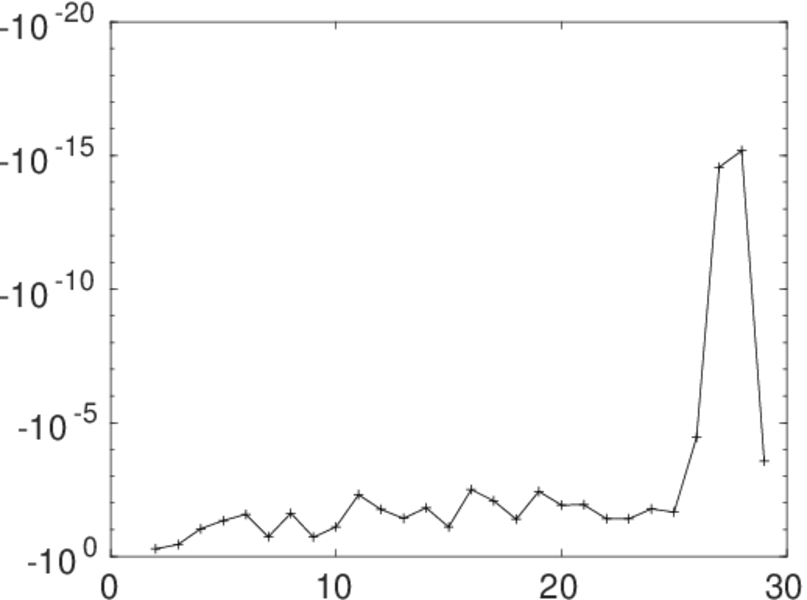
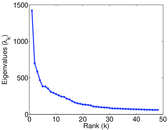
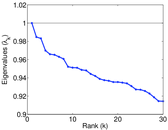
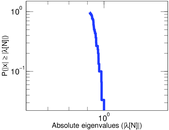
Matrix decompositions plots


Downloads
References
|
[1]
|
Jérôme Kunegis.
KONECT – The Koblenz Network Collection.
In Proc. Int. Conf. on World Wide Web Companion, pages
1343–1350, 2013.
[ http ]
|
|
[2]
|
Wikimedia Foundation.
Wikimedia downloads.
http://dumps.wikimedia.org/, January 2010.
|
 KONECT ‣ Networks ‣
Buy Me a Coffee
KONECT ‣ Networks ‣
Buy Me a Coffee