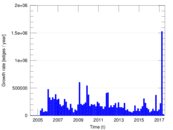
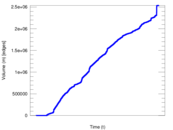
Wiktionary edits (io)
This is the bipartite edit network of the Ido Wiktionary. It contains users and
pages from the Ido Wiktionary, connected by edit events. Each edge represents
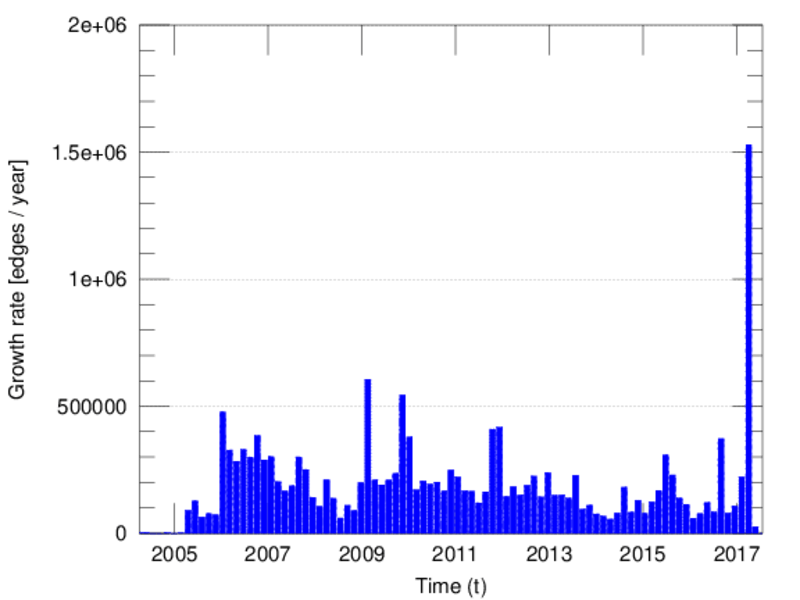
an edit. The dataset includes the timestamp of each edit.
Metadata
Statistics
| Size | n = | 303,742
|
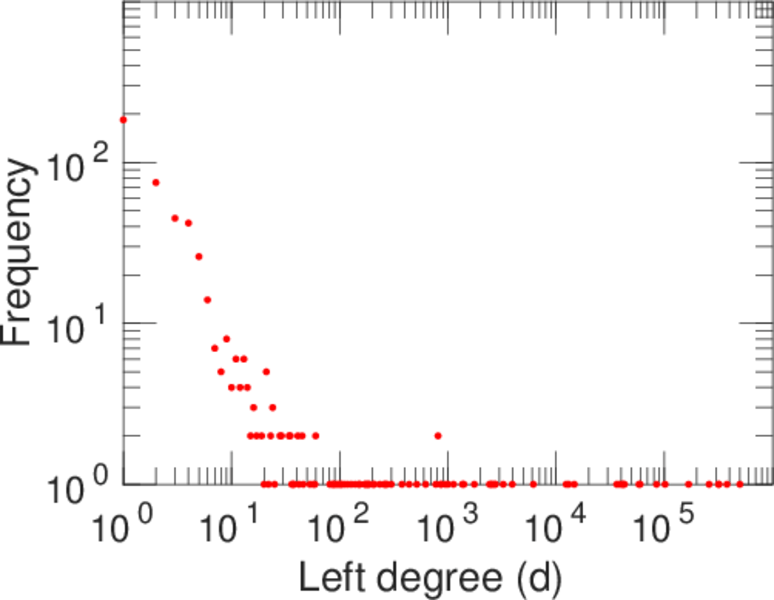
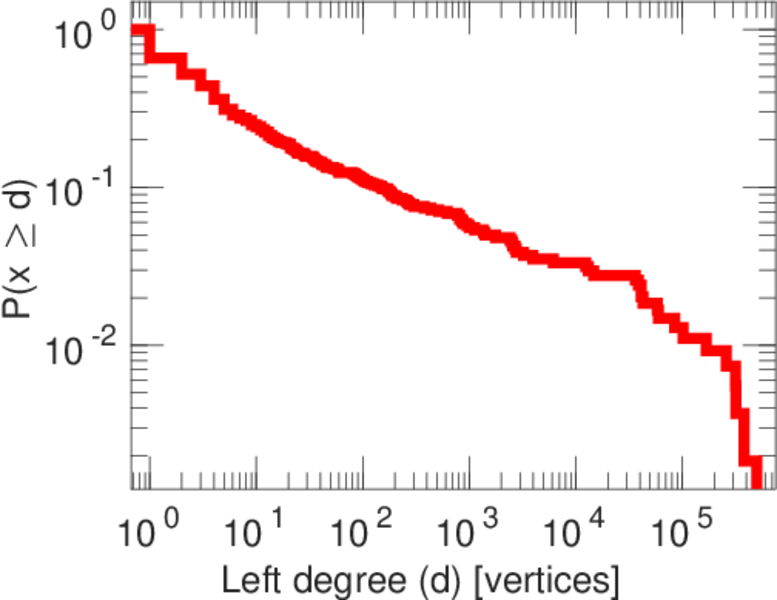
| Left size | n1 = | 541
|
| Right size | n2 = | 303,201
|
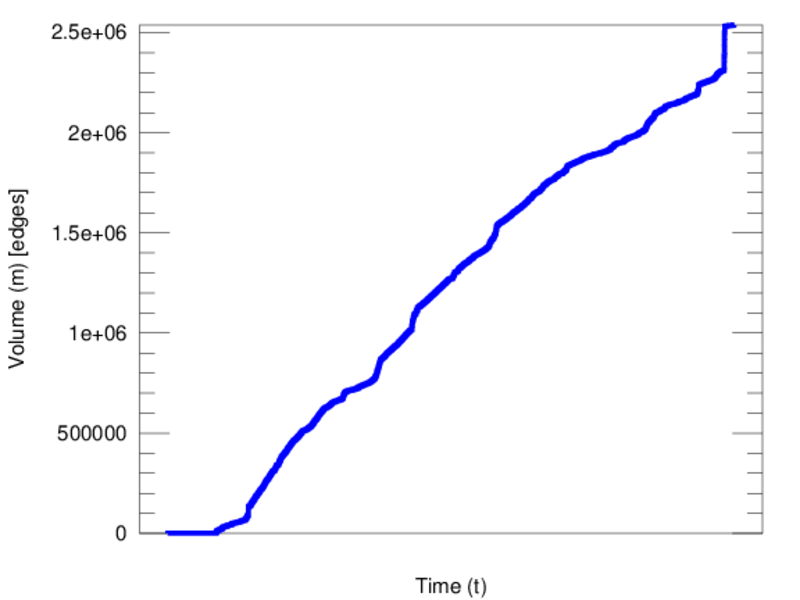
| Volume | m = | 2,537,593
|
| Unique edge count | m̿ = | 1,397,444
|
| Wedge count | s = | 87,380,697,738
|
| Claw count | z = | 4,833,675,190,359,000
|
| Cross count | x = | 2.240 27 × 1020
|
| Square count | q = | 105,356,001,528
|
| 4-Tour count | T4 = | 1,192,374,375,348
|
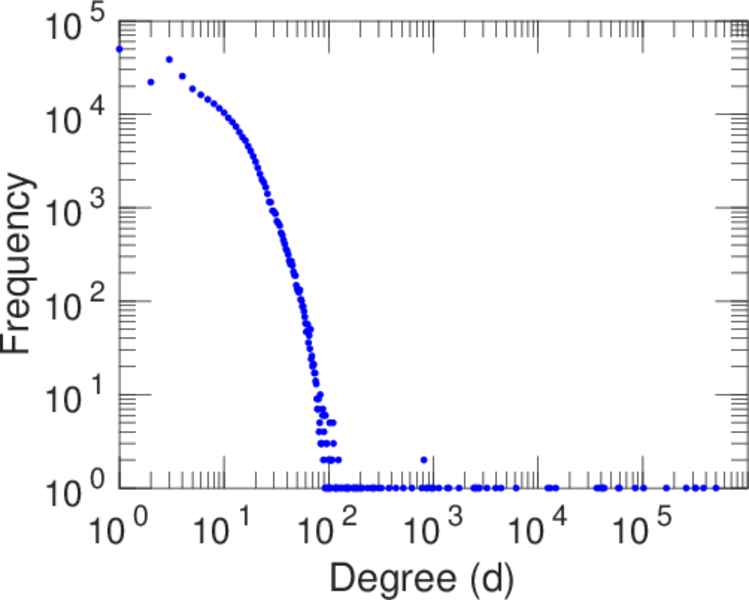
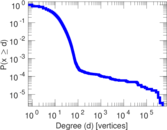
| Maximum degree | dmax = | 500,295
|
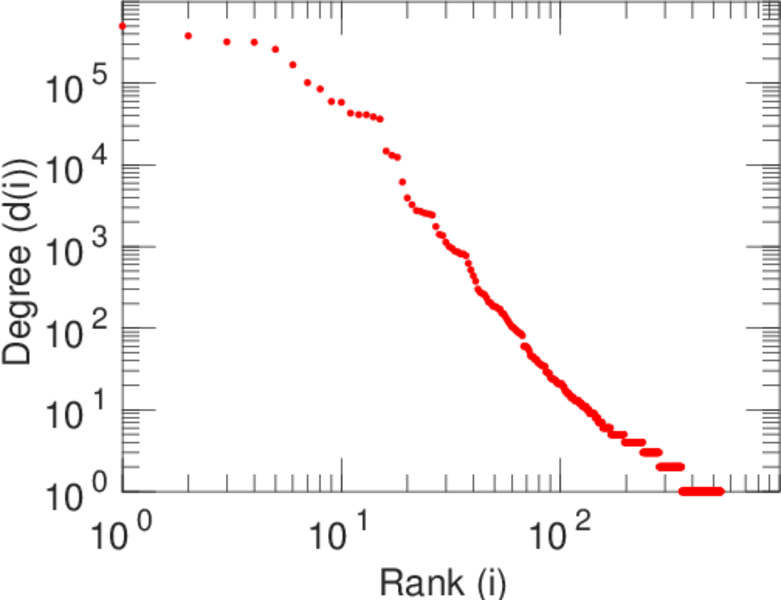
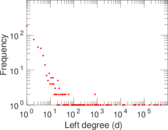
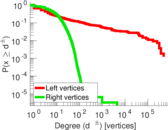
| Maximum left degree | d1max = | 500,295
|
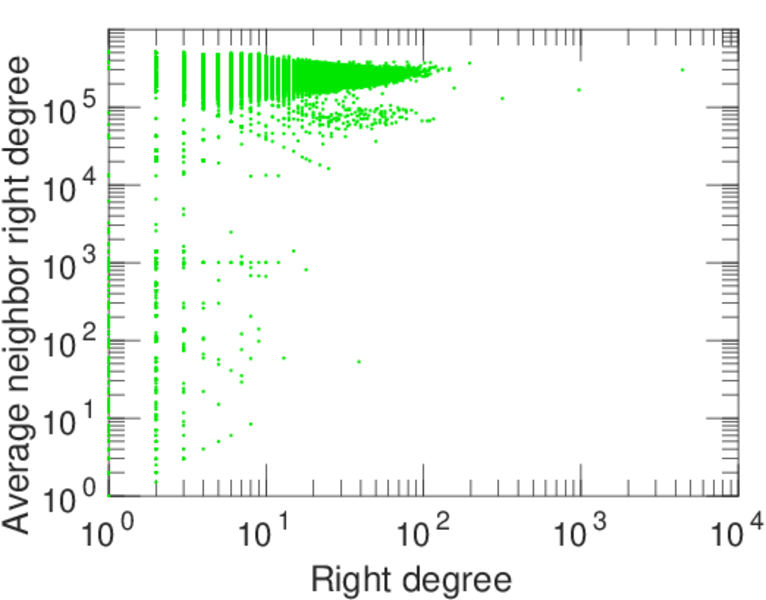
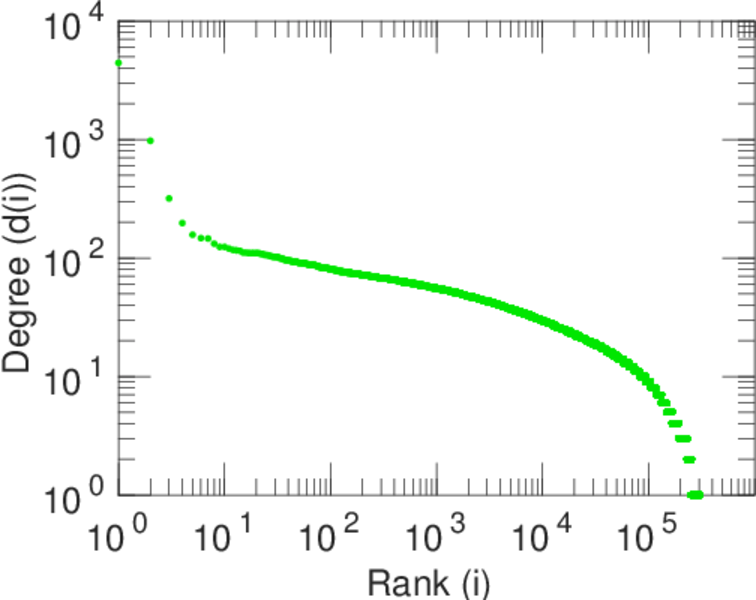
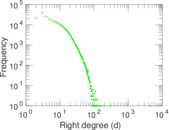
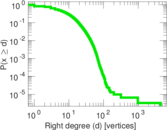
| Maximum right degree | d2max = | 4,431
|
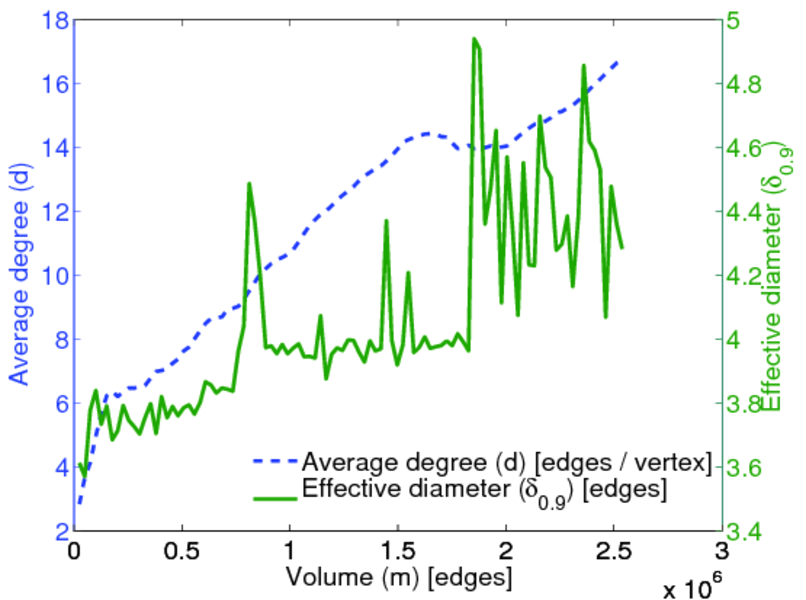
| Average degree | d = | 16.708 9
|
| Average left degree | d1 = | 4,690.56
|
| Average right degree | d2 = | 8.369 34
|
| Fill | p = | 0.008 519 35
|
| Average edge multiplicity | m̃ = | 1.815 88
|
| Size of LCC | N = | 303,374
|
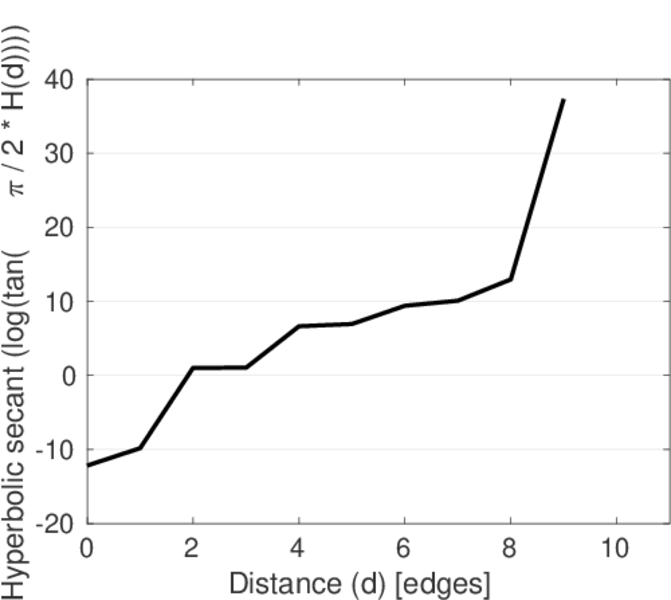
| Diameter | δ = | 11
|
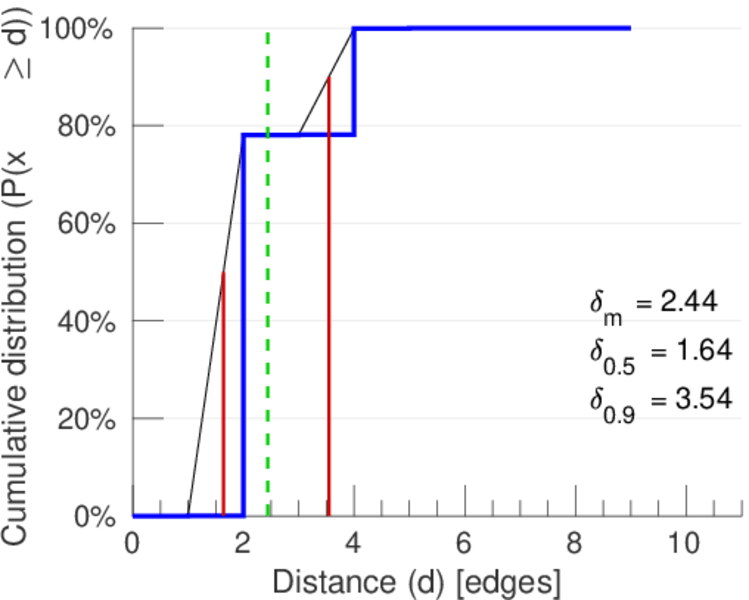
| 50-Percentile effective diameter | δ0.5 = | 1.640 63
|
| 90-Percentile effective diameter | δ0.9 = | 3.543 97
|
| Median distance | δM = | 2
|
| Mean distance | δm = | 2.439 32
|
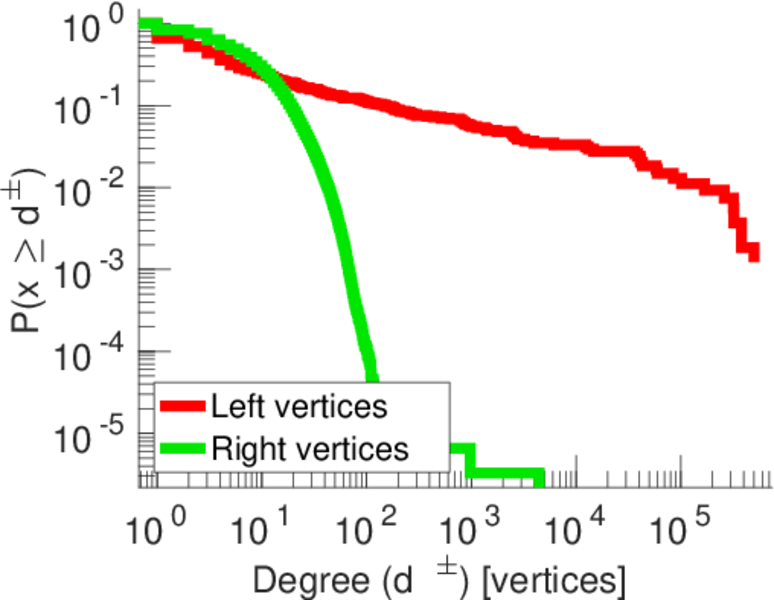
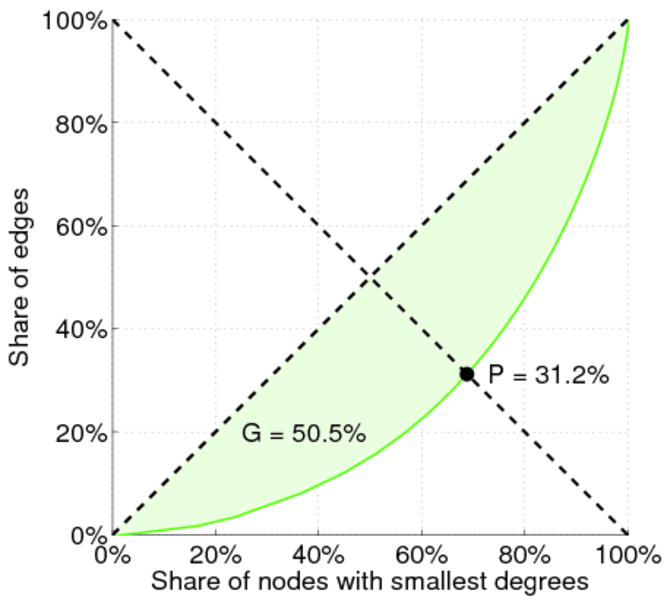
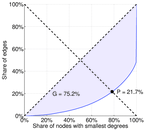
| Gini coefficient | G = | 0.752 200
|
| Balanced inequality ratio | P = | 0.217 139
|
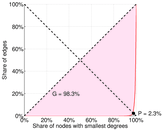
| Left balanced inequality ratio | P1 = | 0.023 322 9
|
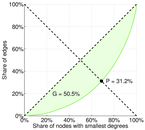
| Right balanced inequality ratio | P2 = | 0.311 910
|
| Relative edge distribution entropy | Her = | 0.652 890
|
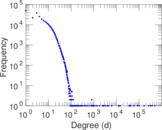
| Power law exponent | γ = | 1.805 01
|
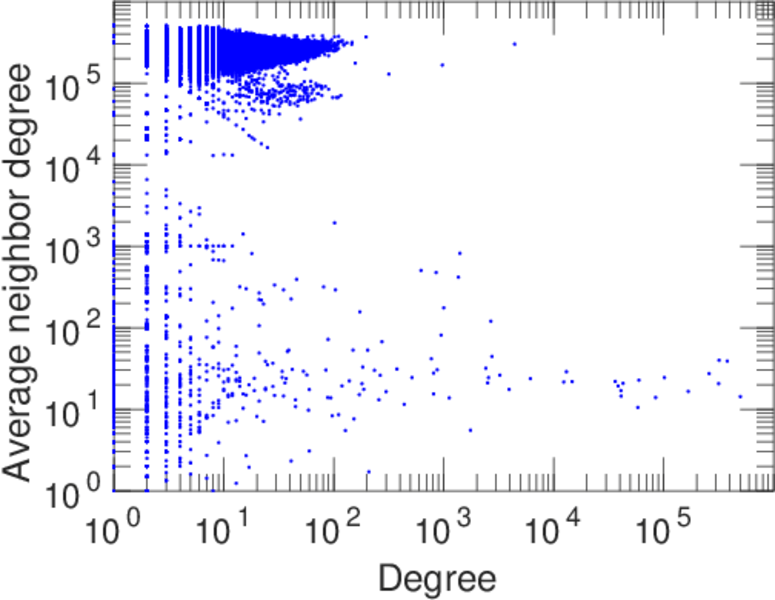
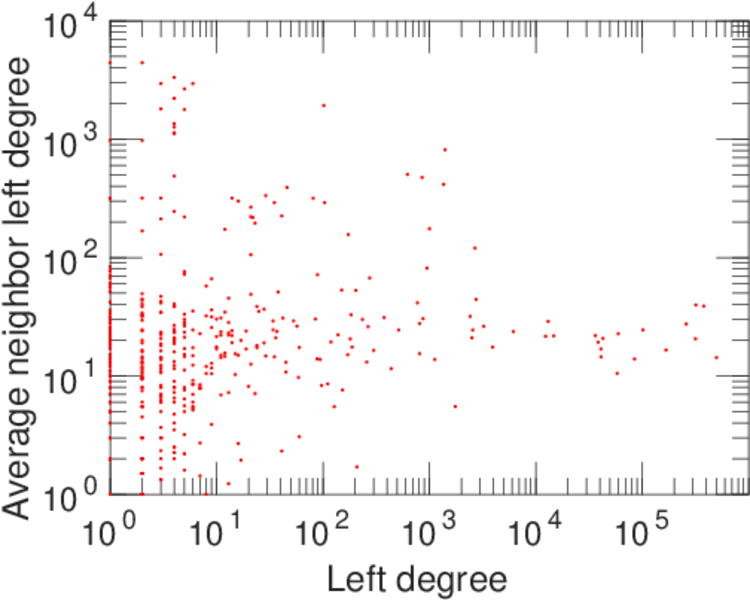
| Degree assortativity | ρ = | −0.357 655
|
| Degree assortativity p-value | pρ = | 0.000 00
|
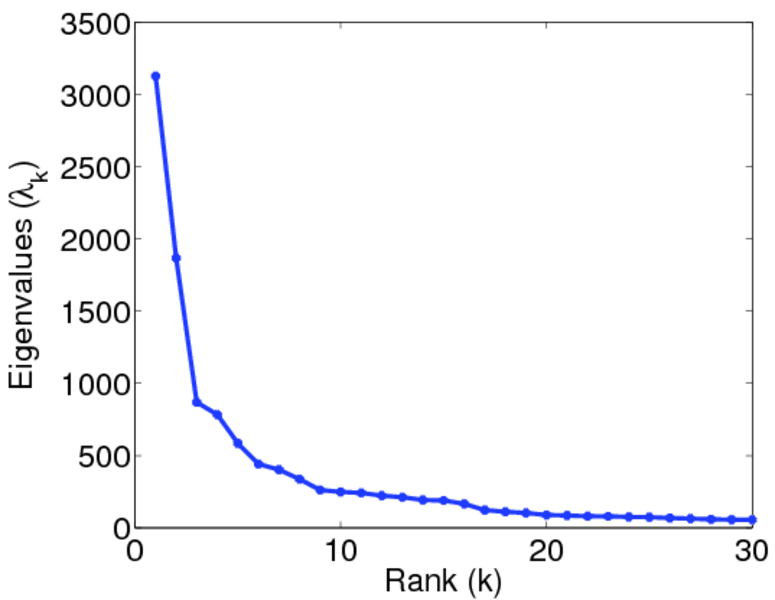
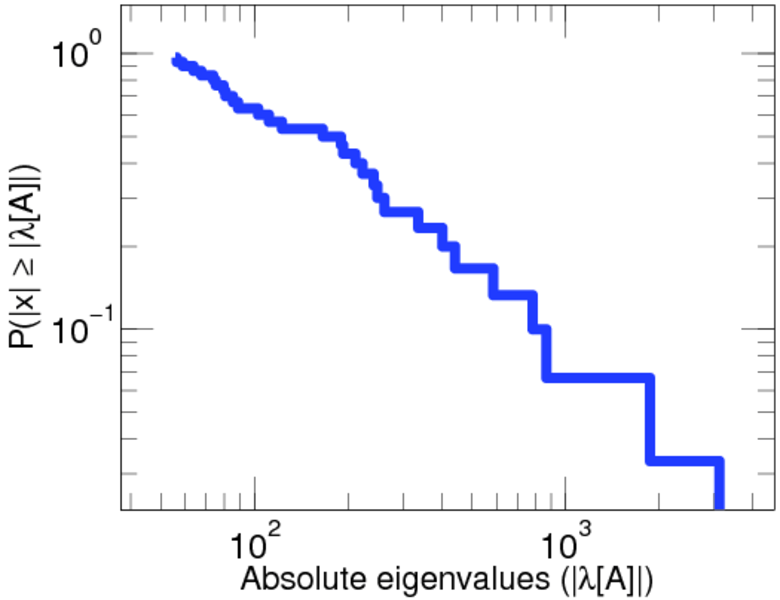
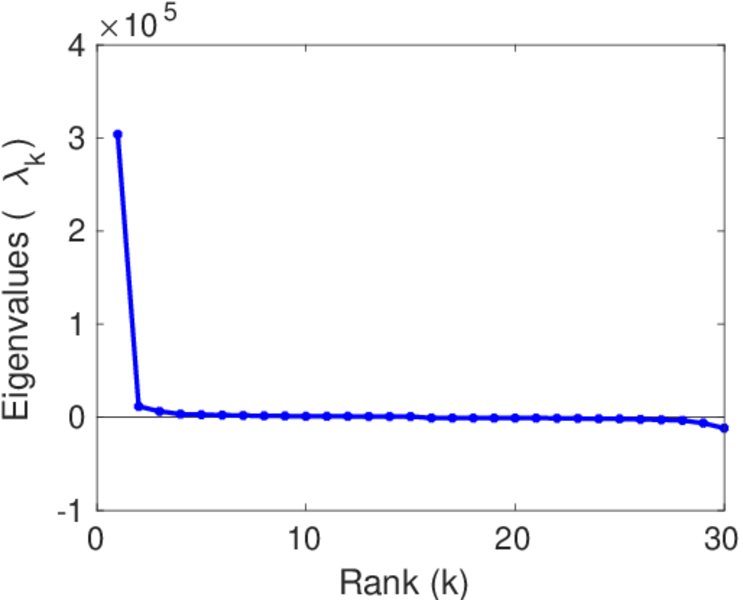
| Spectral norm | α = | 3,126.80
|
| Algebraic connectivity | a = | 0.041 047 6
|
| Spectral separation | |λ1[A] / λ2[A]| = | 1.674 18
|
| Controllability | C = | 302,533
|
| Relative controllability | Cr = | 0.996 508
|
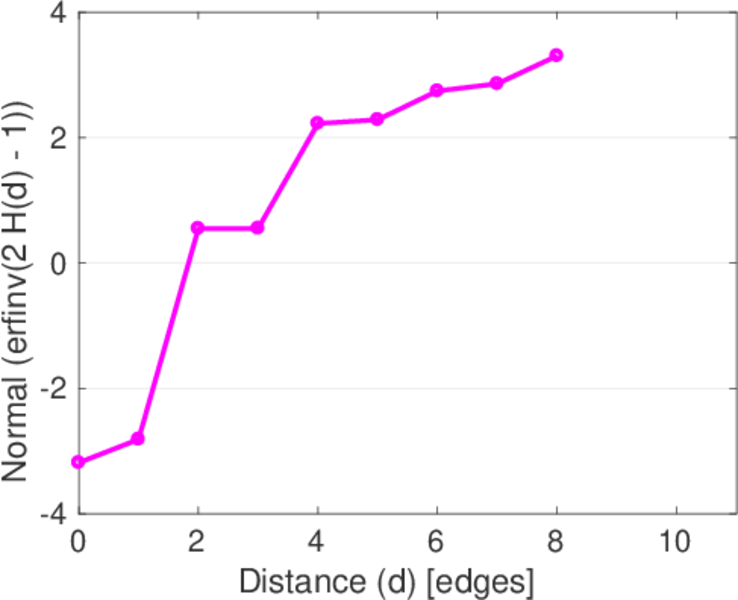
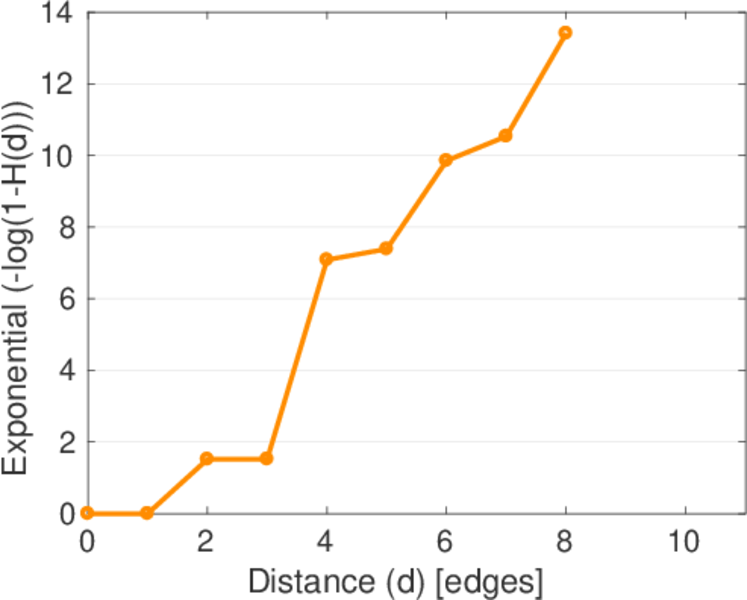
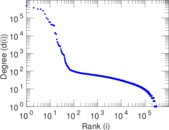
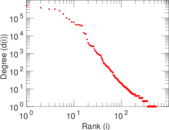
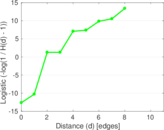
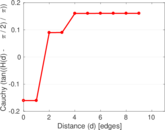
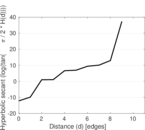
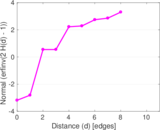
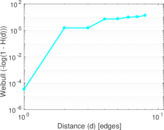
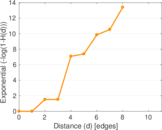
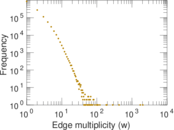
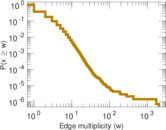
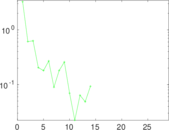
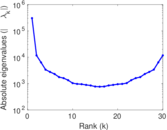
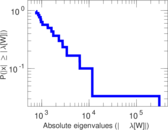
Plots


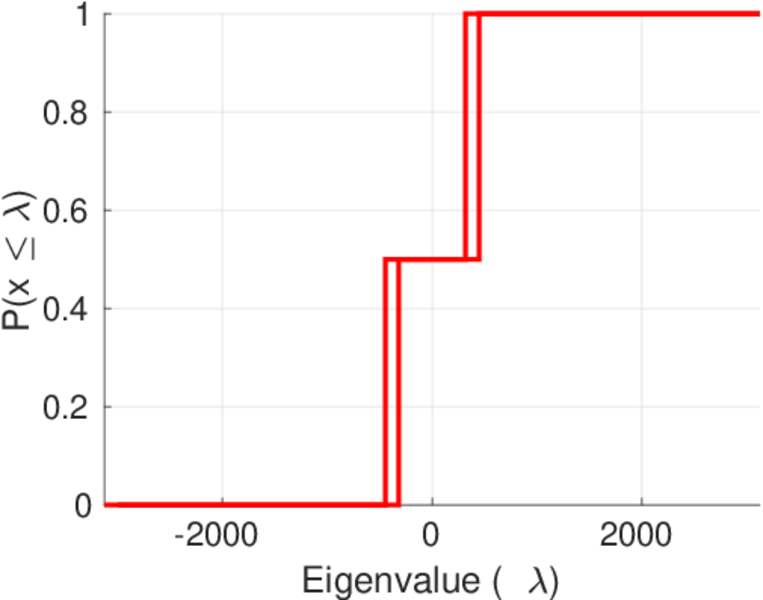
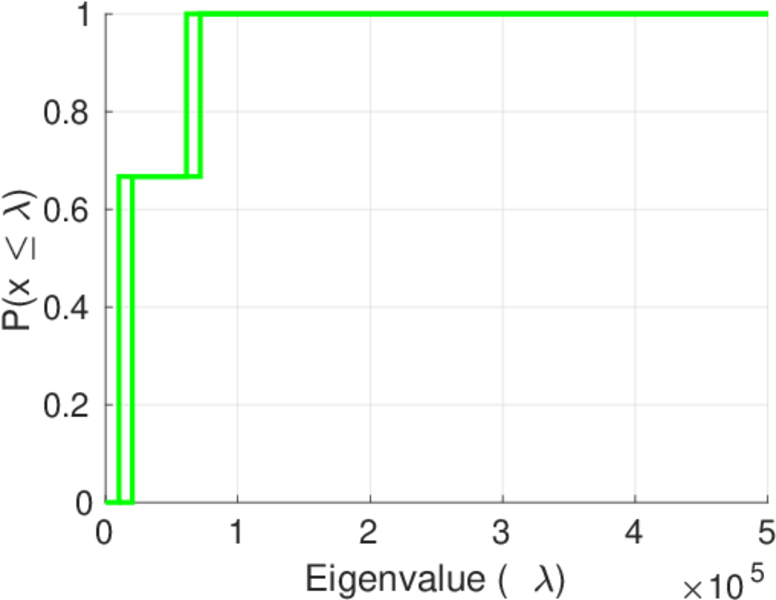
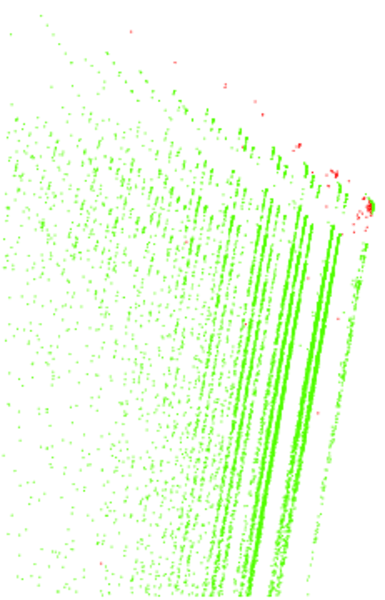
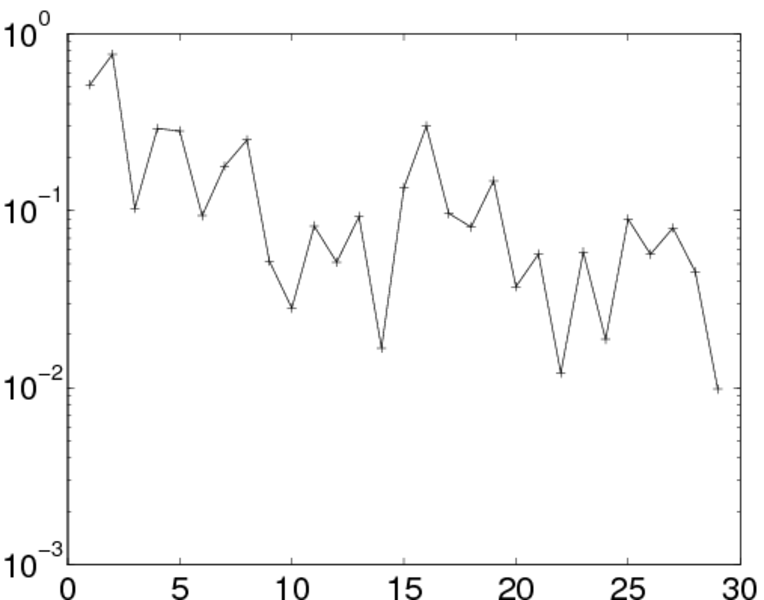
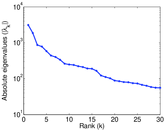
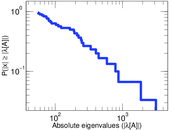
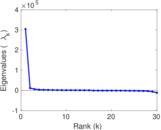
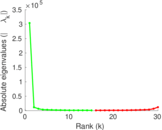
Matrix decompositions plots

Downloads
References
|
[1]
|
Jérôme Kunegis.
KONECT – The Koblenz Network Collection.
In Proc. Int. Conf. on World Wide Web Companion, pages
1343–1350, 2013.
[ http ]
|
|
[2]
|
Wikimedia Foundation.
Wikimedia downloads.
http://dumps.wikimedia.org/, January 2010.
|
 KONECT ‣ Networks ‣
Buy Me a Coffee
KONECT ‣ Networks ‣
Buy Me a Coffee