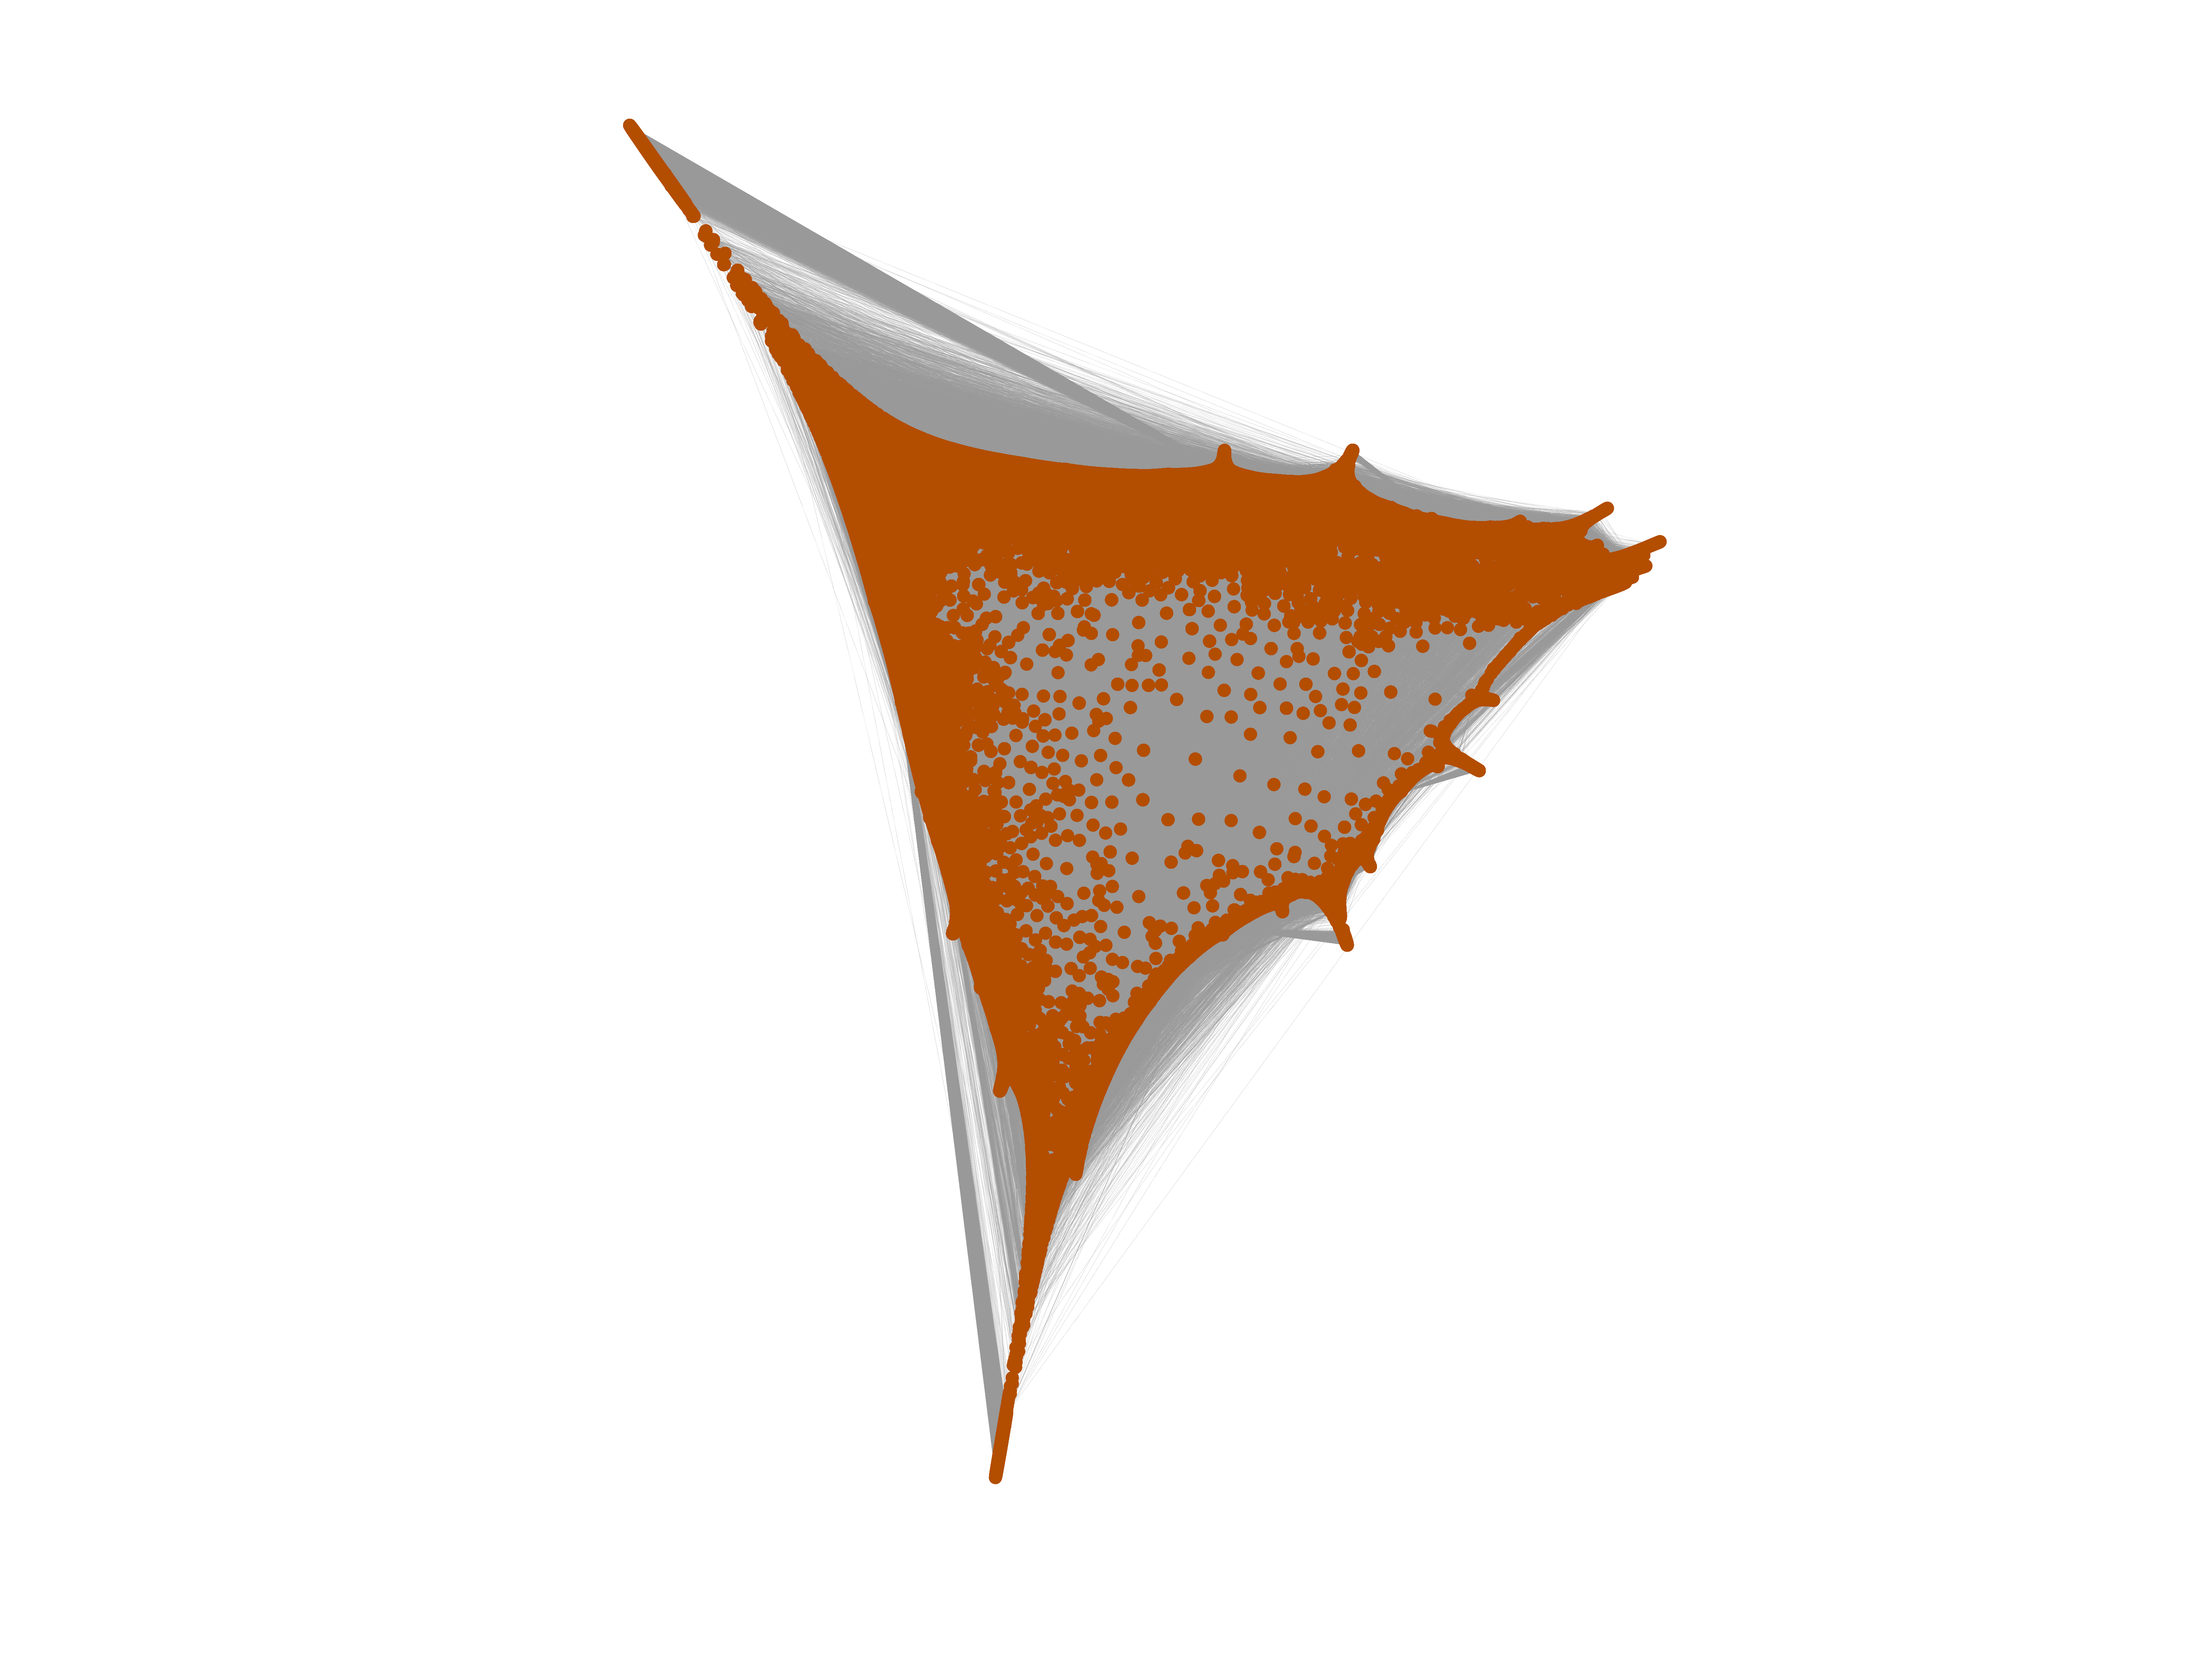
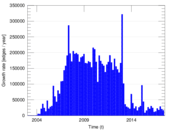
Wikipedia edits (is)
This is the bipartite edit network of the Icelandic Wikipedia. It contains
users and pages from the Icelandic Wikipedia, connected by edit events. Each
edge represents an edit. The dataset includes the timestamp of each edit.
Metadata
Statistics
| Size | n = | 124,118
|
| Left size | n1 = | 8,750
|
| Right size | n2 = | 115,368
|
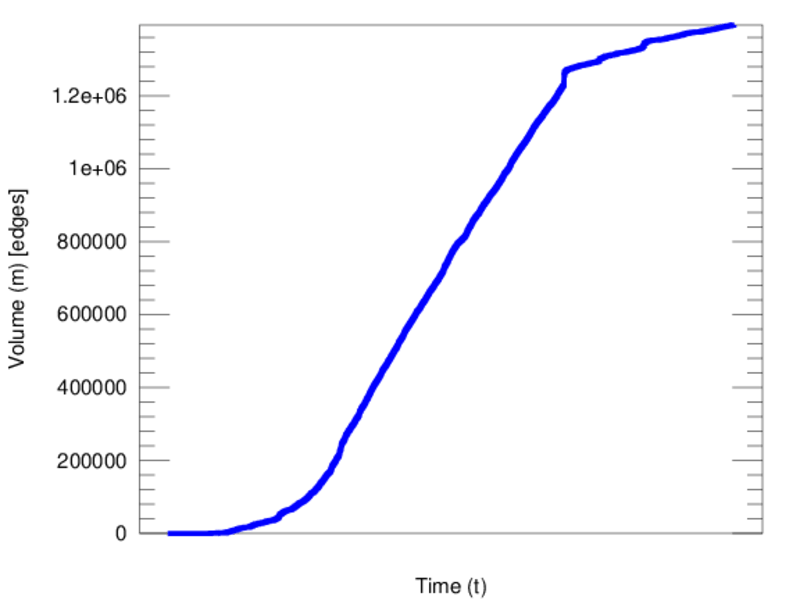
| Volume | m = | 1,393,848
|
| Unique edge count | m̿ = | 681,610
|
| Wedge count | s = | 3,627,520,403
|
| Claw count | z = | 22,733,363,931,266
|
| Cross count | x = | 135,948,780,232,182,384
|
| Square count | q = | 9,180,434,448
|
| 4-Tour count | T4 = | 87,955,044,948
|
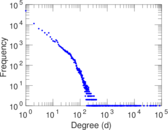
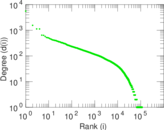
| Maximum degree | dmax = | 84,719
|
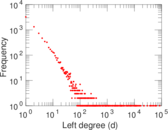
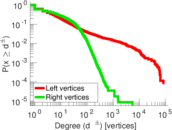
| Maximum left degree | d1max = | 84,719
|
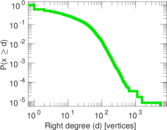
| Maximum right degree | d2max = | 5,535
|
| Average degree | d = | 22.460 0
|
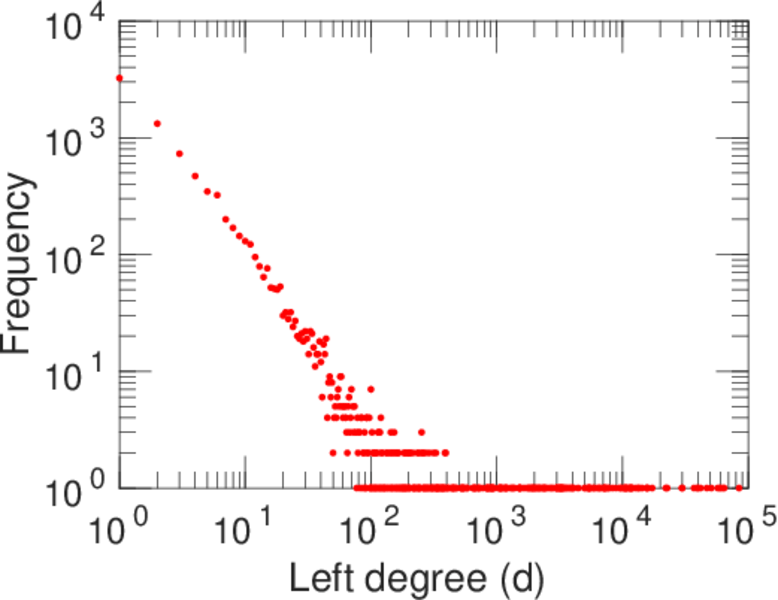
| Average left degree | d1 = | 159.297
|
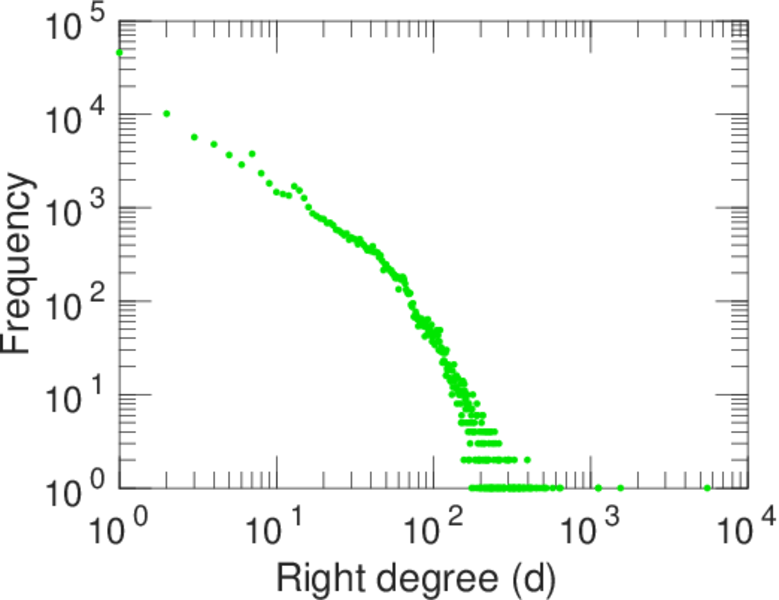
| Average right degree | d2 = | 12.081 8
|
| Fill | p = | 0.000 675 216
|
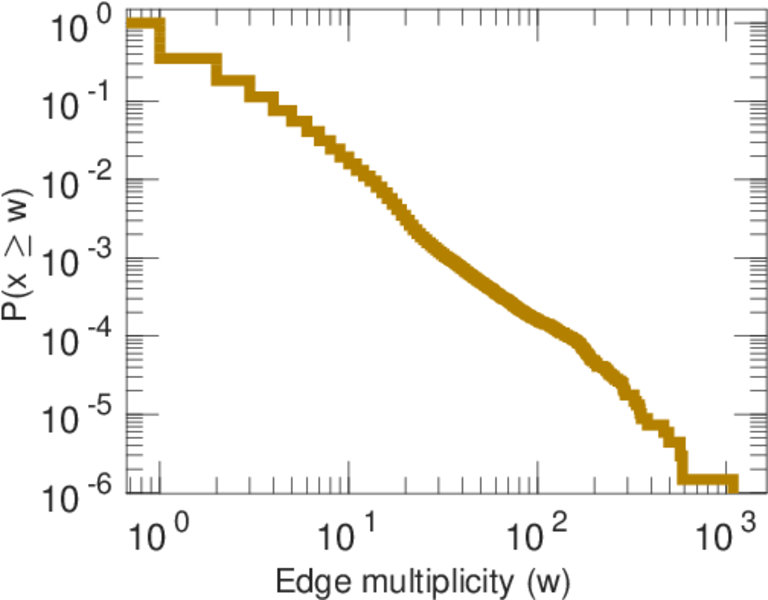
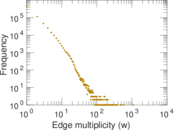
| Average edge multiplicity | m̃ = | 2.044 93
|
| Size of LCC | N = | 120,868
|
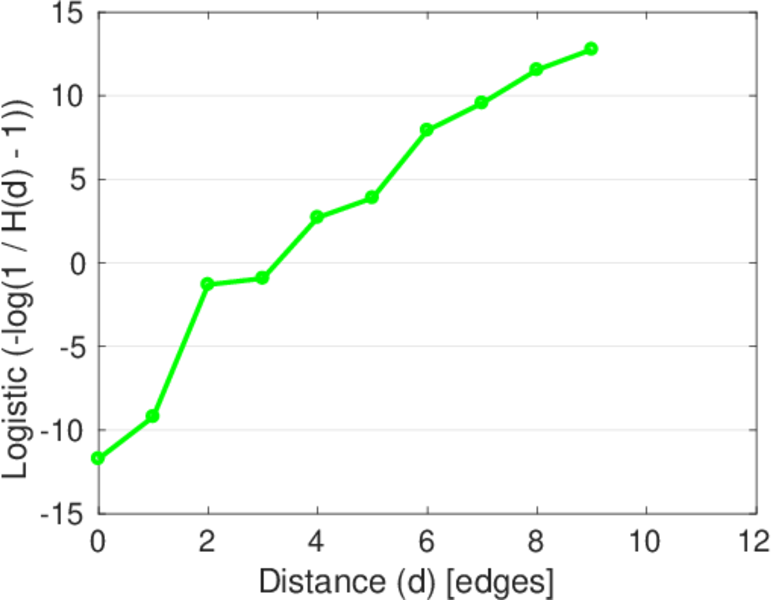
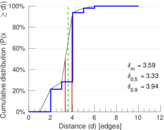
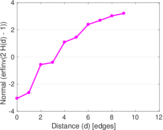
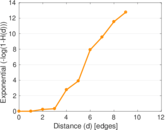
| Diameter | δ = | 14
|
| 50-Percentile effective diameter | δ0.5 = | 3.331 32
|
| 90-Percentile effective diameter | δ0.9 = | 3.942 48
|
| Median distance | δM = | 4
|
| Mean distance | δm = | 3.586 60
|
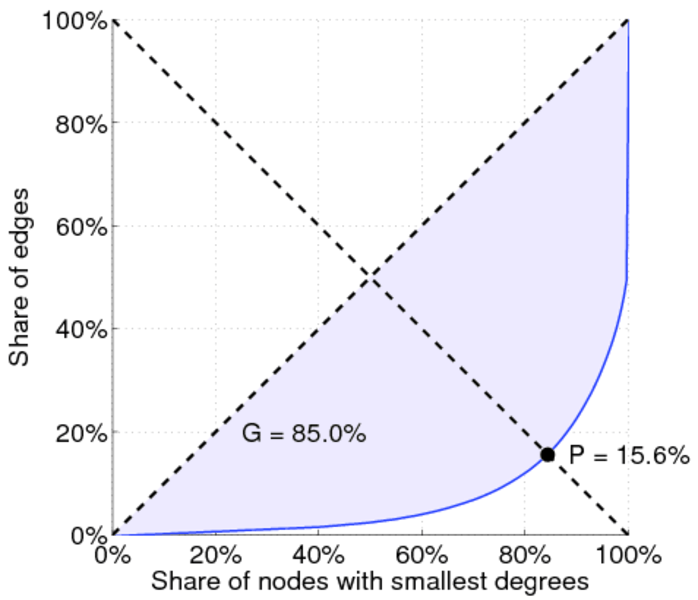
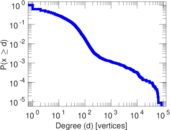
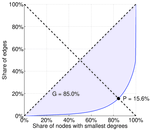
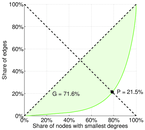
| Gini coefficient | G = | 0.850 817
|
| Balanced inequality ratio | P = | 0.155 967
|
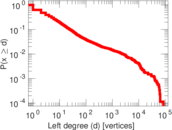
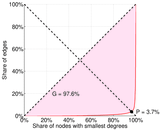
| Left balanced inequality ratio | P1 = | 0.037 398 6
|
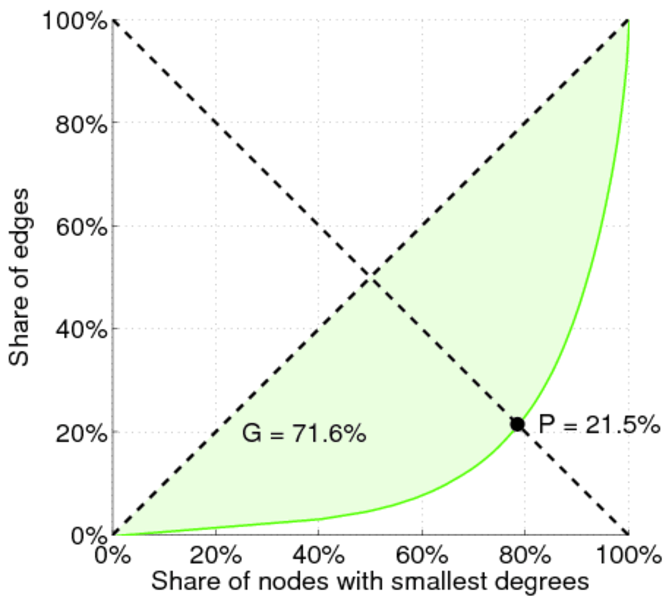
| Right balanced inequality ratio | P2 = | 0.214 693
|
| Relative edge distribution entropy | Her = | 0.733 811
|
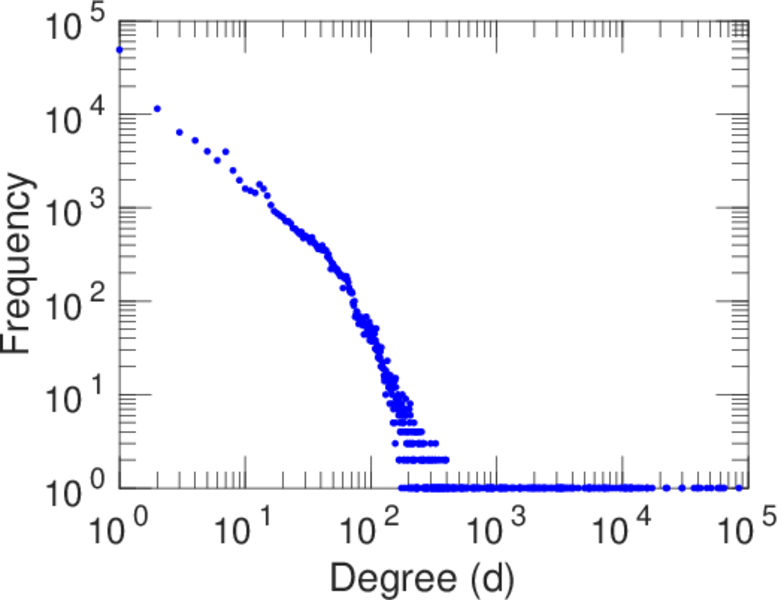
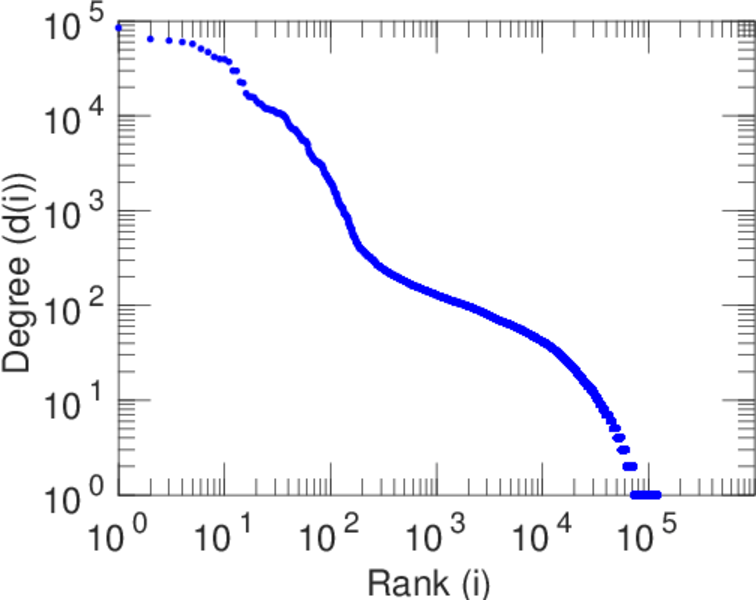
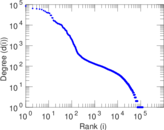
| Power law exponent | γ = | 1.993 15
|
| Tail power law exponent with p | γ3 = | 3.071 00
|
| p-value | p = | 0.000 00
|
| Left tail power law exponent with p | γ3,1 = | 1.791 00
|
| Left p-value | p1 = | 0.000 00
|
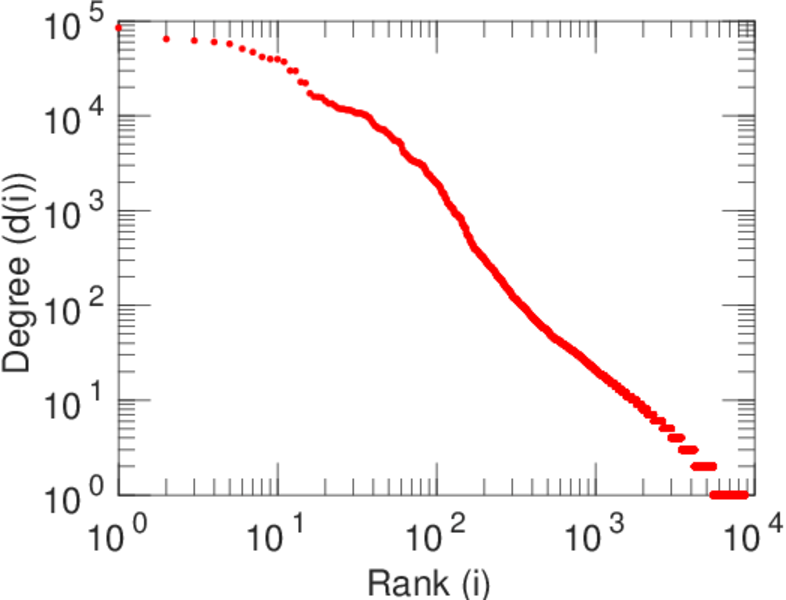
| Right tail power law exponent with p | γ3,2 = | 4.151 00
|
| Right p-value | p2 = | 0.000 00
|
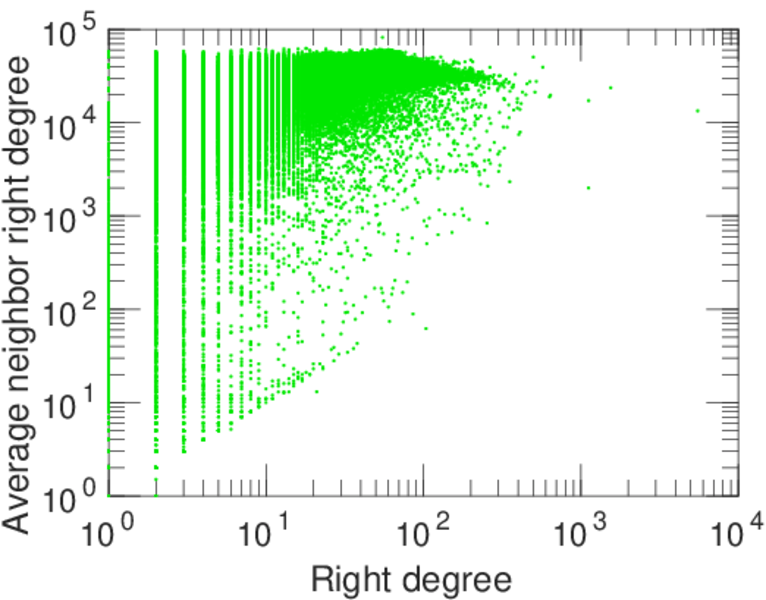
| Degree assortativity | ρ = | −0.101 924
|
| Degree assortativity p-value | pρ = | 0.000 00
|
| Algebraic connectivity | a = | 0.002 880 30
|
| Spectral separation | |λ1[A] / λ2[A]| = | 1.162 71
|
| Controllability | C = | 106,357
|
| Relative controllability | Cr = | 0.870 516
|
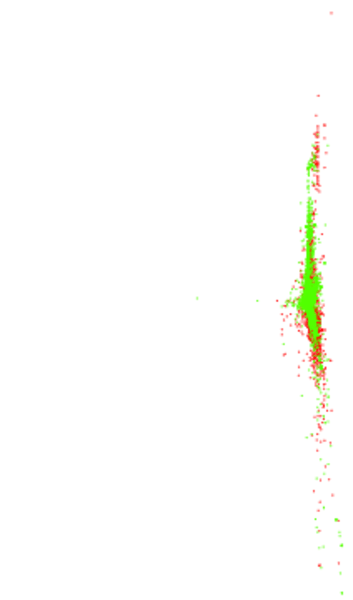
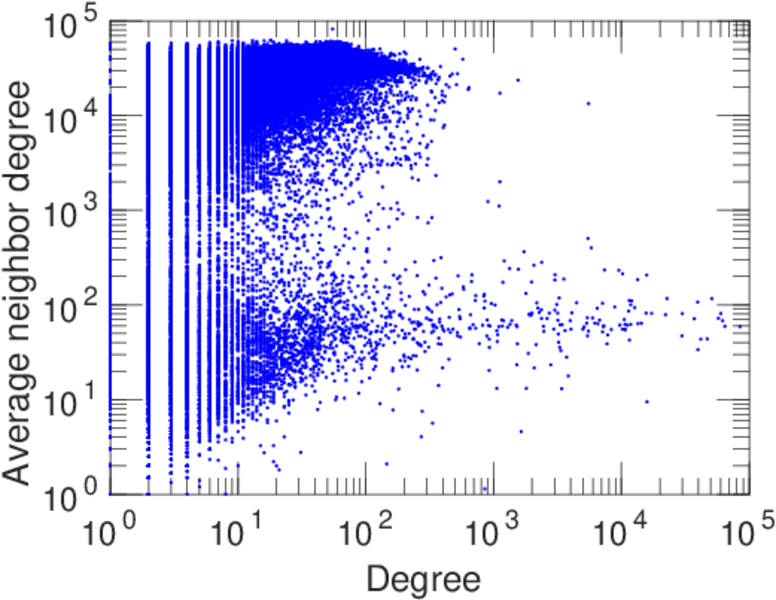
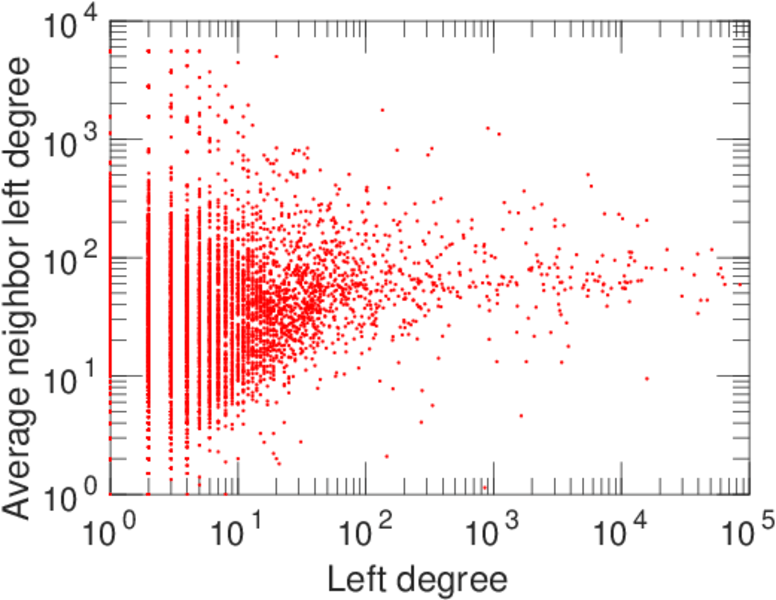
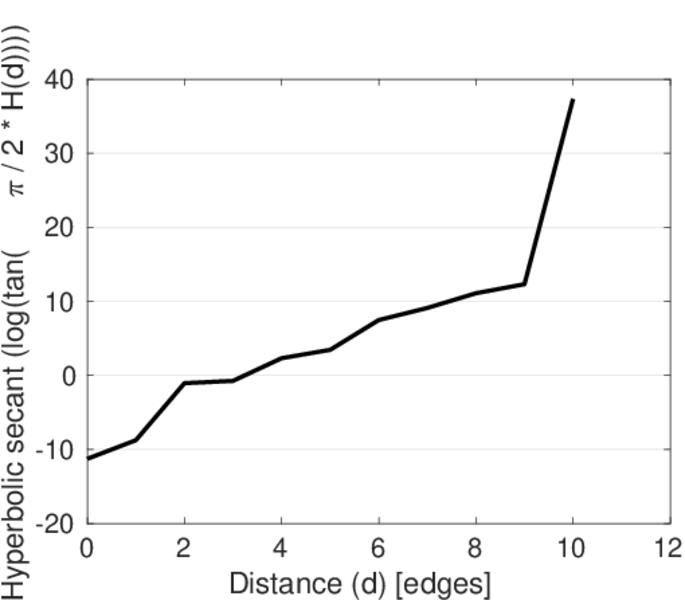
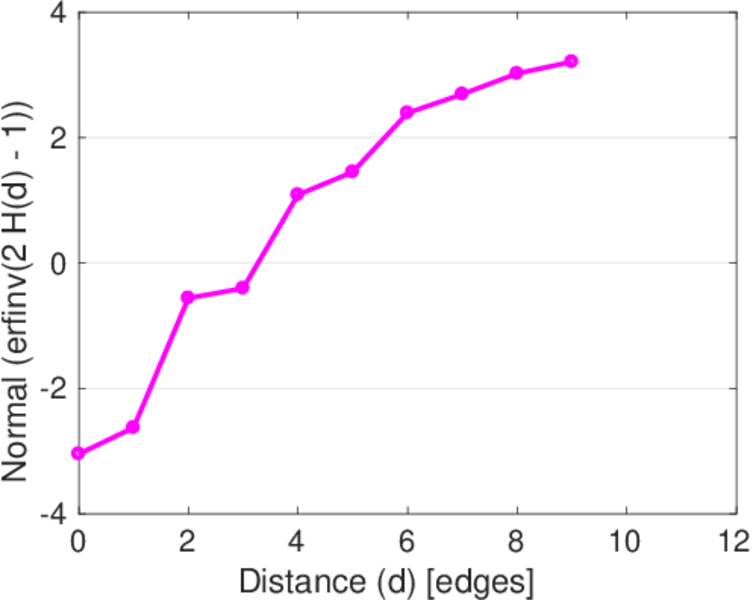
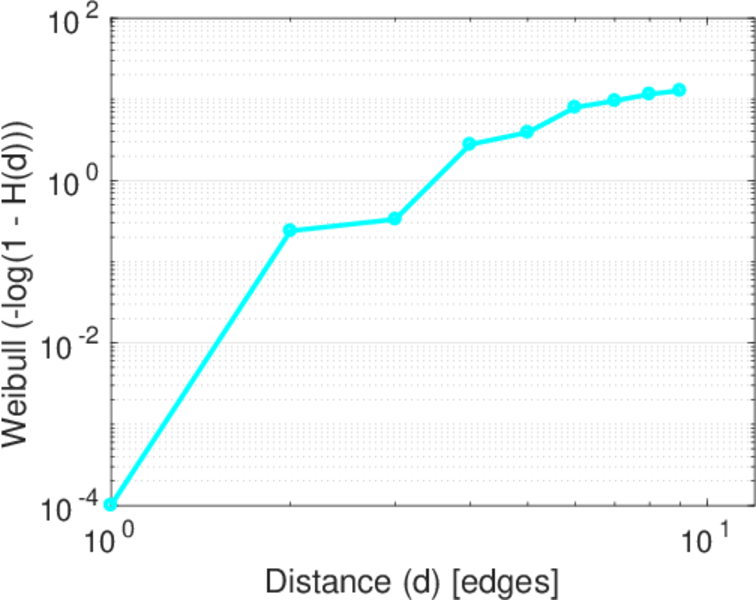
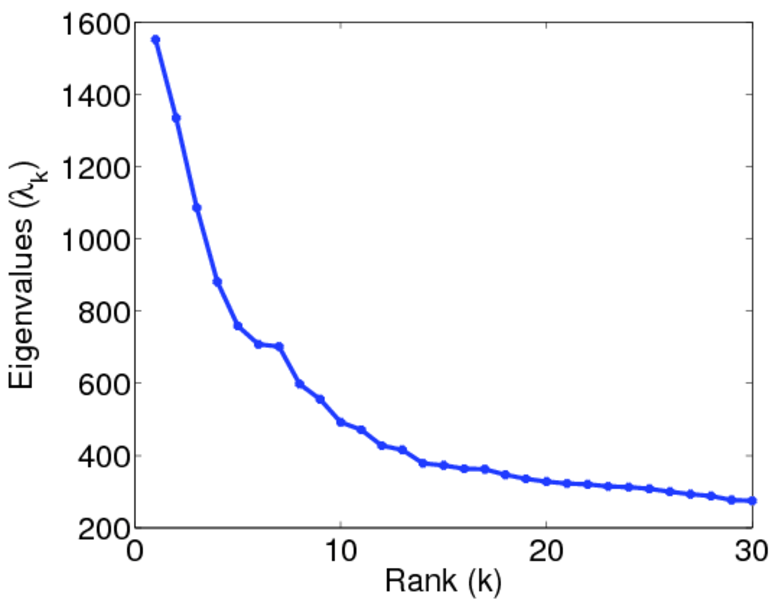
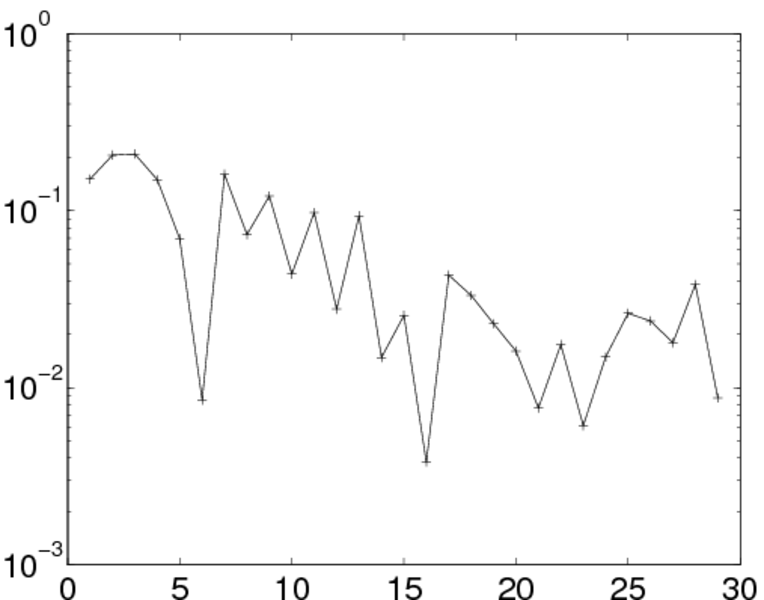
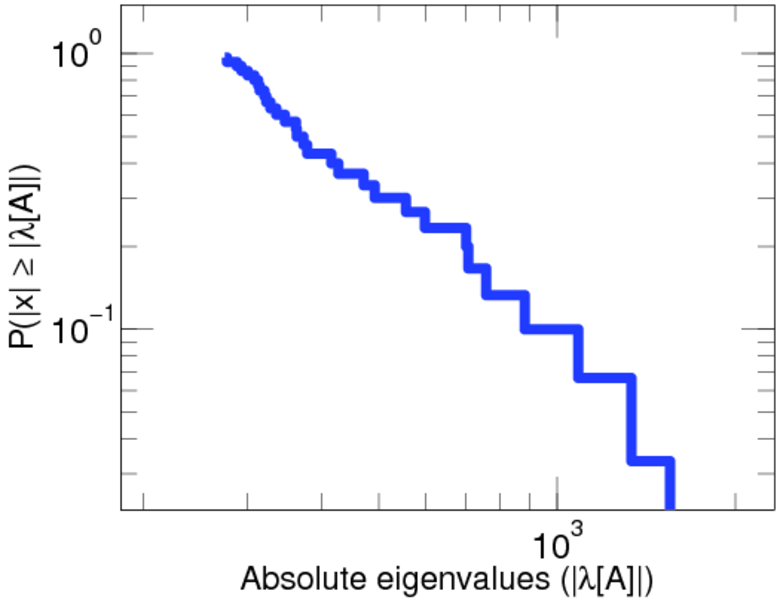
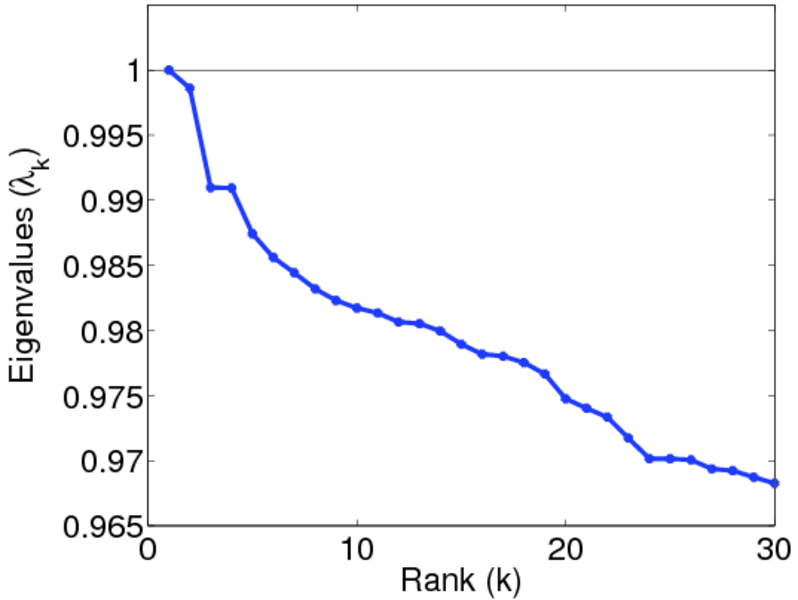
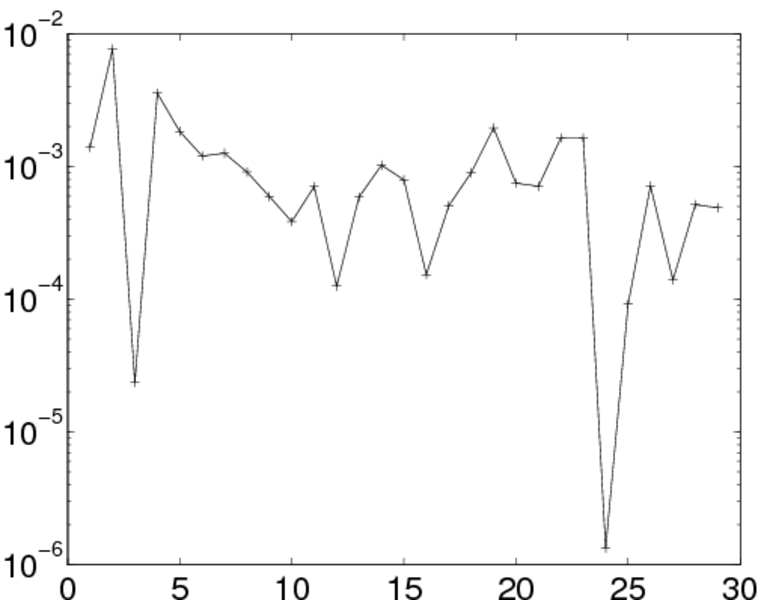
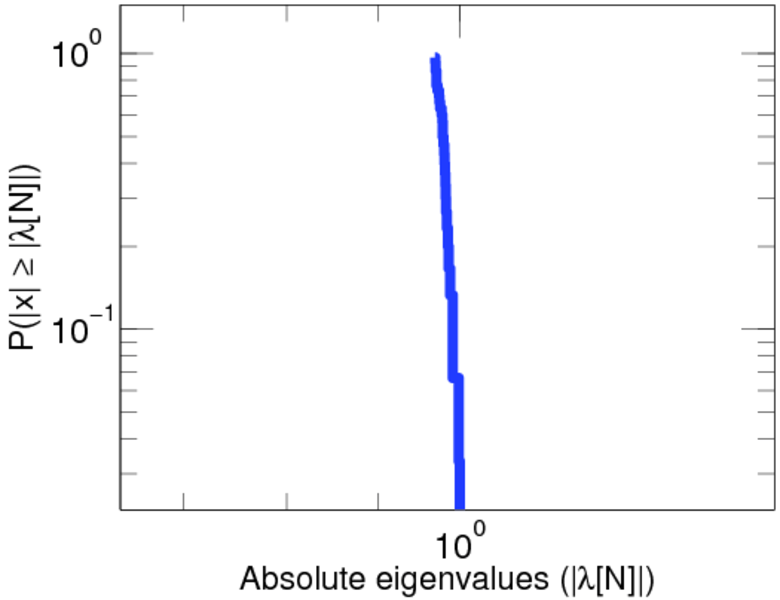
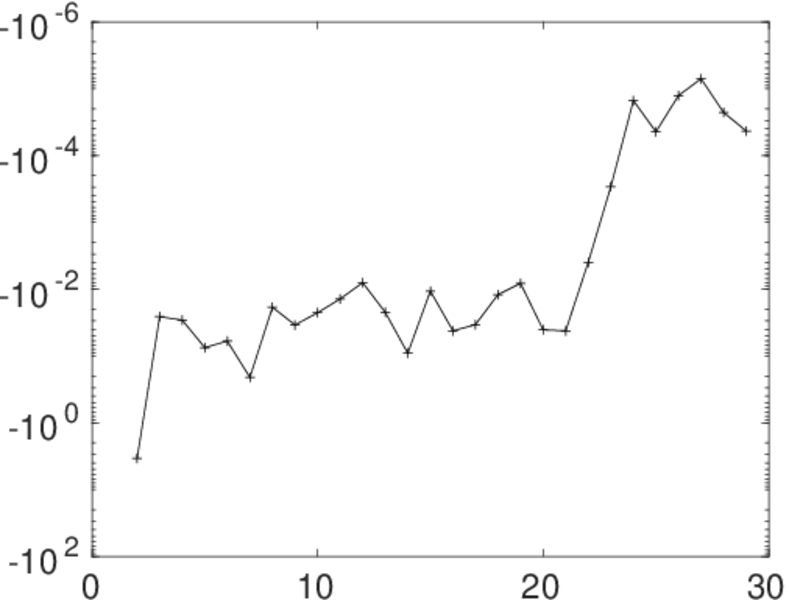
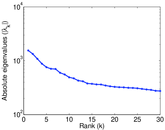
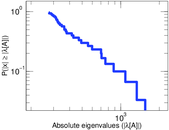
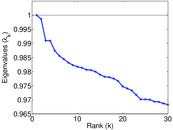
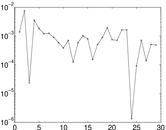
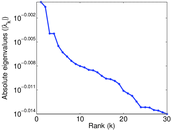
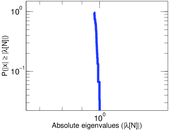
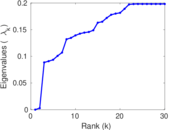
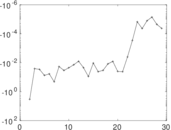
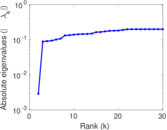
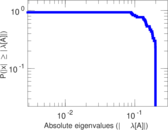
Plots


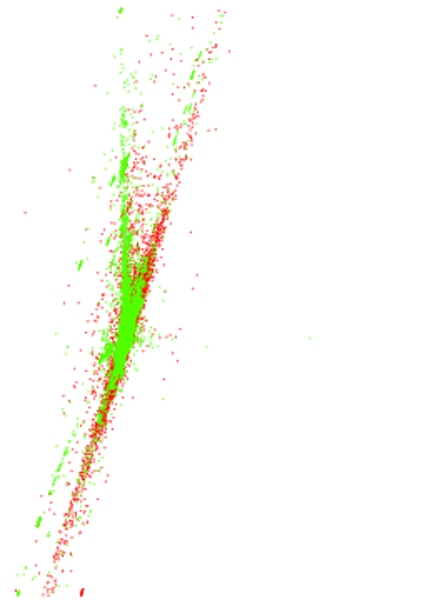
Matrix decompositions plots
Downloads
References
|
[1]
|
Jérôme Kunegis.
KONECT – The Koblenz Network Collection.
In Proc. Int. Conf. on World Wide Web Companion, pages
1343–1350, 2013.
[ http ]
|
|
[2]
|
Wikimedia Foundation.
Wikimedia downloads.
http://dumps.wikimedia.org/, January 2010.
|
 KONECT ‣ Networks ‣
Buy Me a Coffee
KONECT ‣ Networks ‣
Buy Me a Coffee