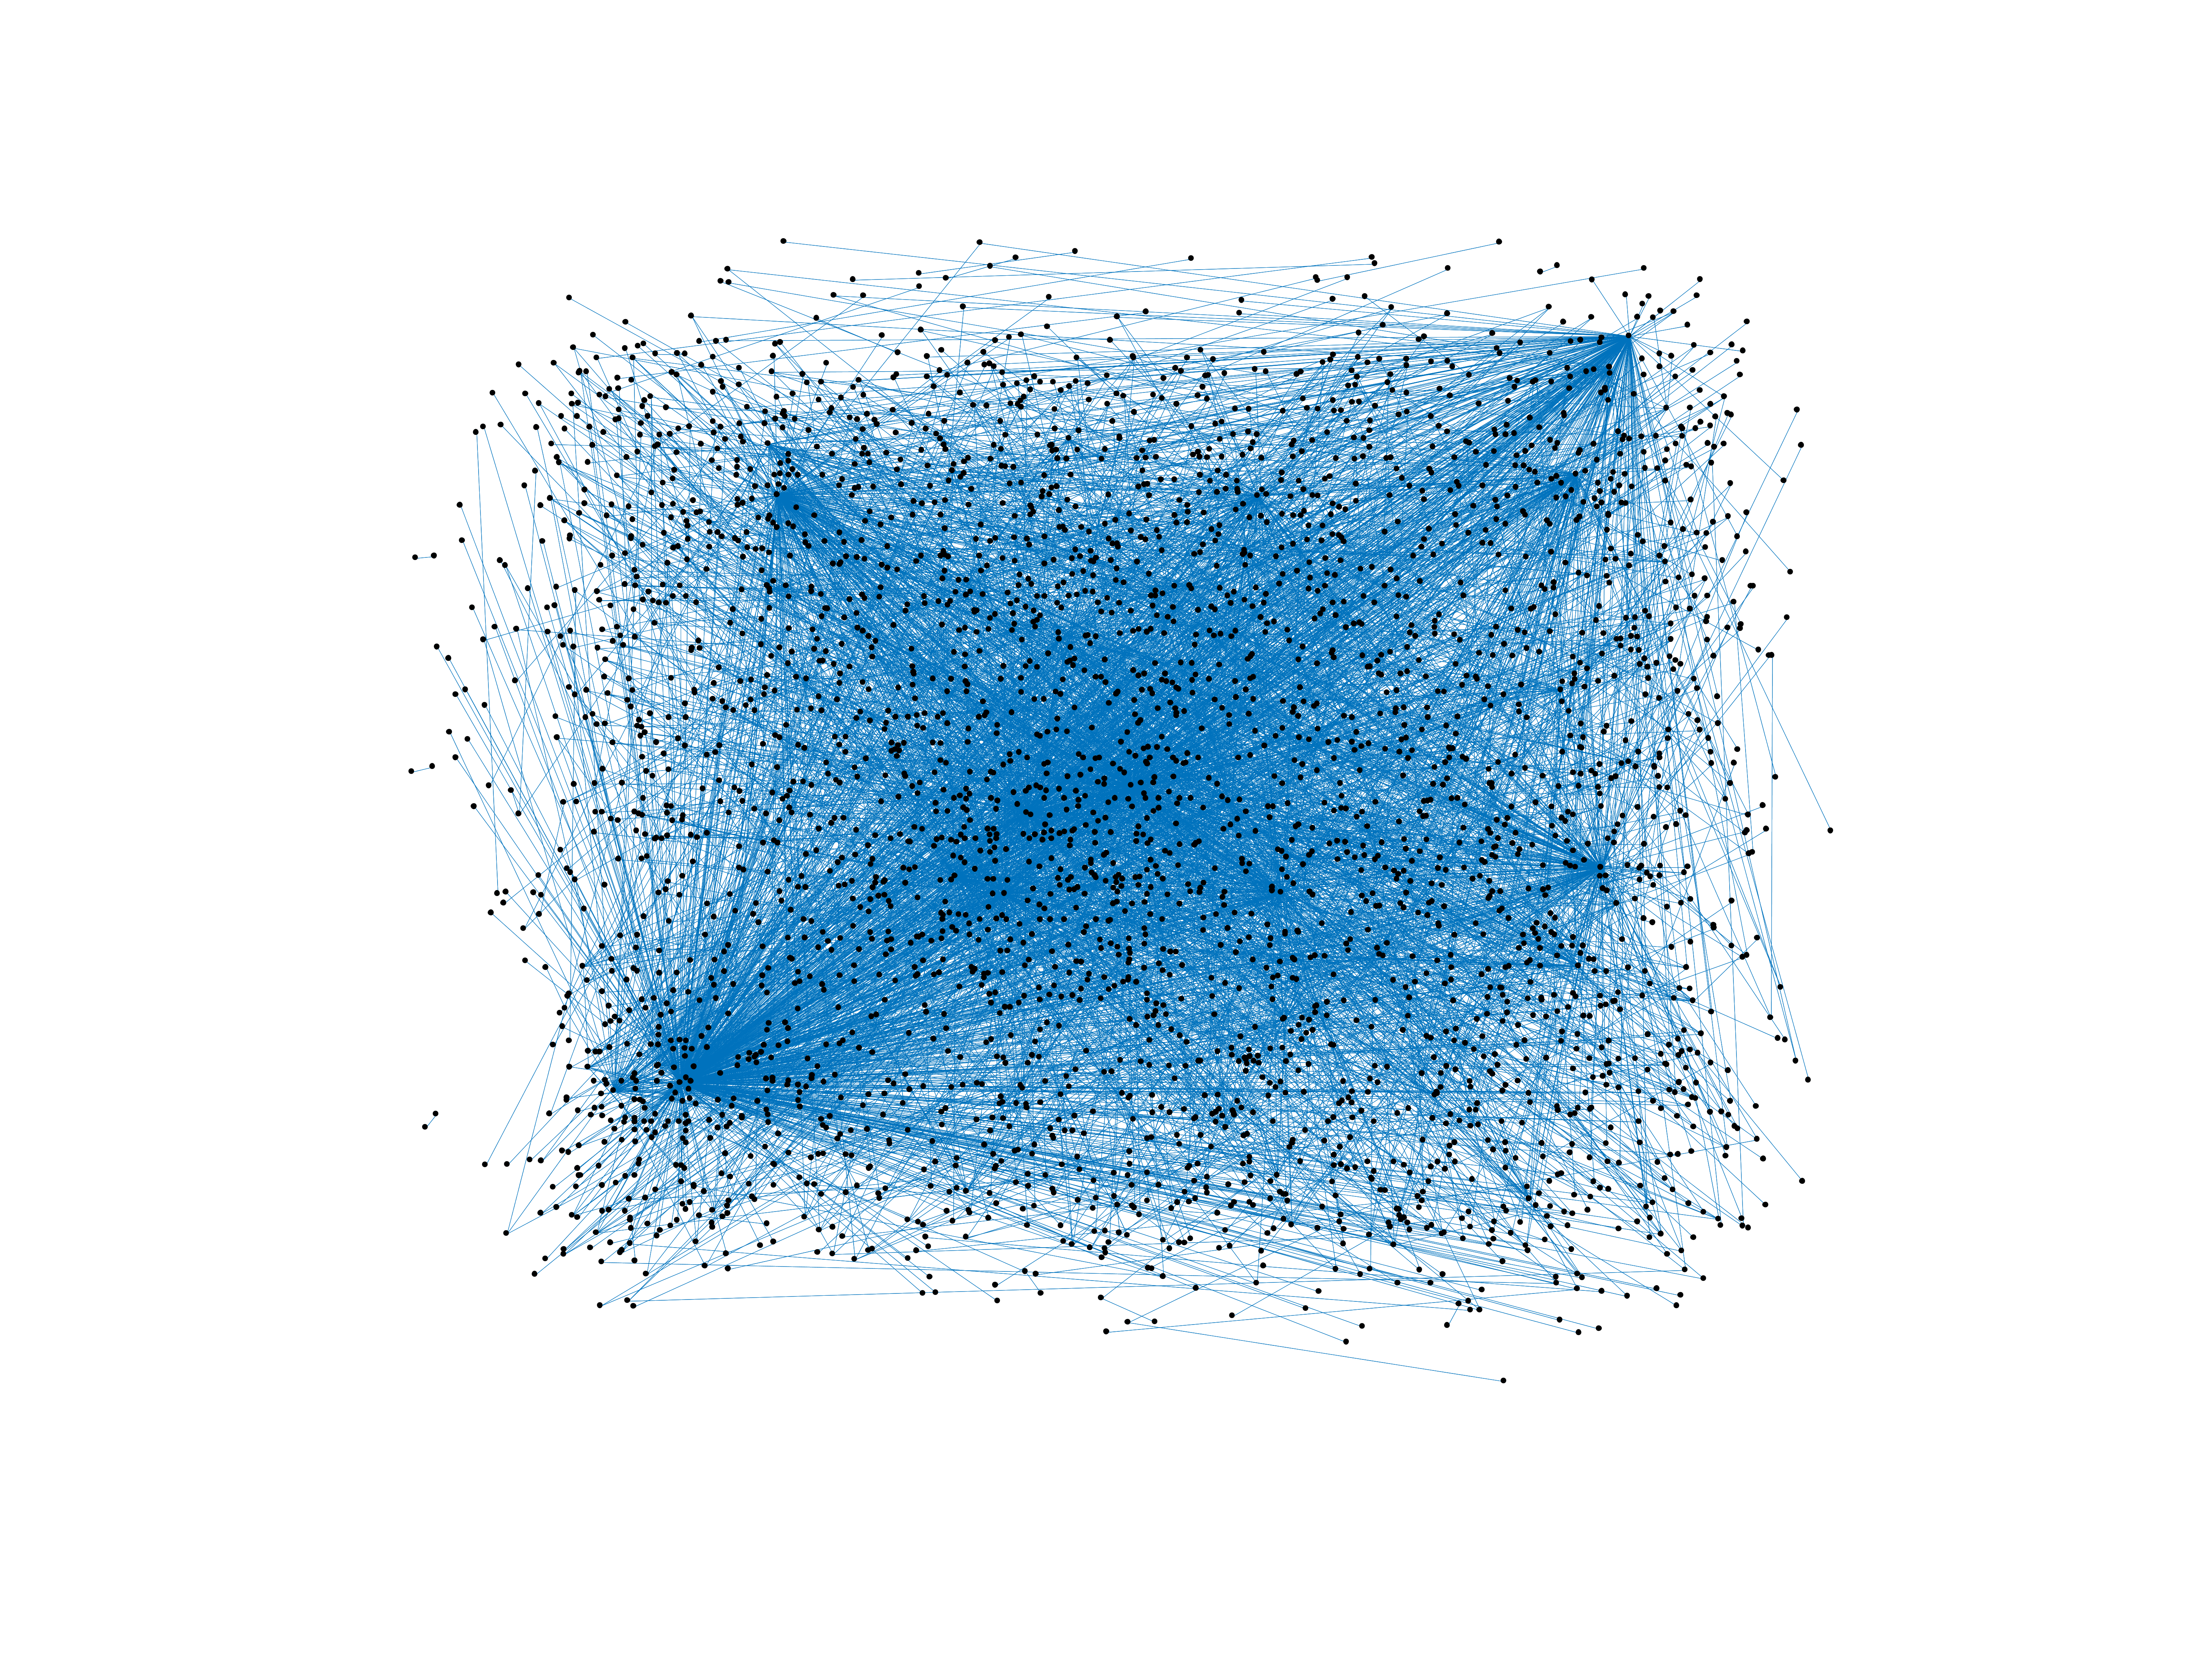
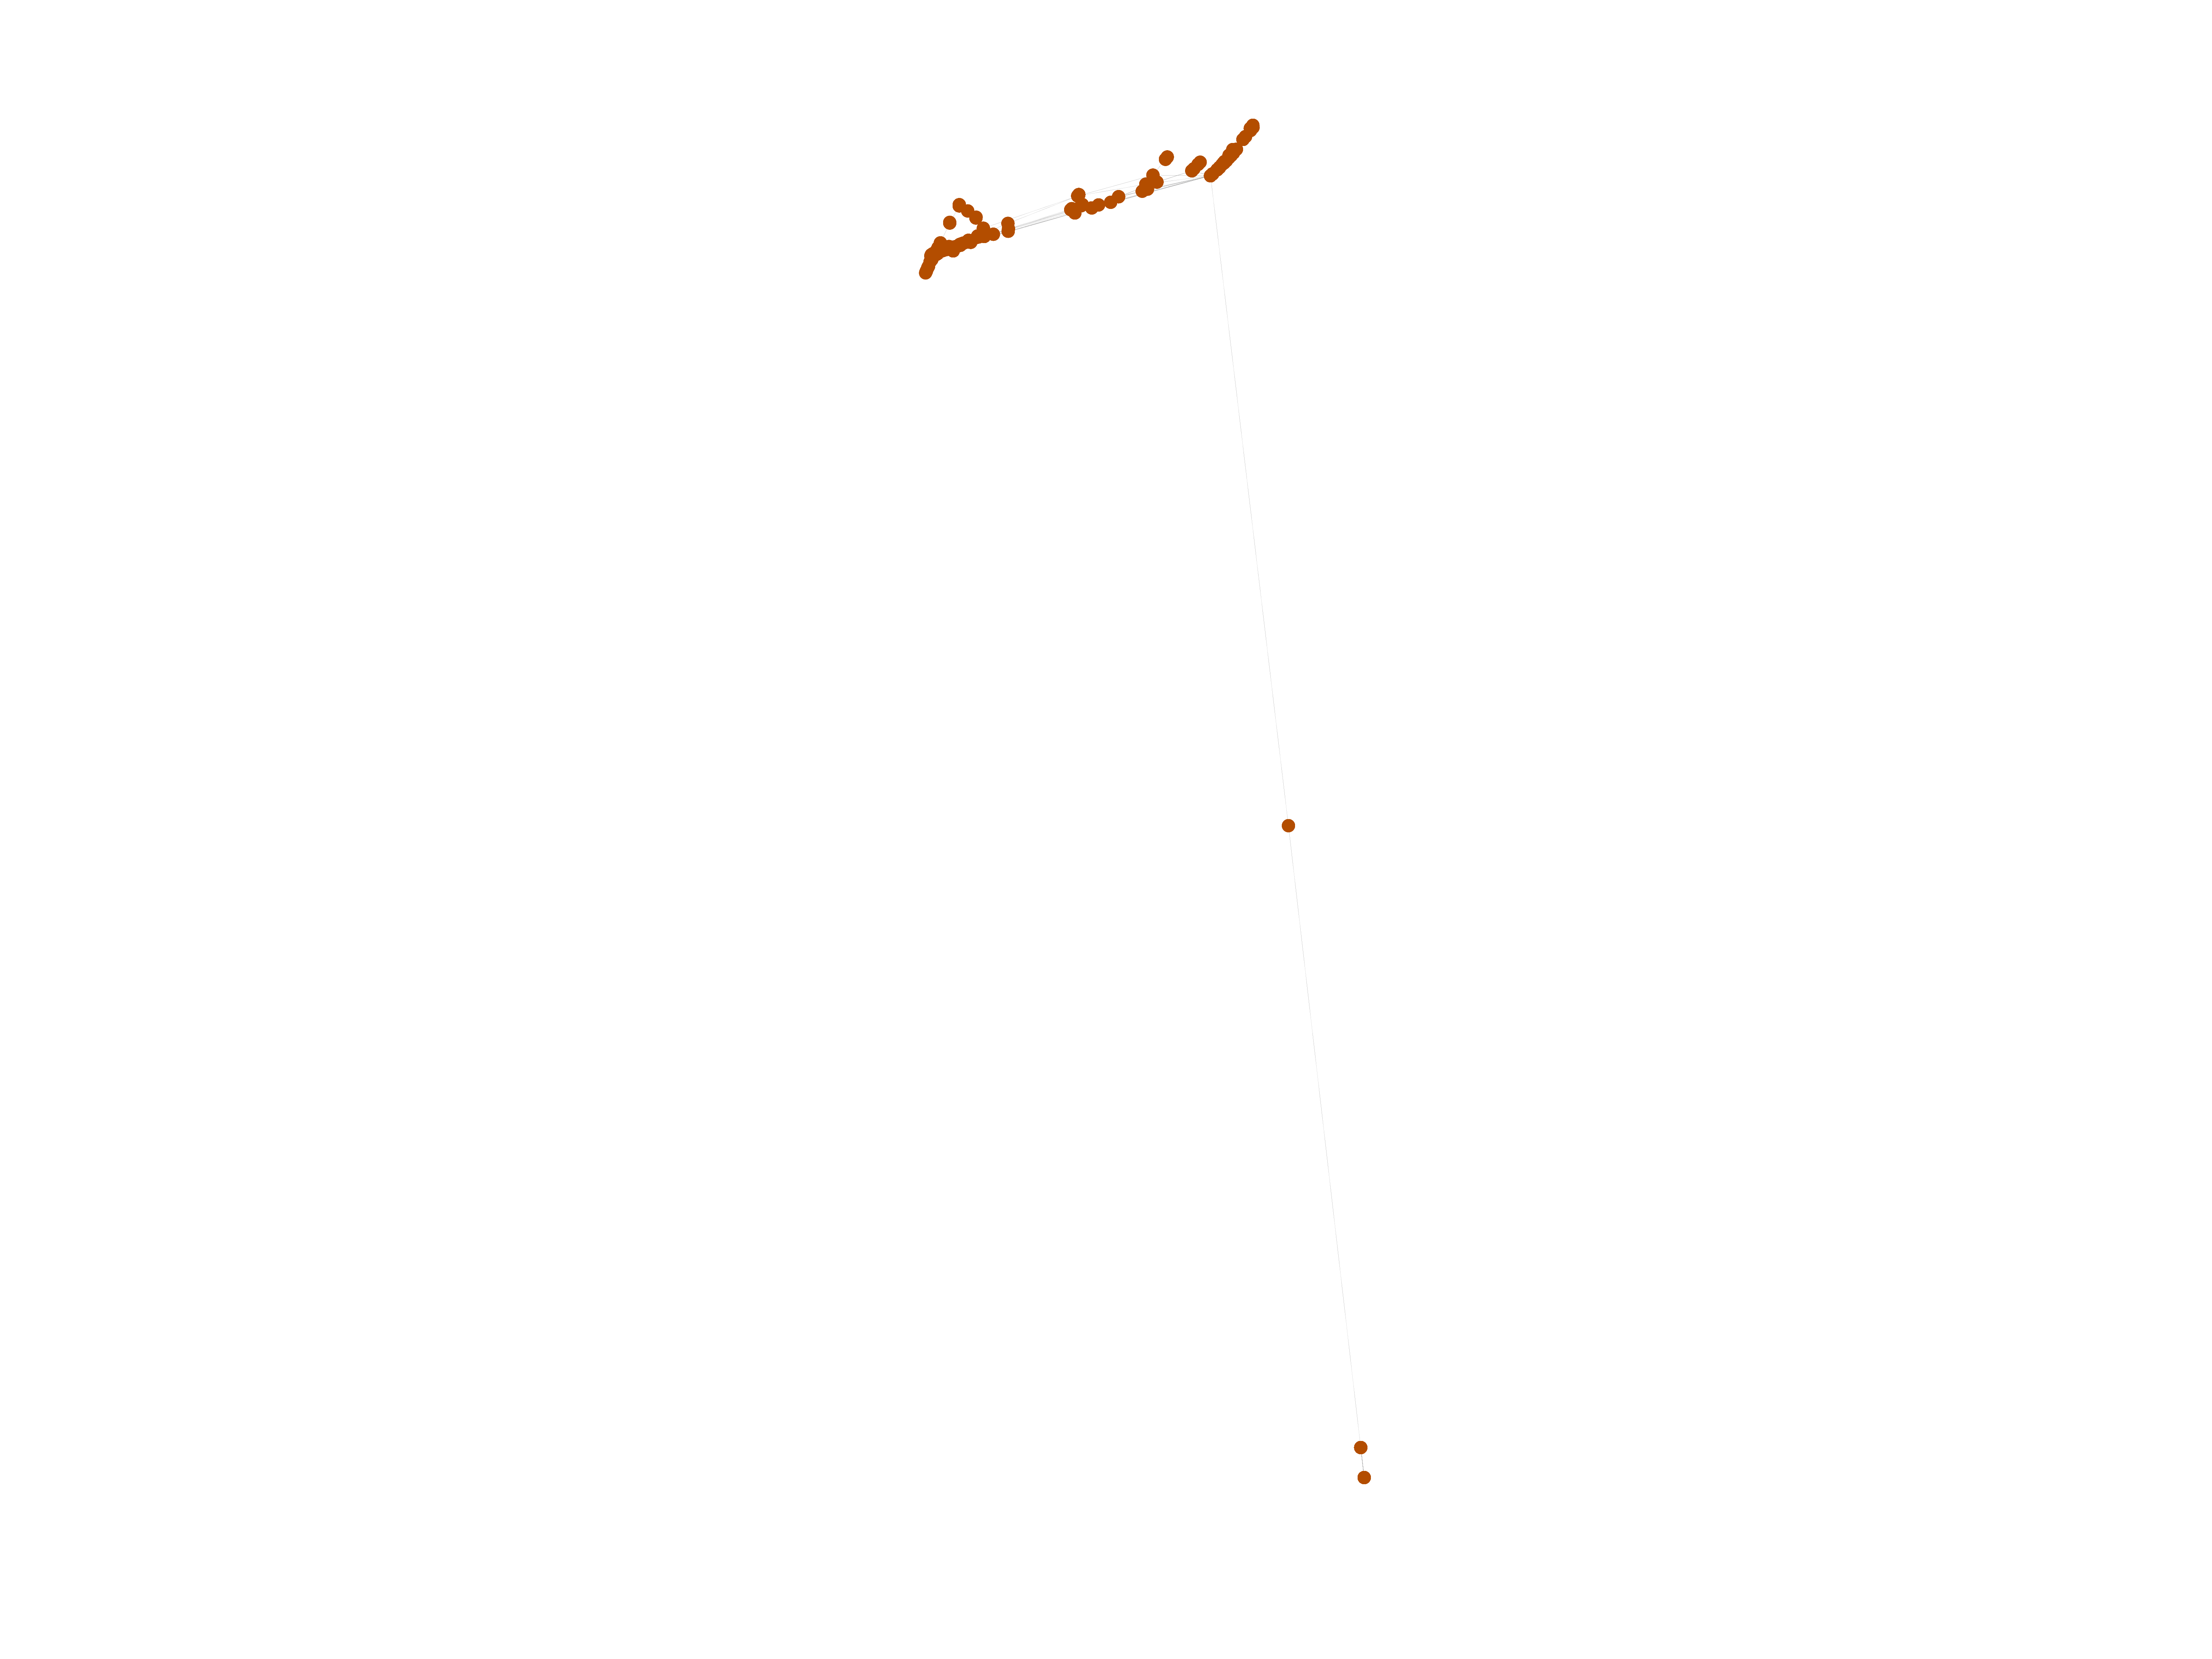
Wikibooks edits (is)
This is the bipartite edit network of the Icelandic Wikibooks. It contains
users and pages from the Icelandic Wikibooks, connected by edit events. Each
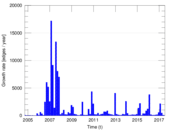
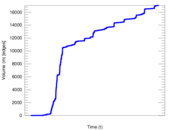
edge represents an edit. The dataset includes the timestamp of each edit.
Metadata
Statistics
| Size | n = | 3,571
|
| Left size | n1 = | 731
|
| Right size | n2 = | 2,840
|
| Volume | m = | 17,046
|
| Unique edge count | m̿ = | 4,644
|
| Wedge count | s = | 371,085
|
| Claw count | z = | 42,474,484
|
| Cross count | x = | 4,644,355,479
|
| Square count | q = | 30,359
|
| 4-Tour count | T4 = | 1,737,136
|
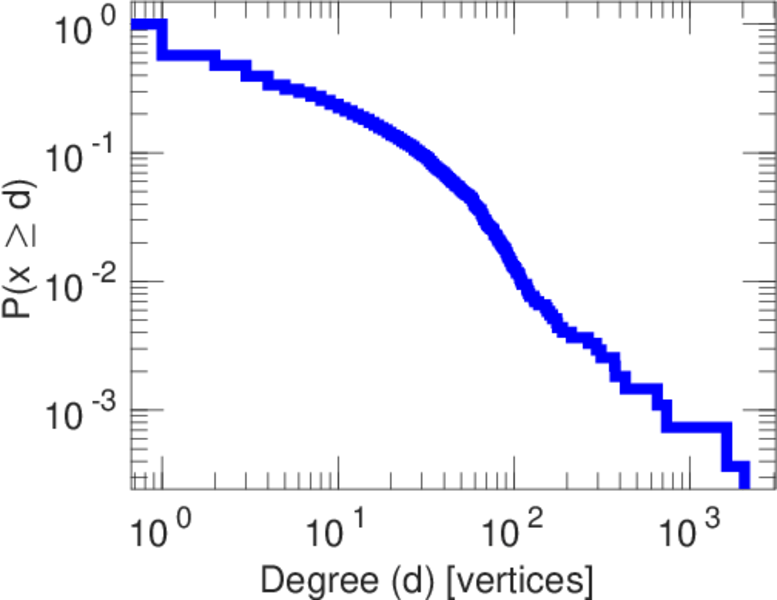
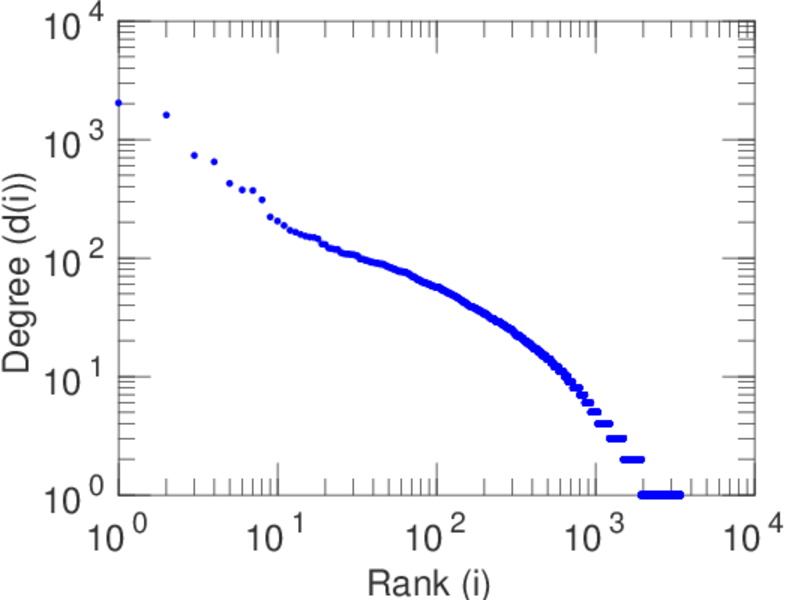
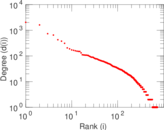
| Maximum degree | dmax = | 2,036
|
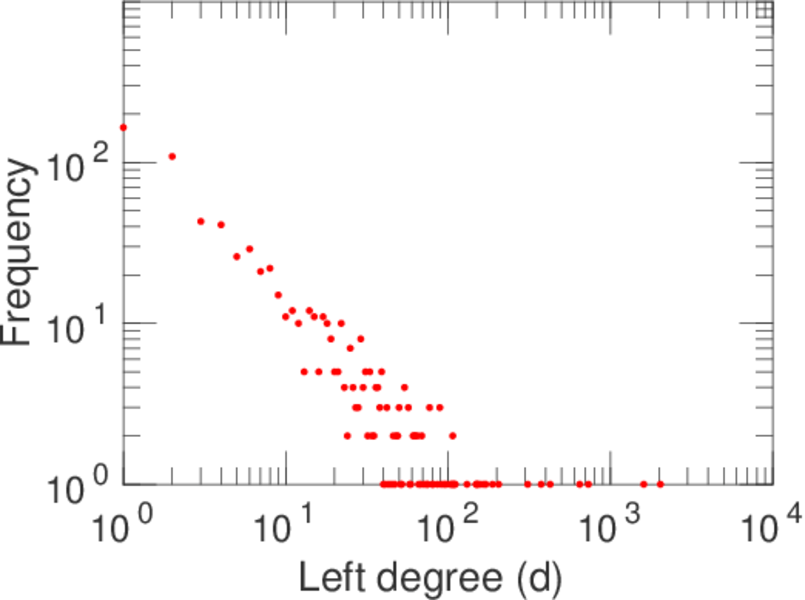
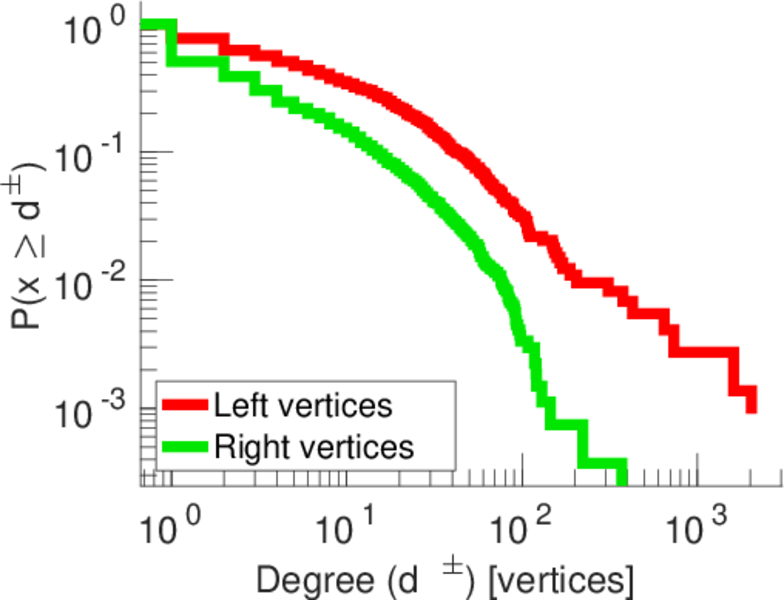
| Maximum left degree | d1max = | 2,036
|
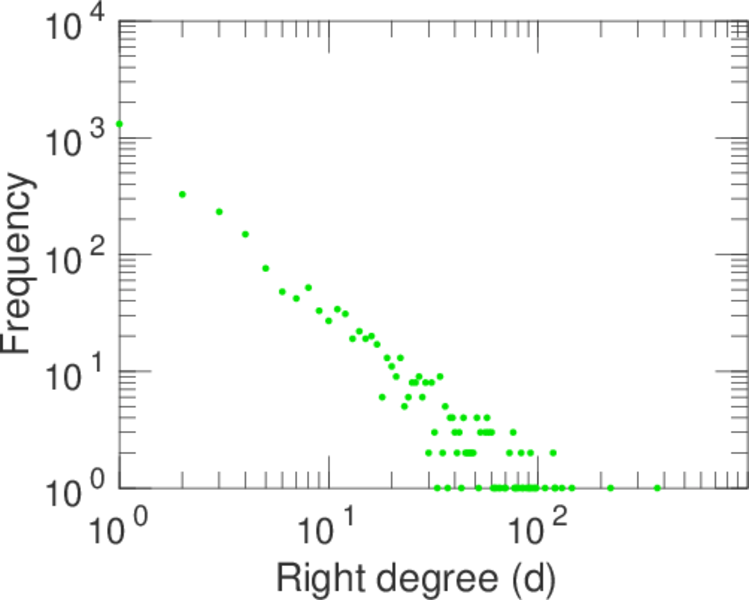
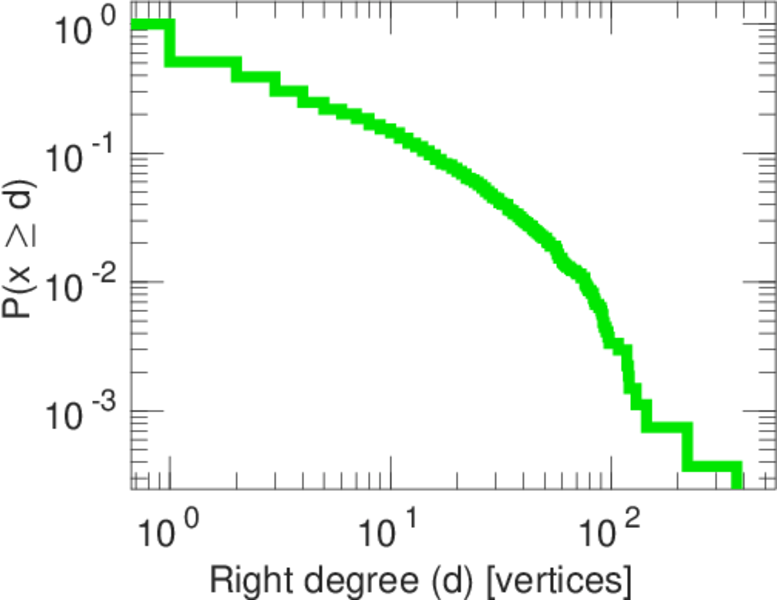
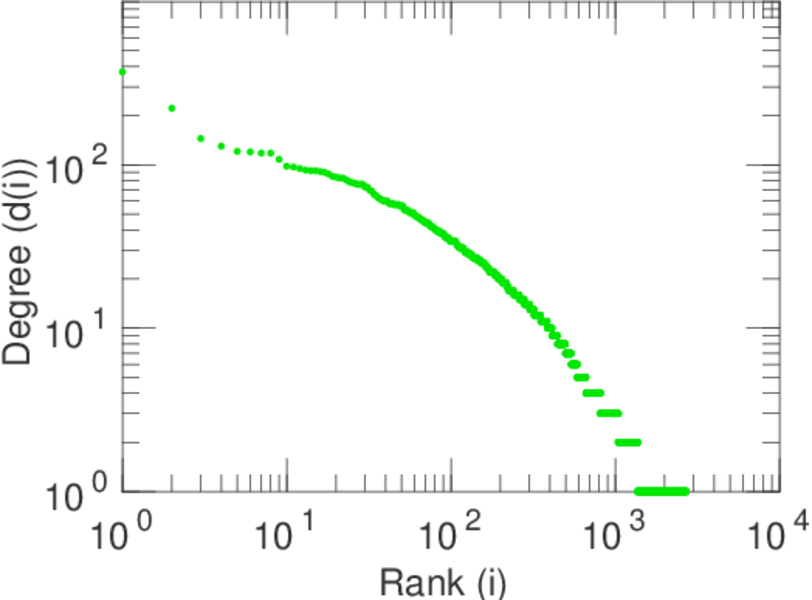
| Maximum right degree | d2max = | 371
|
| Average degree | d = | 9.546 91
|
| Average left degree | d1 = | 23.318 7
|
| Average right degree | d2 = | 6.002 11
|
| Fill | p = | 0.002 236 95
|
| Average edge multiplicity | m̃ = | 3.670 54
|
| Size of LCC | N = | 2,920
|
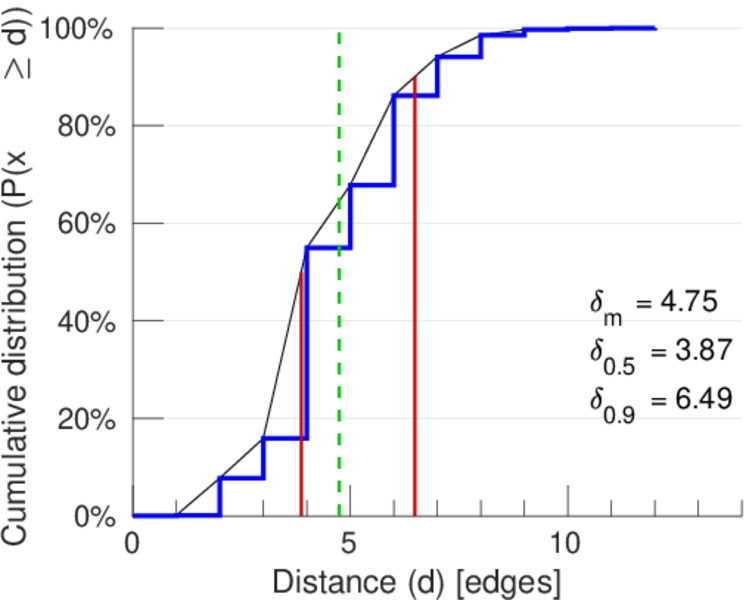
| Diameter | δ = | 13
|
| 50-Percentile effective diameter | δ0.5 = | 3.874 20
|
| 90-Percentile effective diameter | δ0.9 = | 6.485 64
|
| Median distance | δM = | 4
|
| Mean distance | δm = | 4.752 48
|
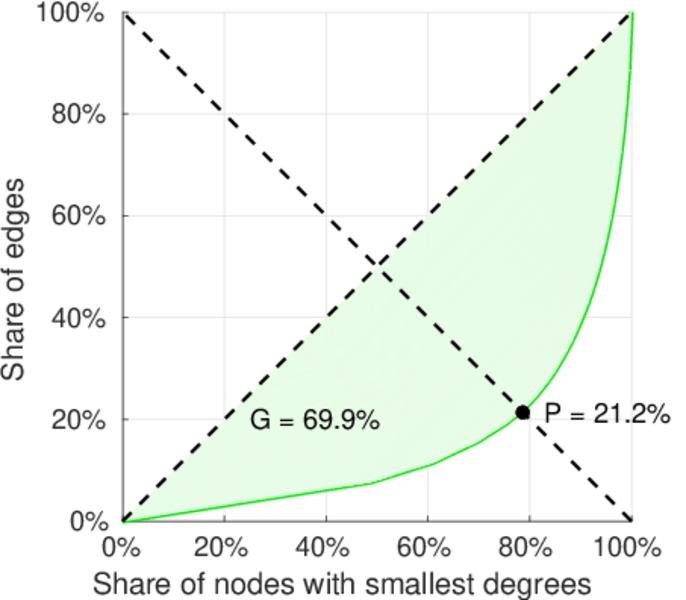
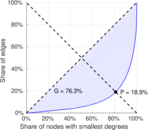
| Gini coefficient | G = | 0.772 774
|
| Balanced inequality ratio | P = | 0.186 055
|
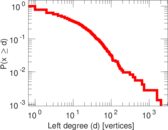
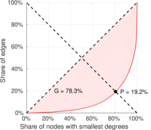
| Left balanced inequality ratio | P1 = | 0.191 717
|
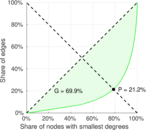
| Right balanced inequality ratio | P2 = | 0.212 191
|
| Relative edge distribution entropy | Her = | 0.838 346
|
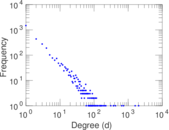
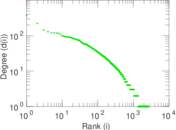
| Power law exponent | γ = | 3.405 24
|
| Tail power law exponent | γt = | 2.641 00
|
| Tail power law exponent with p | γ3 = | 2.641 00
|
| p-value | p = | 0.000 00
|
| Left tail power law exponent with p | γ3,1 = | 1.811 00
|
| Left p-value | p1 = | 0.813 000
|
| Right tail power law exponent with p | γ3,2 = | 3.611 00
|
| Right p-value | p2 = | 0.231 000
|
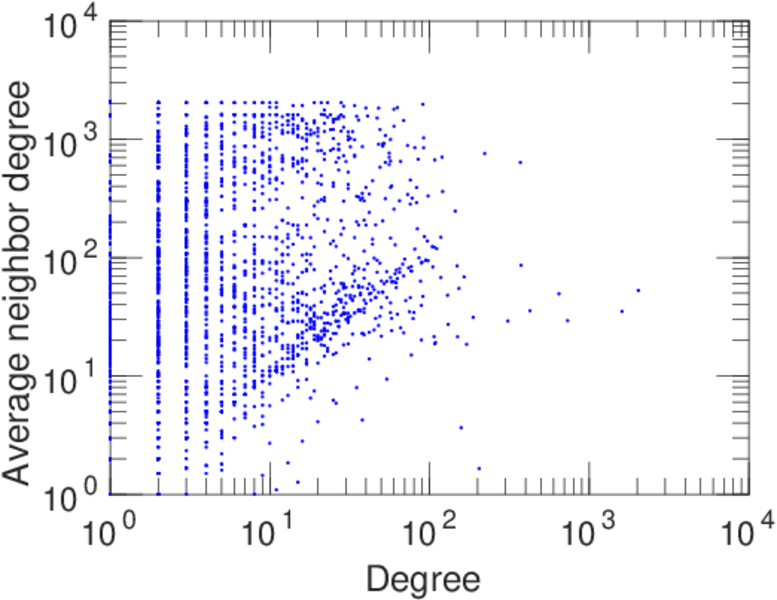
| Degree assortativity | ρ = | −0.180 862
|
| Degree assortativity p-value | pρ = | 1.926 03 × 10−35
|
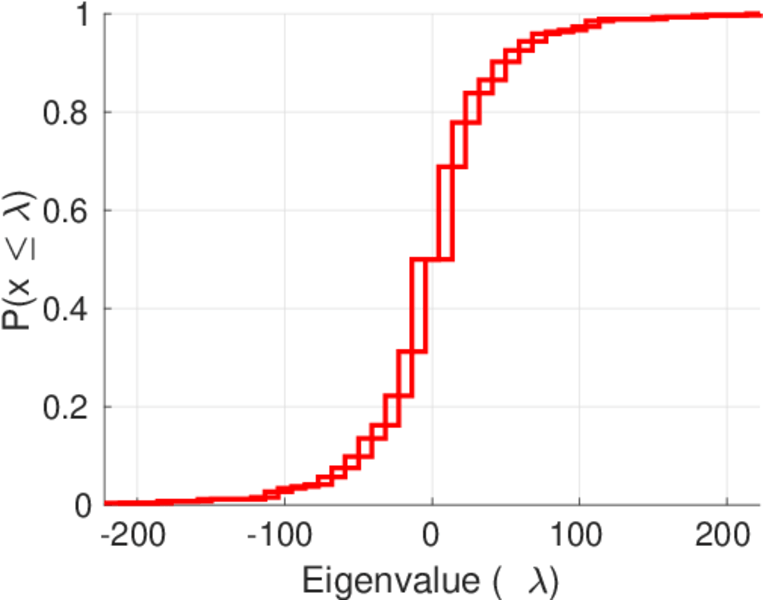
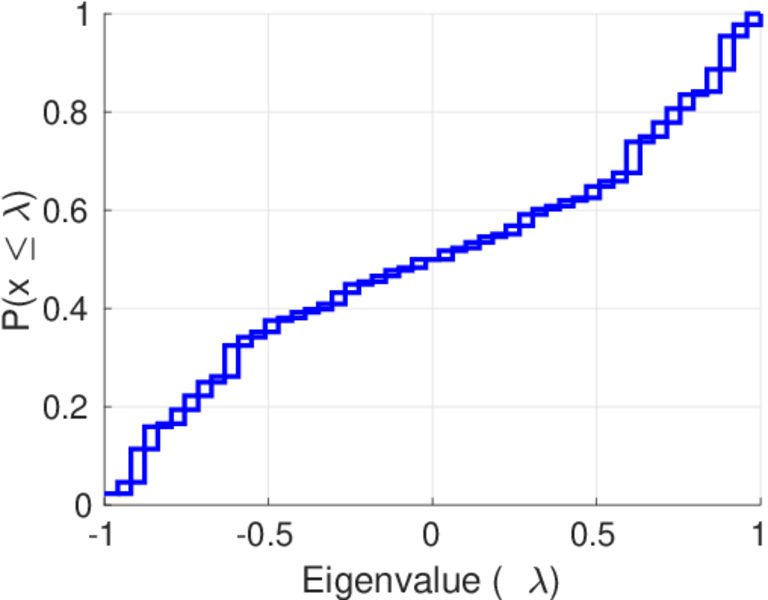
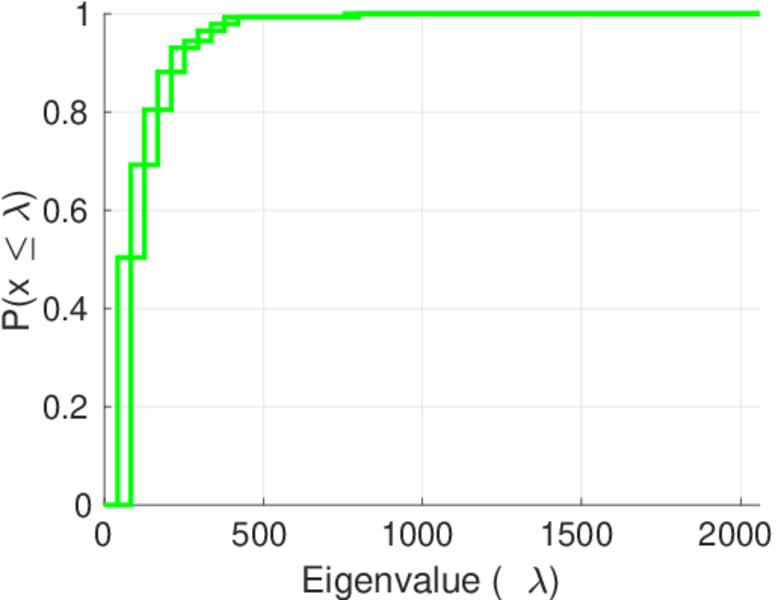
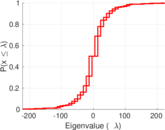
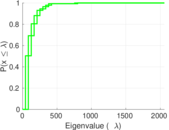
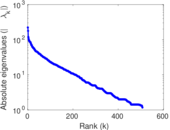
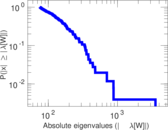
| Spectral norm | α = | 222.518
|
| Algebraic connectivity | a = | 0.020 185 7
|
| Spectral separation | |λ1[A] / λ2[A]| = | 1.252 86
|
| Controllability | C = | 2,067
|
| Relative controllability | Cr = | 0.605 626
|
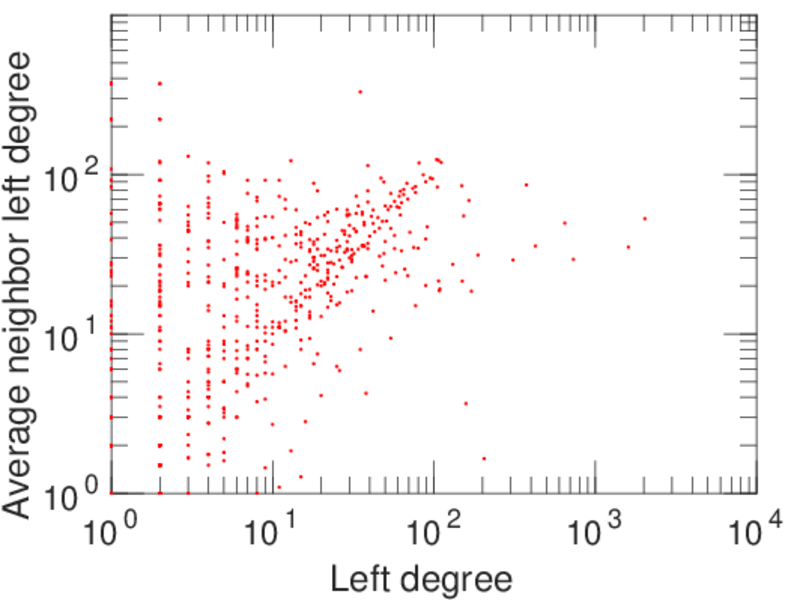
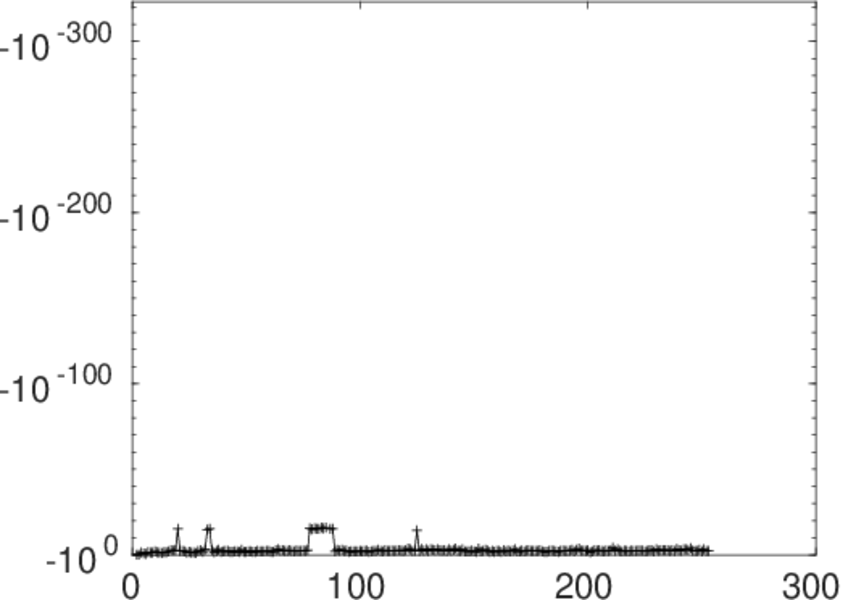
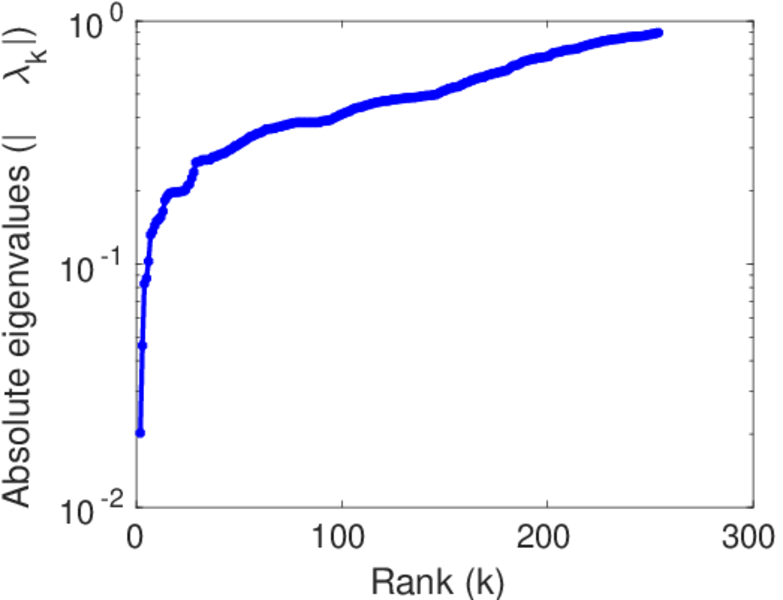
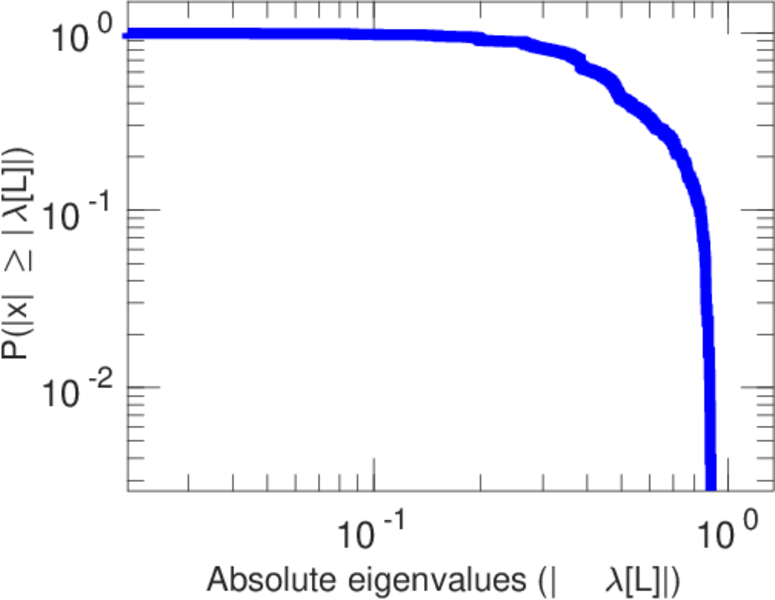
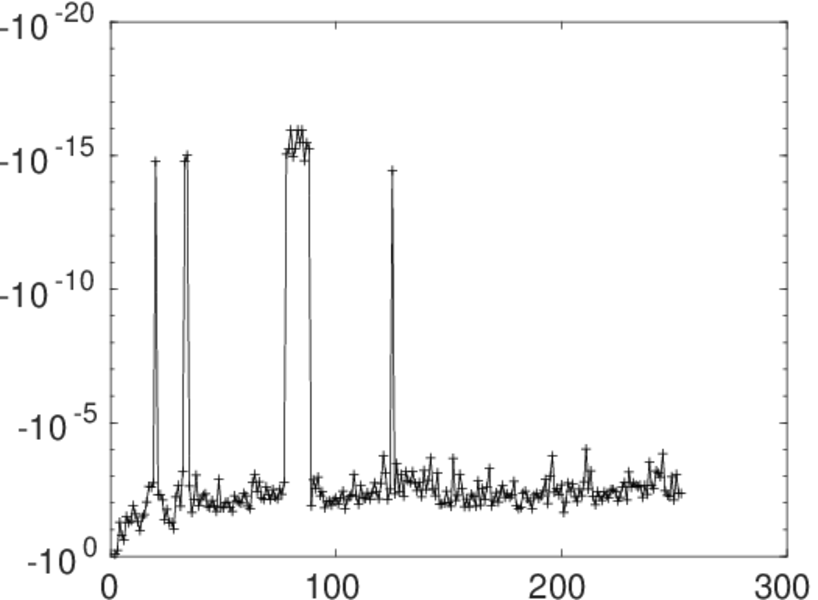
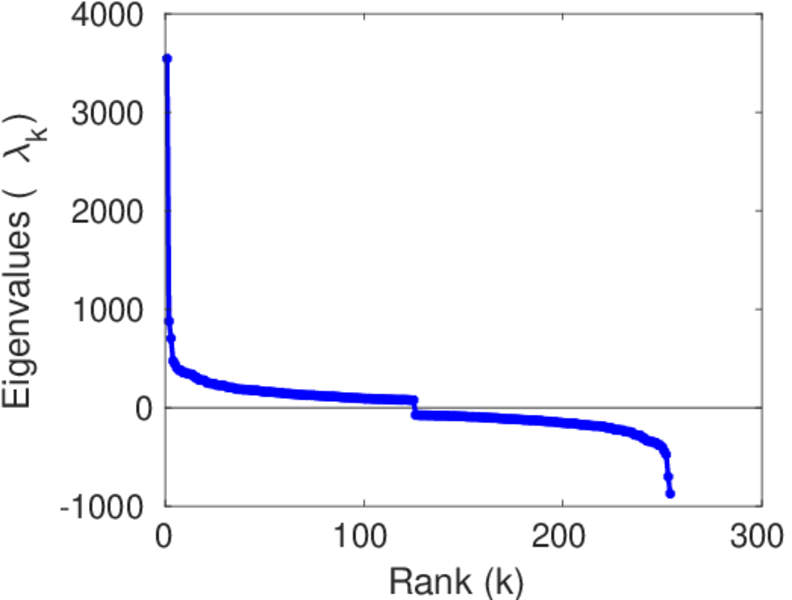
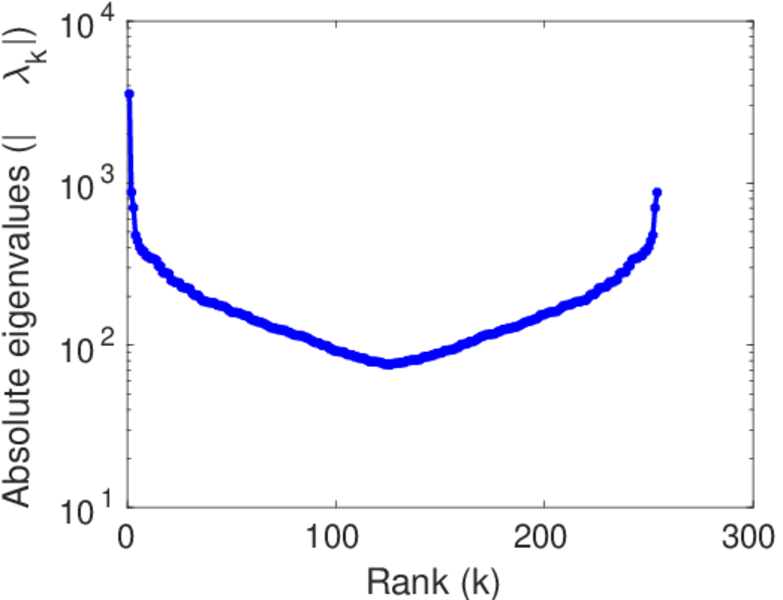
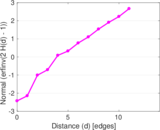
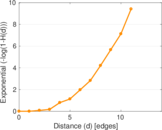
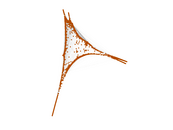
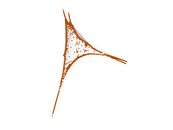
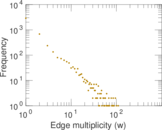
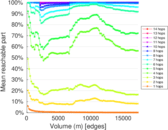
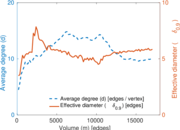
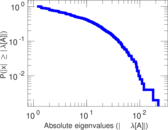
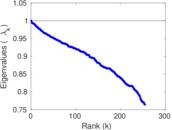
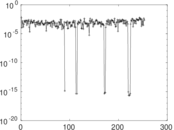
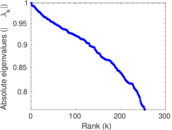
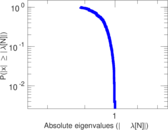
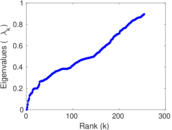
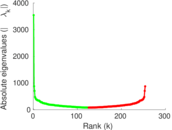
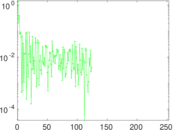
Plots


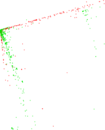

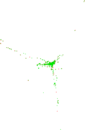


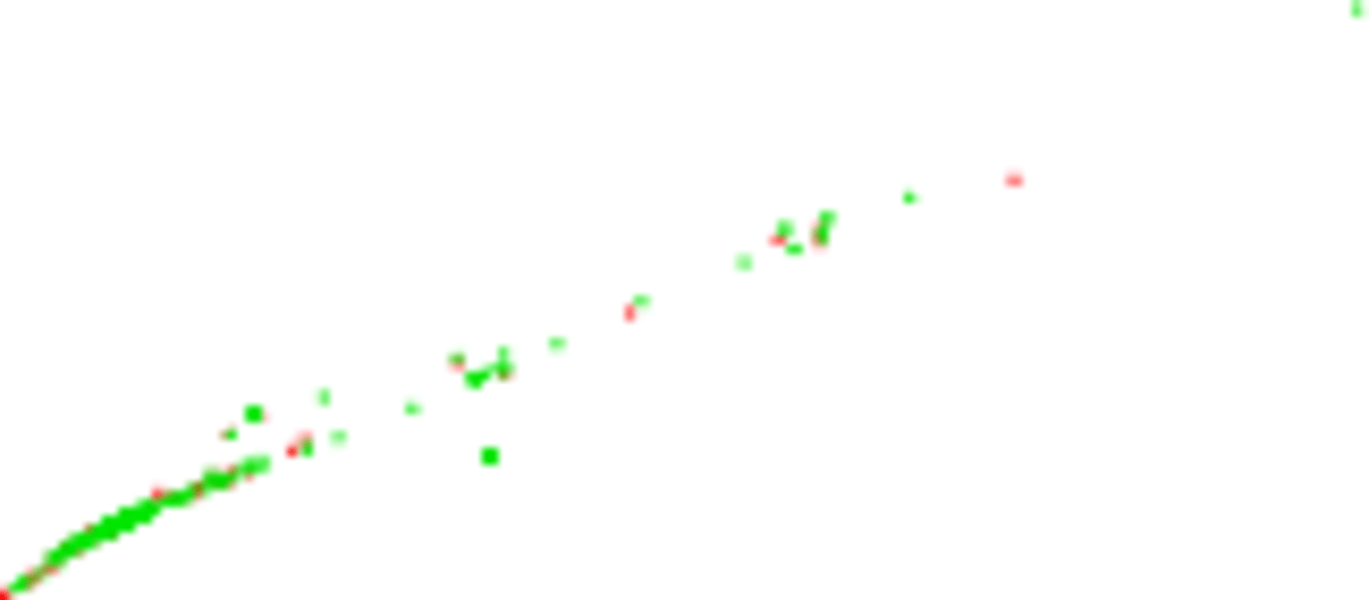
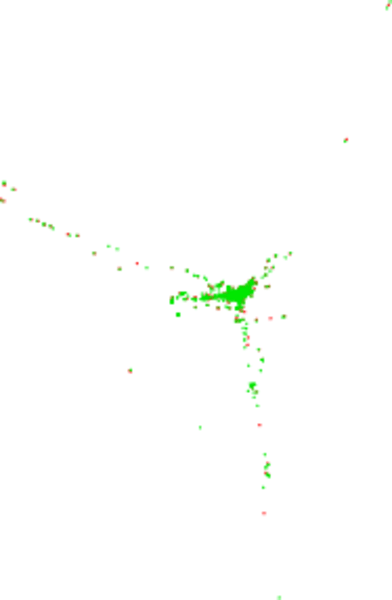
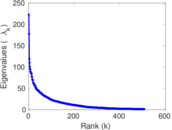
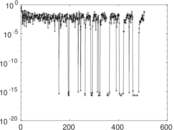
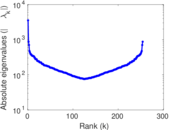
Matrix decompositions plots


Downloads
References
|
[1]
|
Jérôme Kunegis.
KONECT – The Koblenz Network Collection.
In Proc. Int. Conf. on World Wide Web Companion, pages
1343–1350, 2013.
[ http ]
|
|
[2]
|
Wikimedia Foundation.
Wikimedia downloads.
http://dumps.wikimedia.org/, January 2010.
|
 KONECT ‣ Networks ‣
Buy Me a Coffee
KONECT ‣ Networks ‣
Buy Me a Coffee