Wikiquote edits (is)
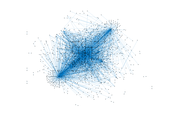
This is the bipartite edit network of the Icelandic Wikiquote. It contains
users and pages from the Icelandic Wikiquote, connected by edit events. Each
edge represents an edit. The dataset includes the timestamp of each edit.
Metadata
Statistics
| Size | n = | 1,490
|
| Left size | n1 = | 230
|
| Right size | n2 = | 1,260
|
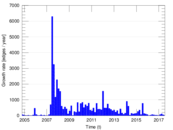
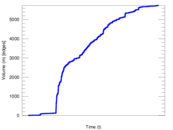
| Volume | m = | 5,743
|
| Unique edge count | m̿ = | 2,791
|
| Wedge count | s = | 269,410
|
| Claw count | z = | 37,287,980
|
| Cross count | x = | 4,823,121,904
|
| Square count | q = | 81,413
|
| 4-Tour count | T4 = | 1,739,406
|
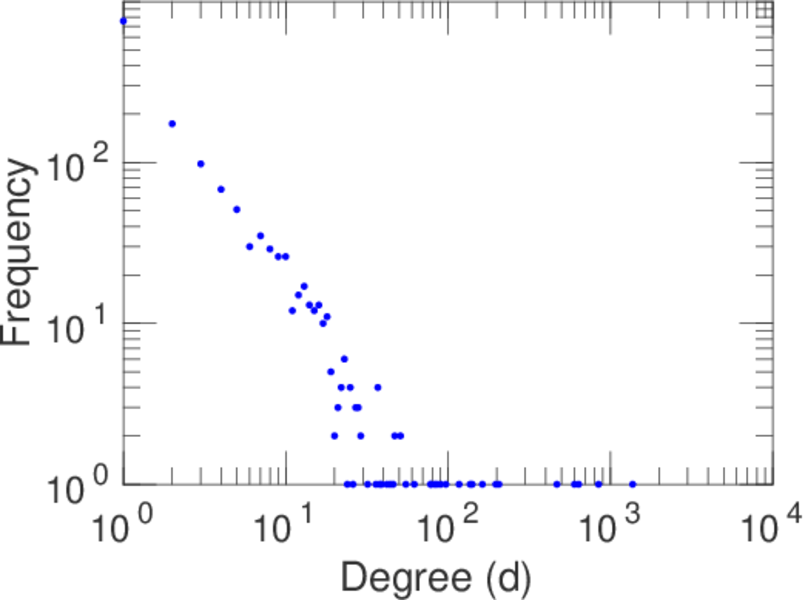
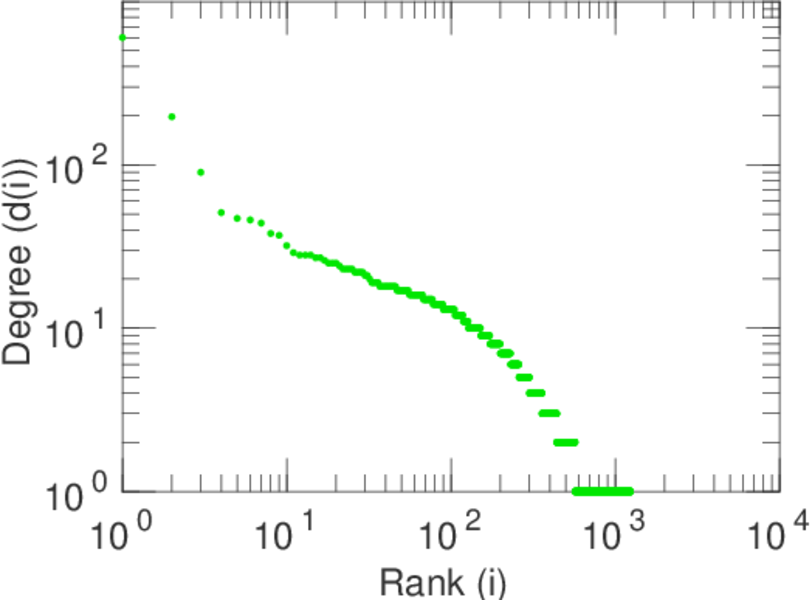
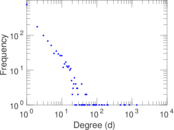
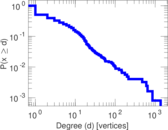
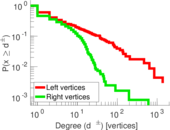
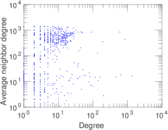
| Maximum degree | dmax = | 1,374
|
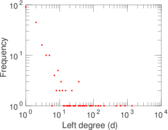
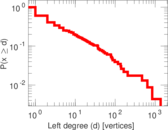
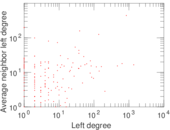
| Maximum left degree | d1max = | 1,374
|
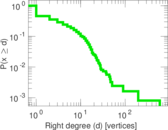
| Maximum right degree | d2max = | 602
|
| Average degree | d = | 7.708 72
|
| Average left degree | d1 = | 24.969 6
|
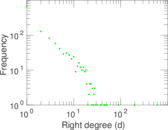
| Average right degree | d2 = | 4.557 94
|
| Fill | p = | 0.009 630 78
|
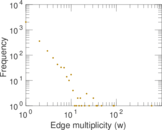
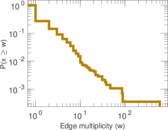
| Average edge multiplicity | m̃ = | 2.057 69
|
| Size of LCC | N = | 1,263
|
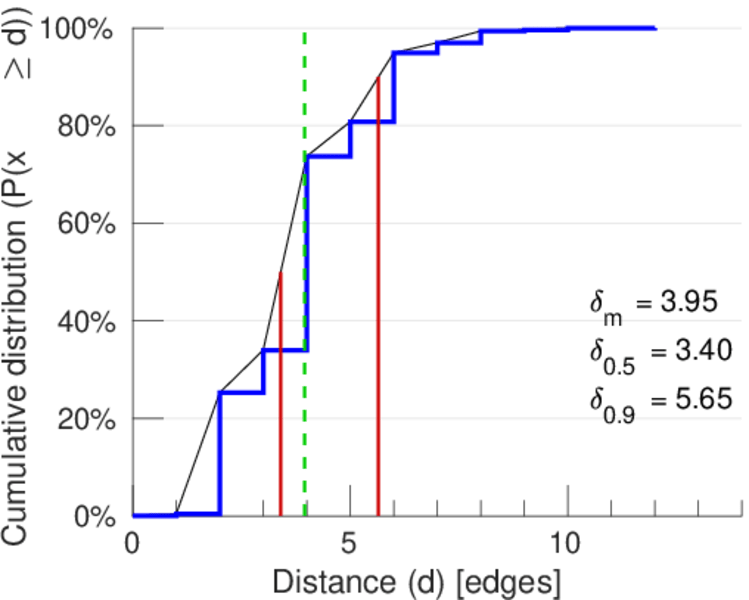
| Diameter | δ = | 13
|
| 50-Percentile effective diameter | δ0.5 = | 3.403 26
|
| 90-Percentile effective diameter | δ0.9 = | 5.652 44
|
| Median distance | δM = | 4
|
| Mean distance | δm = | 3.949 46
|
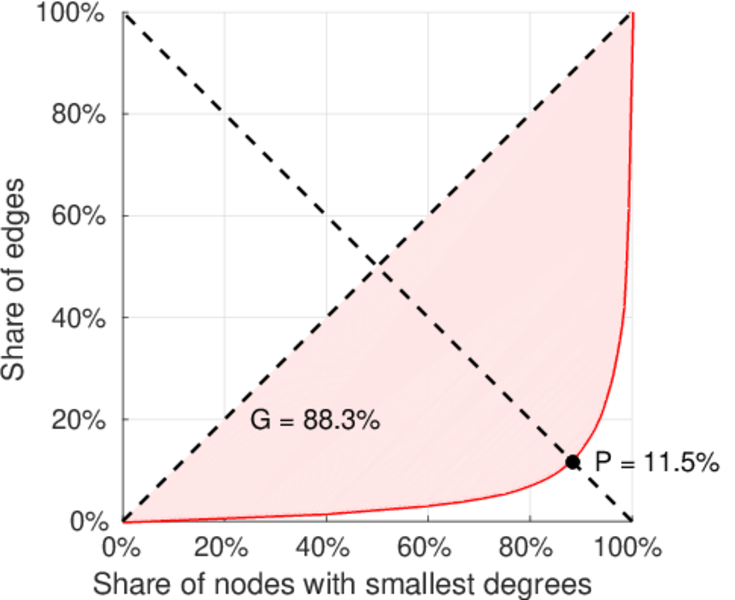
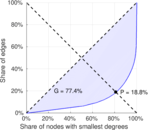
| Gini coefficient | G = | 0.787 361
|
| Balanced inequality ratio | P = | 0.183 963
|
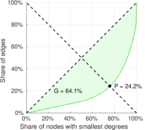
| Left balanced inequality ratio | P1 = | 0.114 748
|
| Right balanced inequality ratio | P2 = | 0.242 034
|
| Relative edge distribution entropy | Her = | 0.808 042
|
| Power law exponent | γ = | 2.761 60
|
| Tail power law exponent | γt = | 2.001 00
|
| Tail power law exponent with p | γ3 = | 2.001 00
|
| p-value | p = | 0.000 00
|
| Left tail power law exponent with p | γ3,1 = | 1.691 00
|
| Left p-value | p1 = | 0.355 000
|
| Right tail power law exponent with p | γ3,2 = | 8.301 00
|
| Right p-value | p2 = | 0.776 000
|
| Degree assortativity | ρ = | −0.223 480
|
| Degree assortativity p-value | pρ = | 6.290 15 × 10−33
|
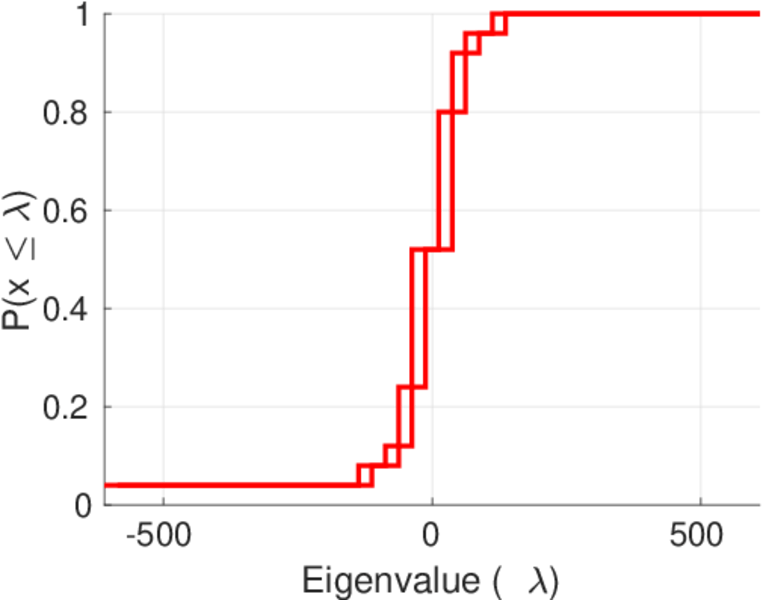
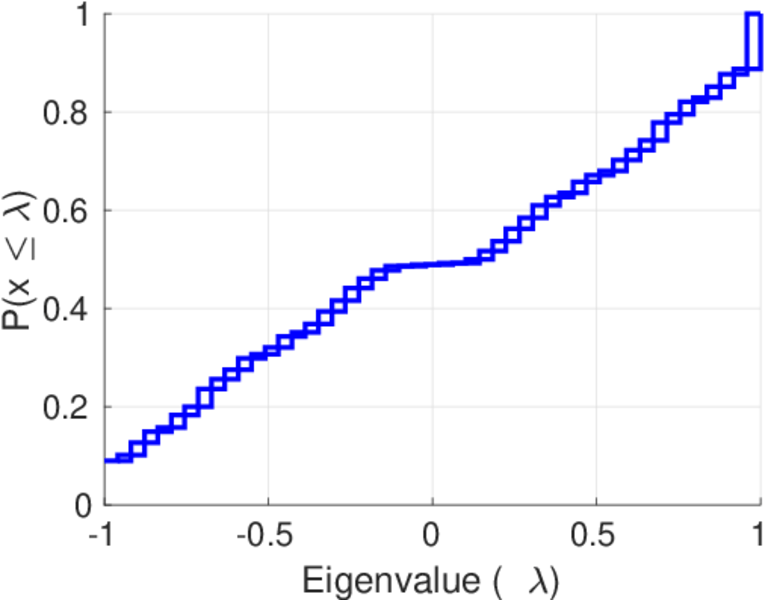
| Spectral norm | α = | 609.609
|
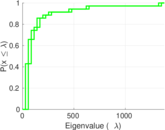
| Algebraic connectivity | a = | 0.033 716 0
|
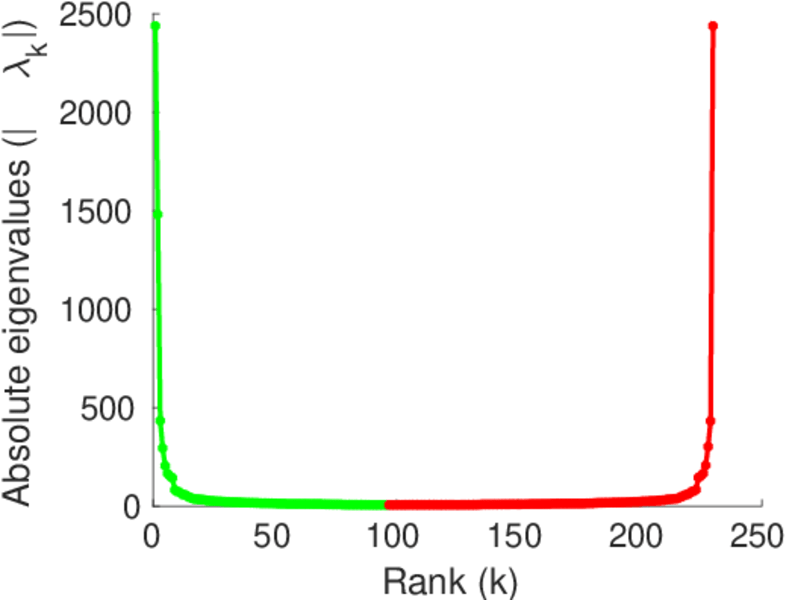
| Spectral separation | |λ1[A] / λ2[A]| = | 5.391 08
|
| Controllability | C = | 1,025
|
| Relative controllability | Cr = | 0.699 659
|
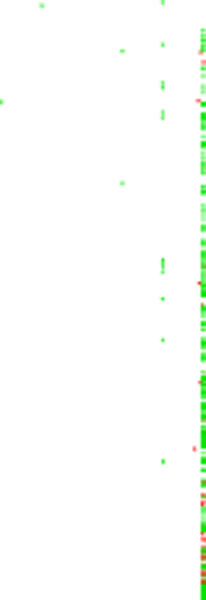
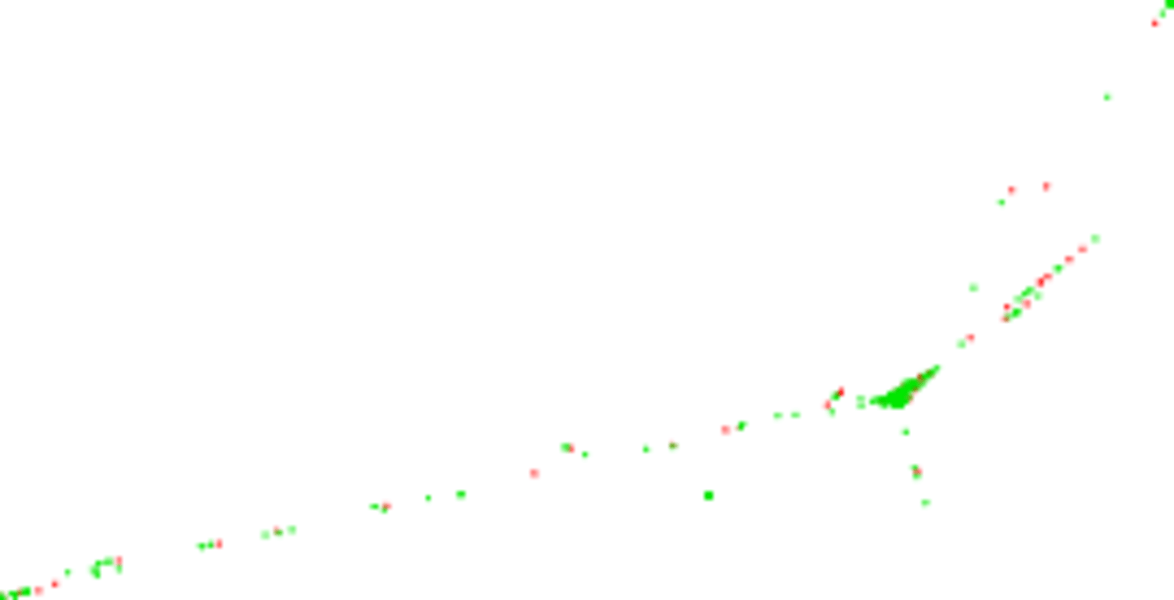
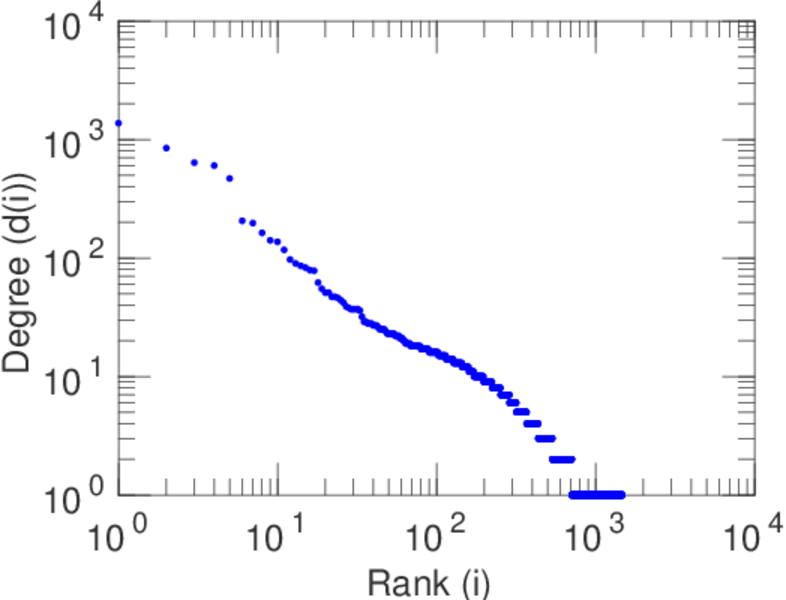
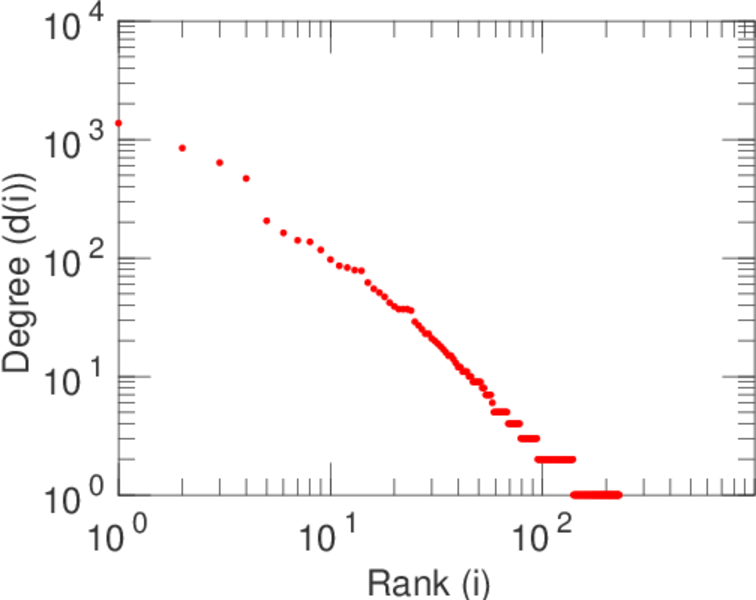
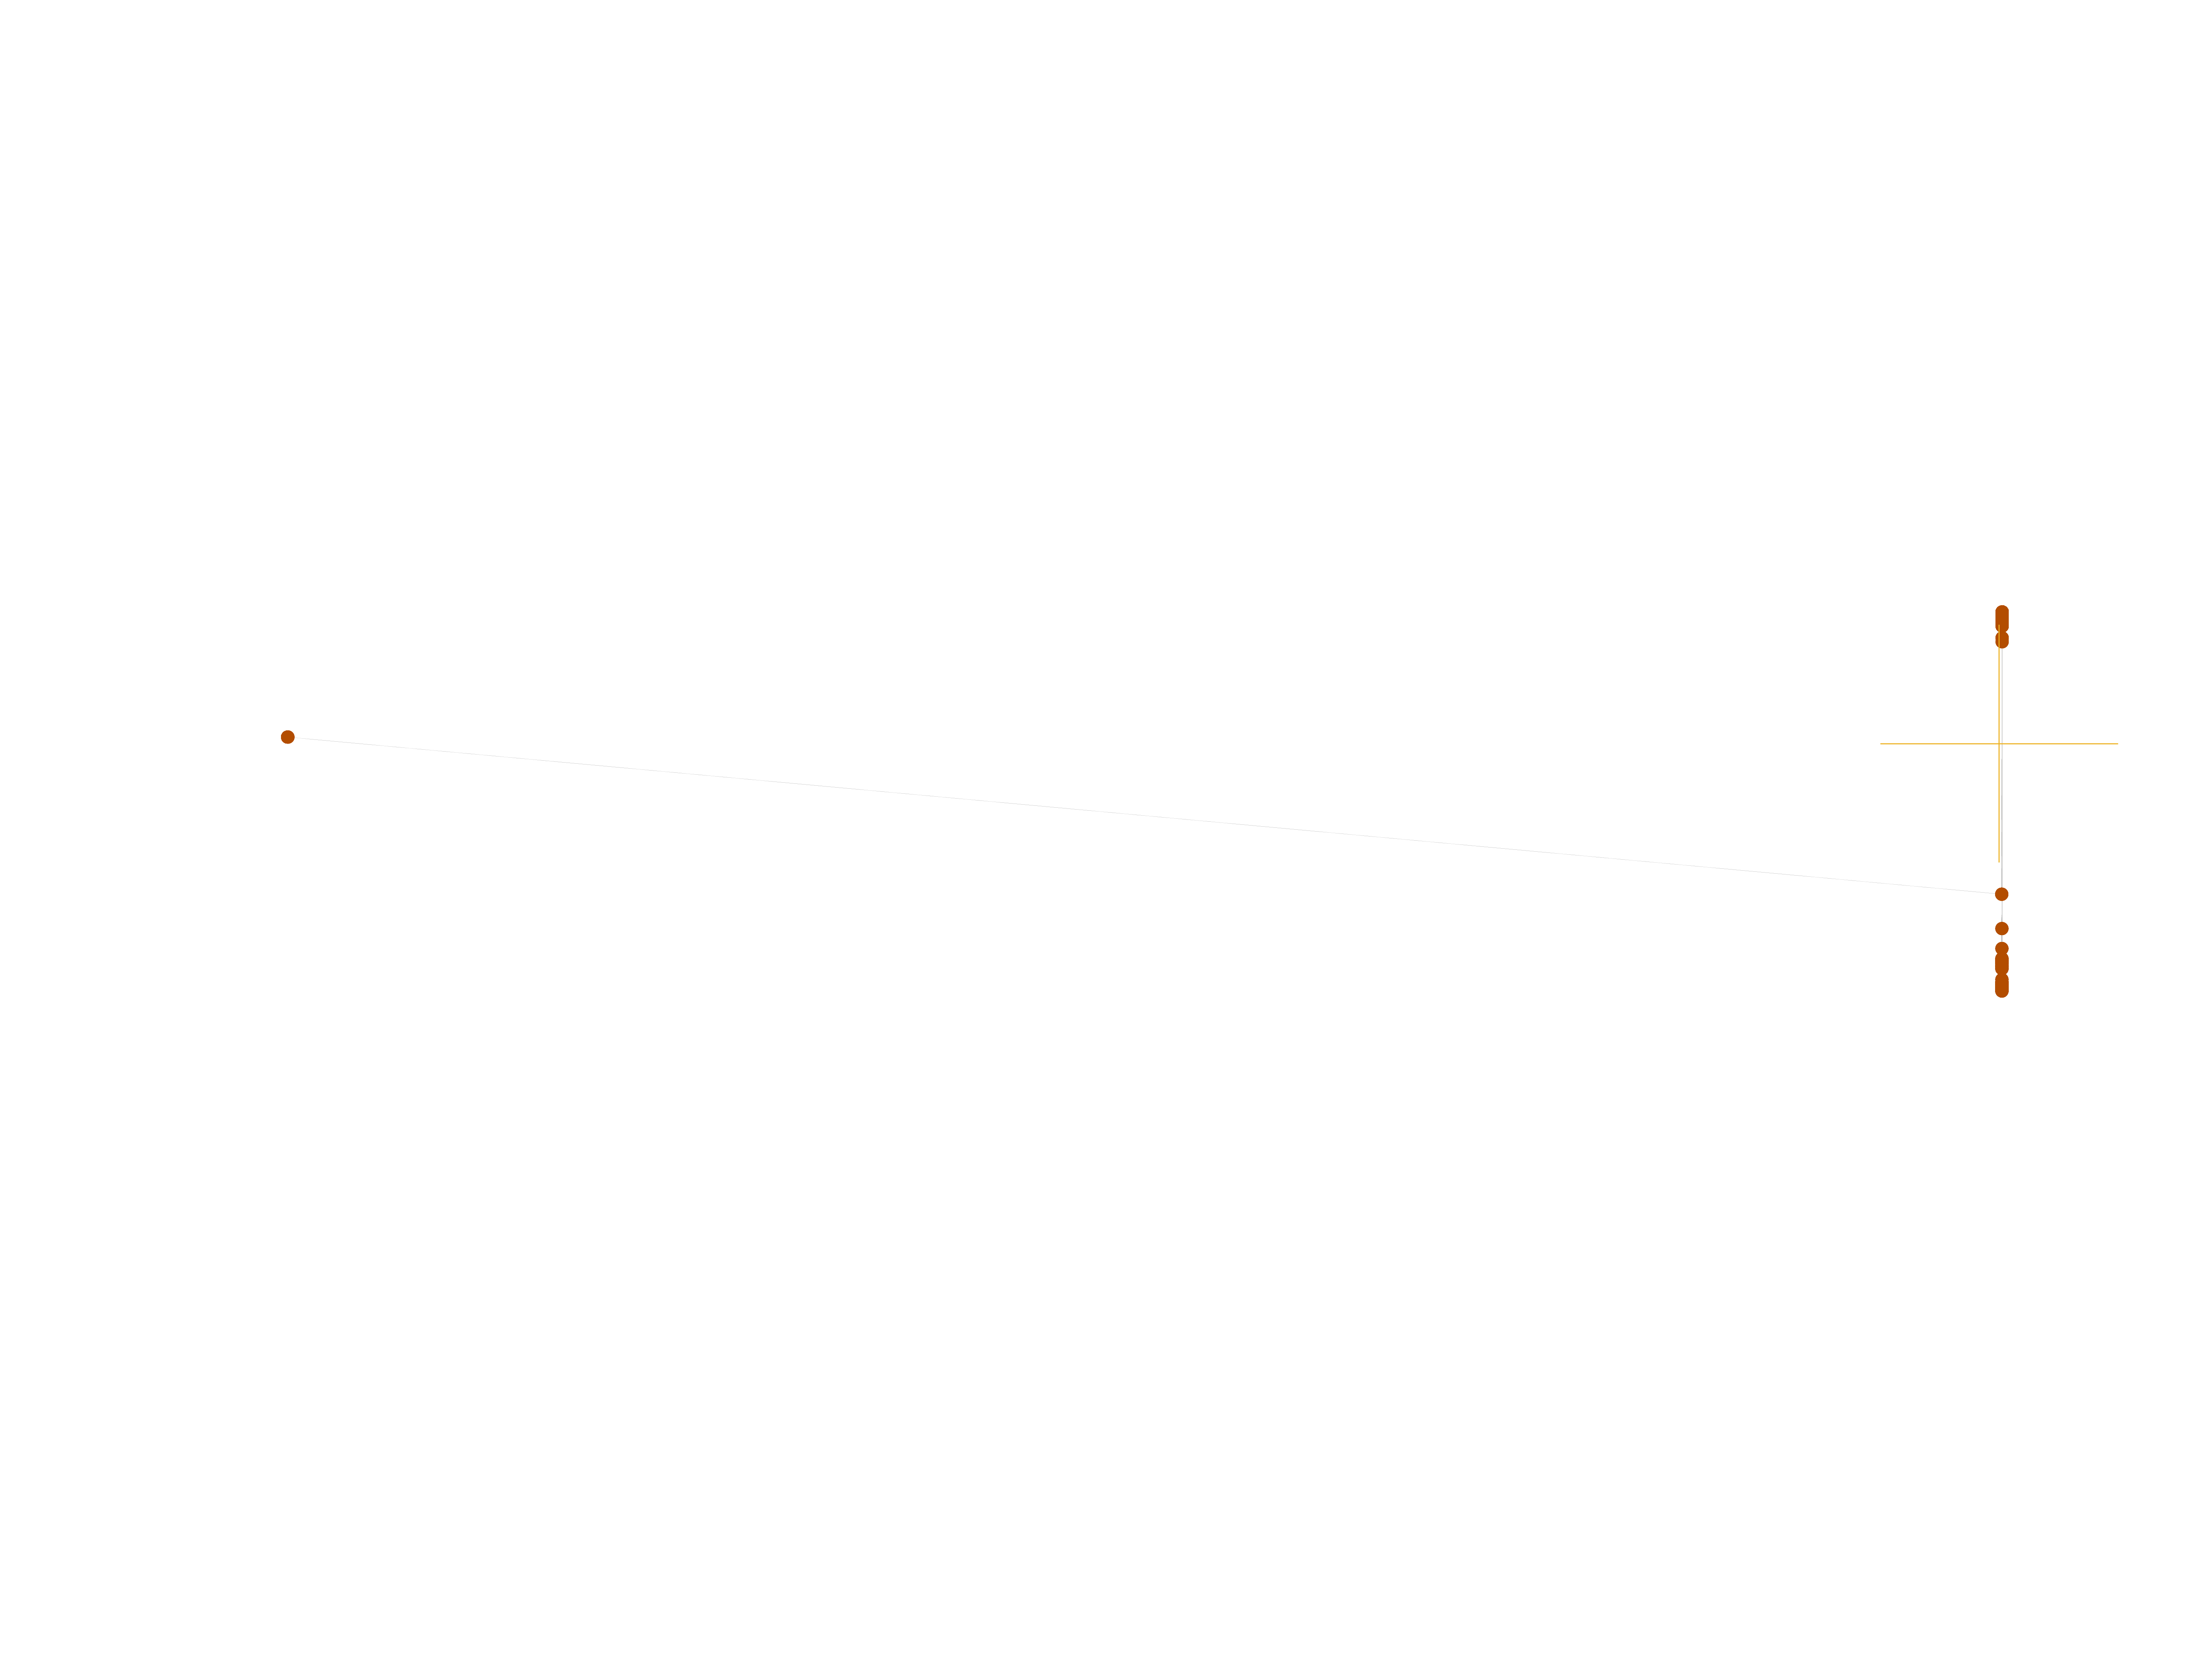
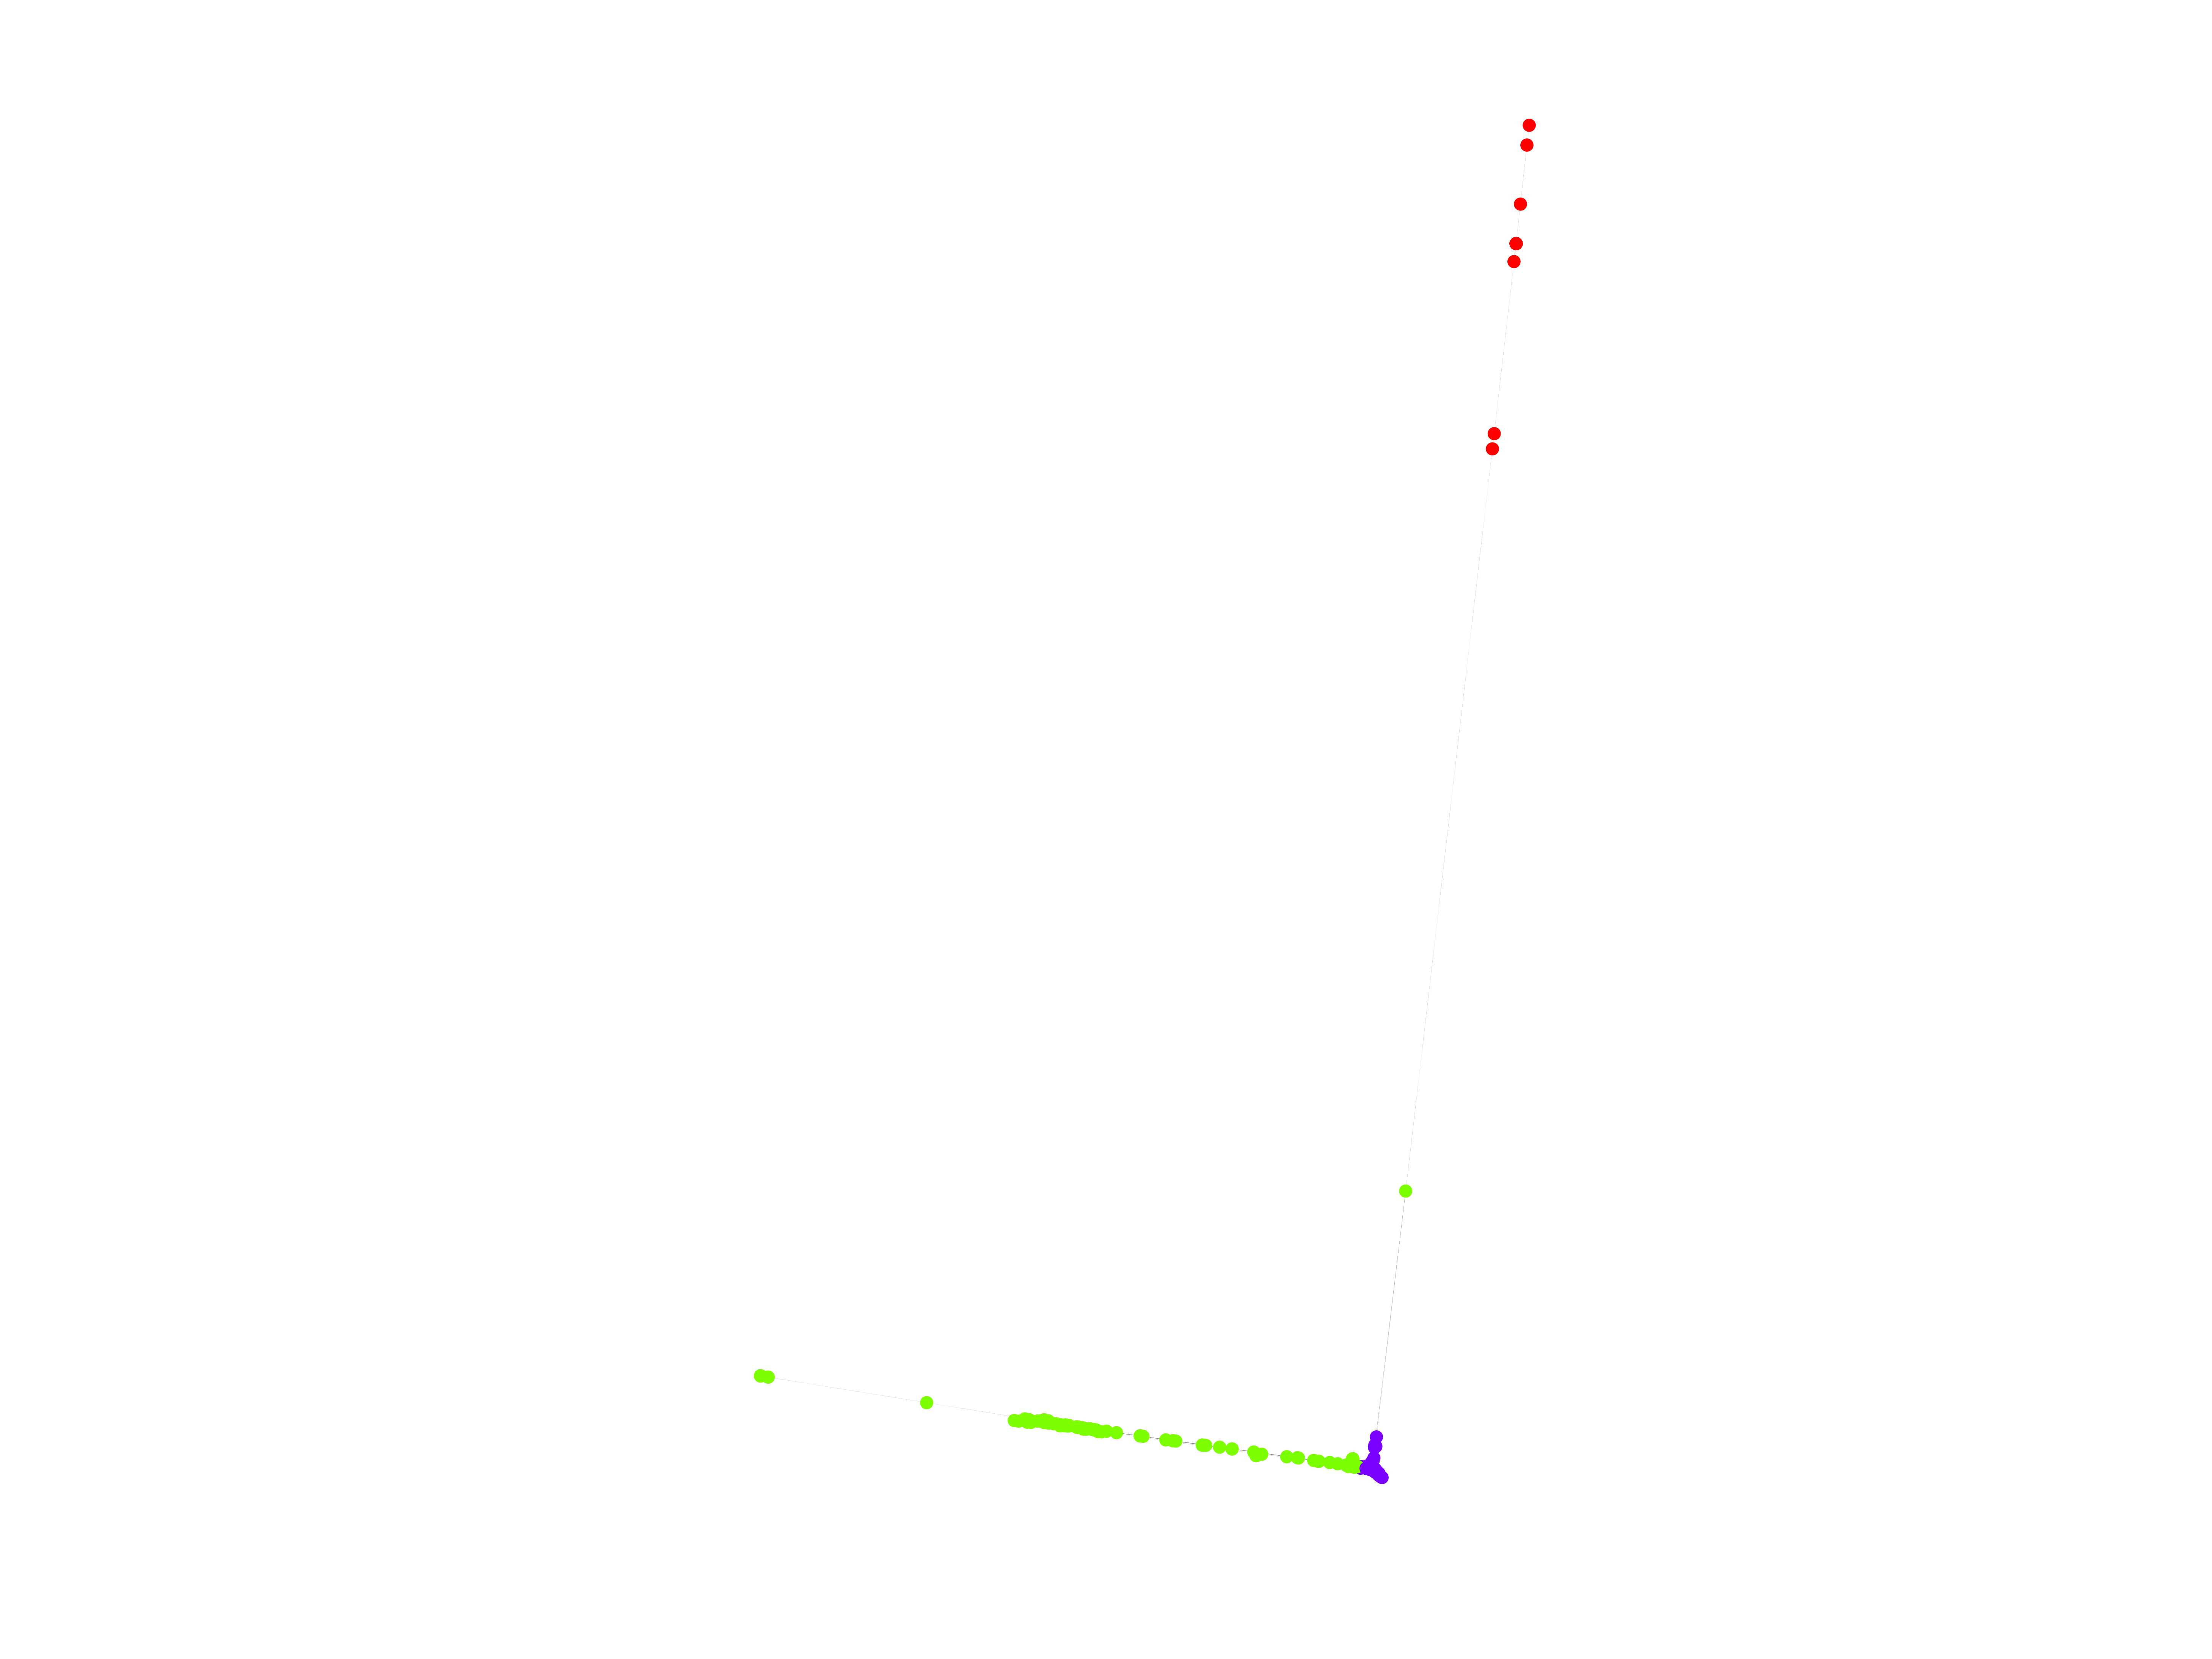
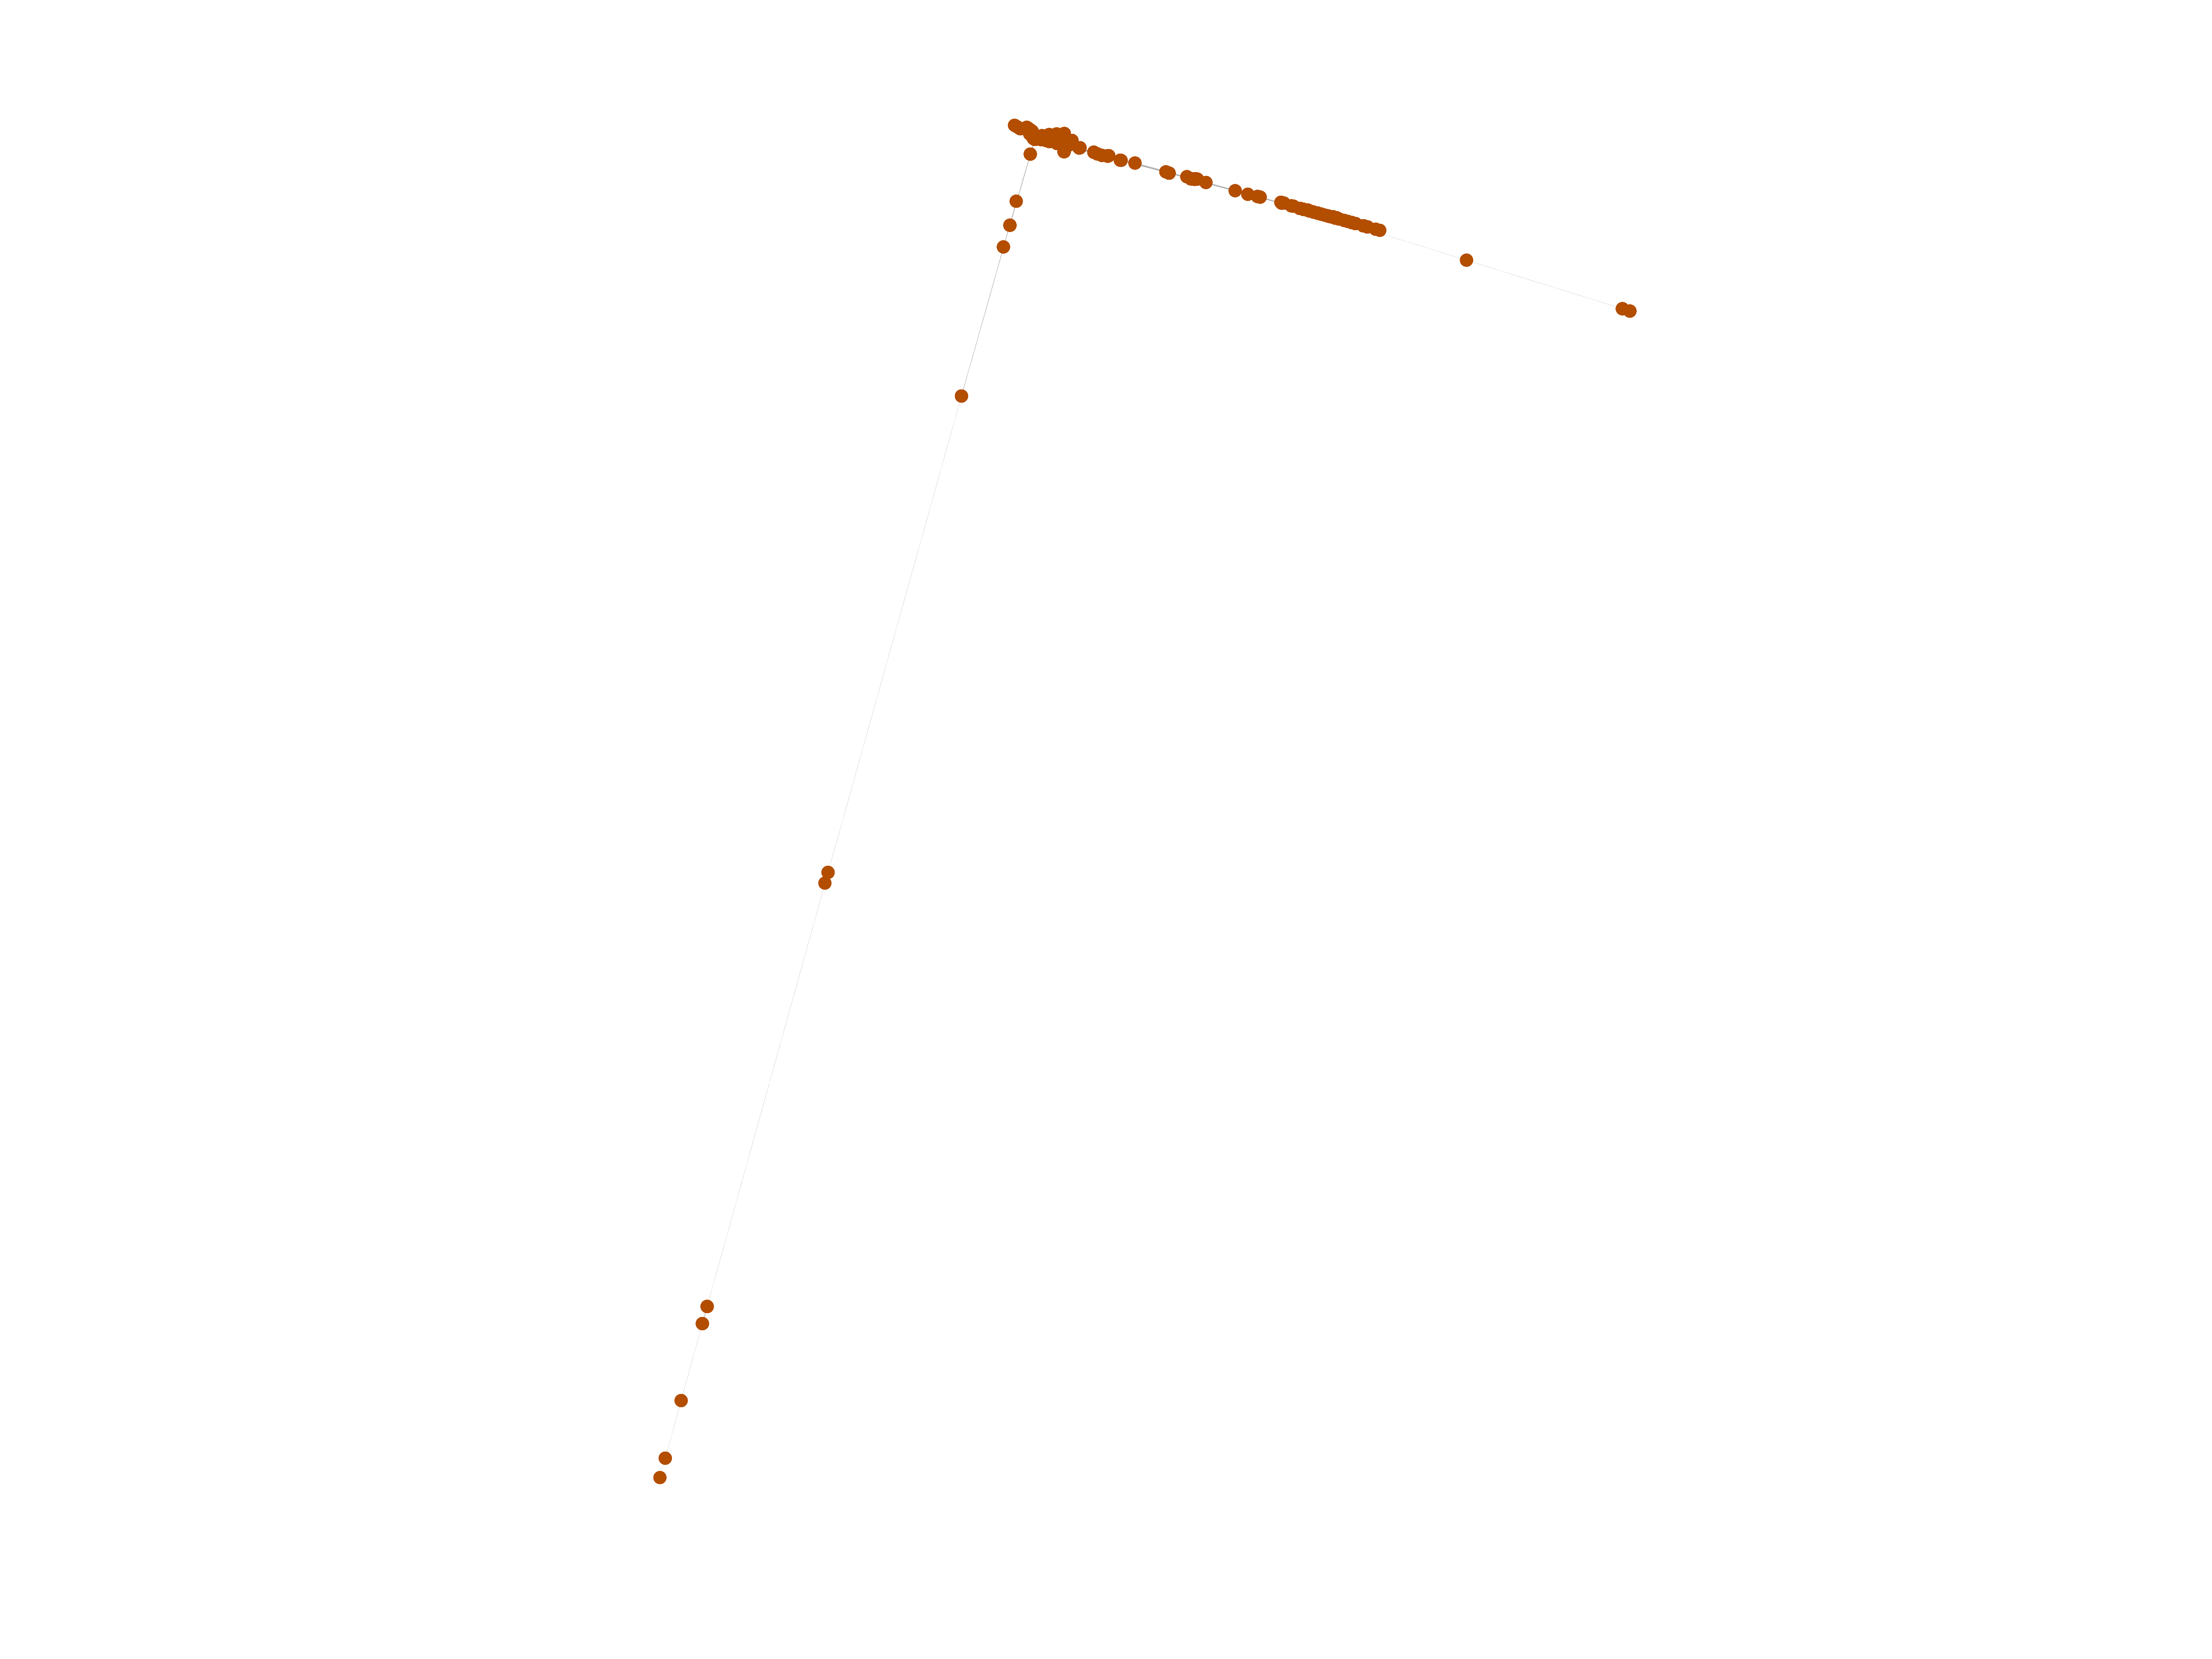
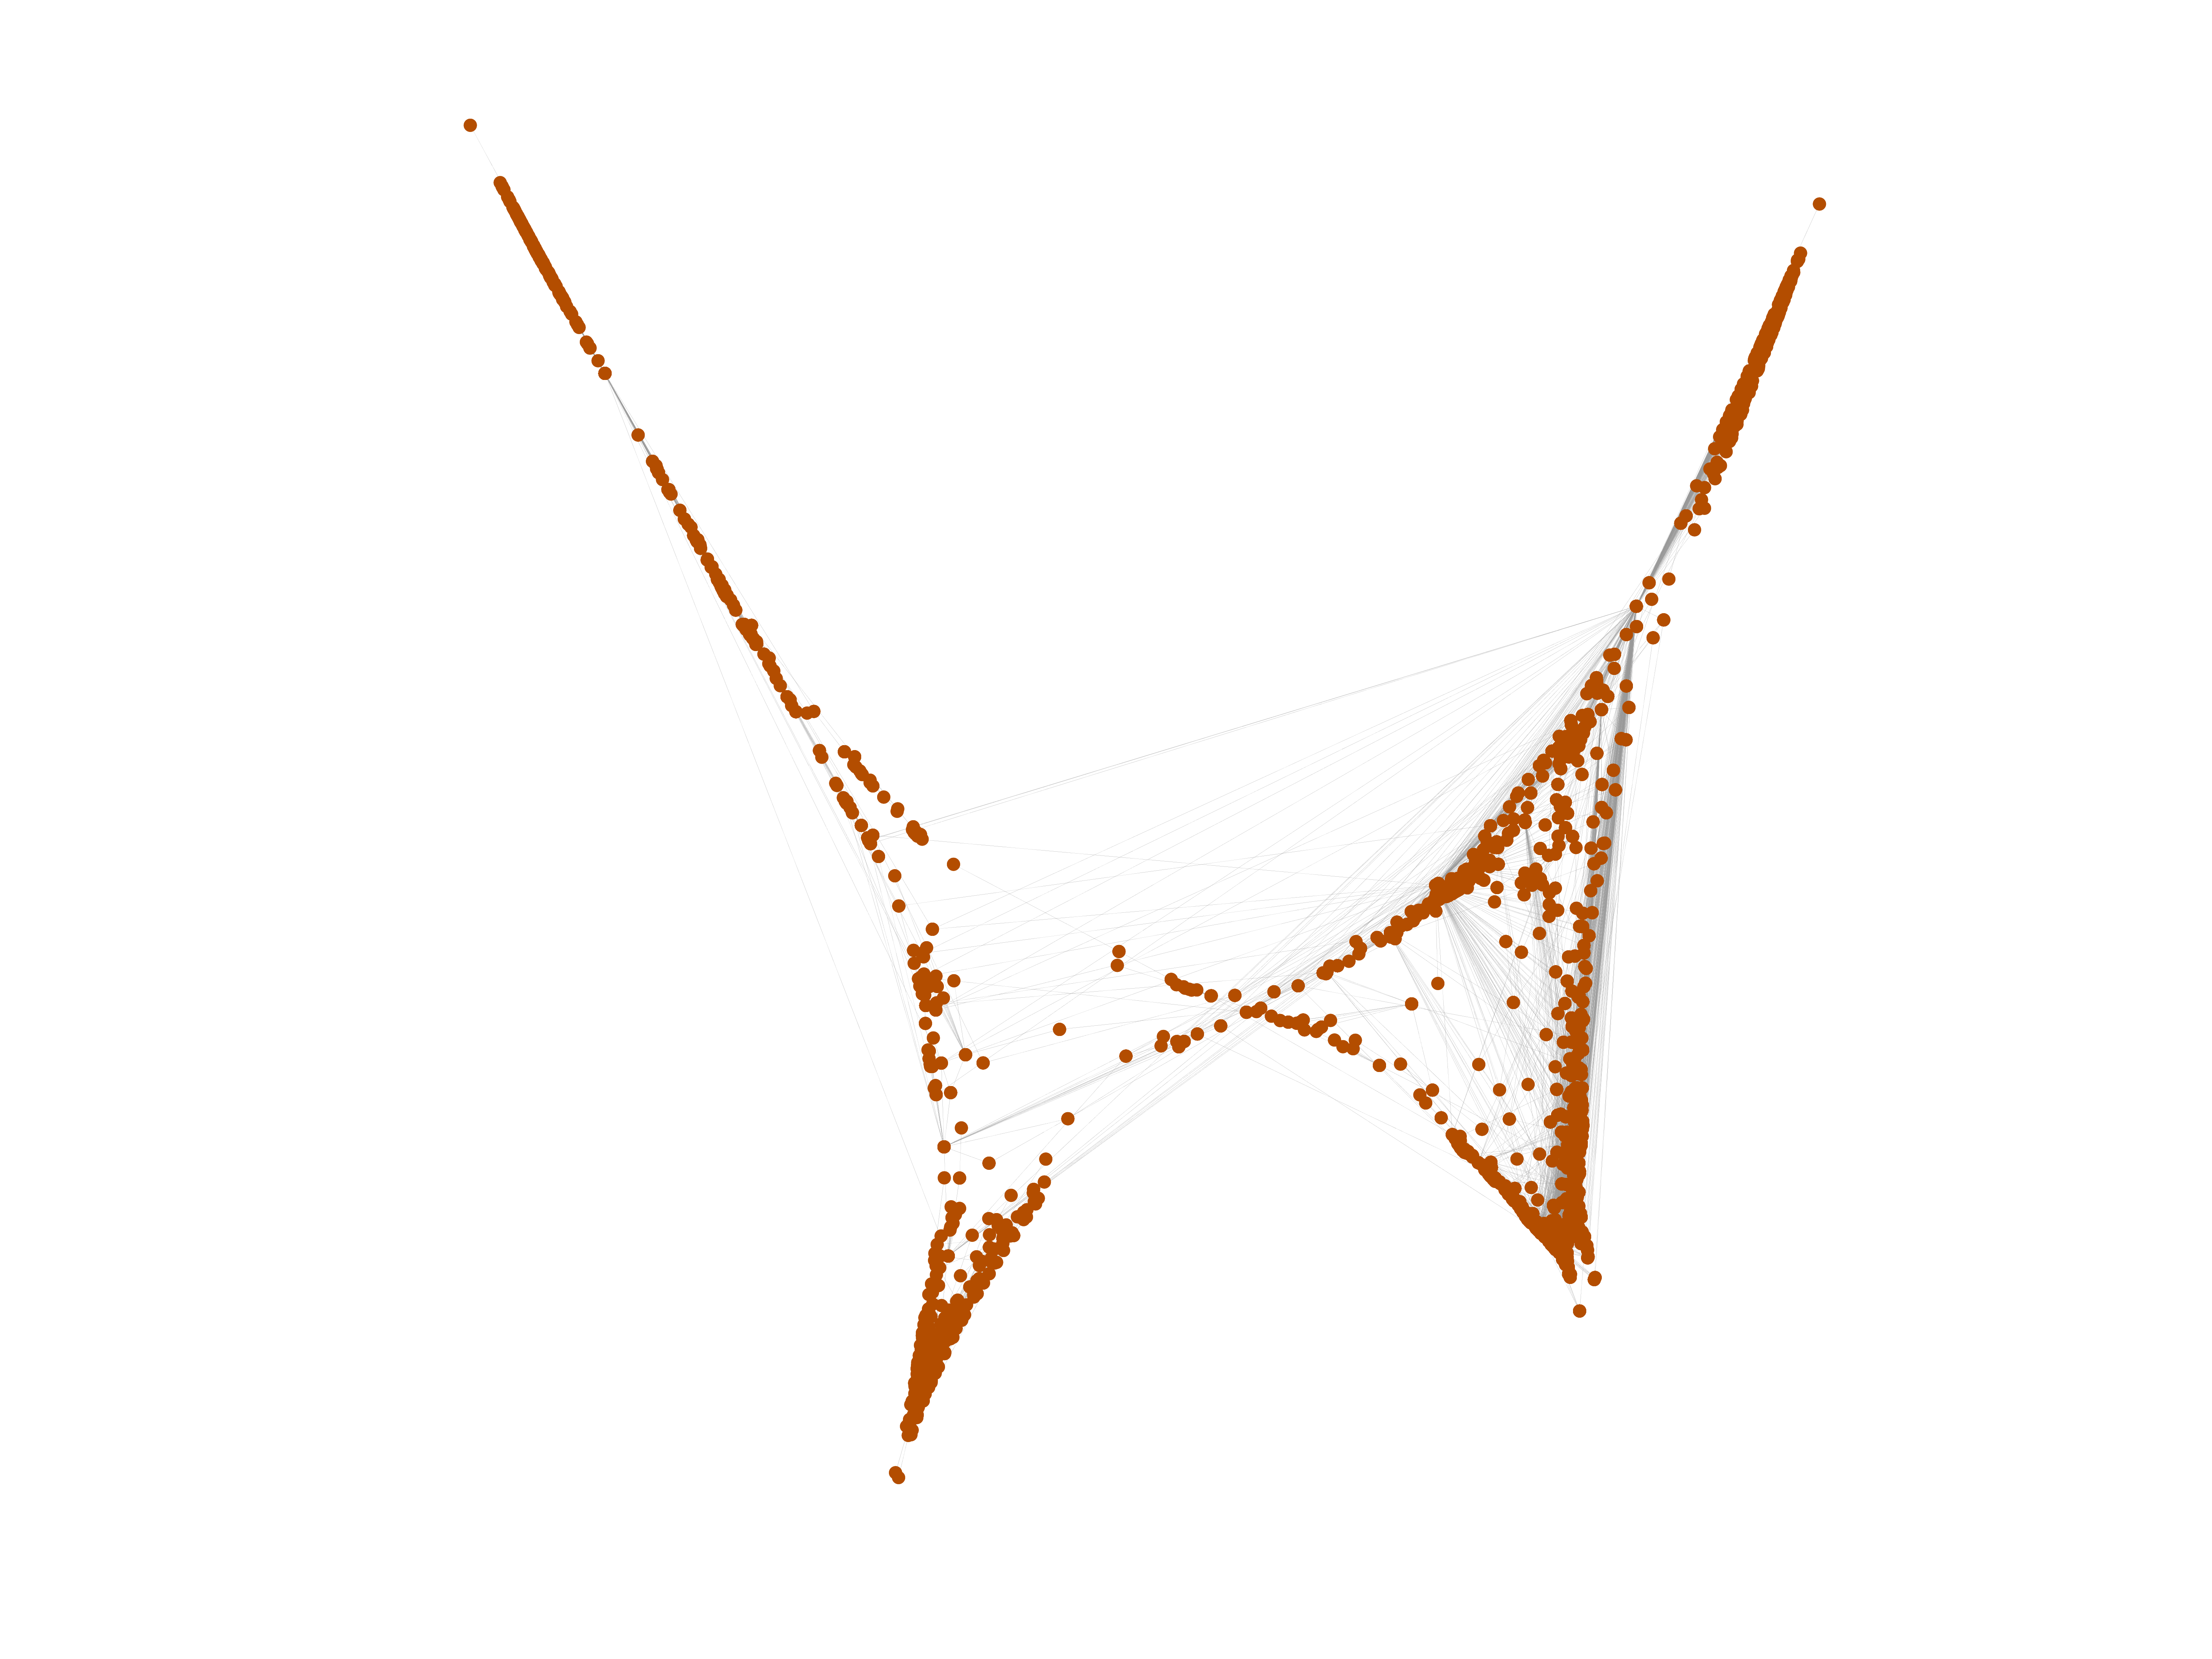
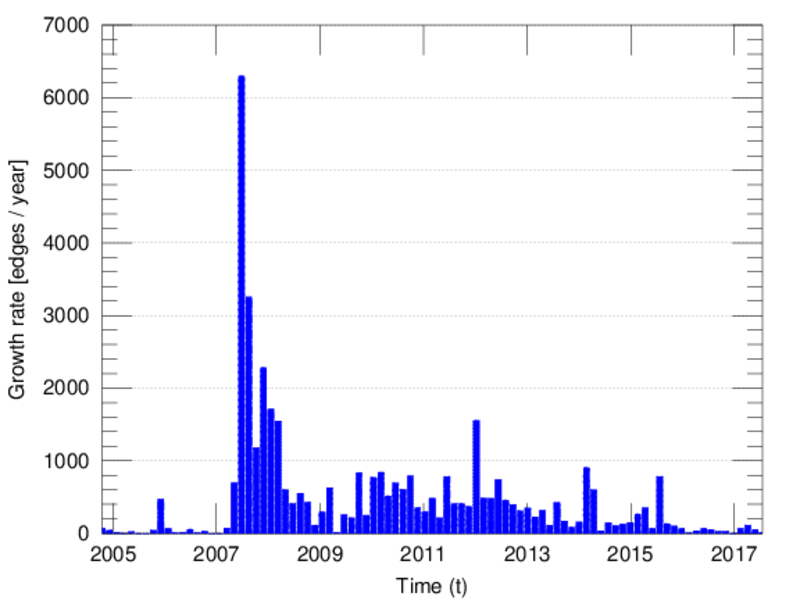
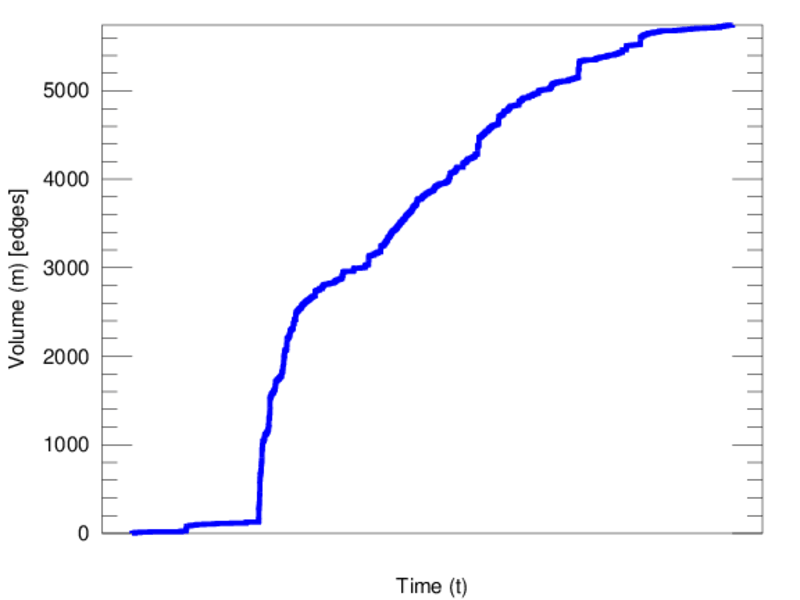
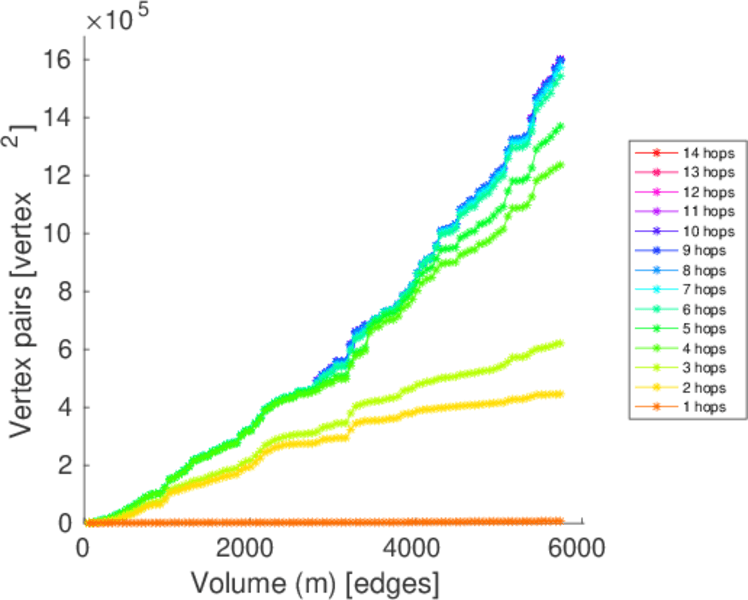
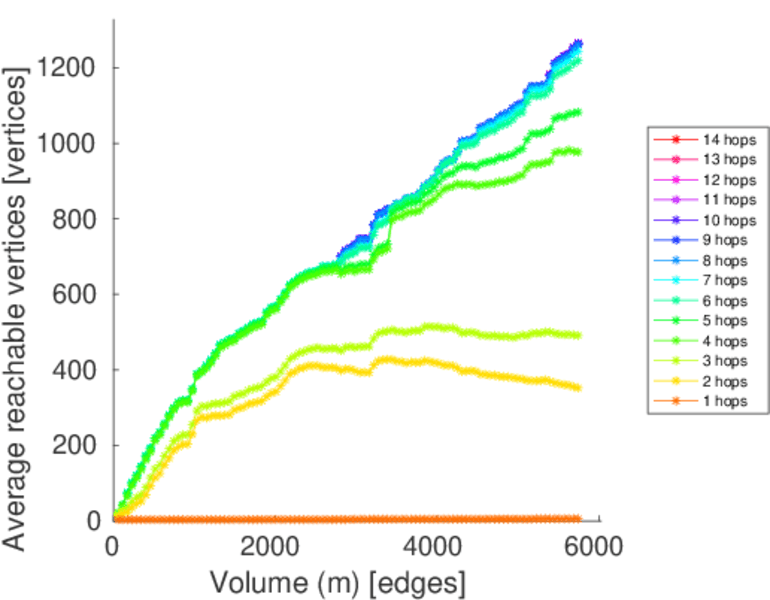
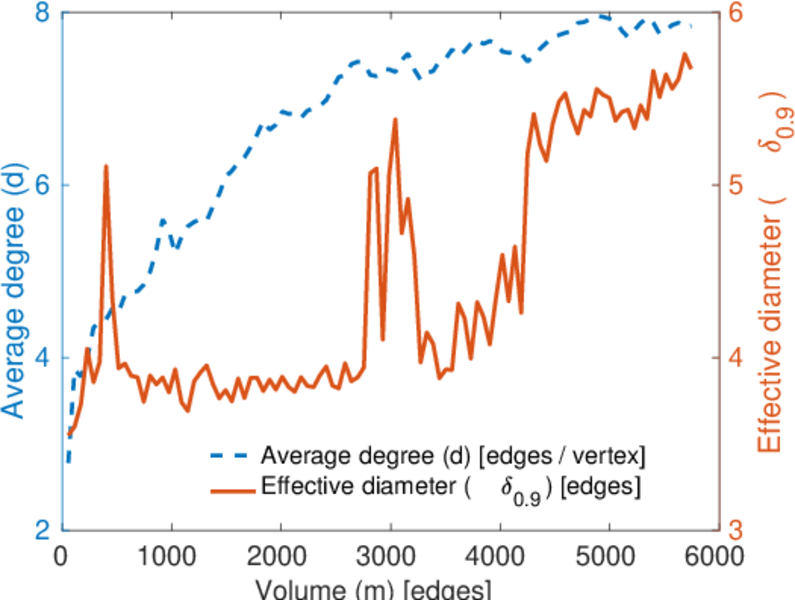
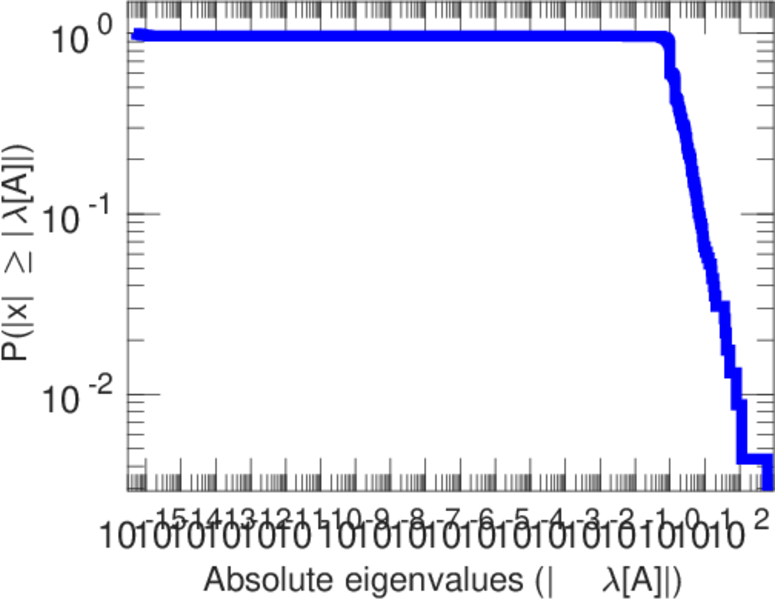
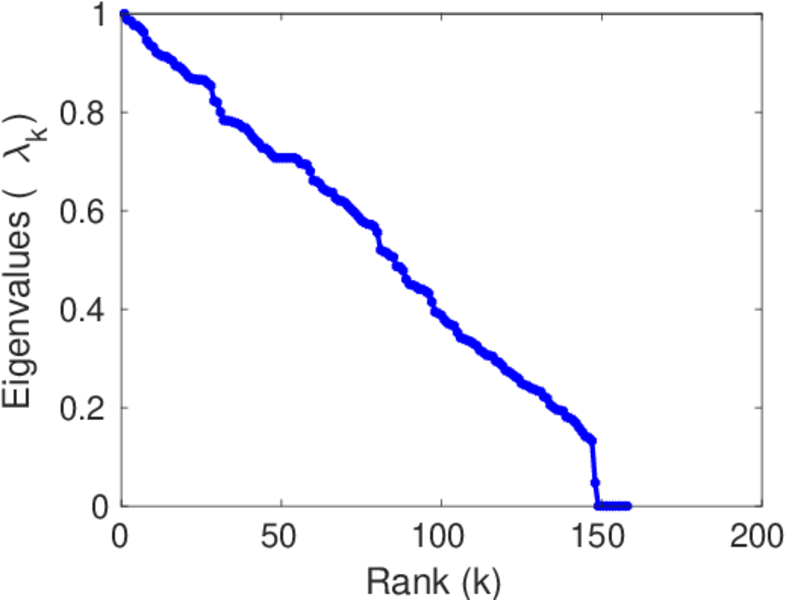
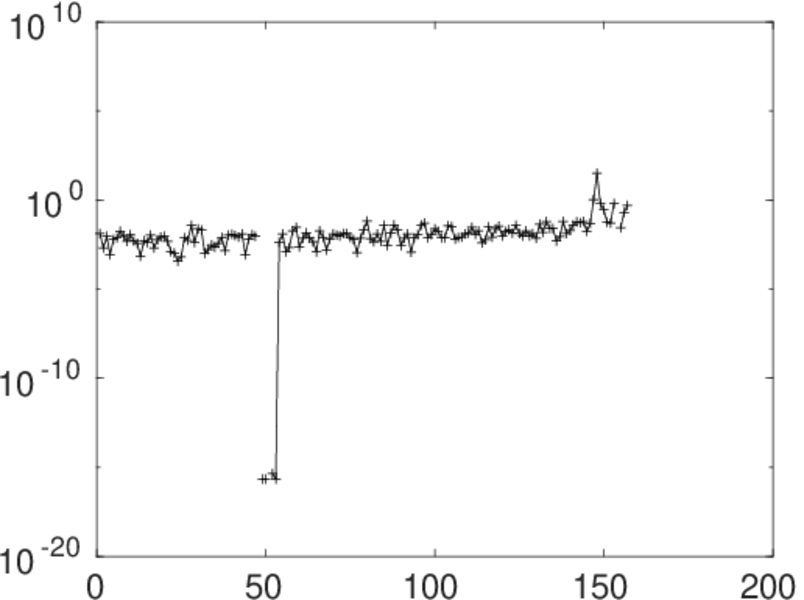
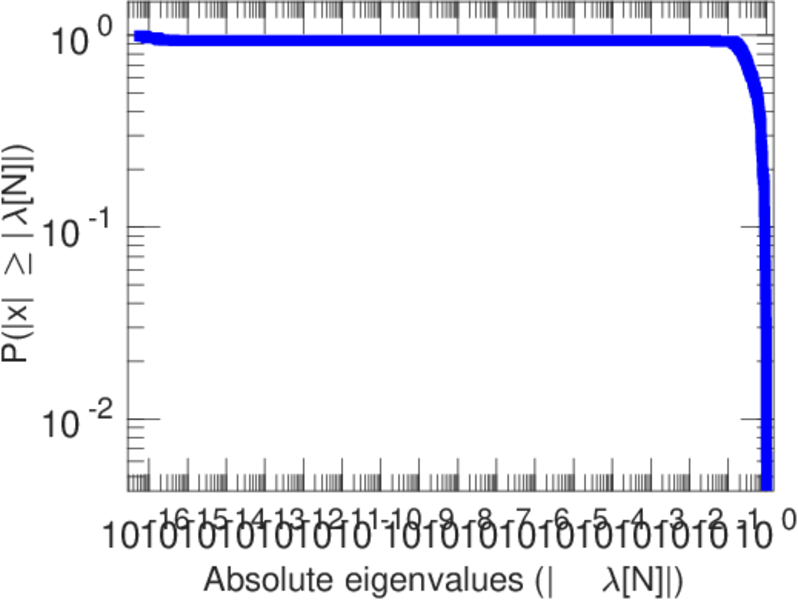
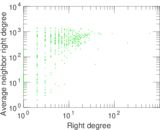
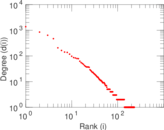
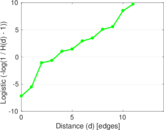
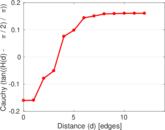
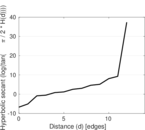
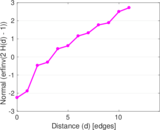
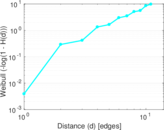
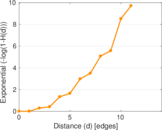
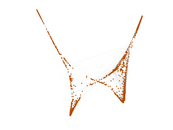
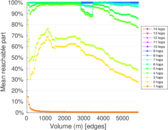
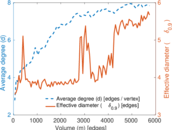
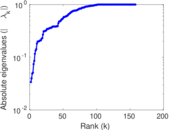
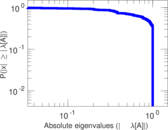
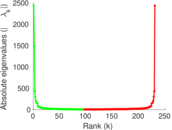
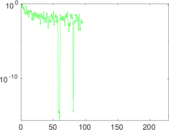
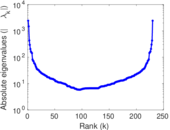
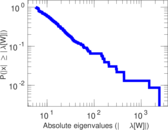
Plots


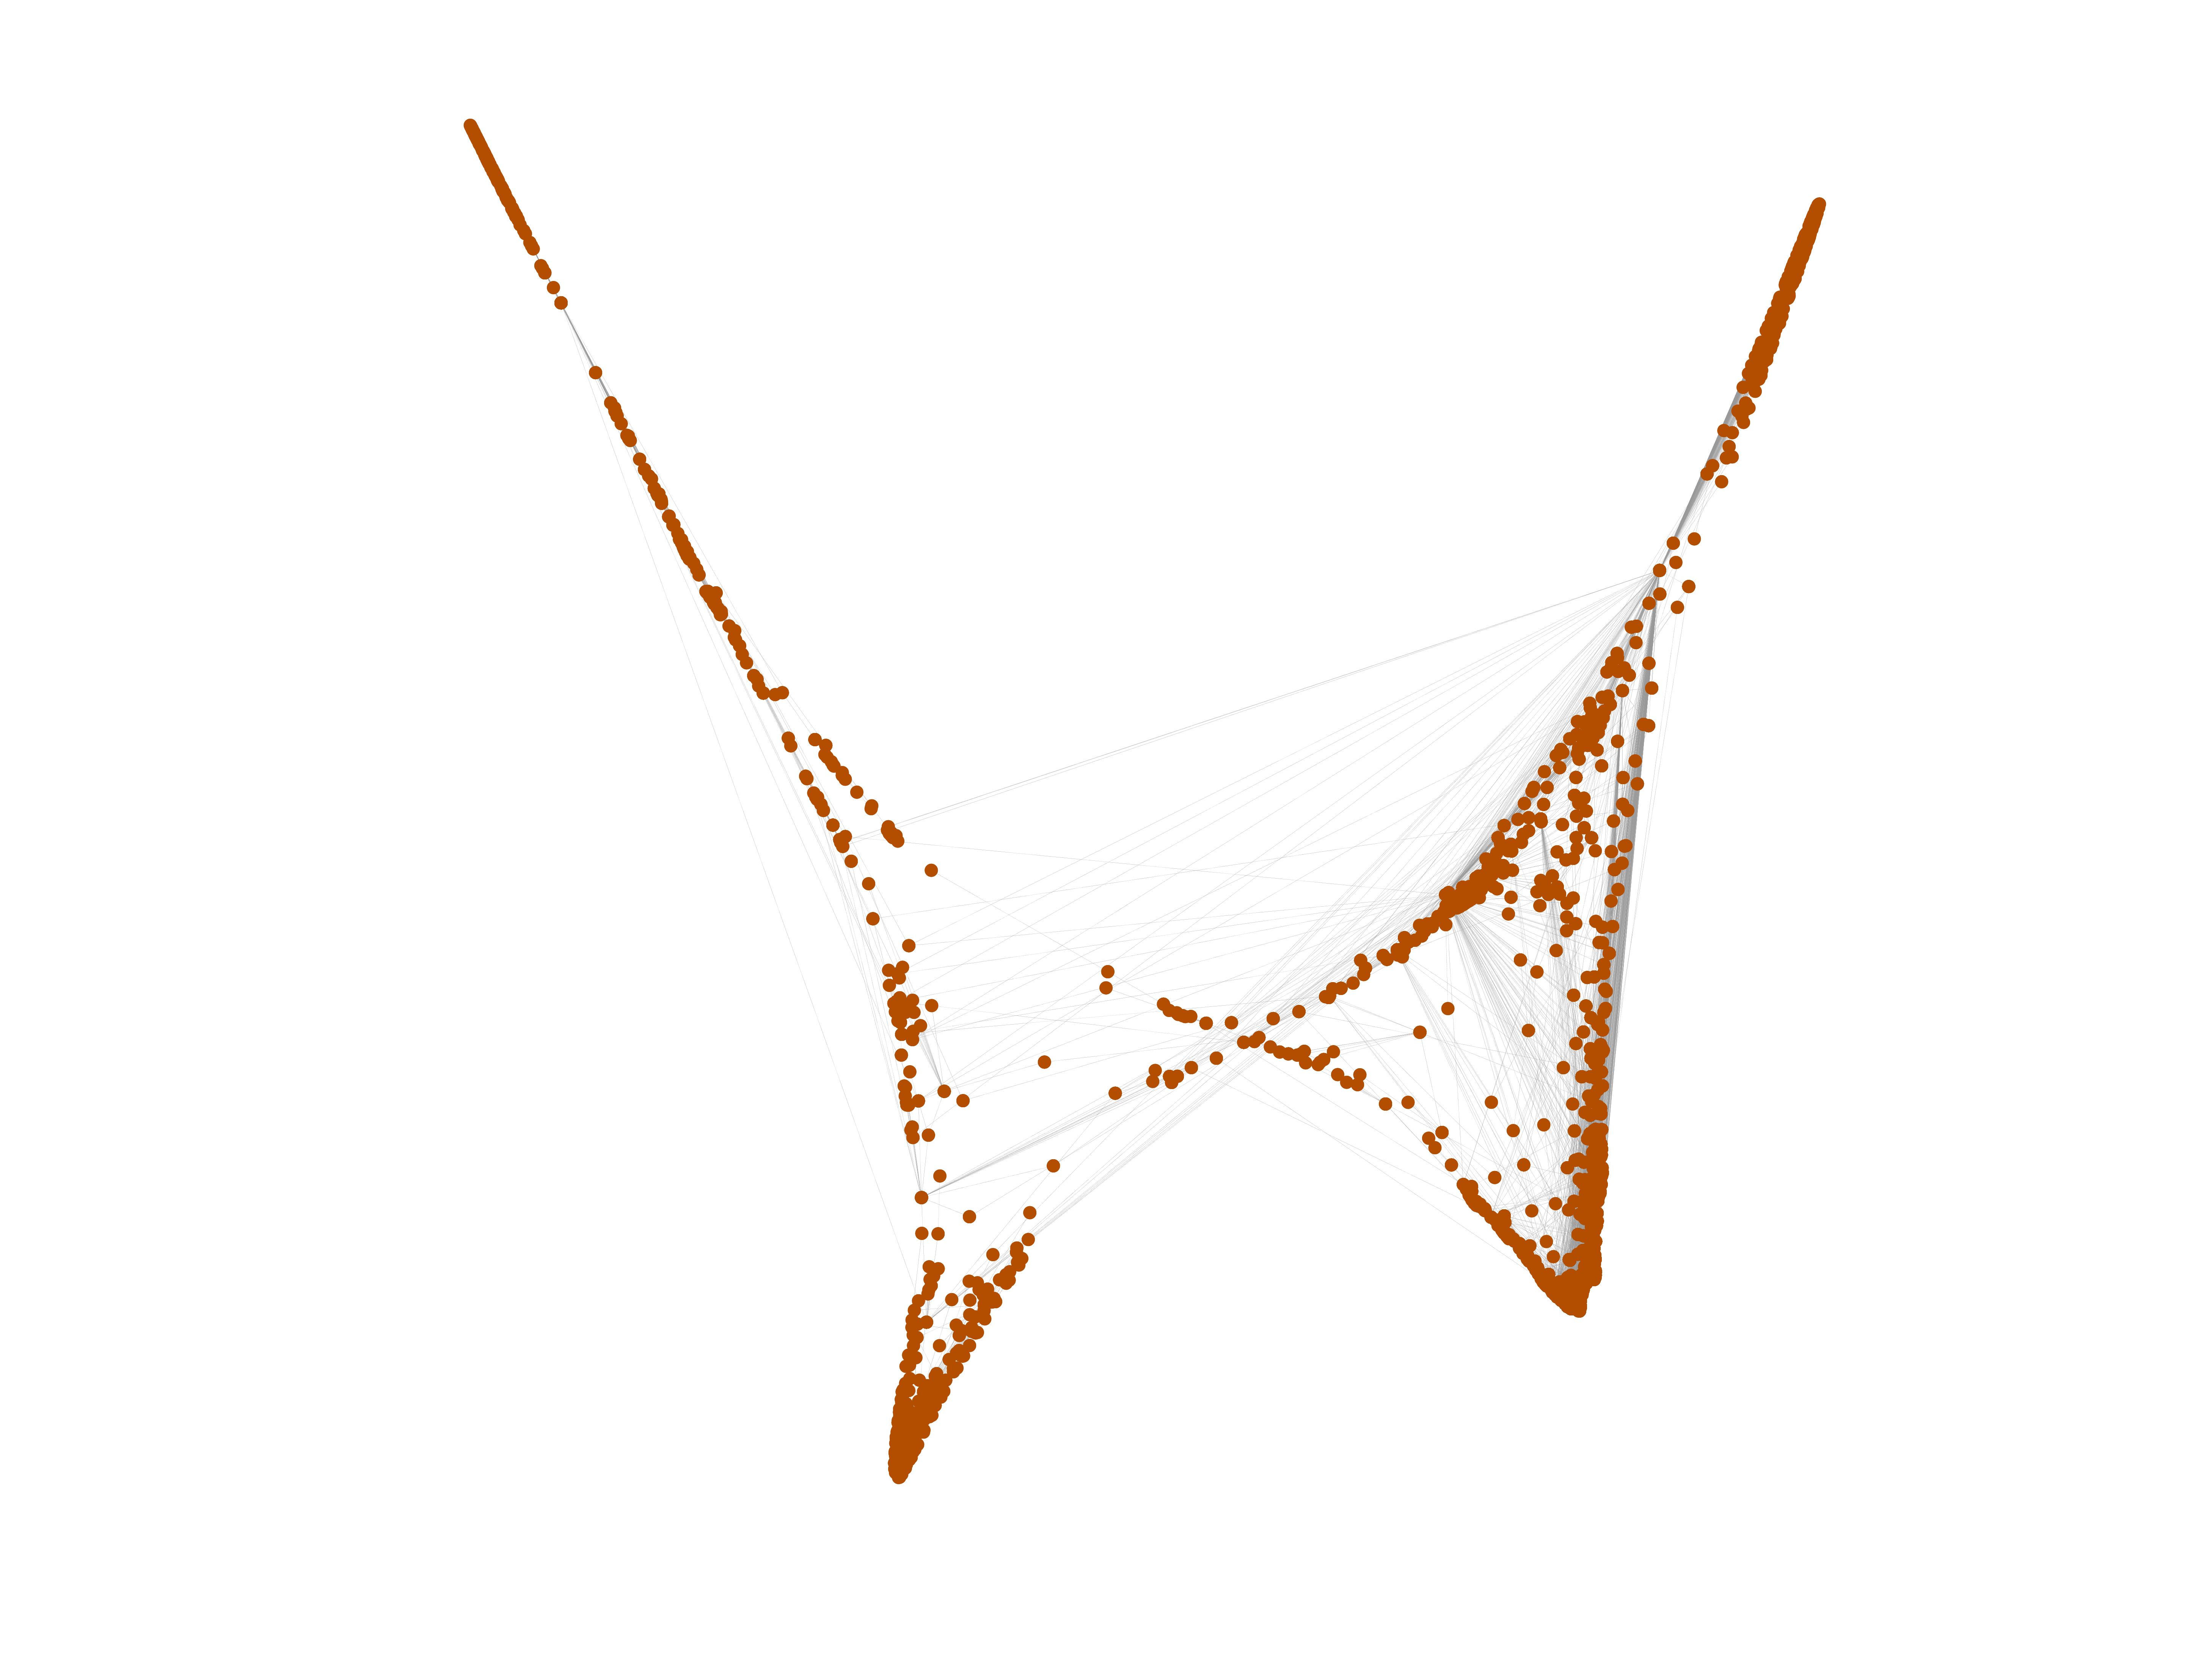
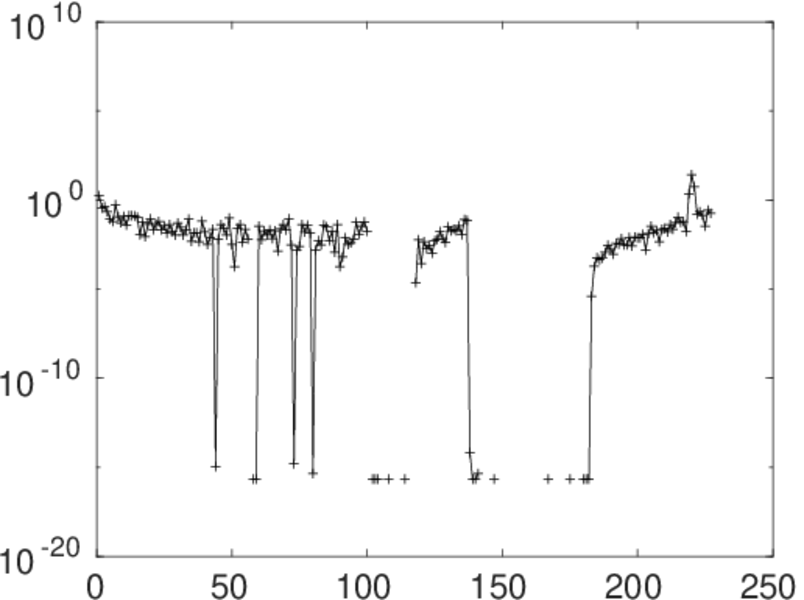
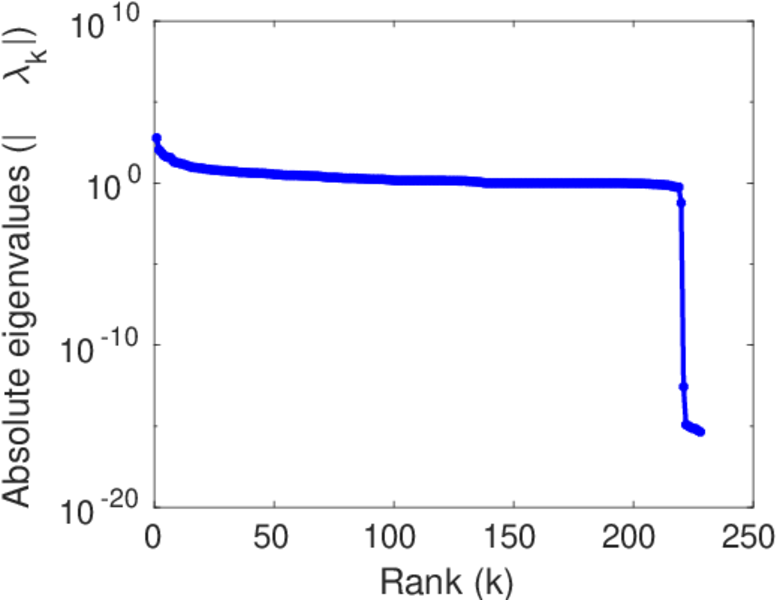
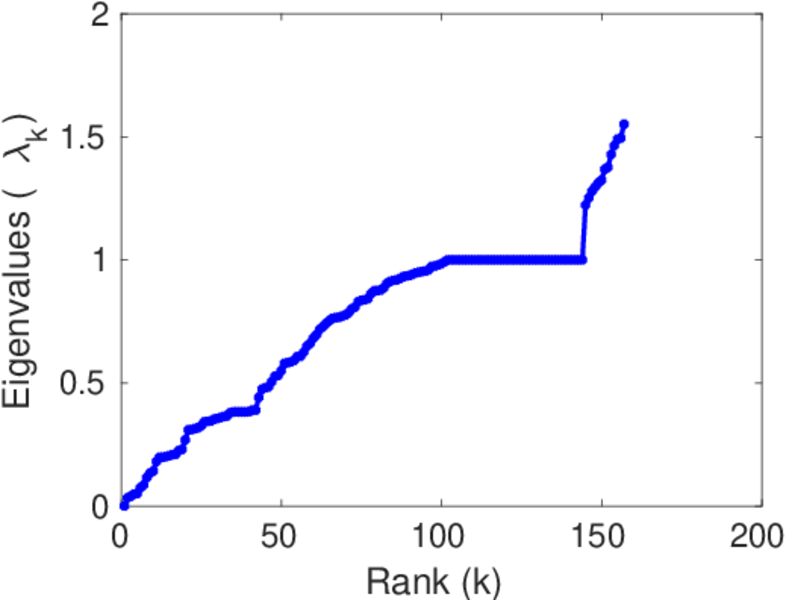
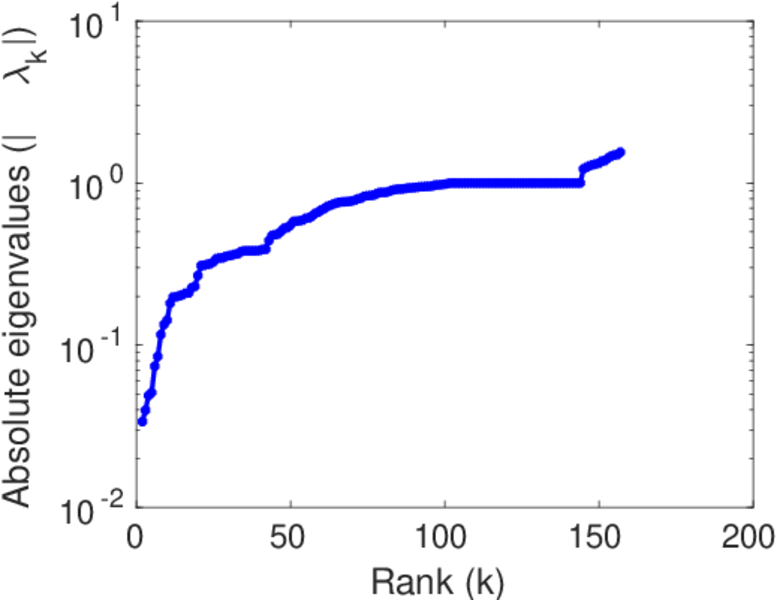
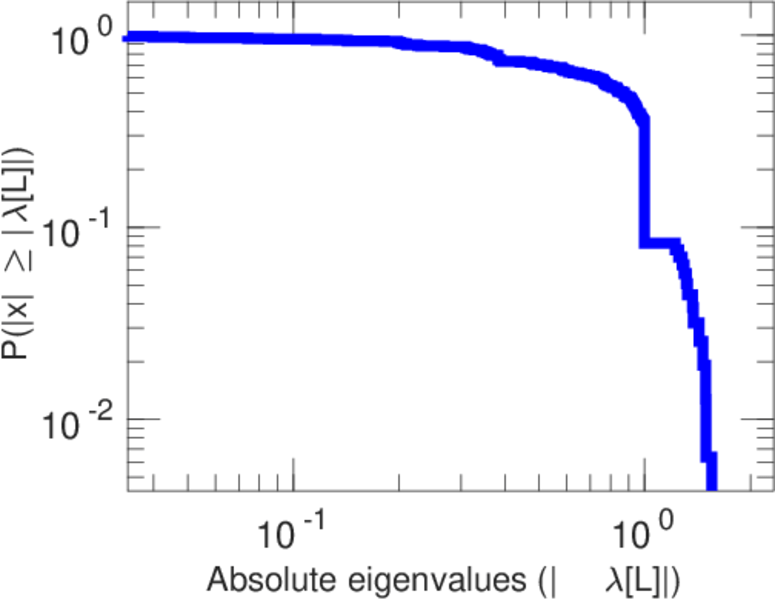
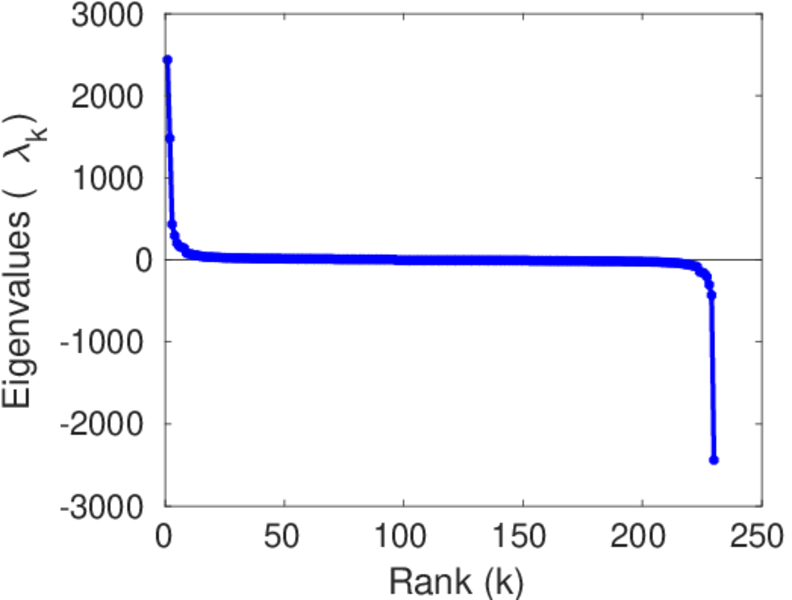
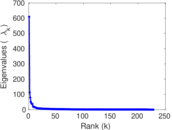
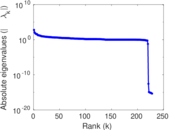
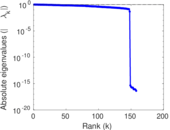
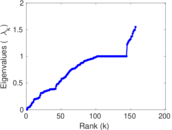
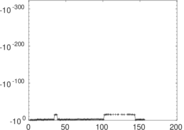
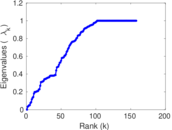
Matrix decompositions plots


Downloads
References
|
[1]
|
Jérôme Kunegis.
KONECT – The Koblenz Network Collection.
In Proc. Int. Conf. on World Wide Web Companion, pages
1343–1350, 2013.
[ http ]
|
|
[2]
|
Wikimedia Foundation.
Wikimedia downloads.
http://dumps.wikimedia.org/, January 2010.
|
 KONECT ‣ Networks ‣
Buy Me a Coffee
KONECT ‣ Networks ‣
Buy Me a Coffee