Wikipedia edits (it)
This is the bipartite edit network of the Italian Wikipedia. It contains users
and pages from the Italian Wikipedia, connected by edit events. Each edge
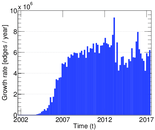
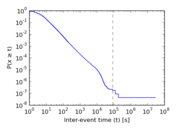
represents an edit. The dataset includes the timestamp of each edit.
Metadata
Statistics
| Size | n = | 5,200,968
|
| Left size | n1 = | 343,860
|
| Right size | n2 = | 4,857,108
|
| Volume | m = | 67,613,396
|
| Unique edge count | m̿ = | 31,924,654
|
| Wedge count | s = | 2,982,739,101,286
|
| Claw count | z = | 22,557,694,419,732,084
|
| Cross count | x = | 1.546 68 × 1021
|
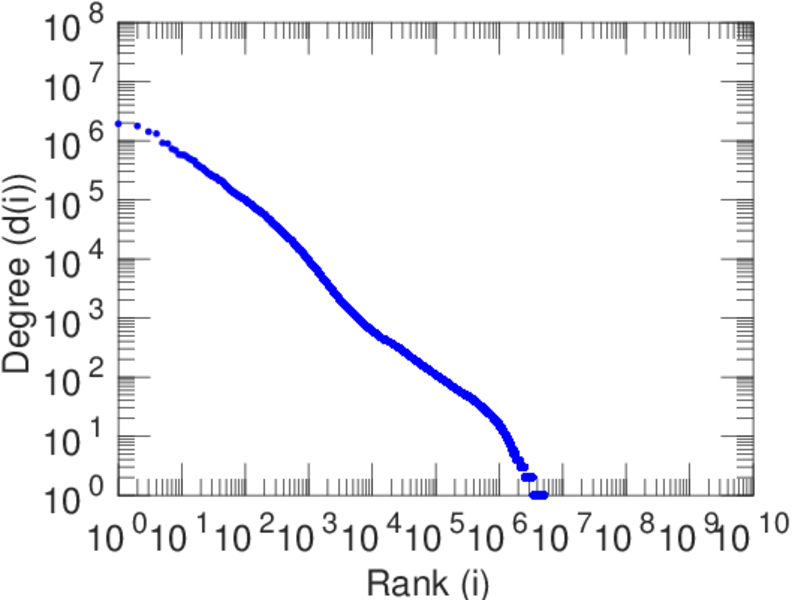
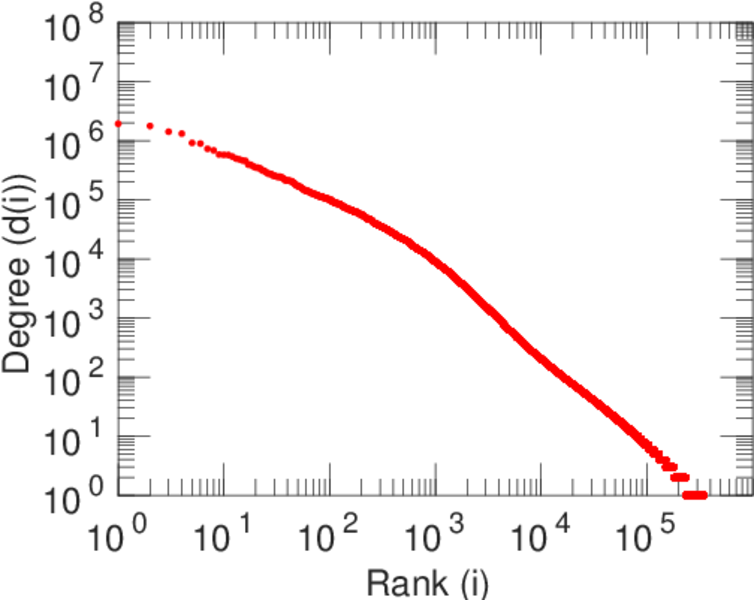
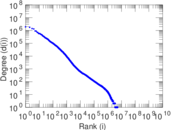
| Maximum degree | dmax = | 1,930,504
|
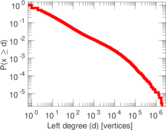
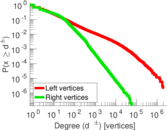
| Maximum left degree | d1max = | 1,930,504
|
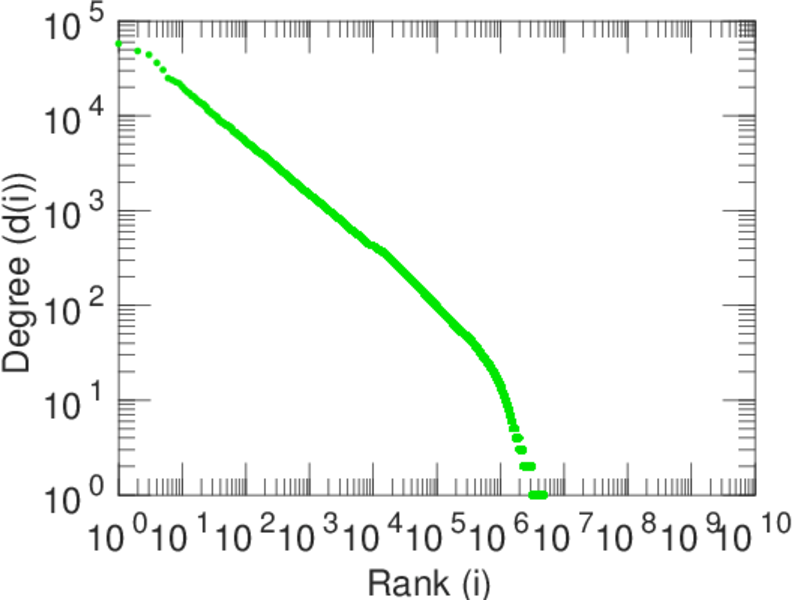
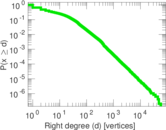
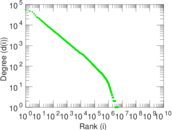
| Maximum right degree | d2max = | 57,661
|
| Average degree | d = | 26.000 3
|
| Average left degree | d1 = | 196.631
|
| Average right degree | d2 = | 13.920 5
|
| Fill | p = | 4.070 85 × 10−5
|
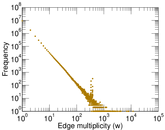
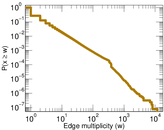
| Average edge multiplicity | m̃ = | 2.117 91
|
| Size of LCC | N = | 5,119,834
|
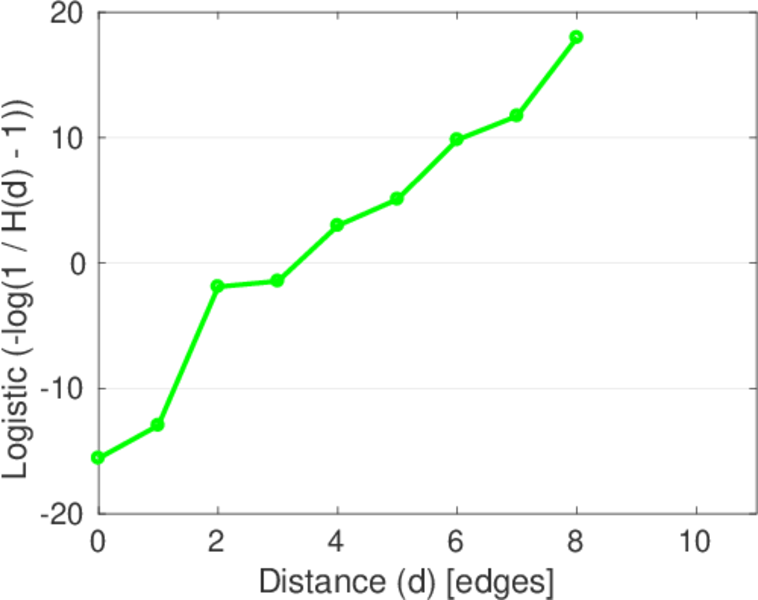
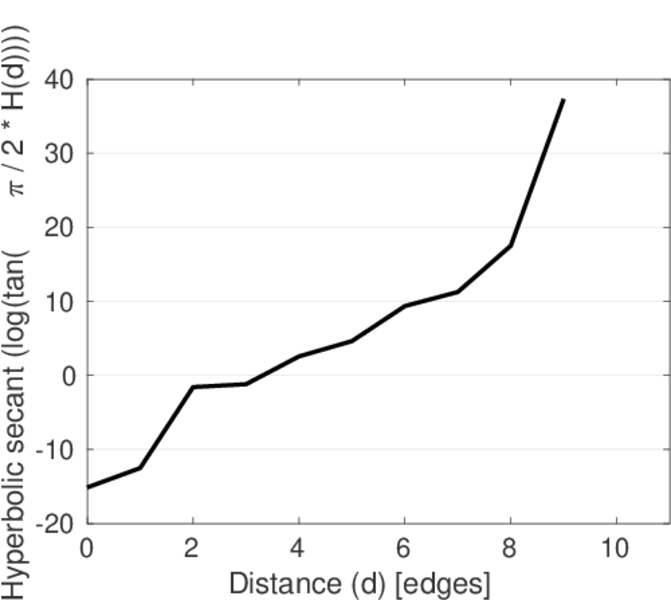
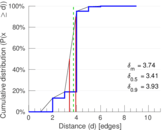
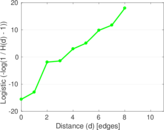
| Diameter | δ = | 11
|
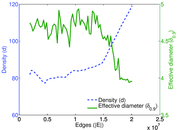
| 50-Percentile effective diameter | δ0.5 = | 3.408 80
|
| 90-Percentile effective diameter | δ0.9 = | 3.933 04
|
| Median distance | δM = | 4
|
| Mean distance | δm = | 3.737 90
|
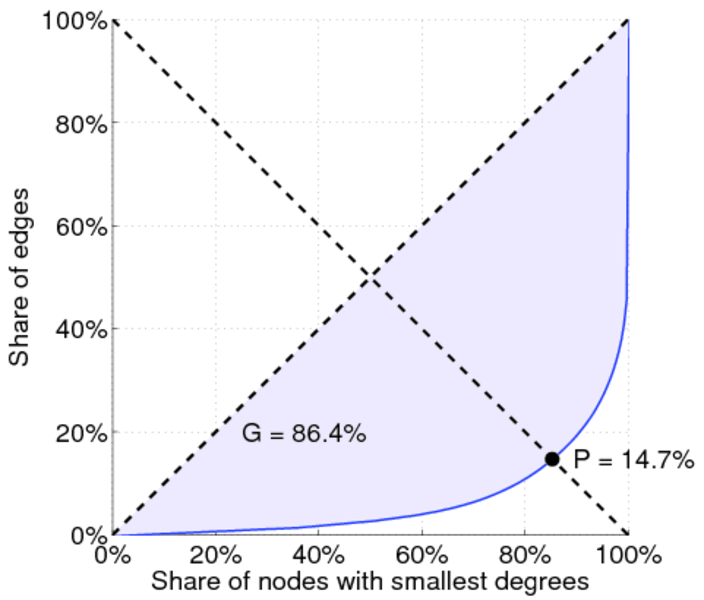
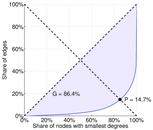
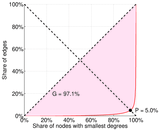
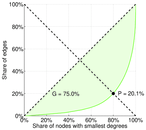
| Gini coefficient | G = | 0.869 004
|
| Balanced inequality ratio | P = | 0.135 879
|
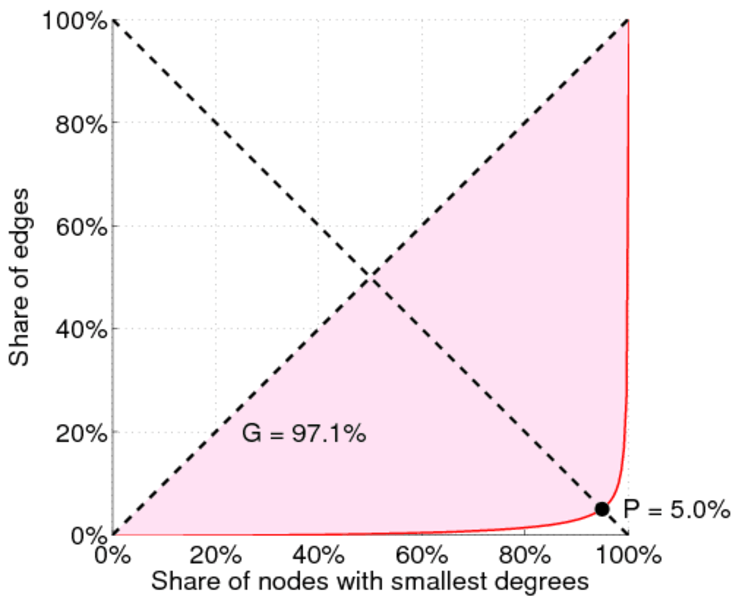
| Left balanced inequality ratio | P1 = | 0.040 344 3
|
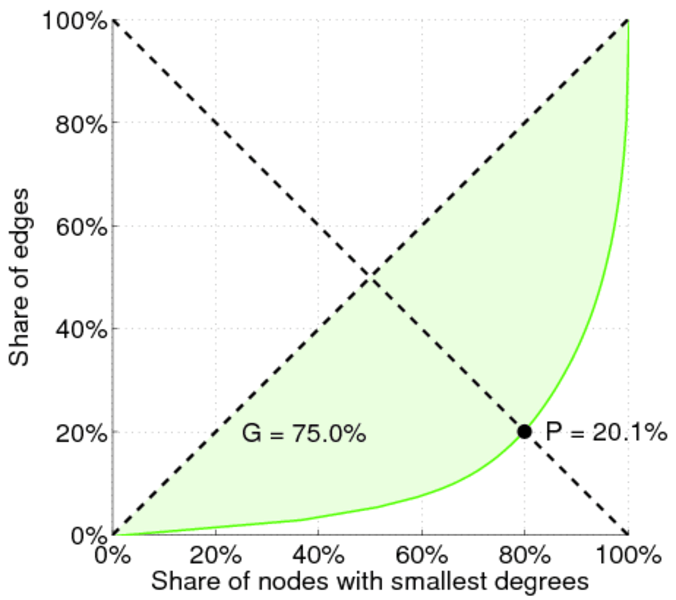
| Right balanced inequality ratio | P2 = | 0.188 266
|
| Relative edge distribution entropy | Her = | 0.752 320
|
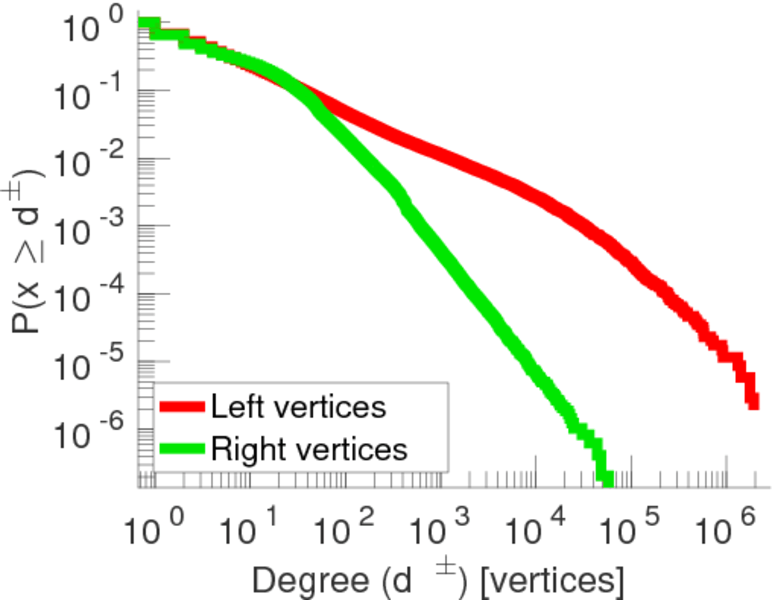
| Power law exponent | γ = | 2.022 16
|
| Tail power law exponent | γt = | 2.591 00
|
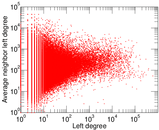
| Degree assortativity | ρ = | −0.126 562
|
| Degree assortativity p-value | pρ = | 0.000 00
|
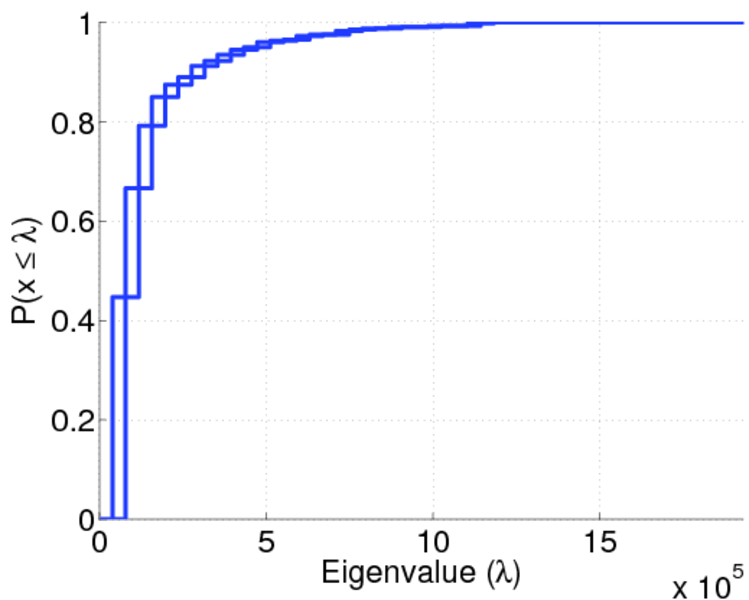
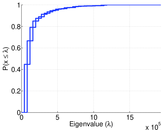
| Spectral norm | α = | 11,825.6
|
| Controllability | C = | 4,632,705
|
| Relative controllability | Cr = | 0.900 811
|
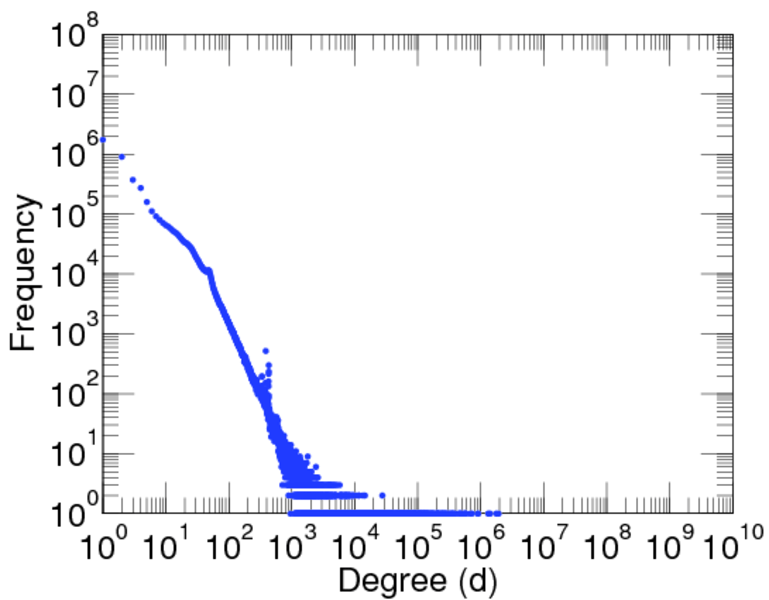
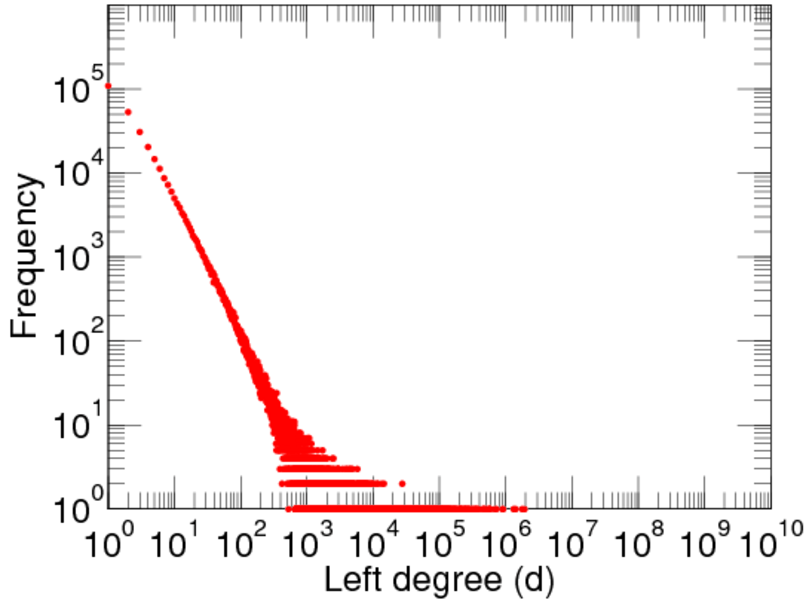
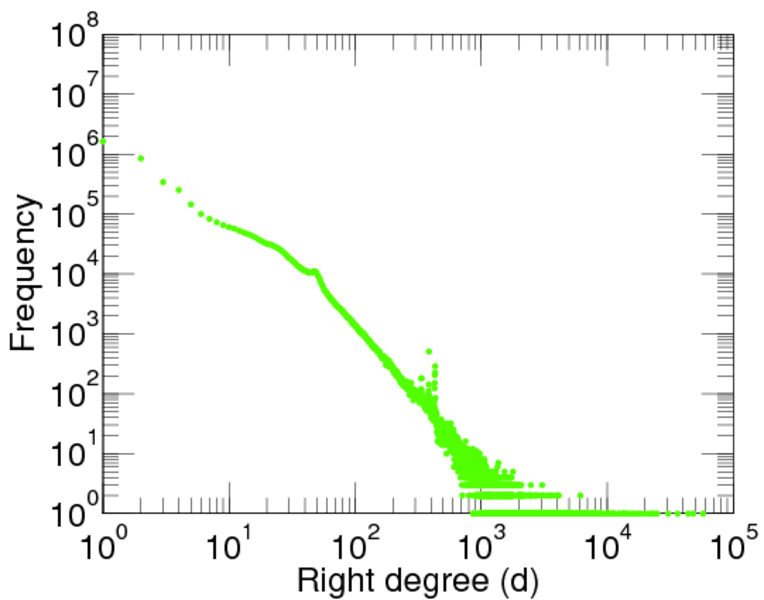
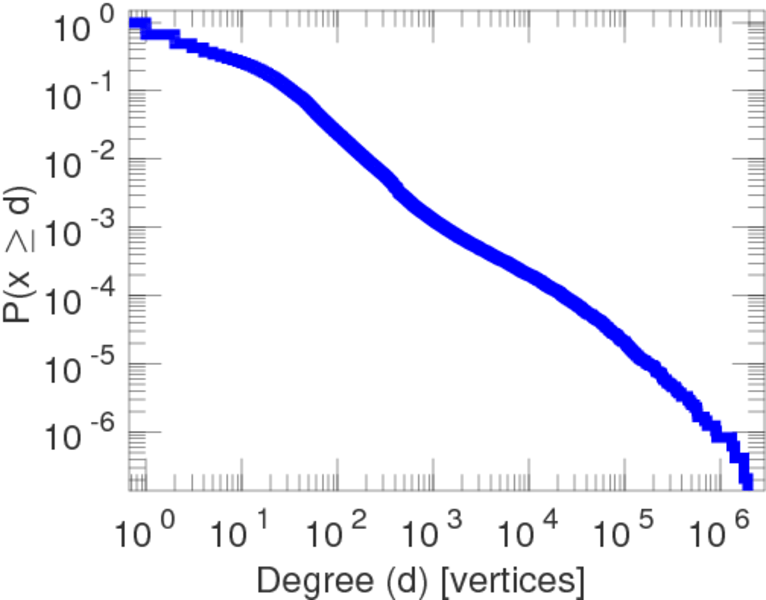
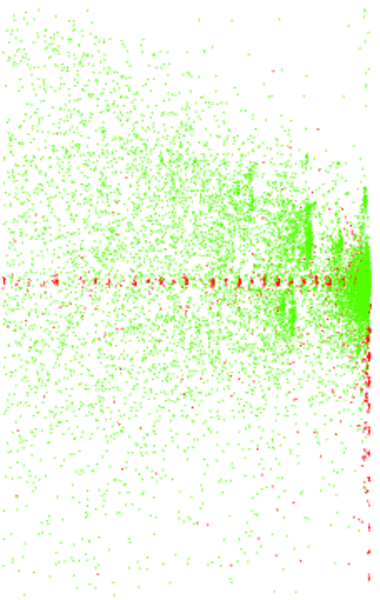
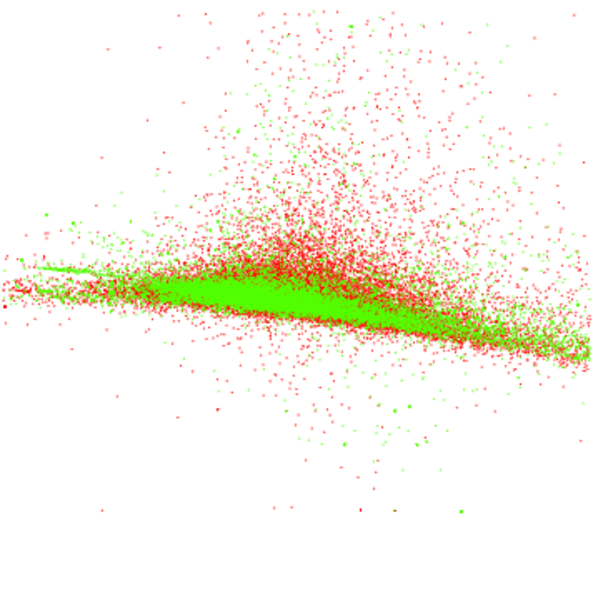
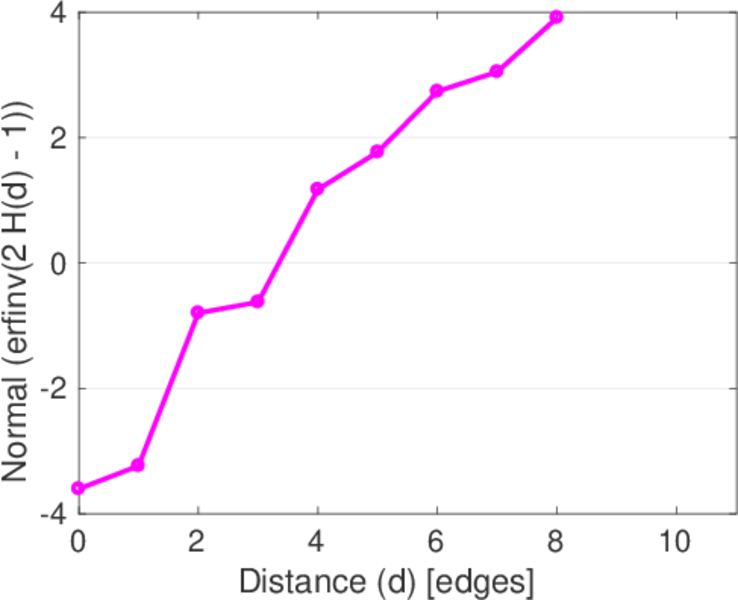
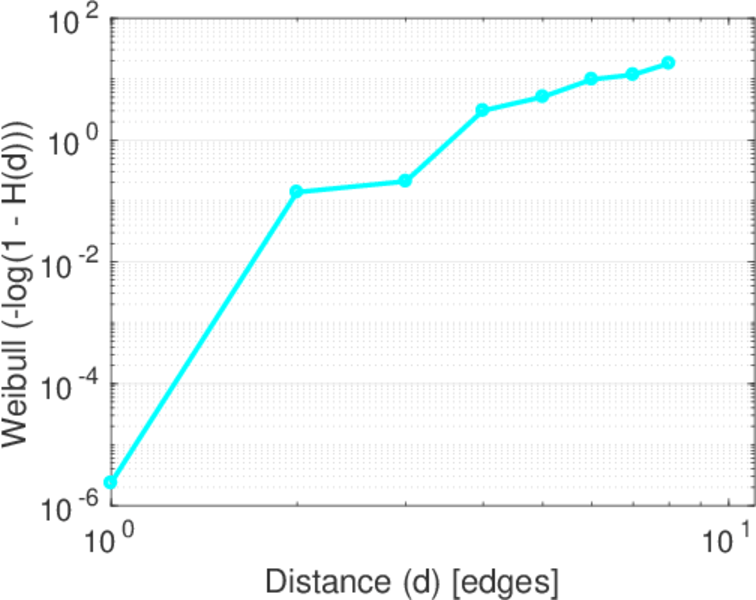
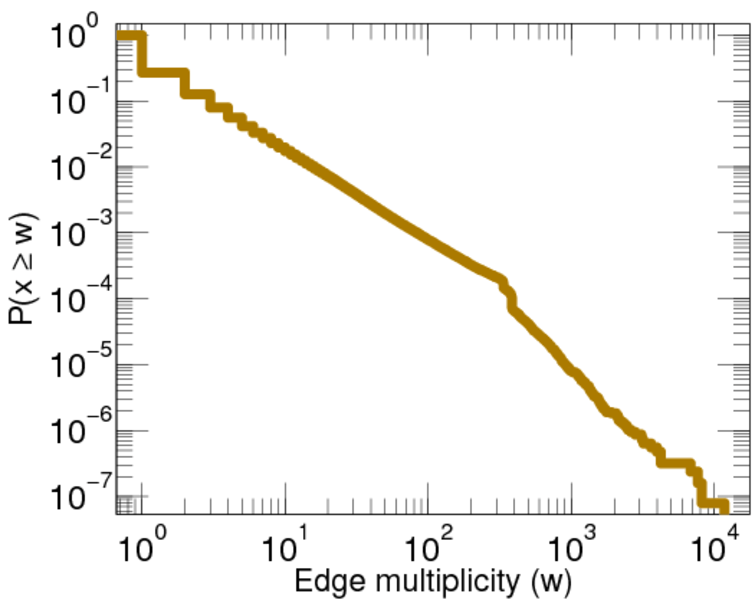
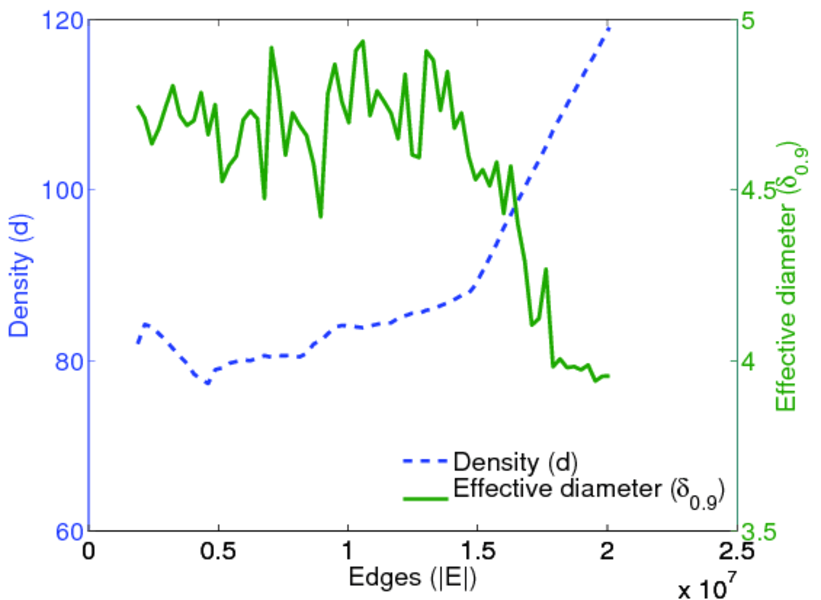
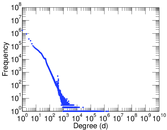
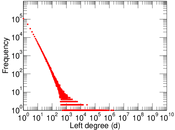
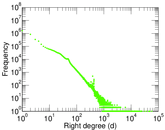
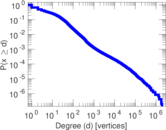
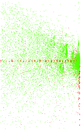
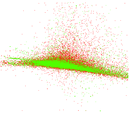
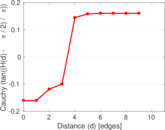
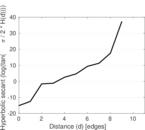
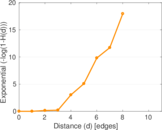
Plots


Downloads
References
|
[1]
|
Jérôme Kunegis.
KONECT – The Koblenz Network Collection.
In Proc. Int. Conf. on World Wide Web Companion, pages
1343–1350, 2013.
[ http ]
|
|
[2]
|
Wikimedia Foundation.
Wikimedia downloads.
http://dumps.wikimedia.org/, January 2010.
|
 KONECT ‣ Networks ‣
Buy Me a Coffee
KONECT ‣ Networks ‣
Buy Me a Coffee