Wikibooks edits (it)
This is the bipartite edit network of the Italian Wikibooks. It contains users
and pages from the Italian Wikibooks, connected by edit events. Each edge
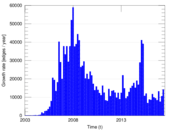
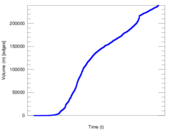
represents an edit. The dataset includes the timestamp of each edit.
Metadata
Statistics
| Size | n = | 30,047
|
| Left size | n1 = | 4,294
|
| Right size | n2 = | 25,753
|
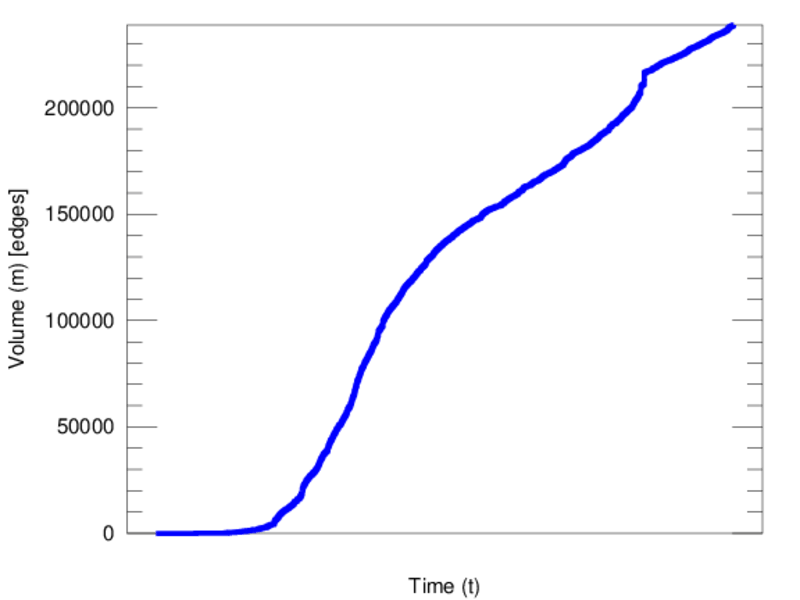
| Volume | m = | 238,977
|
| Unique edge count | m̿ = | 70,613
|
| Wedge count | s = | 70,258,576
|
| Claw count | z = | 83,991,697,904
|
| Cross count | x = | 81,611,005,882,726
|
| Square count | q = | 17,380,953
|
| 4-Tour count | T4 = | 420,258,662
|
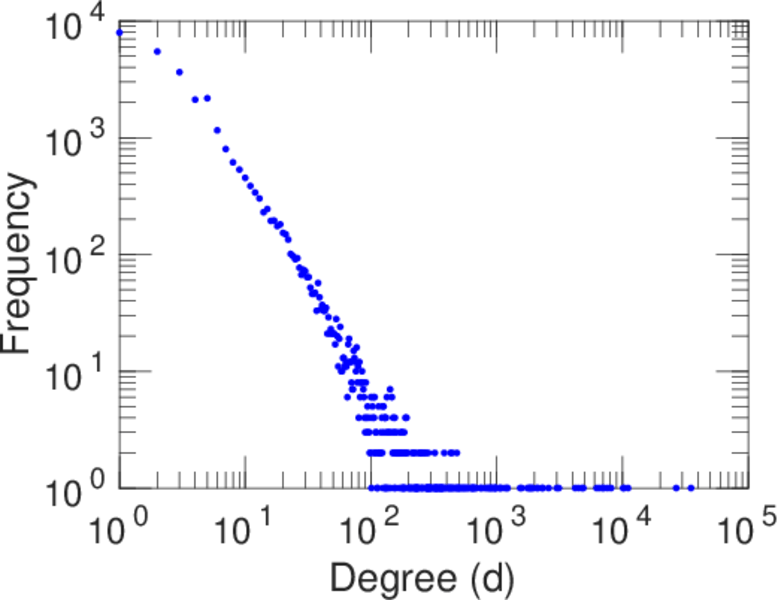
| Maximum degree | dmax = | 35,132
|
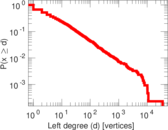
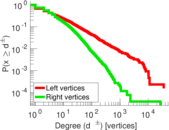
| Maximum left degree | d1max = | 35,132
|
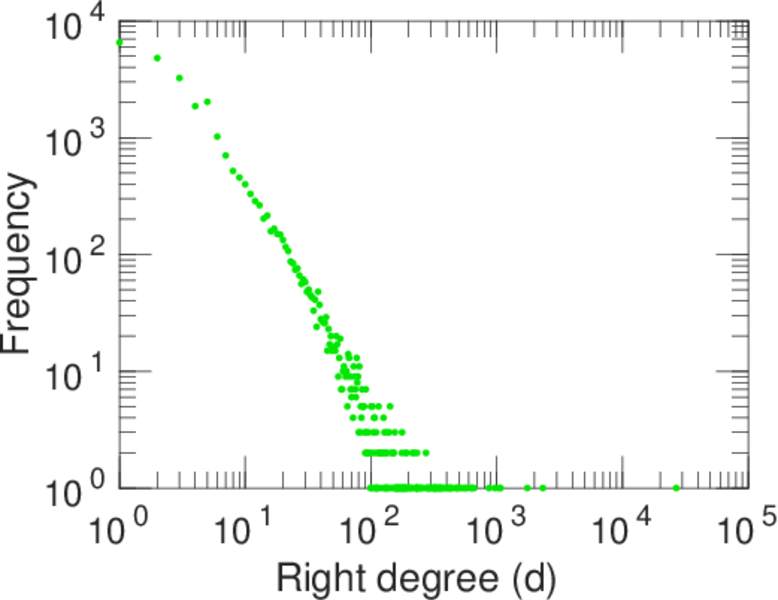
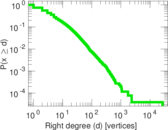
| Maximum right degree | d2max = | 26,828
|
| Average degree | d = | 15.906 9
|
| Average left degree | d1 = | 55.653 7
|
| Average right degree | d2 = | 9.279 58
|
| Fill | p = | 0.000 638 550
|
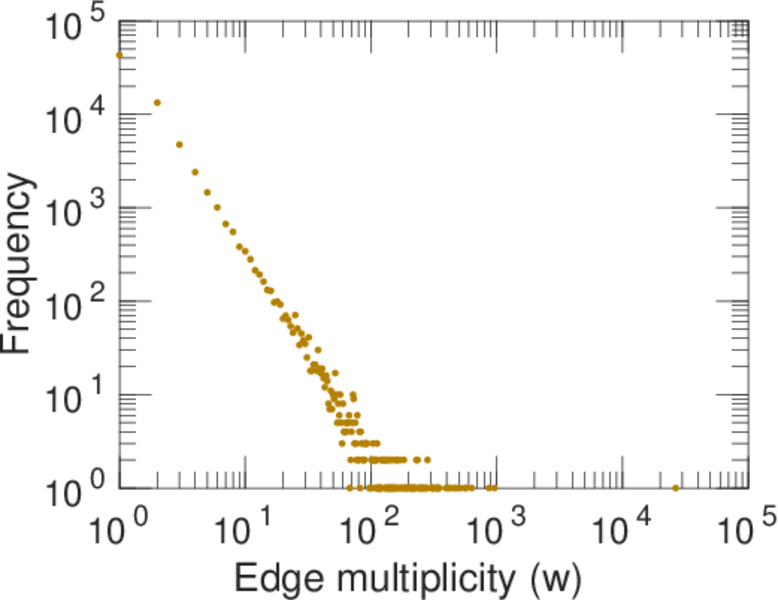
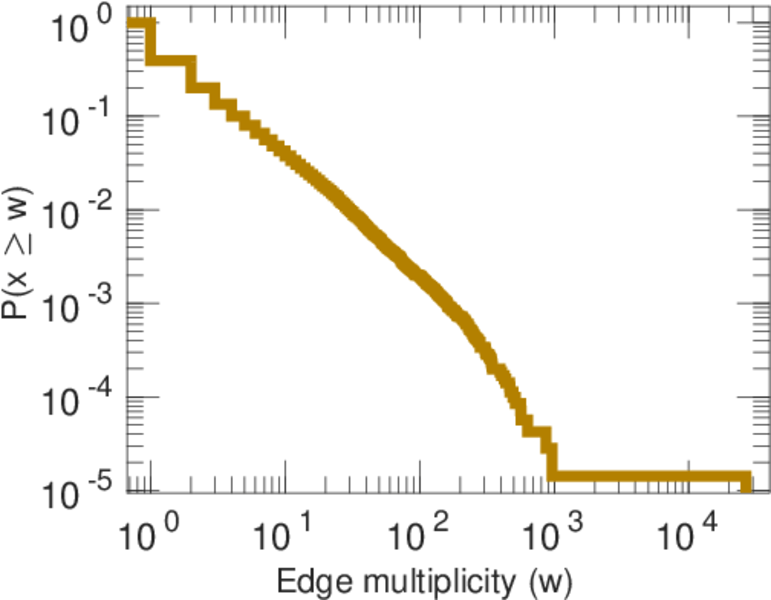
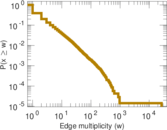
| Average edge multiplicity | m̃ = | 3.384 32
|
| Size of LCC | N = | 29,398
|
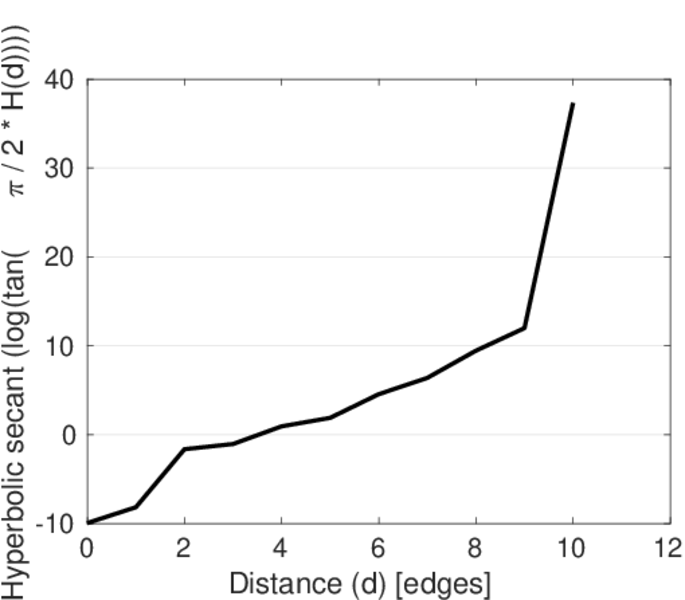
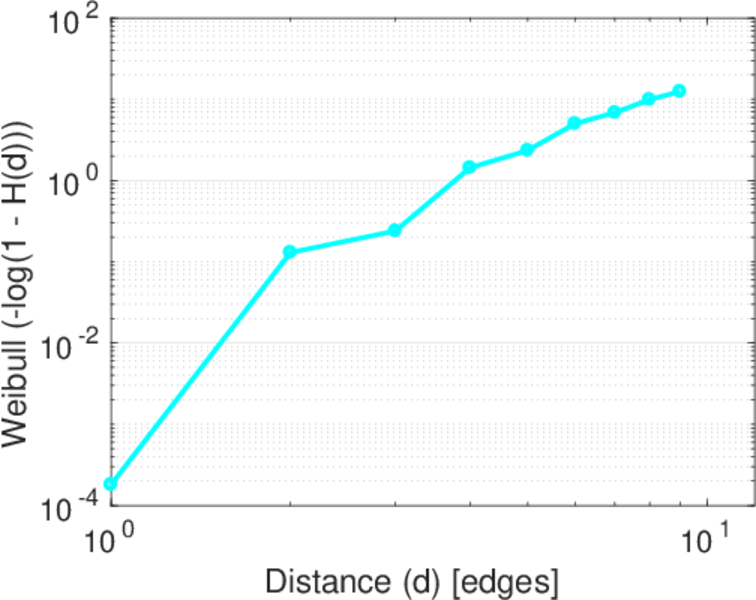
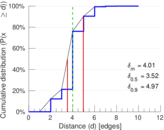
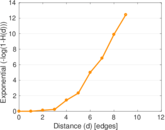
| Diameter | δ = | 12
|
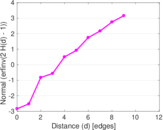
| 50-Percentile effective diameter | δ0.5 = | 3.523 83
|
| 90-Percentile effective diameter | δ0.9 = | 4.970 35
|
| Median distance | δM = | 4
|
| Mean distance | δm = | 4.007 82
|
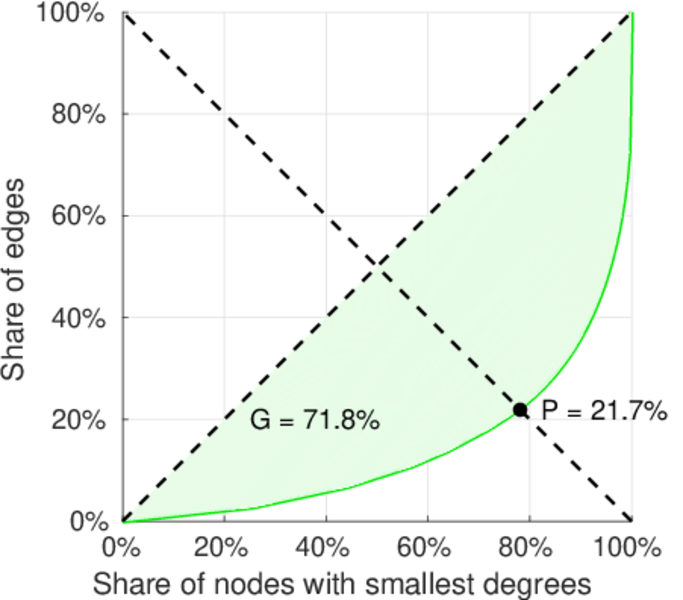
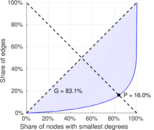
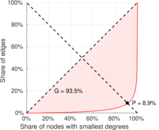
| Gini coefficient | G = | 0.832 728
|
| Balanced inequality ratio | P = | 0.160 369
|
| Left balanced inequality ratio | P1 = | 0.088 535 7
|
| Right balanced inequality ratio | P2 = | 0.217 444
|
| Relative edge distribution entropy | Her = | 0.783 092
|
| Power law exponent | γ = | 2.412 35
|
| Tail power law exponent | γt = | 2.541 00
|
| Tail power law exponent with p | γ3 = | 2.541 00
|
| p-value | p = | 0.000 00
|
| Left tail power law exponent with p | γ3,1 = | 1.791 00
|
| Left p-value | p1 = | 0.138 000
|
| Right tail power law exponent with p | γ3,2 = | 3.251 00
|
| Right p-value | p2 = | 0.918 000
|
| Degree assortativity | ρ = | −0.218 349
|
| Degree assortativity p-value | pρ = | 0.000 00
|
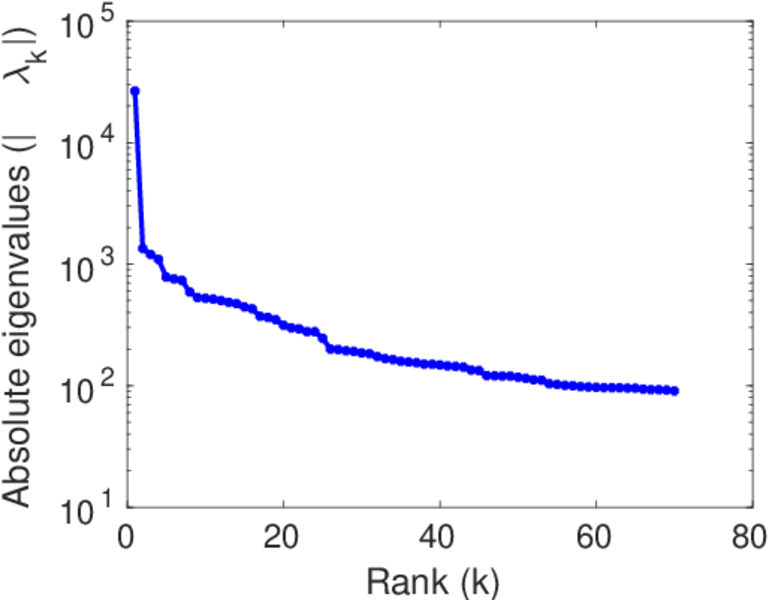
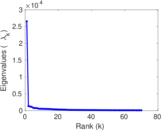
| Spectral norm | α = | 26,549.8
|
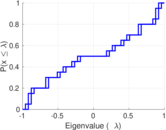
| Algebraic connectivity | a = | 0.047 900 9
|
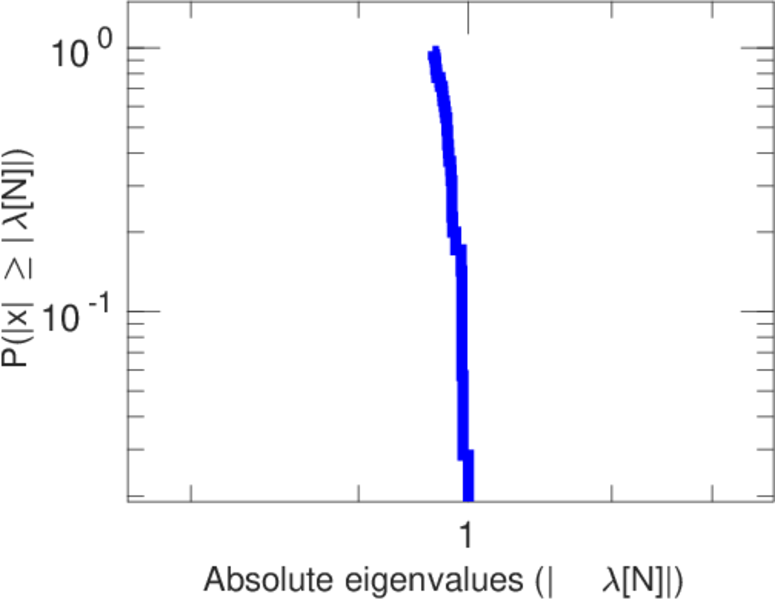
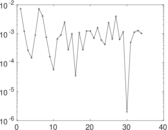
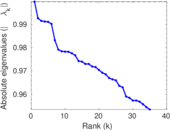
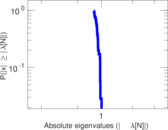
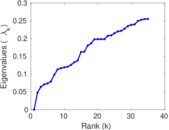
| Spectral separation | |λ1[A] / λ2[A]| = | 19.792 9
|
| Controllability | C = | 23,947
|
| Relative controllability | Cr = | 0.801 171
|
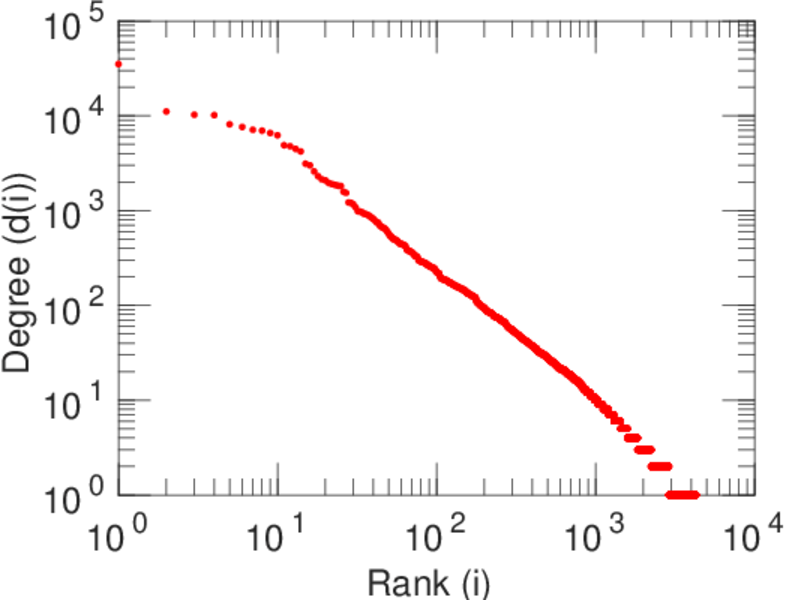
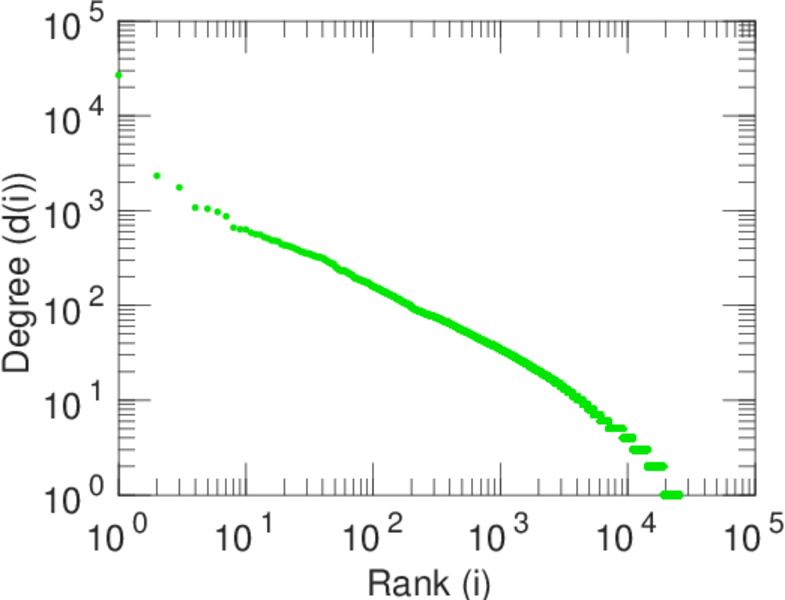
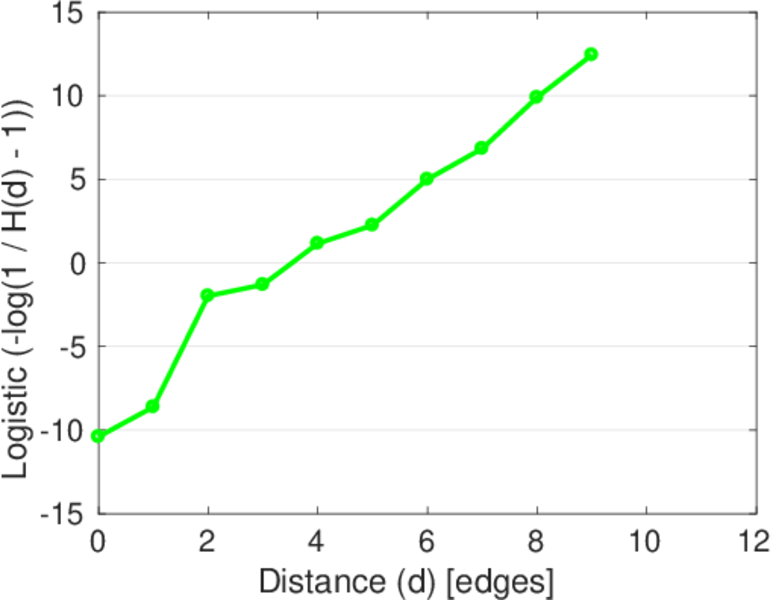
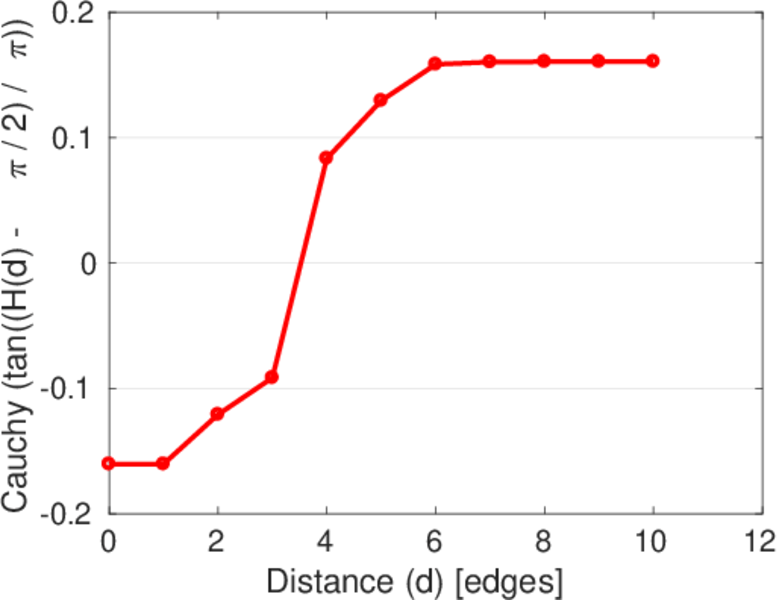
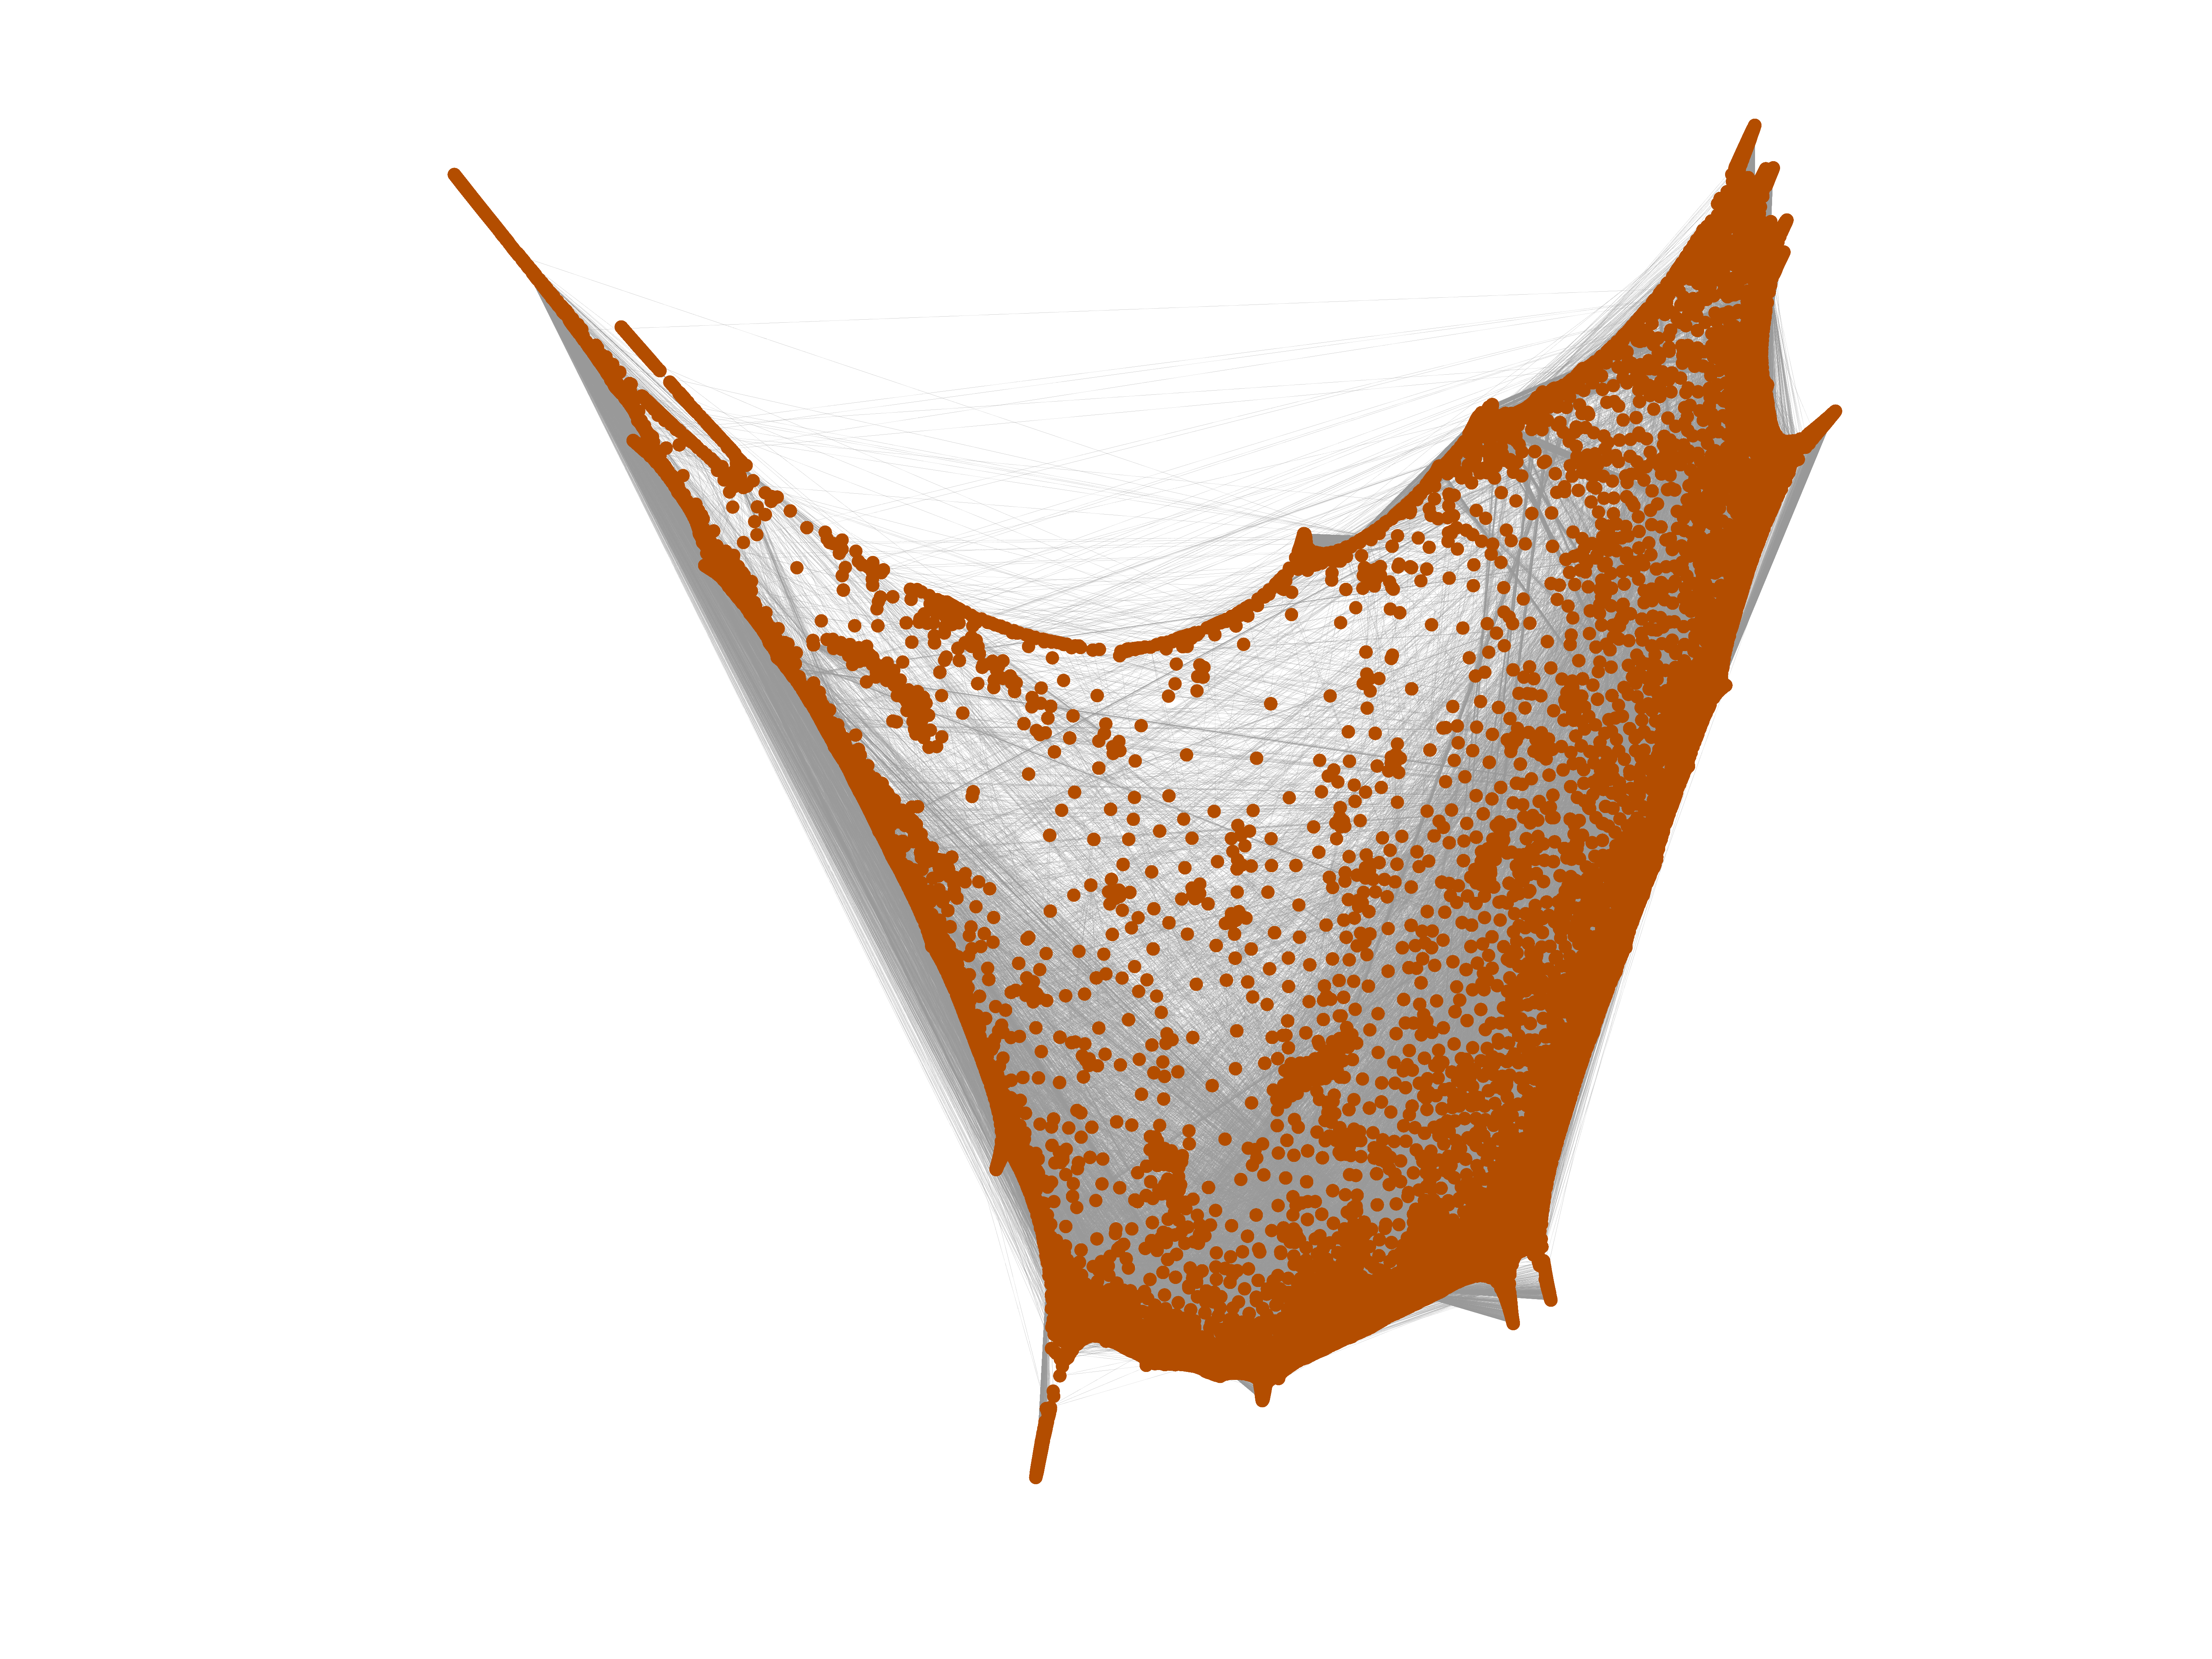
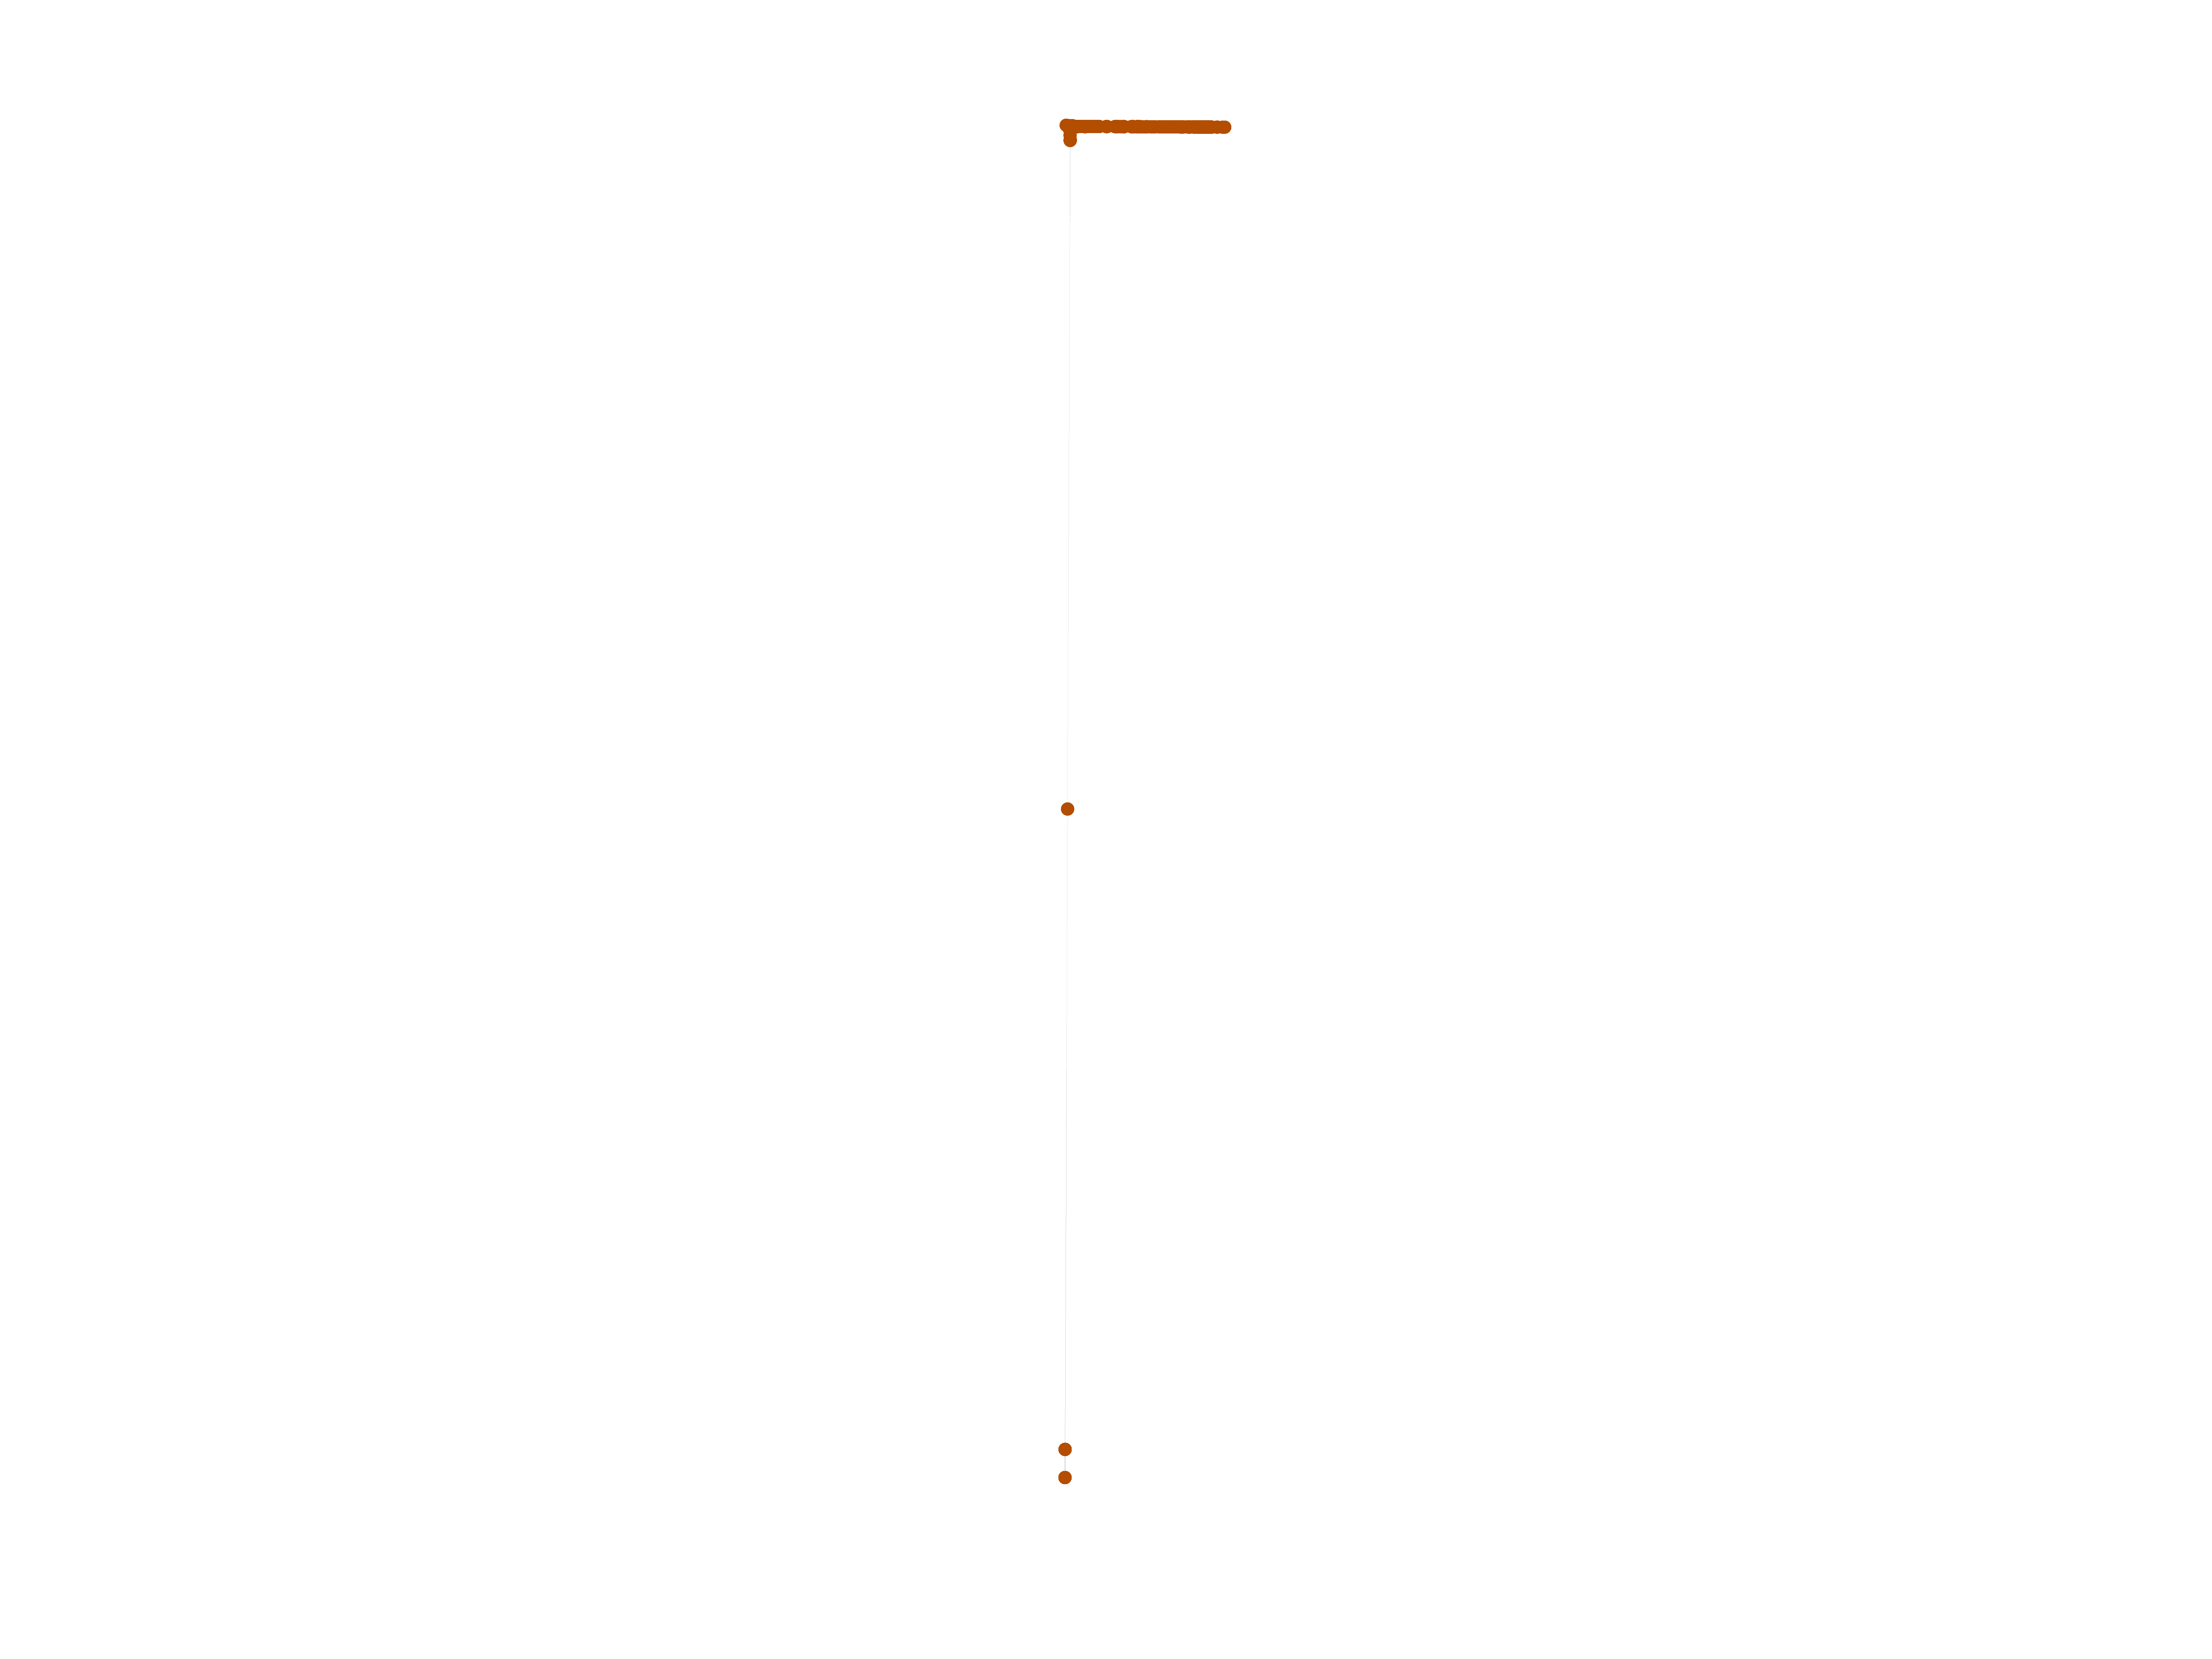
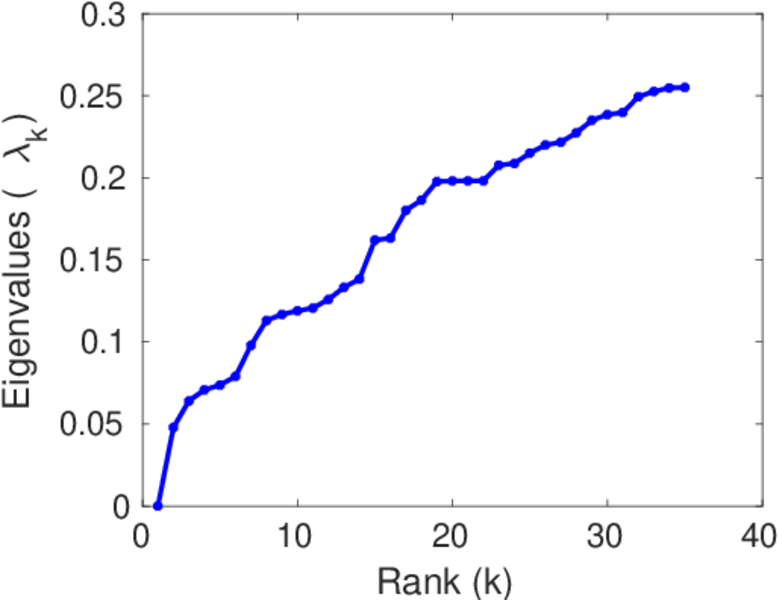
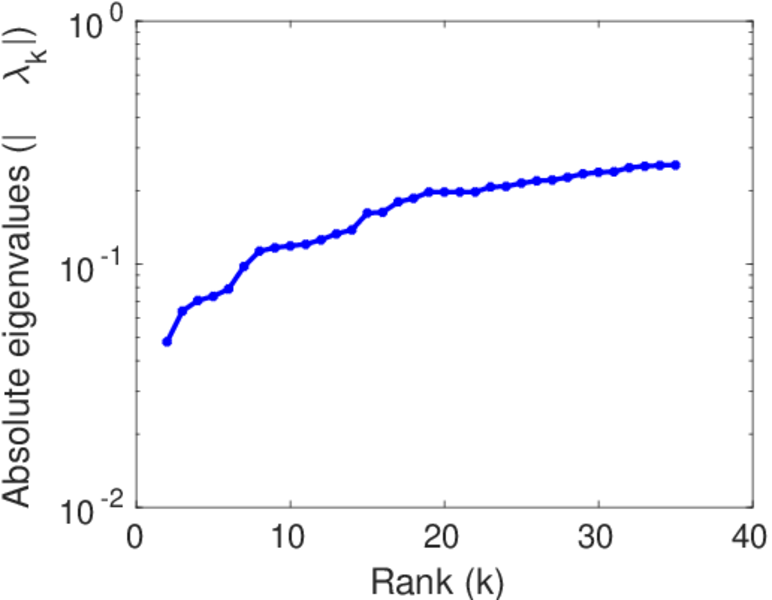
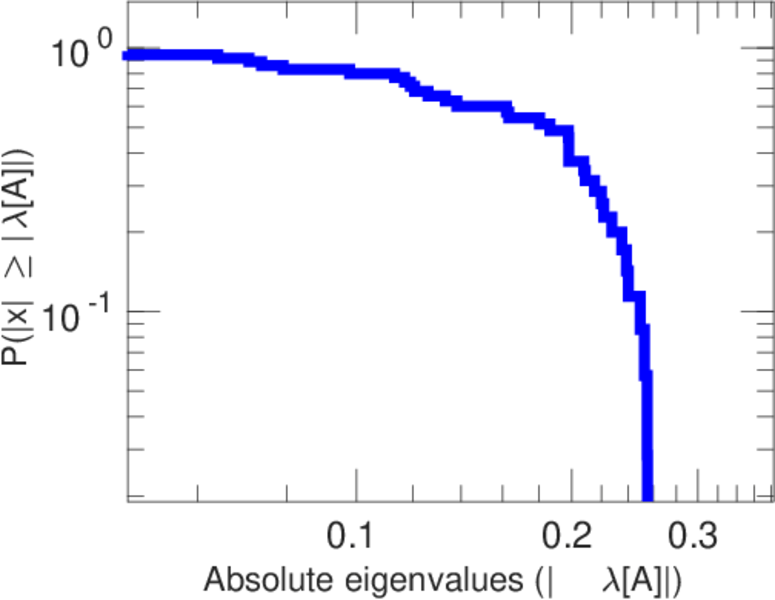
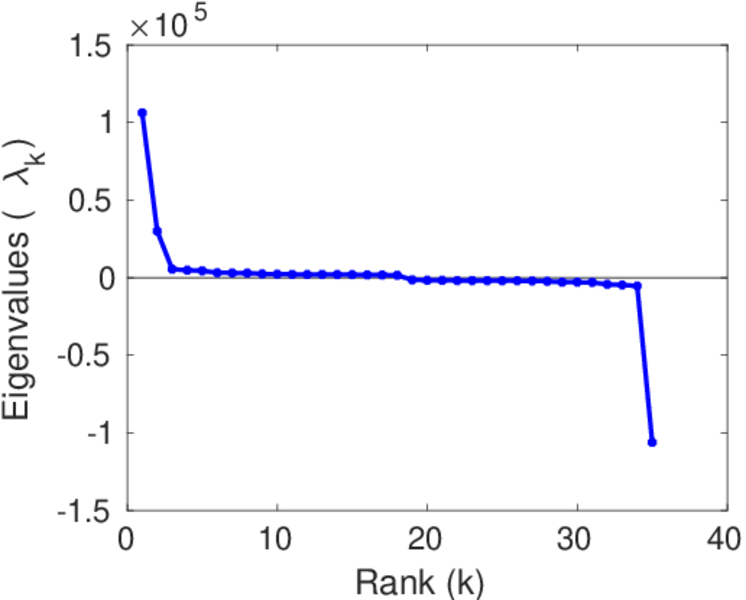
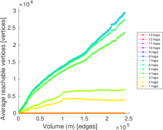
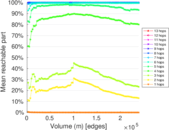
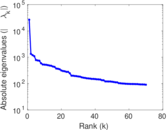
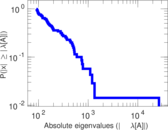
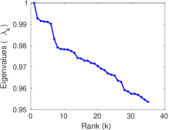
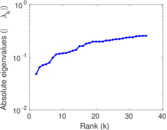
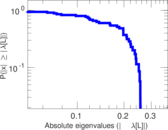
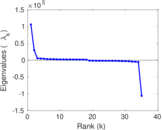
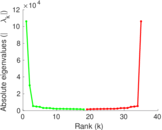
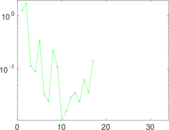
Plots


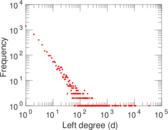

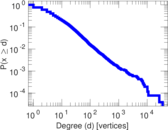


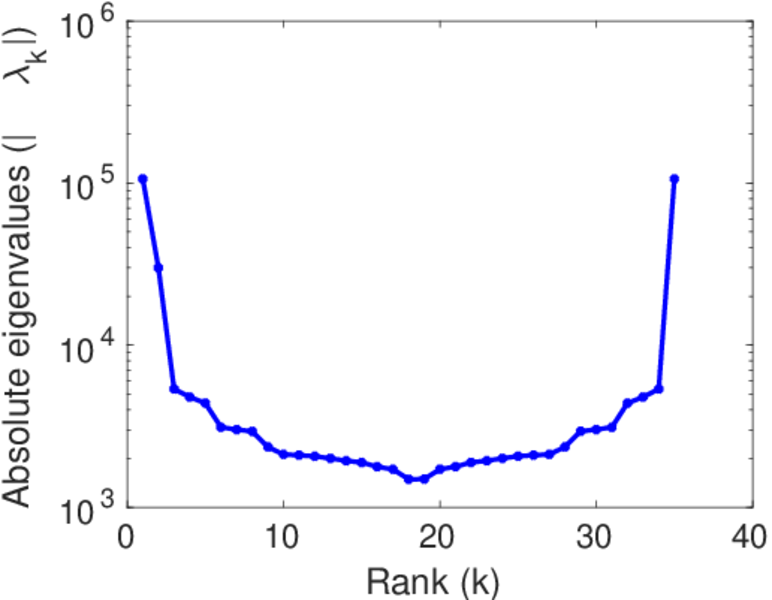
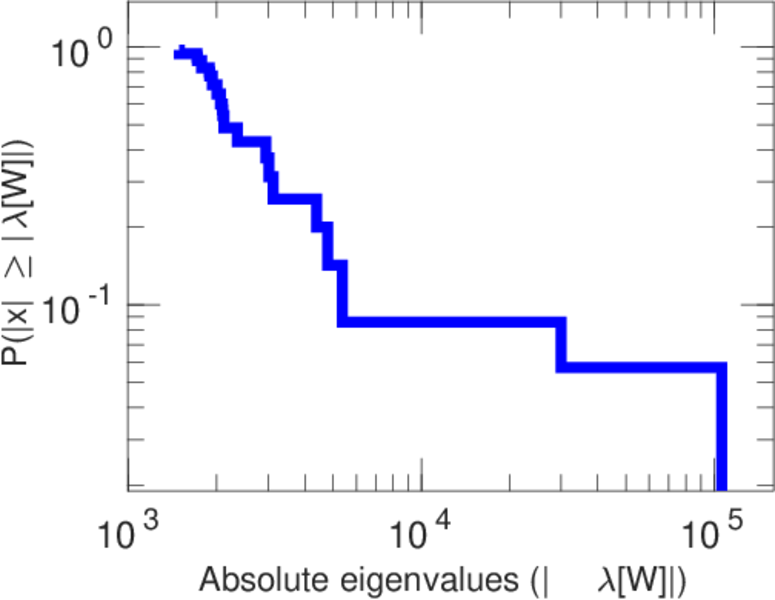
Matrix decompositions plots


Downloads
References
|
[1]
|
Jérôme Kunegis.
KONECT – The Koblenz Network Collection.
In Proc. Int. Conf. on World Wide Web Companion, pages
1343–1350, 2013.
[ http ]
|
|
[2]
|
Wikimedia Foundation.
Wikimedia downloads.
http://dumps.wikimedia.org/, January 2010.
|
 KONECT ‣ Networks ‣
Buy Me a Coffee
KONECT ‣ Networks ‣
Buy Me a Coffee