Wikinews edits (it)
This is the bipartite edit network of the Italian Wikinews. It contains users
and pages from the Italian Wikinews, connected by edit events. Each edge
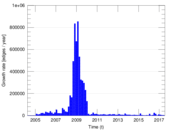
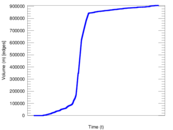
represents an edit. The dataset includes the timestamp of each edit.
Metadata
Statistics
| Size | n = | 38,179
|
| Left size | n1 = | 2,200
|
| Right size | n2 = | 35,979
|
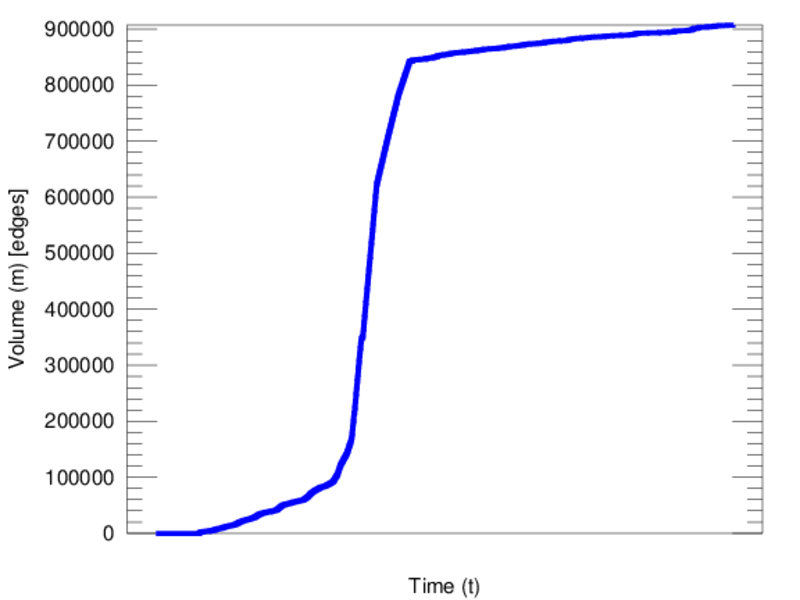
| Volume | m = | 907,499
|
| Unique edge count | m̿ = | 82,570
|
| Wedge count | s = | 86,384,476
|
| Cross count | x = | 114,676,564,381,497
|
| Square count | q = | 13,591,083
|
| 4-Tour count | T4 = | 454,434,116
|
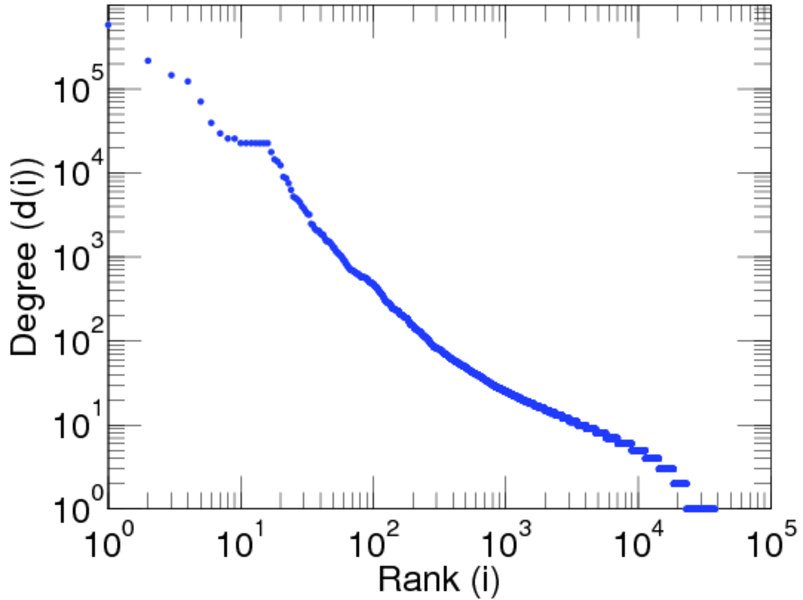
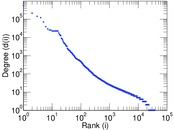
| Maximum degree | dmax = | 580,629
|
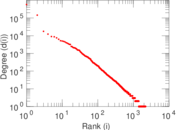
| Maximum left degree | d1max = | 580,629
|
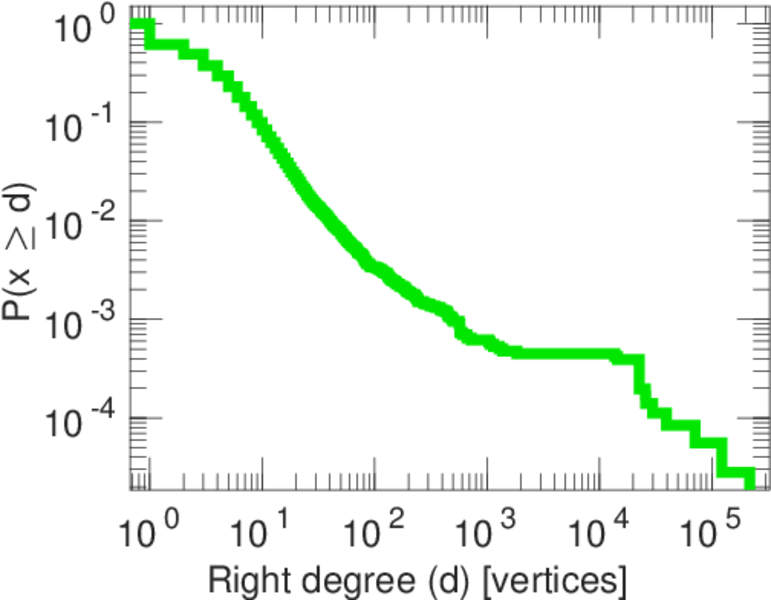
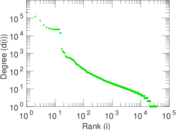
| Maximum right degree | d2max = | 217,246
|
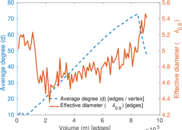
| Average degree | d = | 47.539 2
|
| Average left degree | d1 = | 412.500
|
| Average right degree | d2 = | 25.223 0
|
| Fill | p = | 0.001 043 16
|
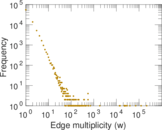
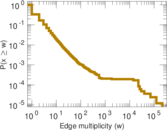
| Average edge multiplicity | m̃ = | 10.990 7
|
| Size of LCC | N = | 37,451
|
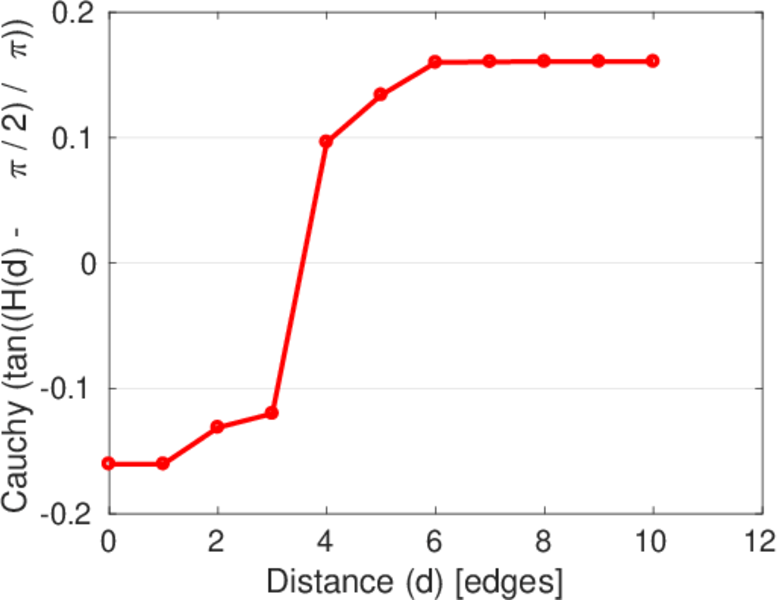
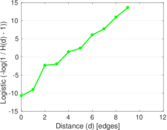
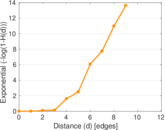
| Diameter | δ = | 12
|
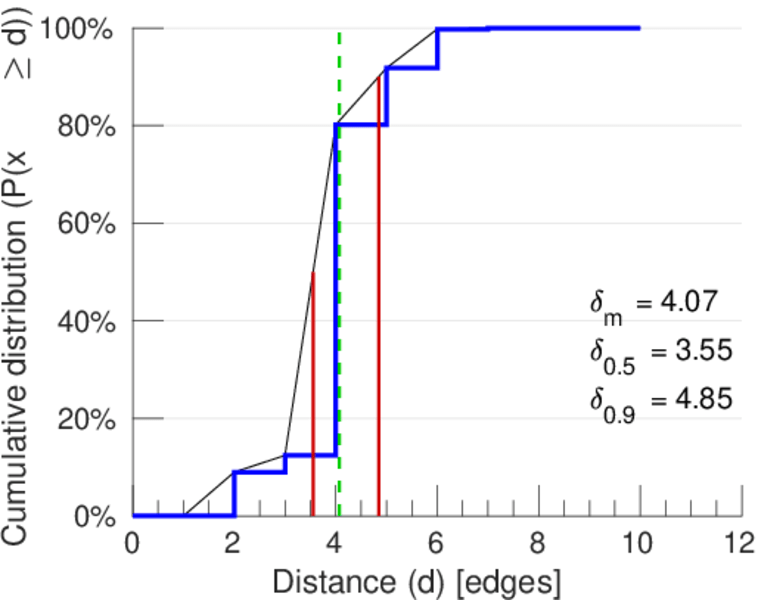
| 50-Percentile effective diameter | δ0.5 = | 3.554 84
|
| 90-Percentile effective diameter | δ0.9 = | 4.845 17
|
| Median distance | δM = | 4
|
| Mean distance | δm = | 4.069 14
|
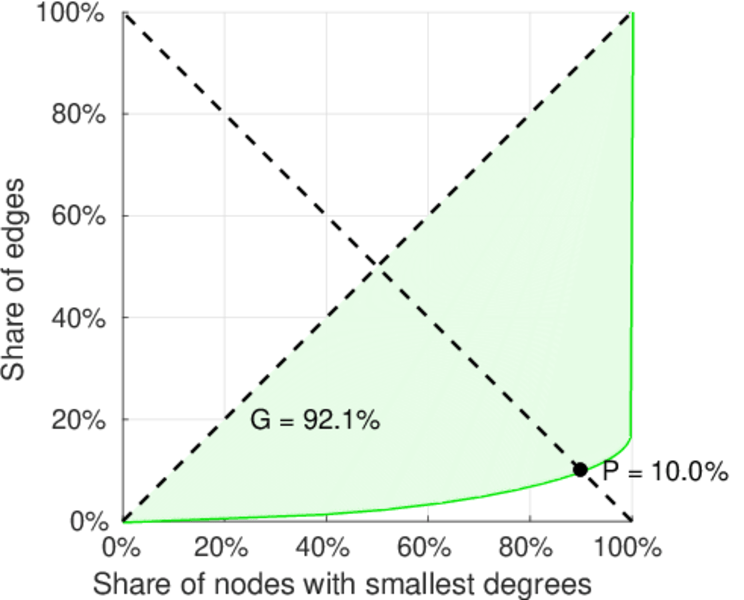
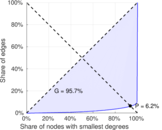
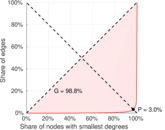
| Gini coefficient | G = | 0.958 362
|
| Balanced inequality ratio | P = | 0.060 954 9
|
| Left balanced inequality ratio | P1 = | 0.030 277 7
|
| Right balanced inequality ratio | P2 = | 0.099 659 6
|
| Relative edge distribution entropy | Her = | 0.766 041
|
| Power law exponent | γ = | 2.654 67
|
| Tail power law exponent | γt = | 1.771 00
|
| Tail power law exponent with p | γ3 = | 1.771 00
|
| p-value | p = | 0.008 000 00
|
| Left tail power law exponent with p | γ3,1 = | 1.661 00
|
| Left p-value | p1 = | 0.583 000
|
| Right tail power law exponent with p | γ3,2 = | 4.151 00
|
| Right p-value | p2 = | 0.000 00
|
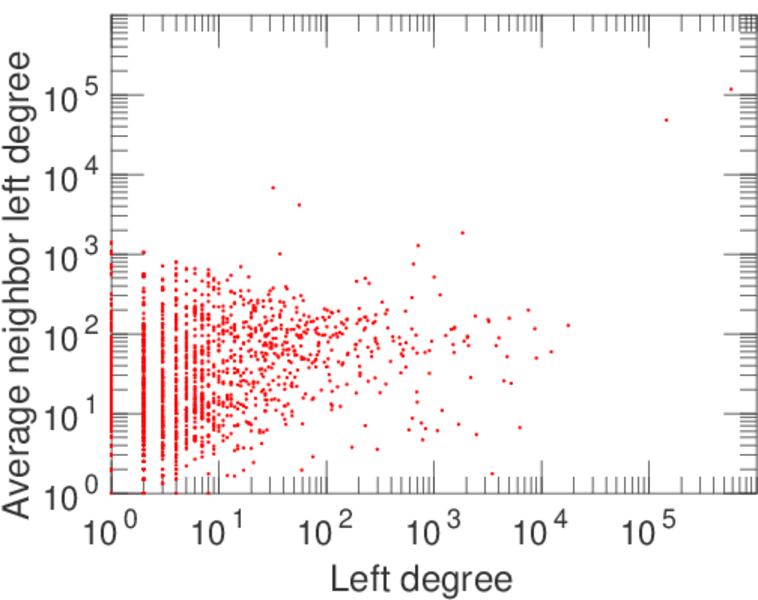
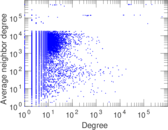
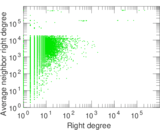
| Degree assortativity | ρ = | −0.150 629
|
| Degree assortativity p-value | pρ = | 0.000 00
|
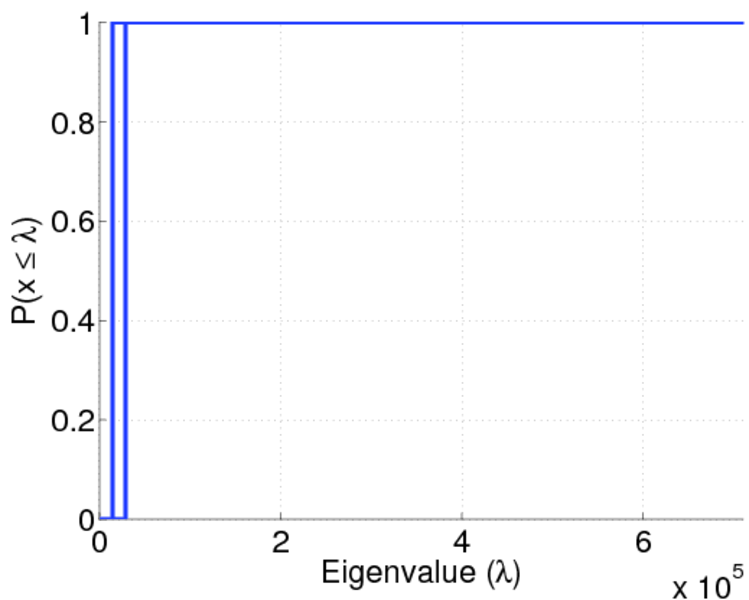
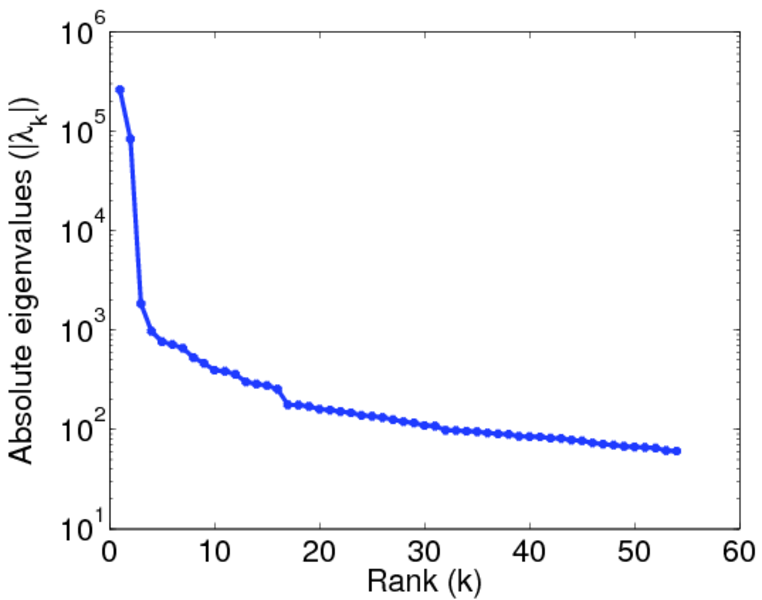
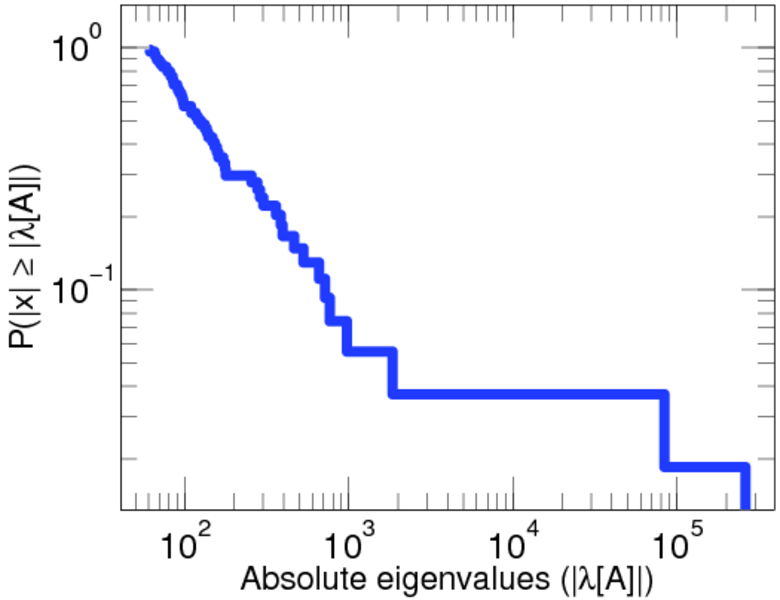
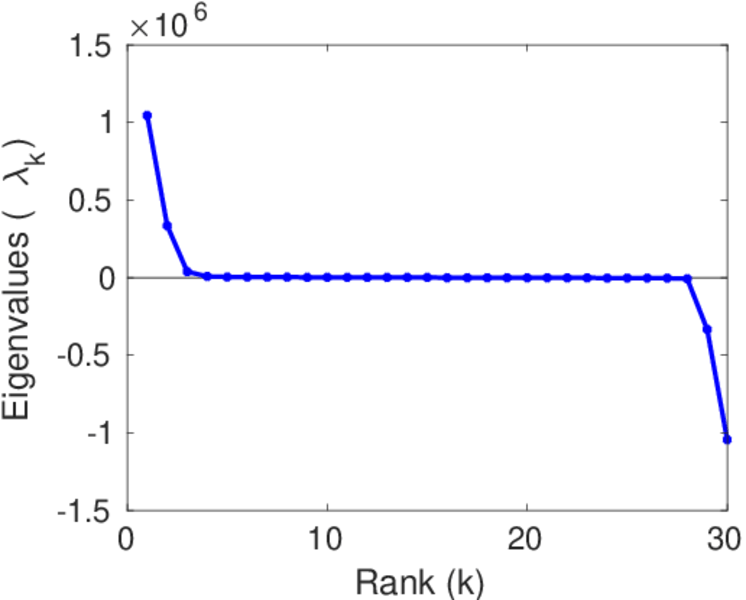
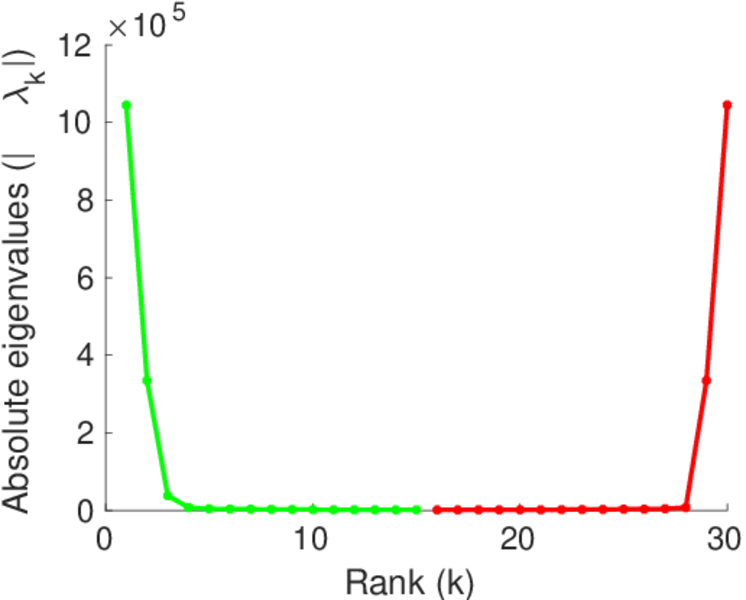
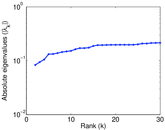
| Spectral norm | α = | 261,162
|
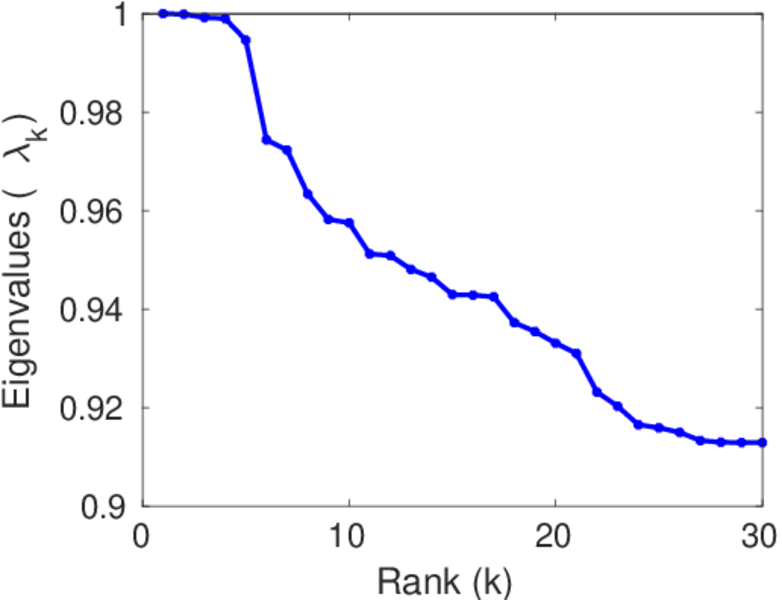
| Algebraic connectivity | a = | 0.083 513 8
|
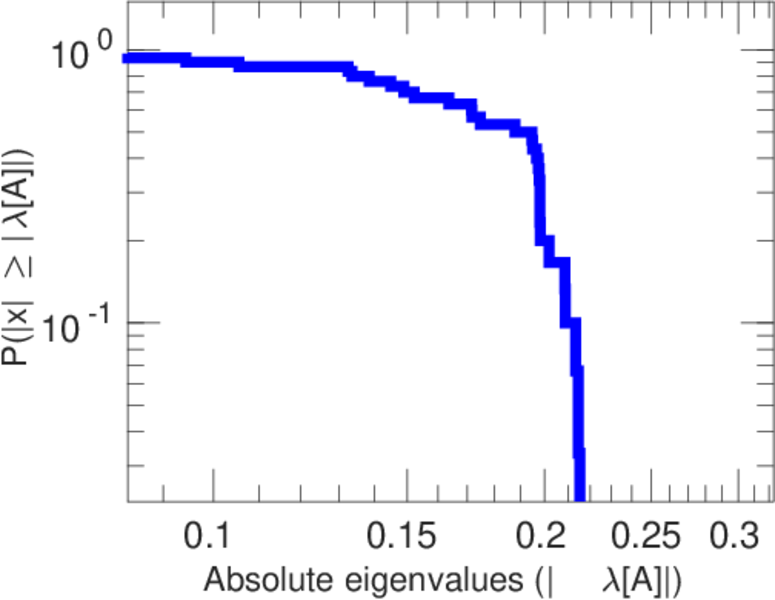
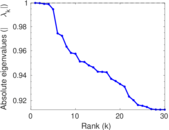
| Spectral separation | |λ1[A] / λ2[A]| = | 3.122 80
|
| Controllability | C = | 34,176
|
| Relative controllability | Cr = | 0.901 979
|
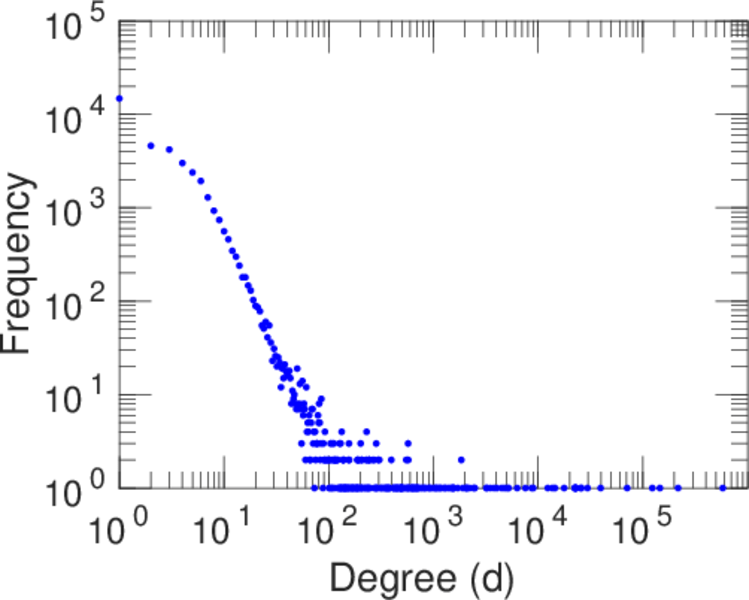
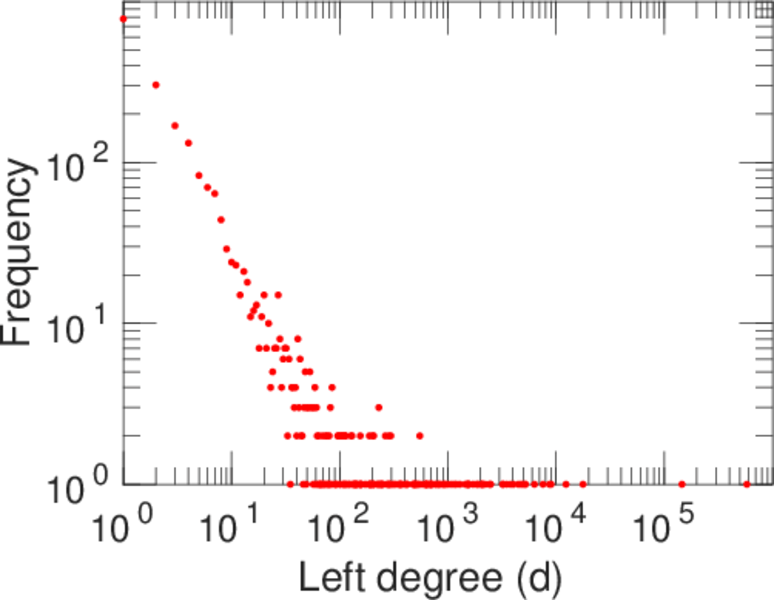
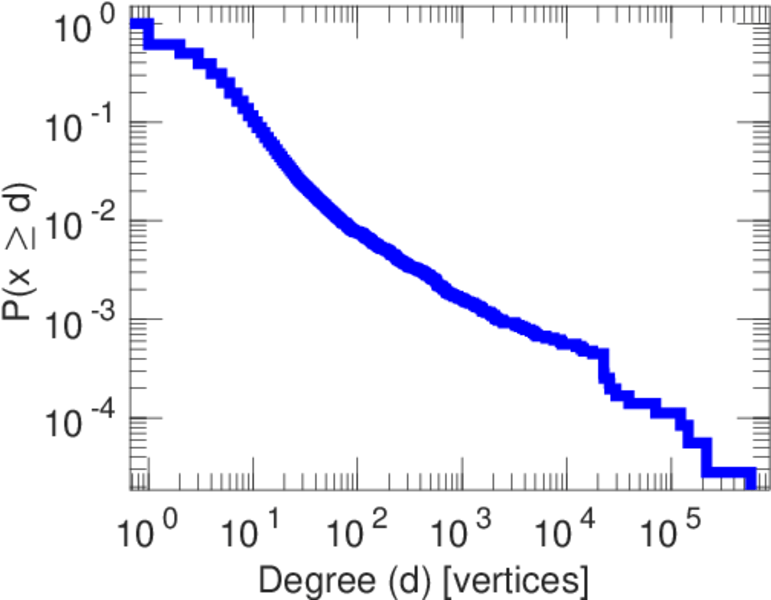
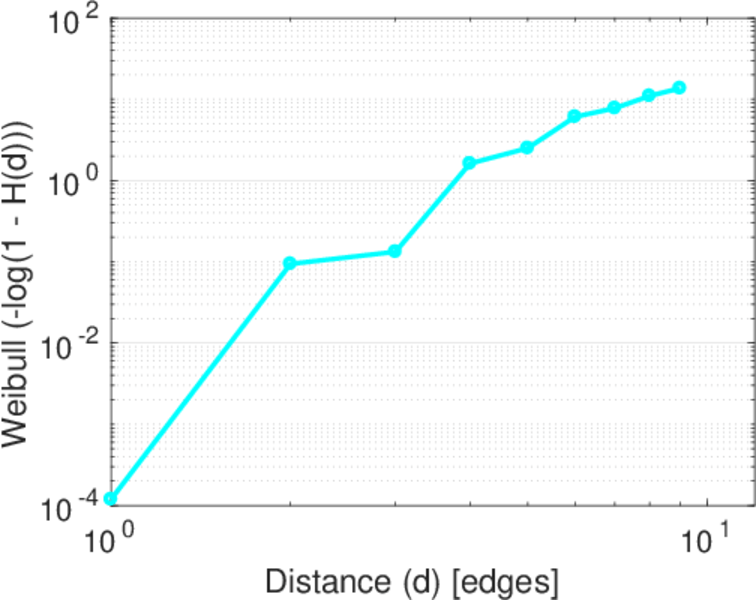
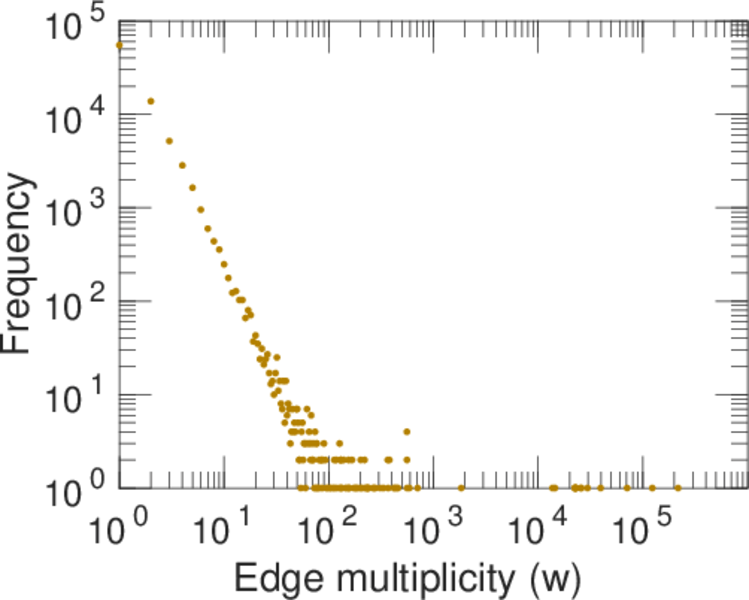
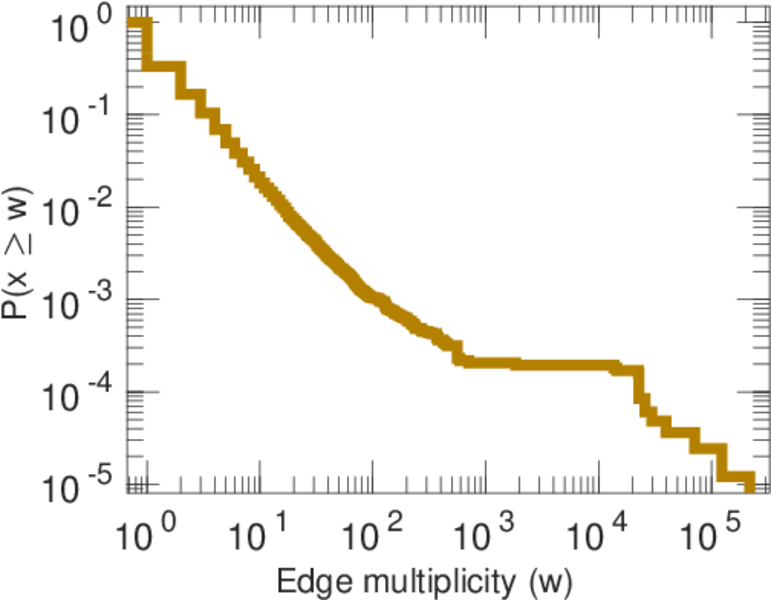
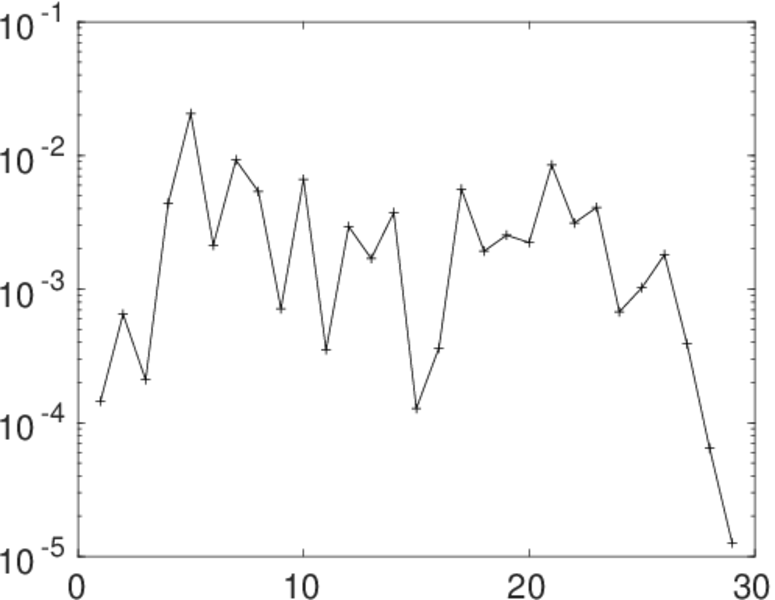
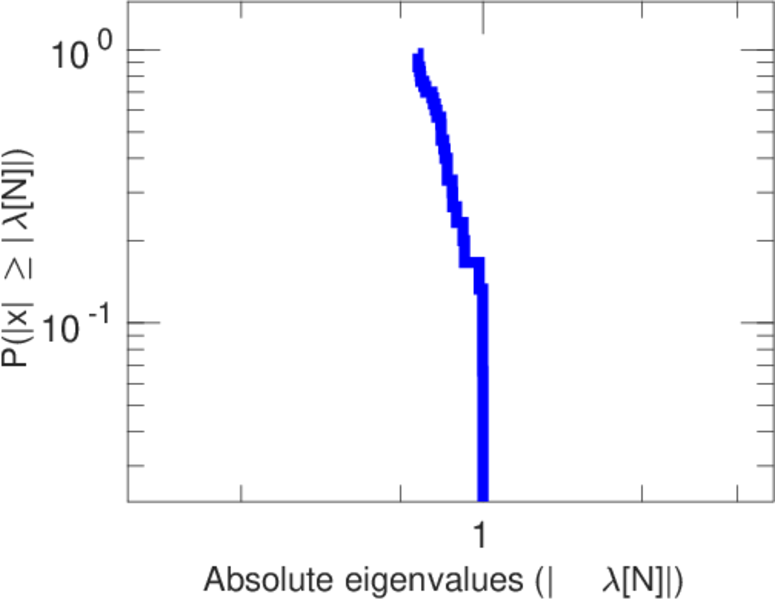
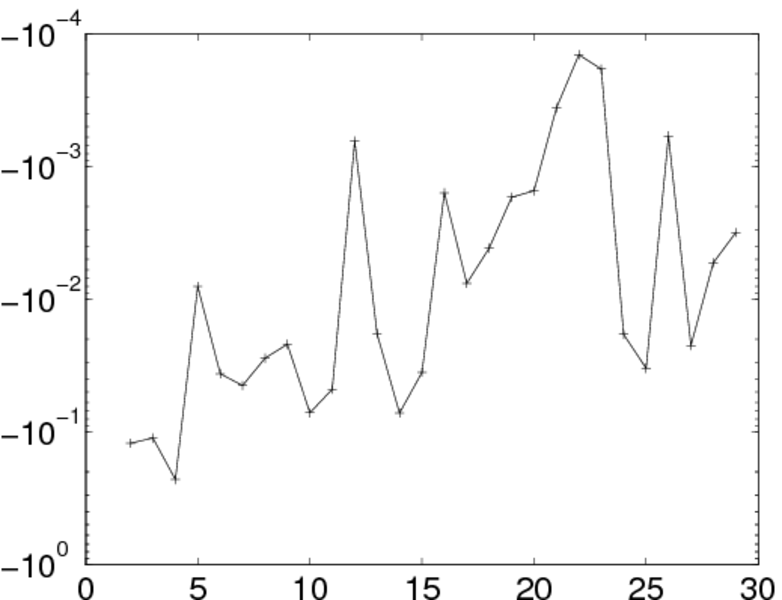
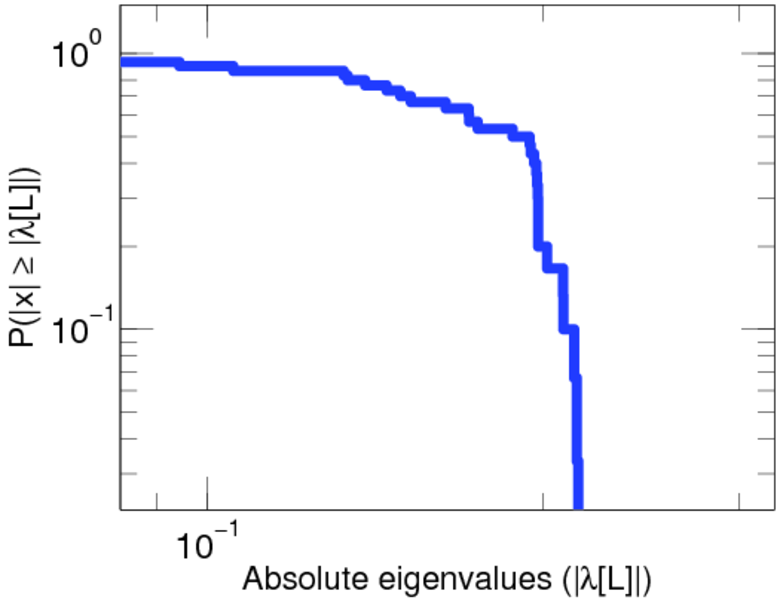
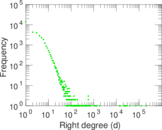
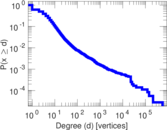
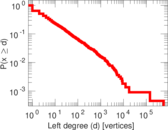
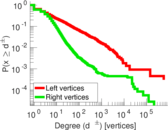
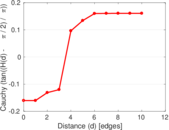
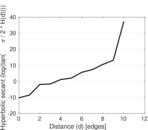
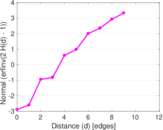
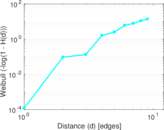
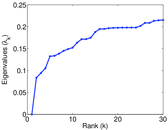
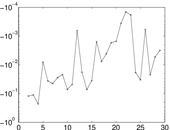
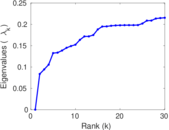
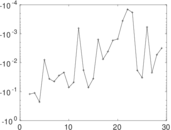
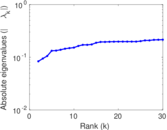
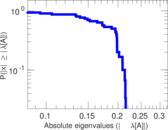
Plots


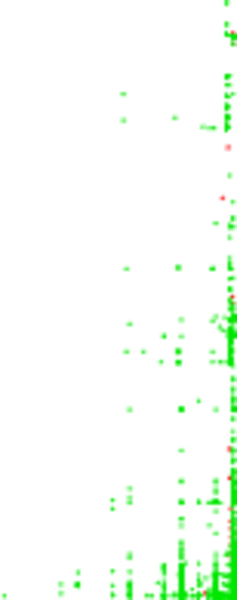
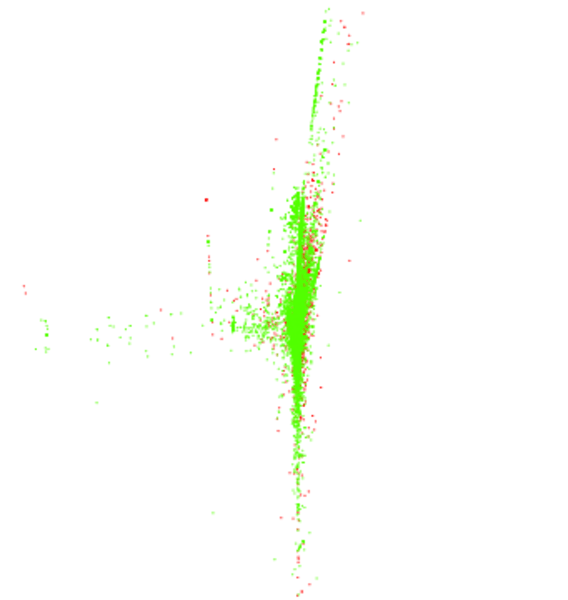
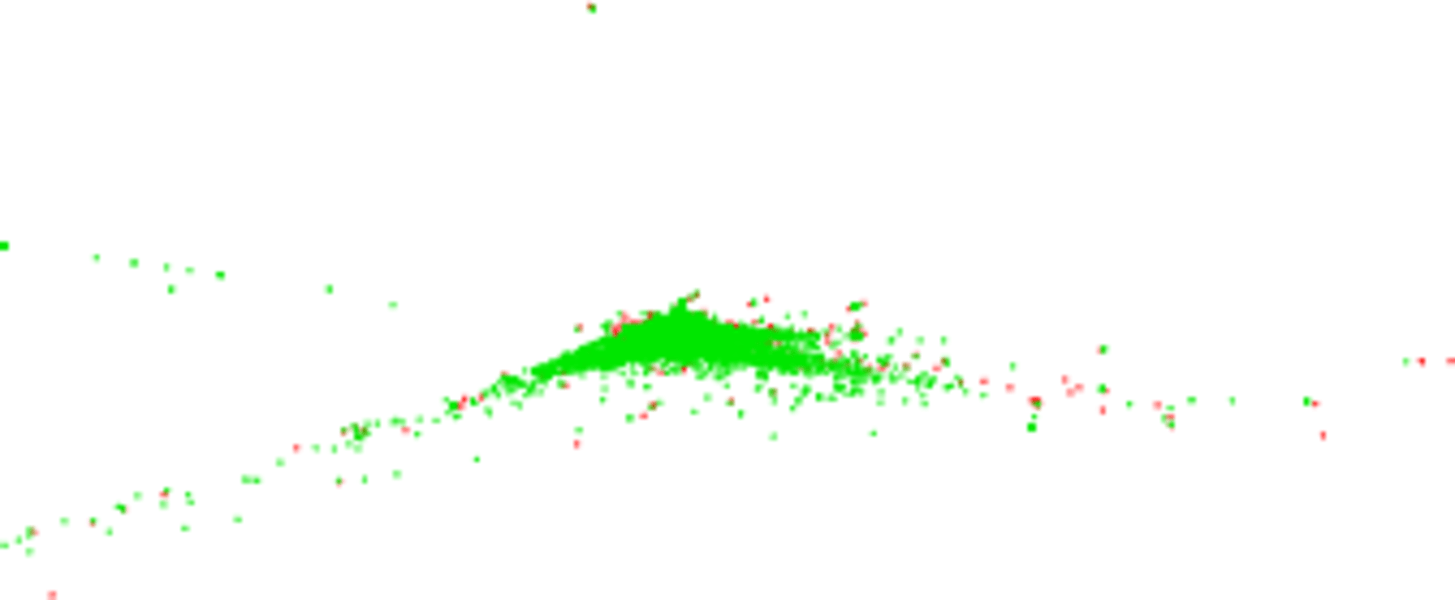
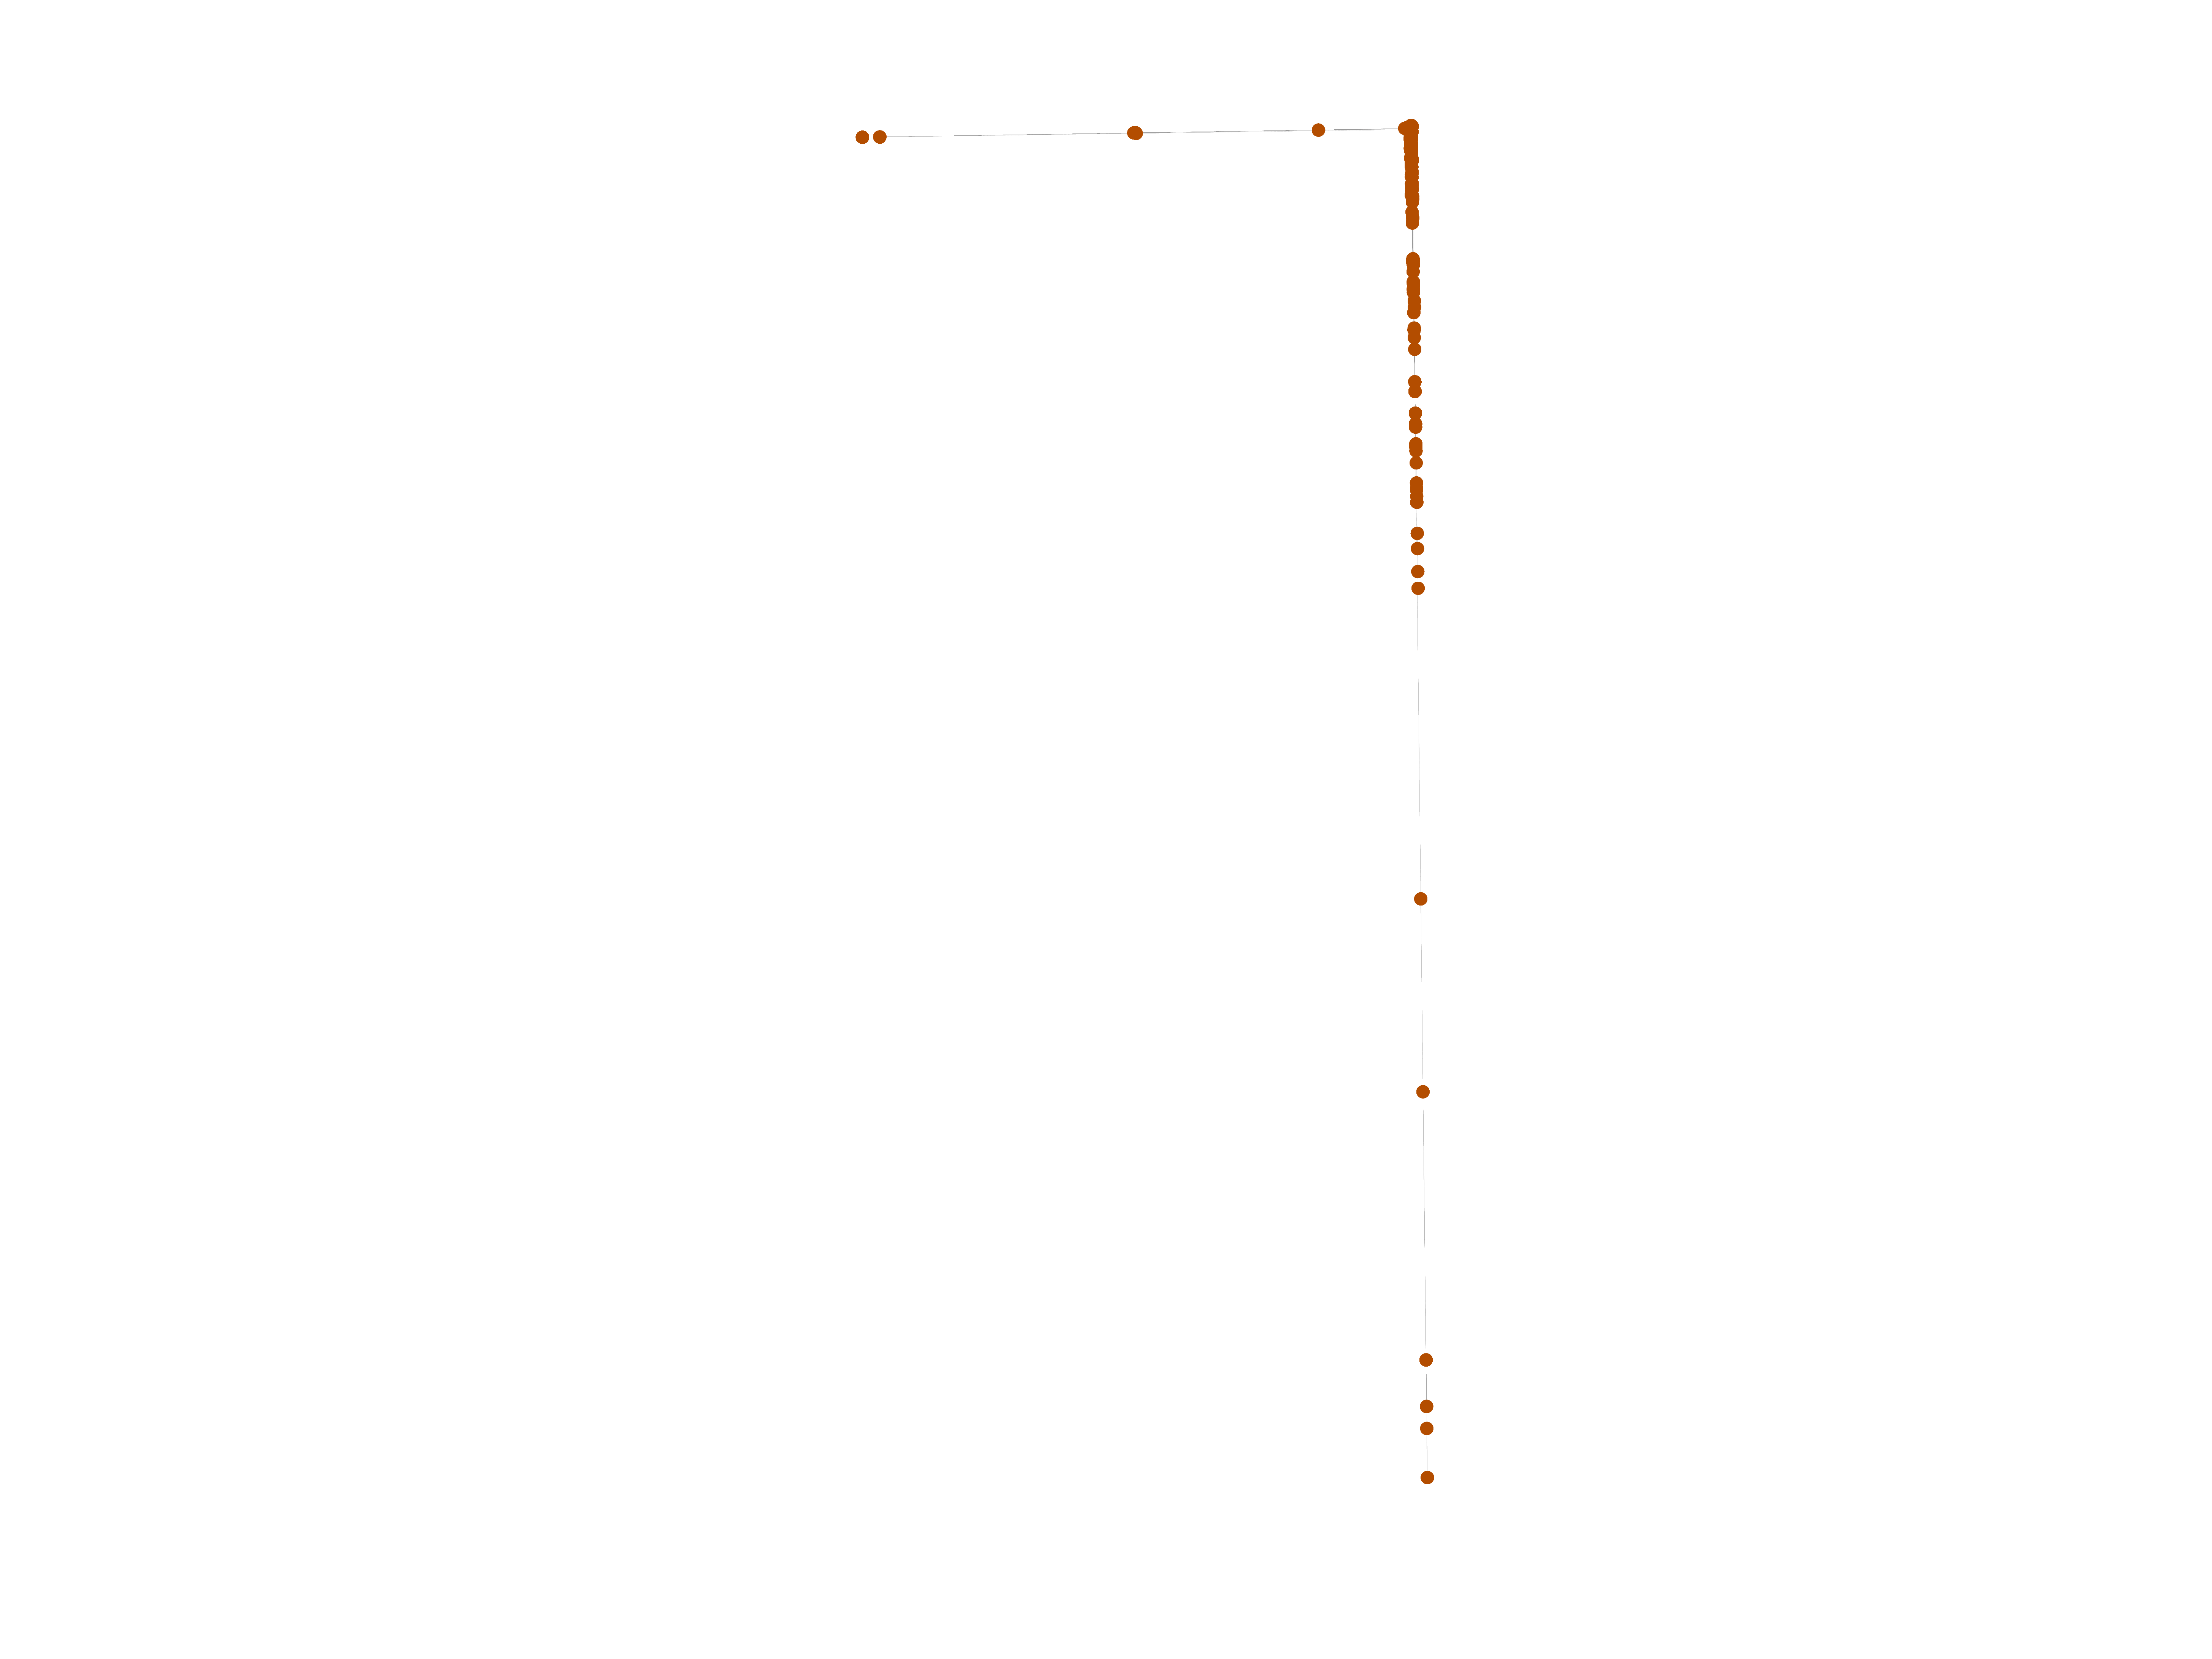
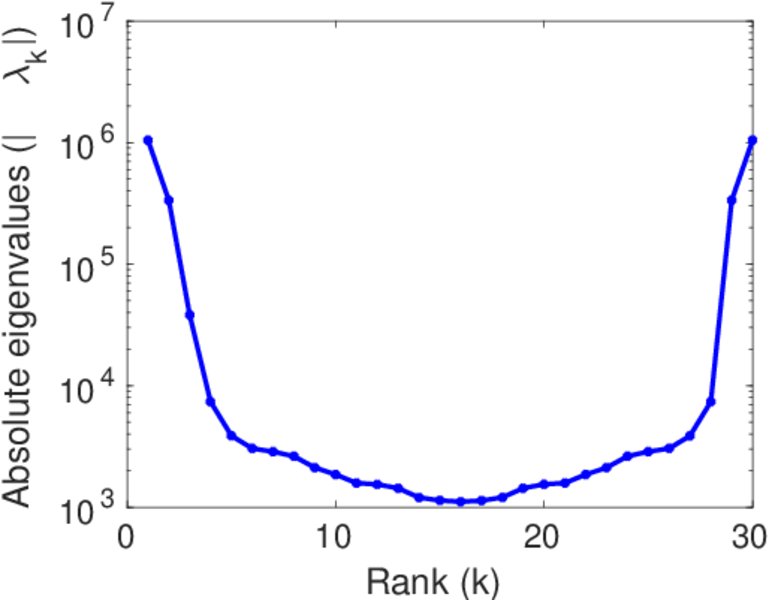
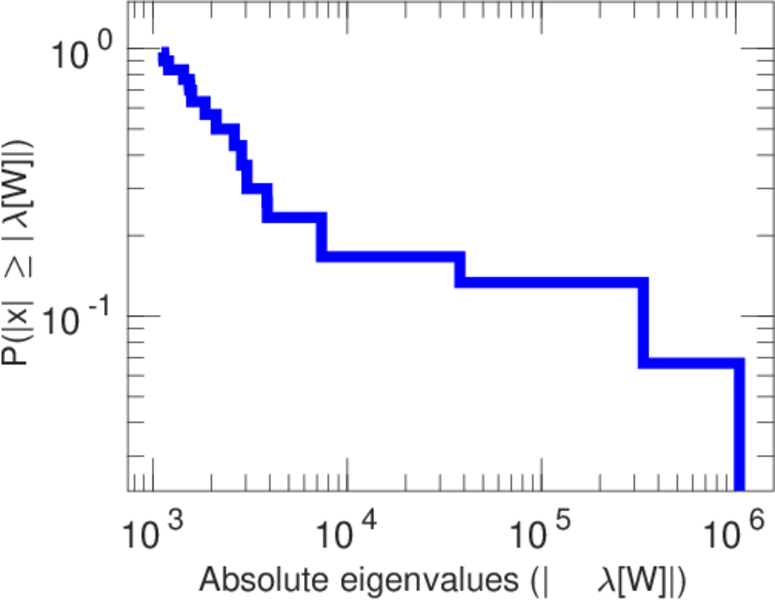
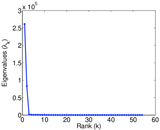
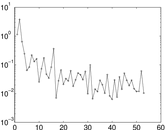
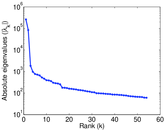
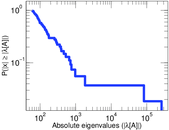
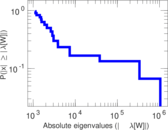
Matrix decompositions plots


Downloads
References
|
[1]
|
Jérôme Kunegis.
KONECT – The Koblenz Network Collection.
In Proc. Int. Conf. on World Wide Web Companion, pages
1343–1350, 2013.
[ http ]
|
|
[2]
|
Wikimedia Foundation.
Wikimedia downloads.
http://dumps.wikimedia.org/, January 2010.
|
 KONECT ‣ Networks ‣
Buy Me a Coffee
KONECT ‣ Networks ‣
Buy Me a Coffee