Wikiversity edits (it)
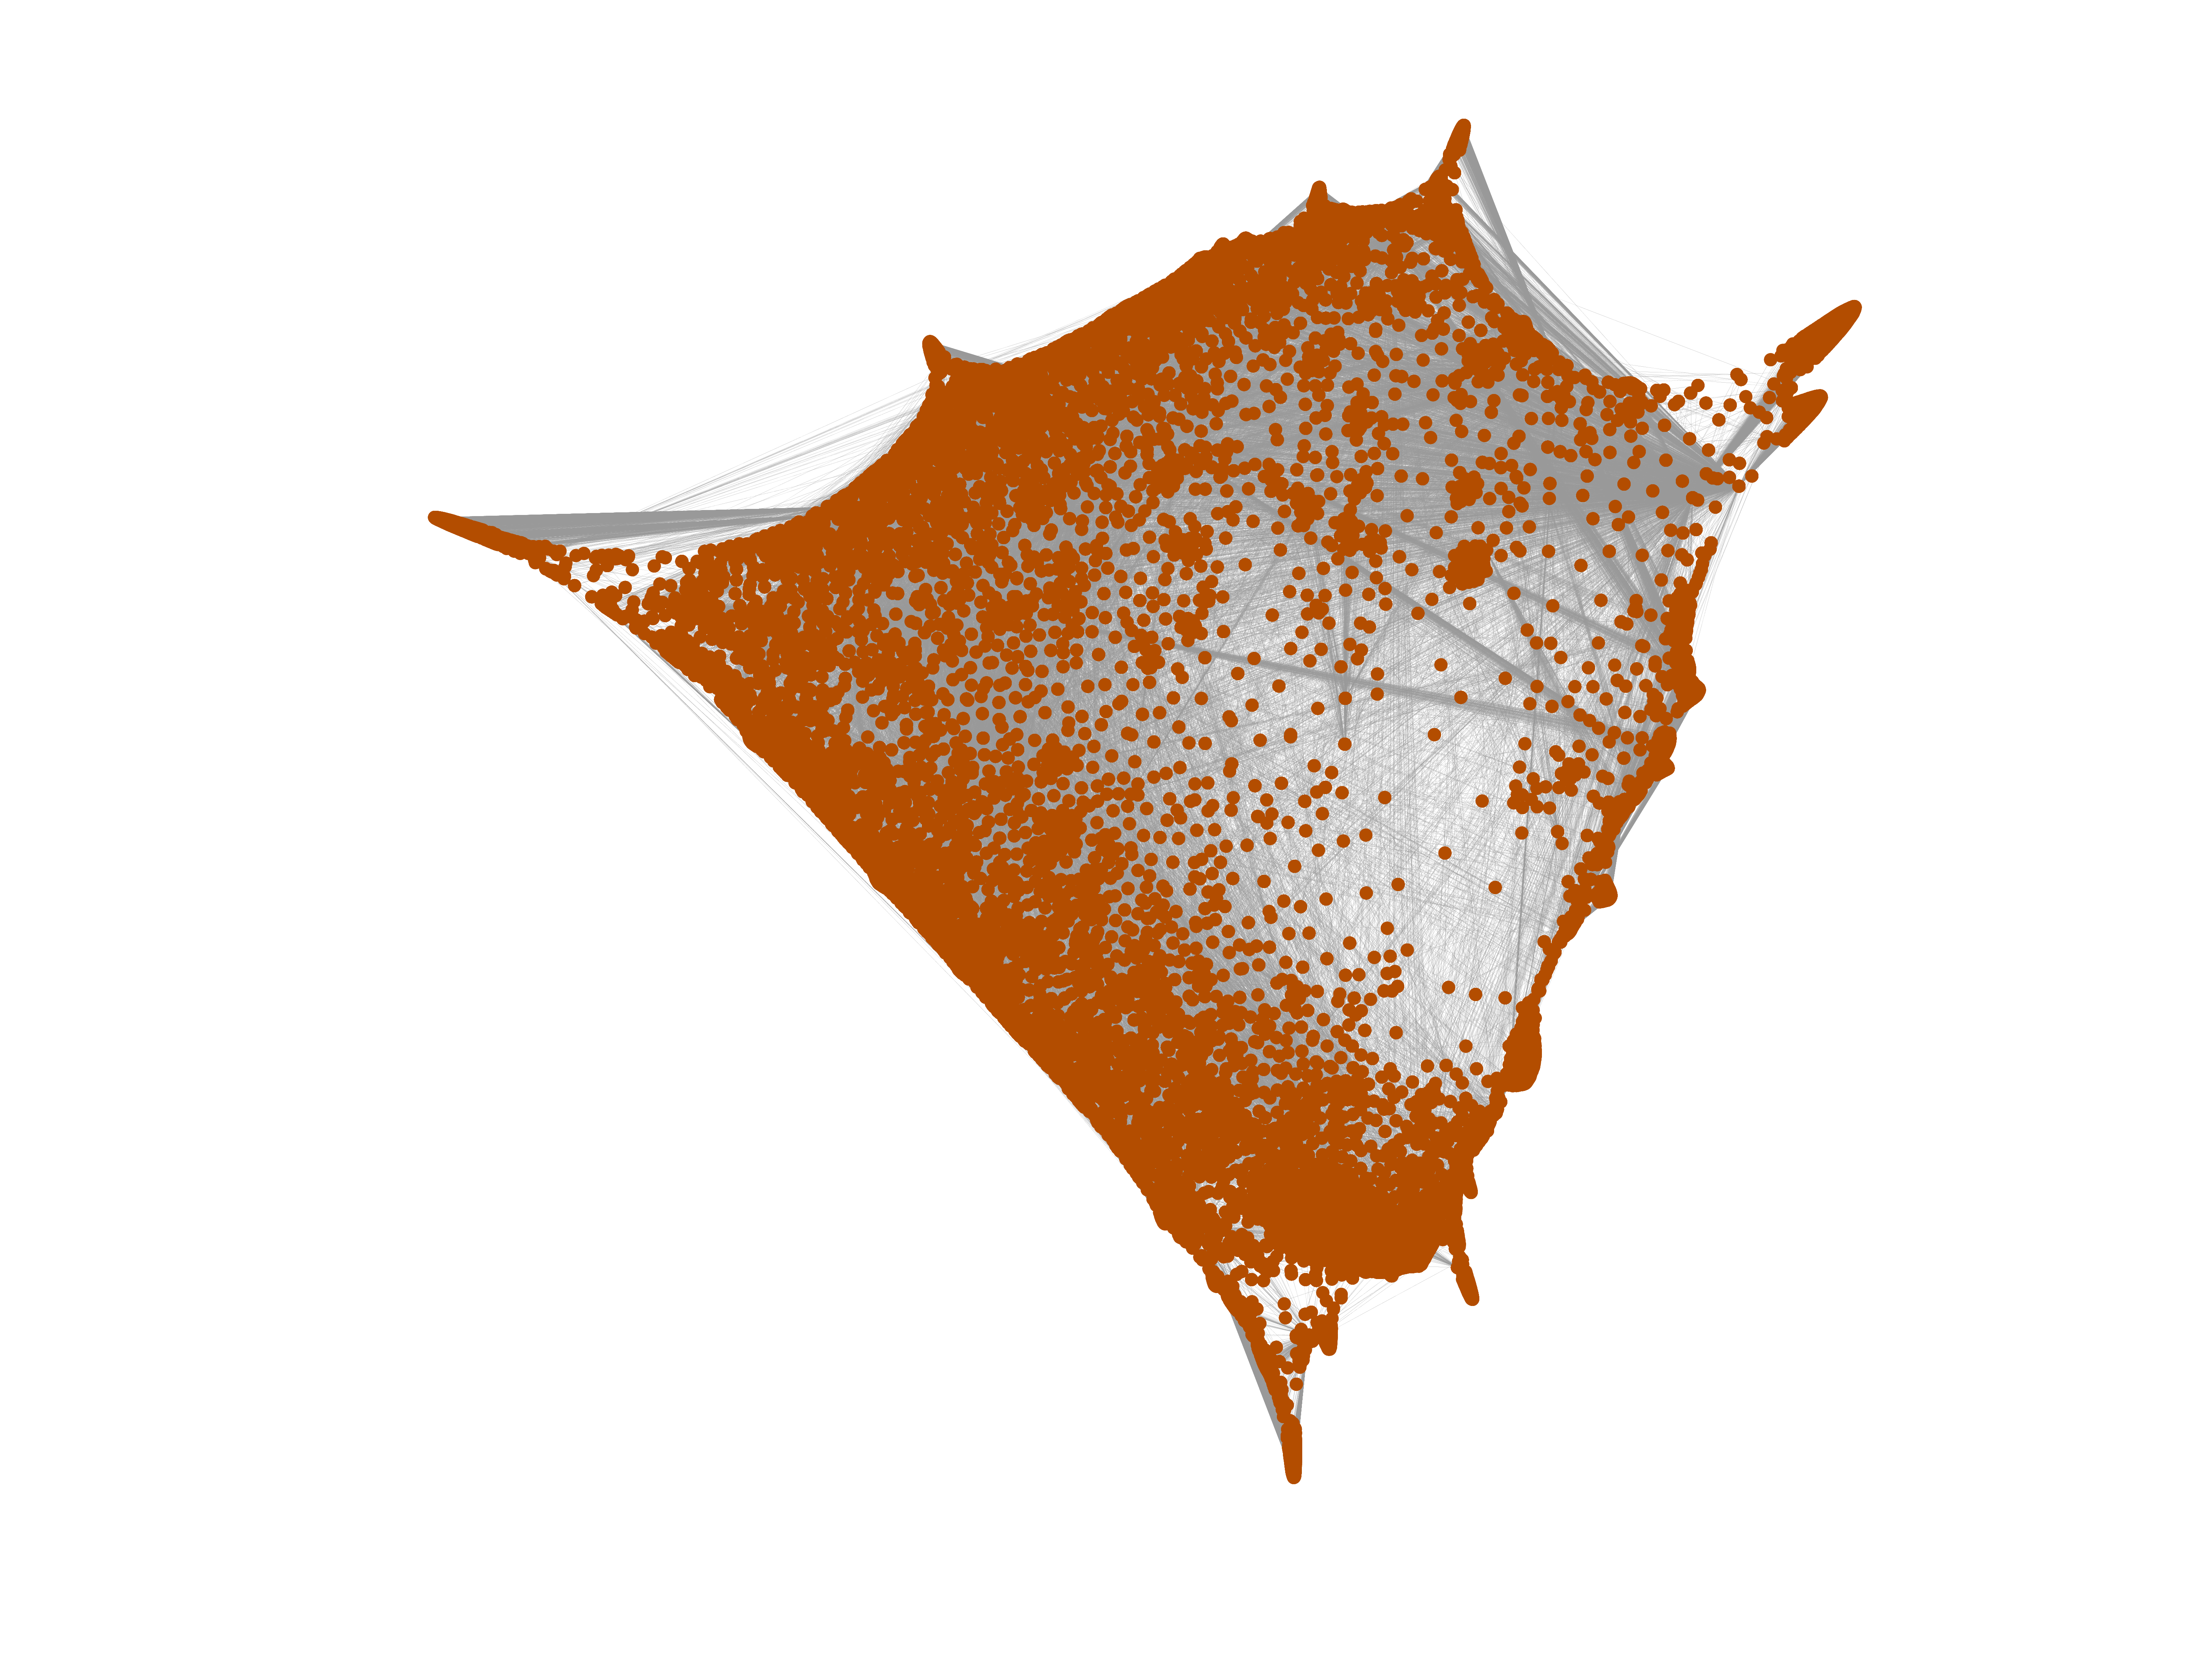
This is the bipartite edit network of the Italian Wikiversity. It contains
users and pages from the Italian Wikiversity, connected by edit events. Each
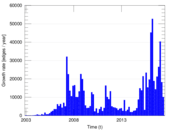
edge represents an edit. The dataset includes the timestamp of each edit.
Metadata
Statistics
| Size | n = | 21,860
|
| Left size | n1 = | 2,642
|
| Right size | n2 = | 19,218
|
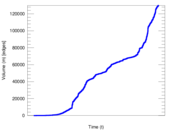
| Volume | m = | 129,951
|
| Unique edge count | m̿ = | 52,283
|
| Wedge count | s = | 40,621,111
|
| Claw count | z = | 34,545,364,233
|
| Cross count | x = | 24,584,513,681,455
|
| Square count | q = | 10,125,613
|
| 4-Tour count | T4 = | 243,612,274
|
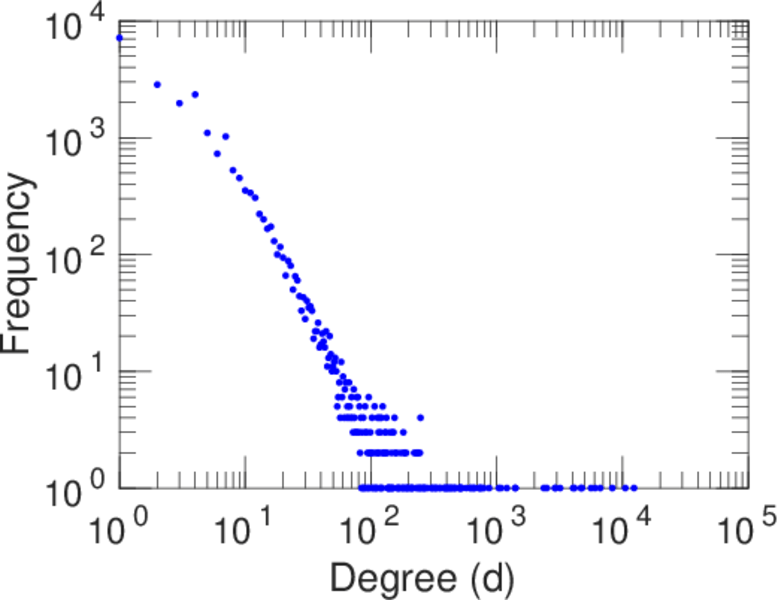
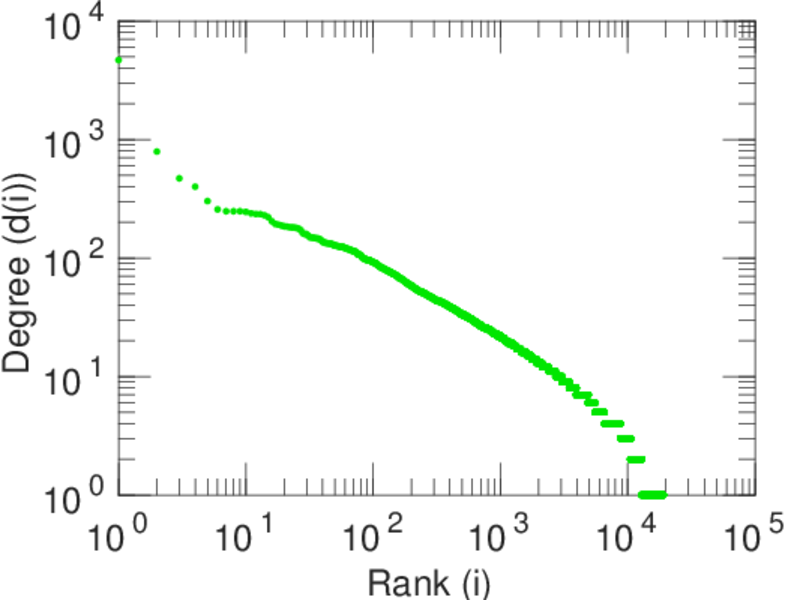
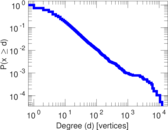
| Maximum degree | dmax = | 12,373
|
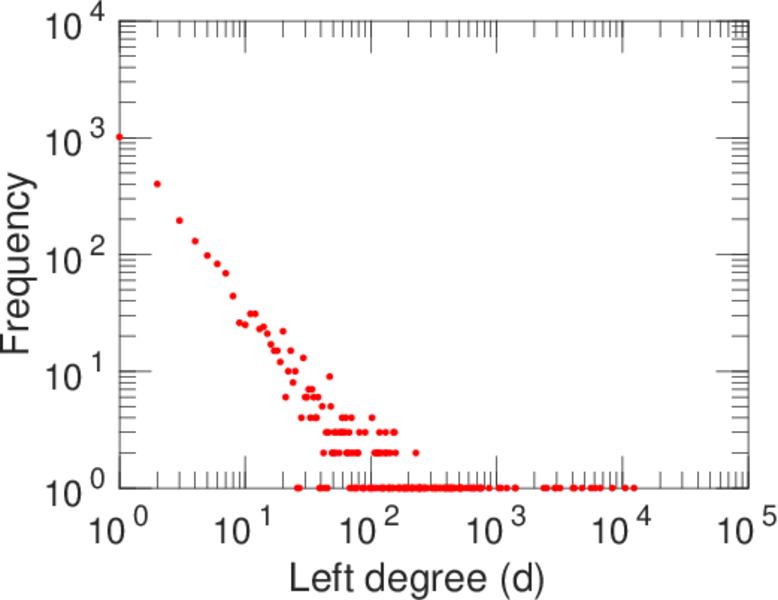
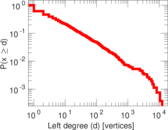
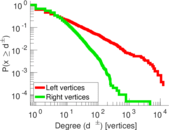
| Maximum left degree | d1max = | 12,373
|
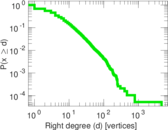
| Maximum right degree | d2max = | 4,682
|
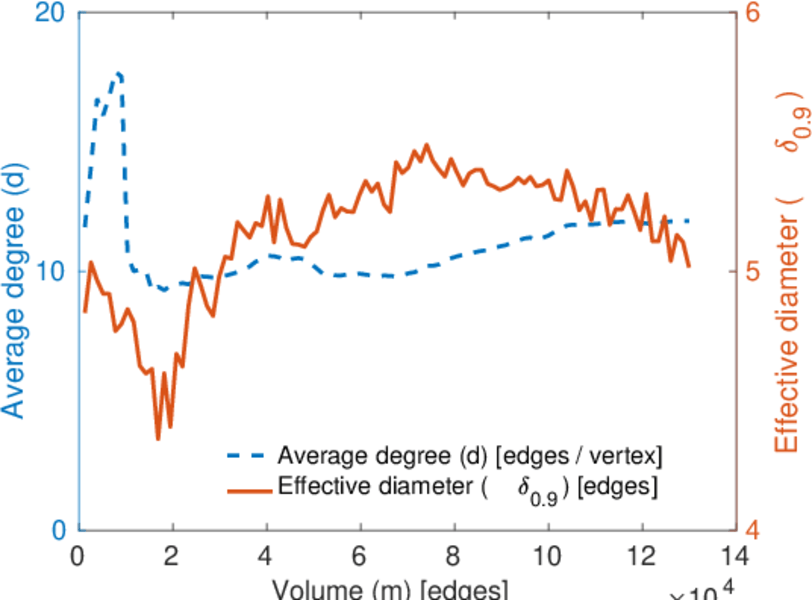
| Average degree | d = | 11.889 4
|
| Average left degree | d1 = | 49.186 6
|
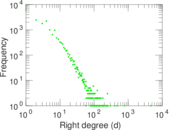
| Average right degree | d2 = | 6.761 94
|
| Fill | p = | 0.001 029 72
|
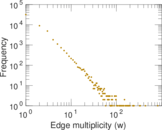
| Average edge multiplicity | m̃ = | 2.485 53
|
| Size of LCC | N = | 21,406
|
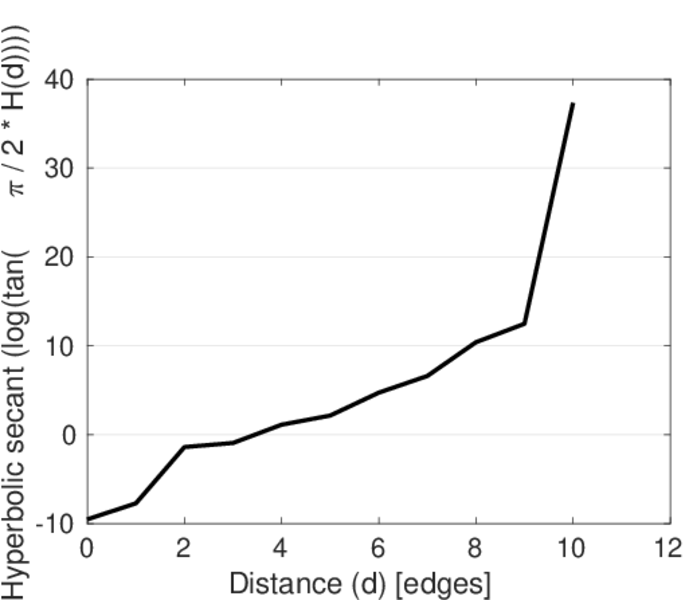
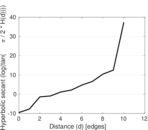
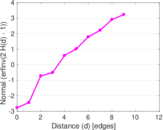
| Diameter | δ = | 11
|
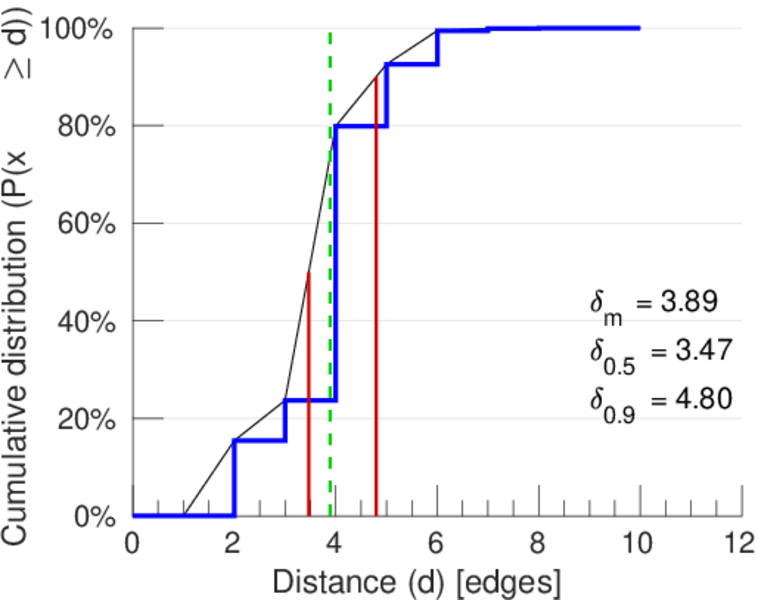
| 50-Percentile effective diameter | δ0.5 = | 3.468 52
|
| 90-Percentile effective diameter | δ0.9 = | 4.797 45
|
| Median distance | δM = | 4
|
| Mean distance | δm = | 3.890 89
|
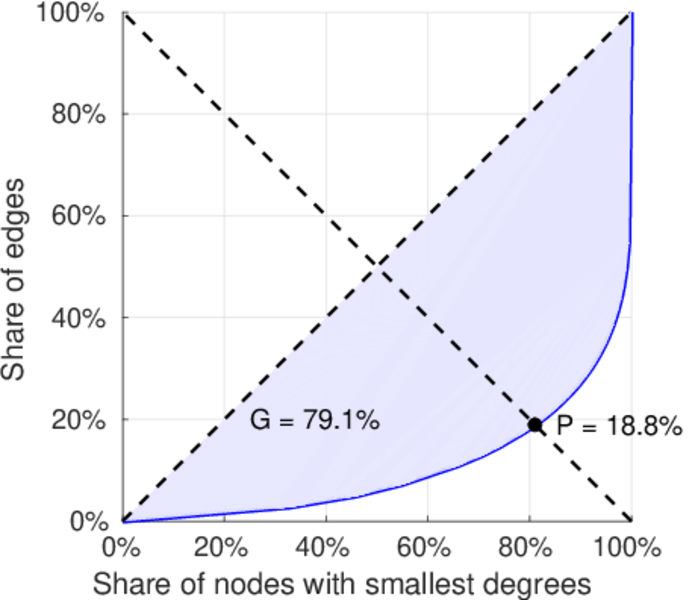
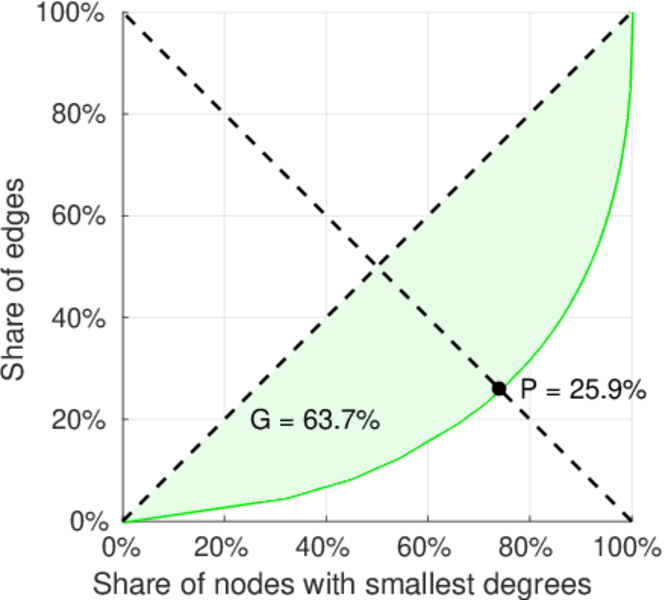
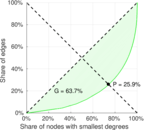
| Gini coefficient | G = | 0.789 122
|
| Balanced inequality ratio | P = | 0.187 378
|
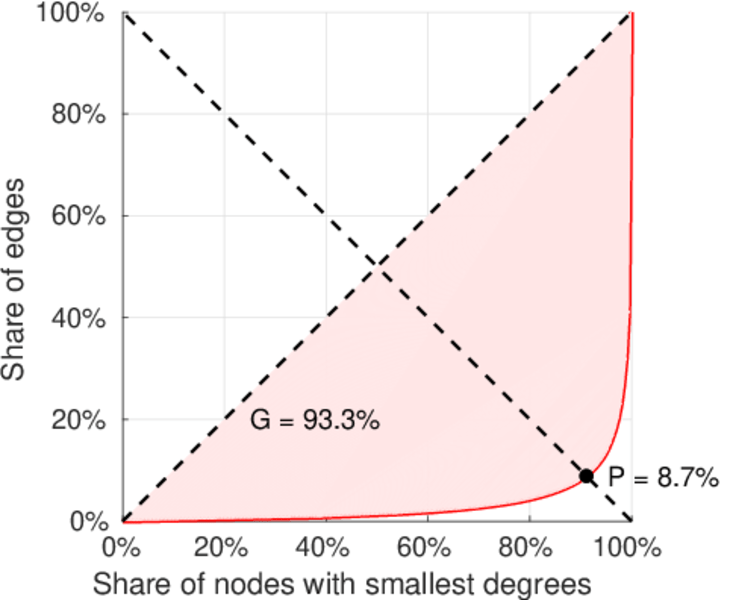
| Left balanced inequality ratio | P1 = | 0.087 302 1
|
| Right balanced inequality ratio | P2 = | 0.258 936
|
| Relative edge distribution entropy | Her = | 0.772 744
|
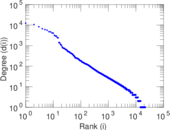
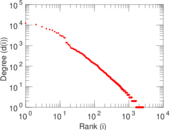
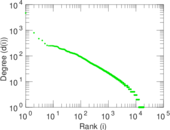
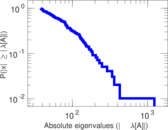
| Power law exponent | γ = | 2.462 34
|
| Tail power law exponent | γt = | 2.601 00
|
| Tail power law exponent with p | γ3 = | 2.601 00
|
| p-value | p = | 0.000 00
|
| Left tail power law exponent with p | γ3,1 = | 1.771 00
|
| Left p-value | p1 = | 0.626 000
|
| Right tail power law exponent with p | γ3,2 = | 3.181 00
|
| Right p-value | p2 = | 0.016 000 0
|
| Degree assortativity | ρ = | −0.227 764
|
| Degree assortativity p-value | pρ = | 0.000 00
|
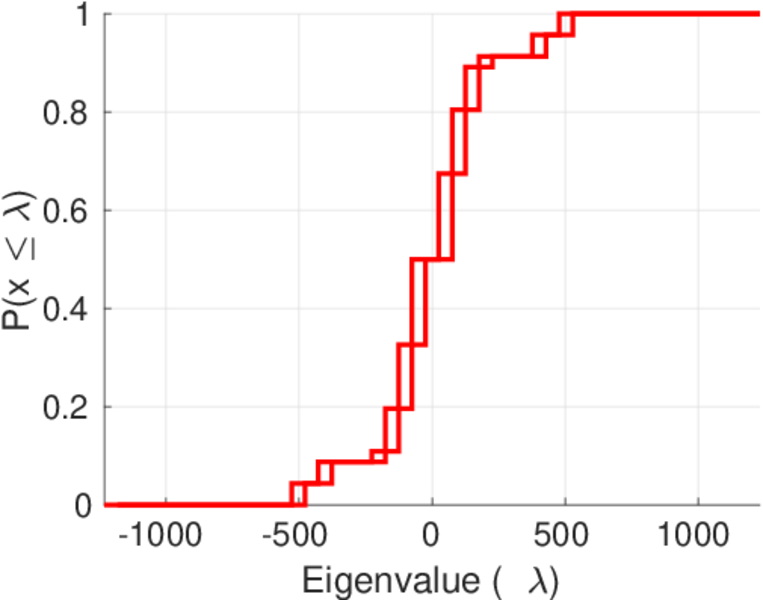
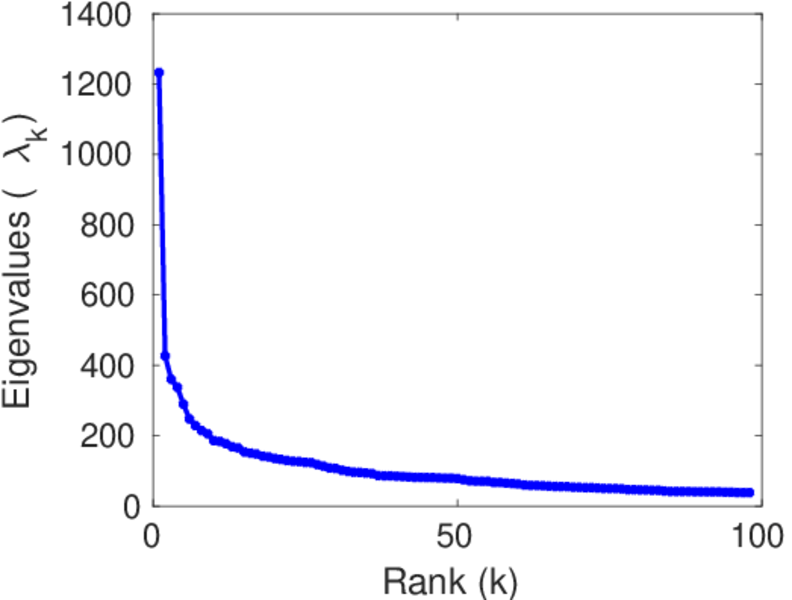
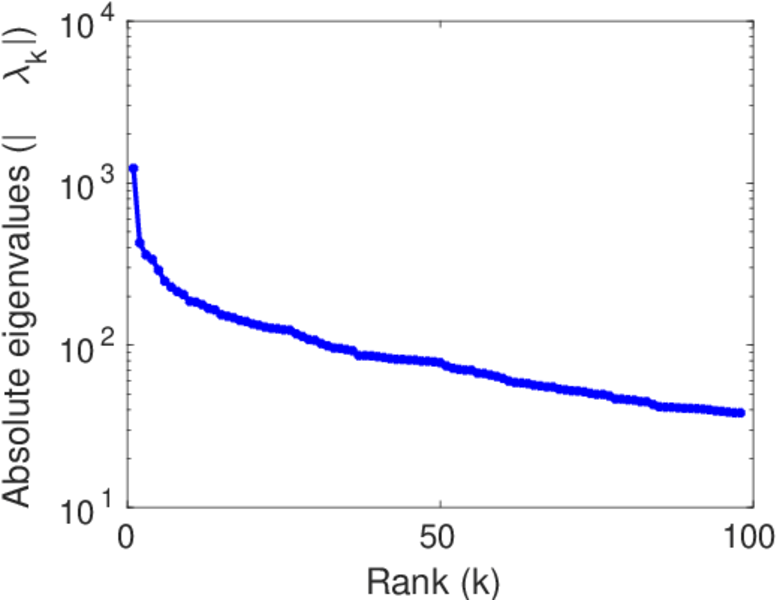
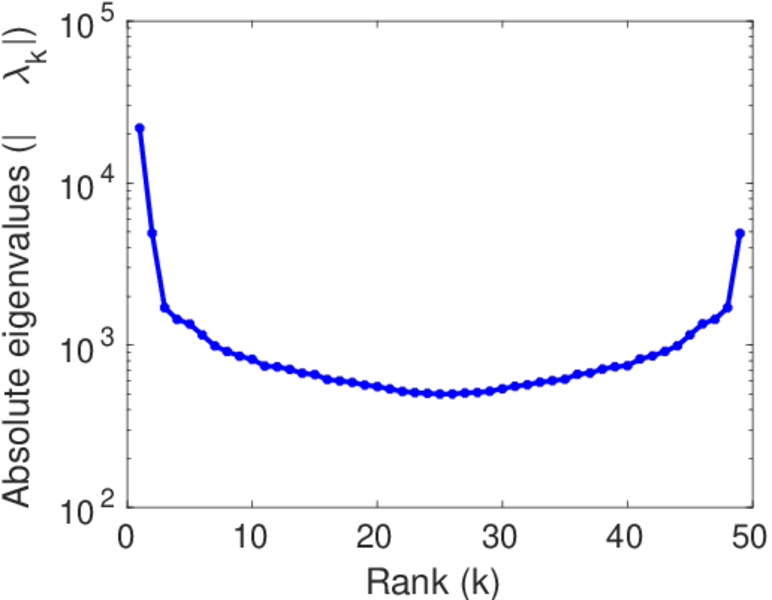
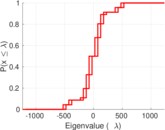
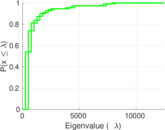
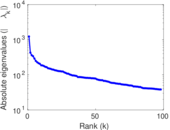
| Spectral norm | α = | 1,232.42
|
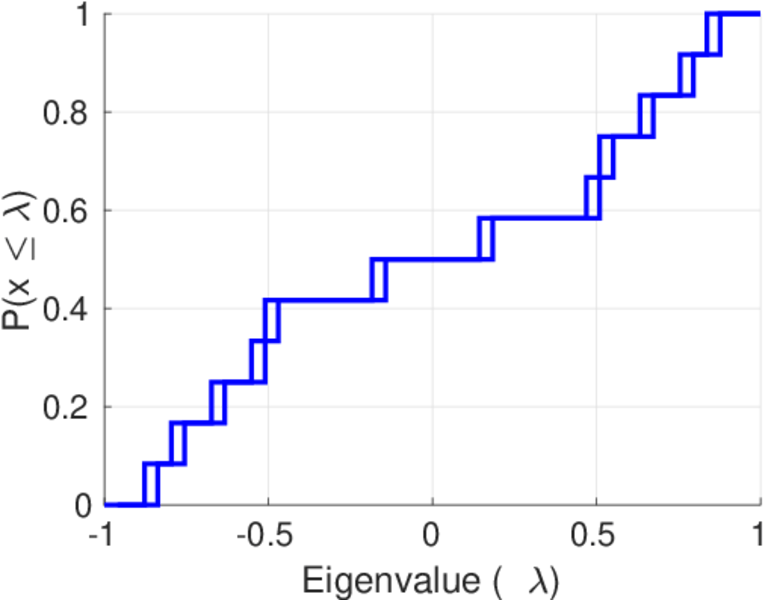
| Algebraic connectivity | a = | 0.069 922 0
|
| Spectral separation | |λ1[A] / λ2[A]| = | 2.884 70
|
| Controllability | C = | 18,159
|
| Relative controllability | Cr = | 0.834 513
|
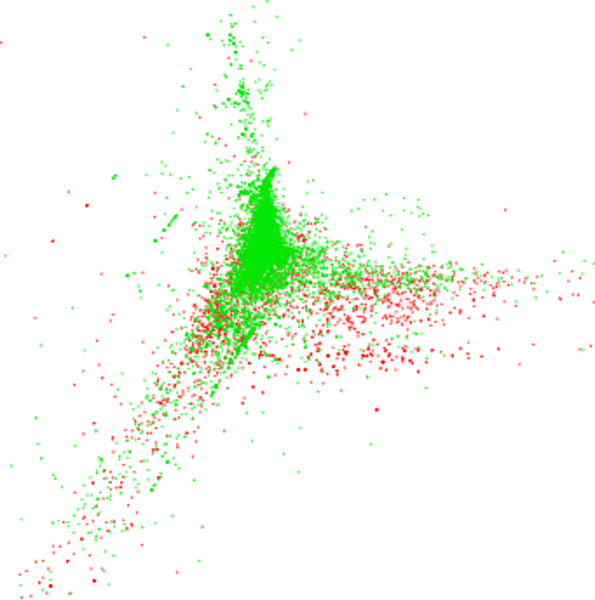
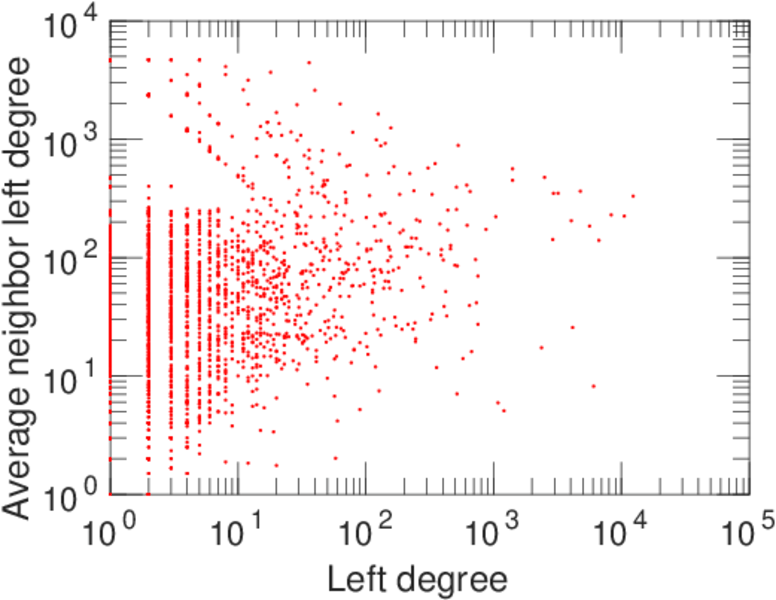
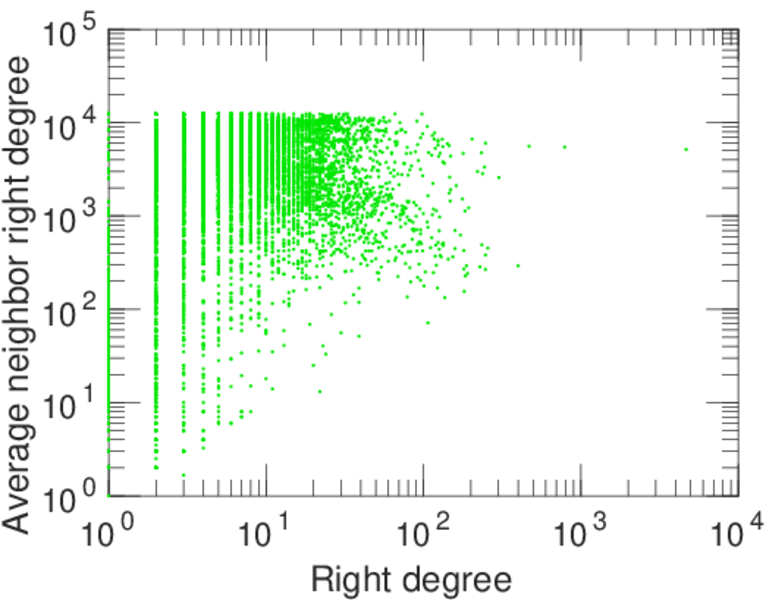
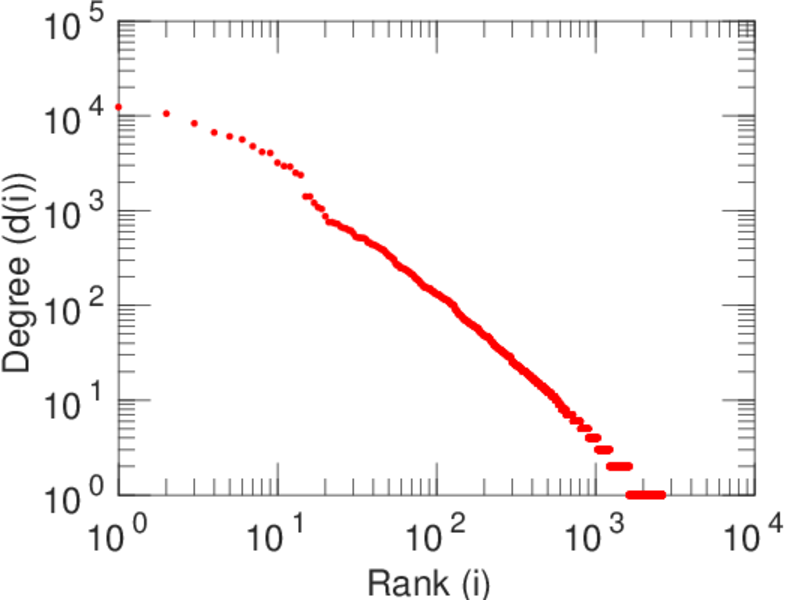
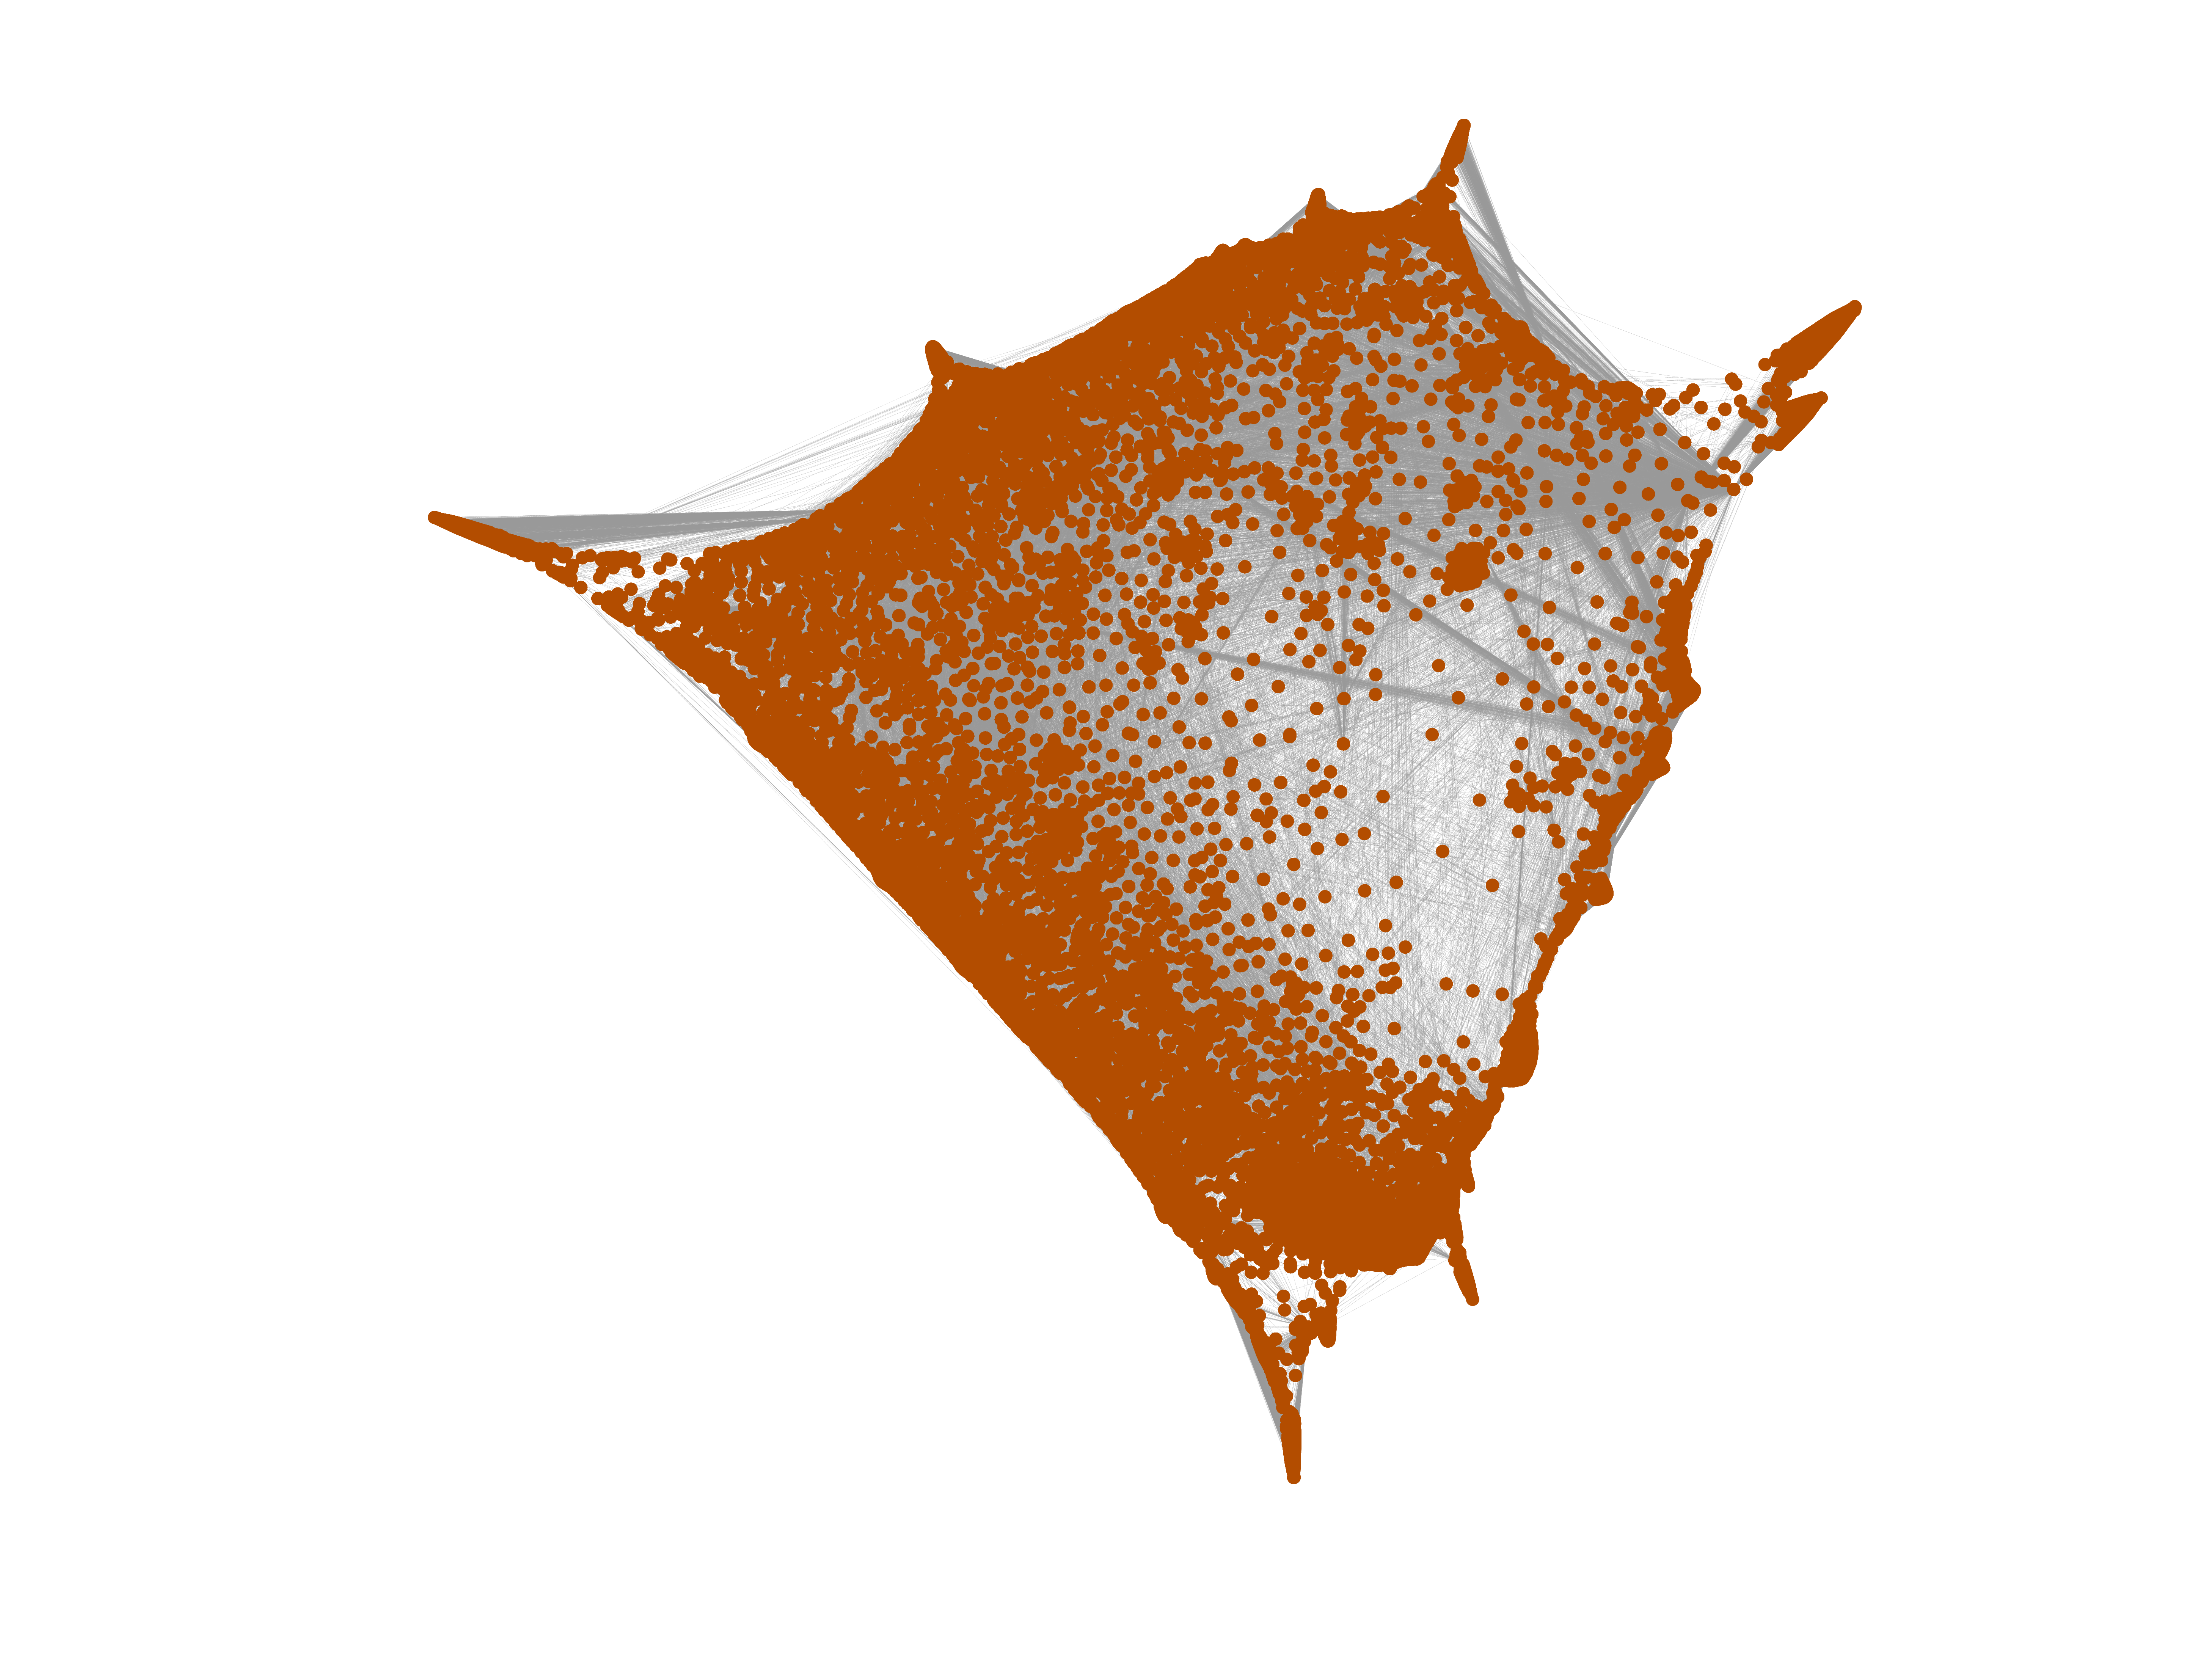
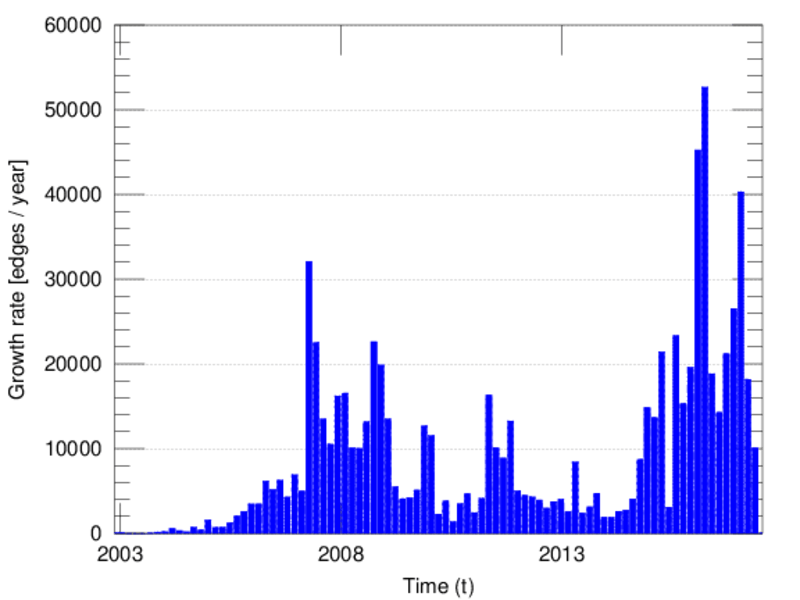
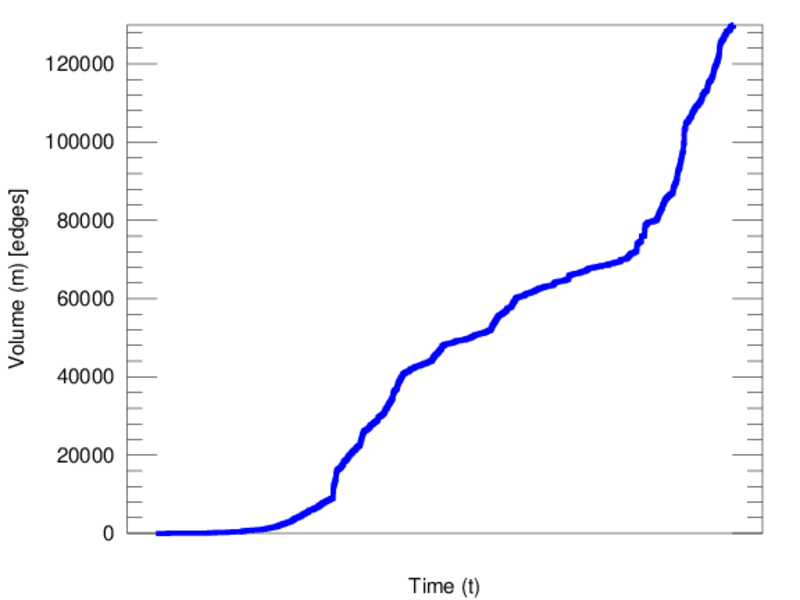
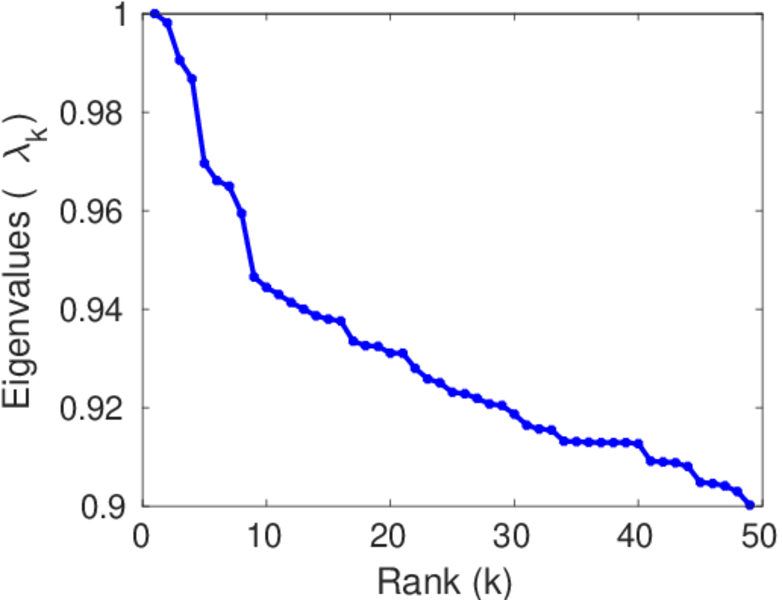
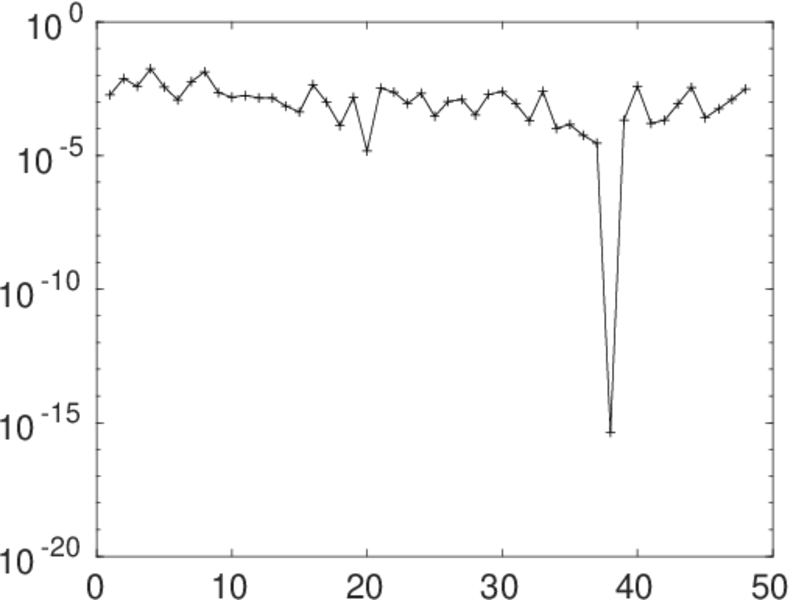
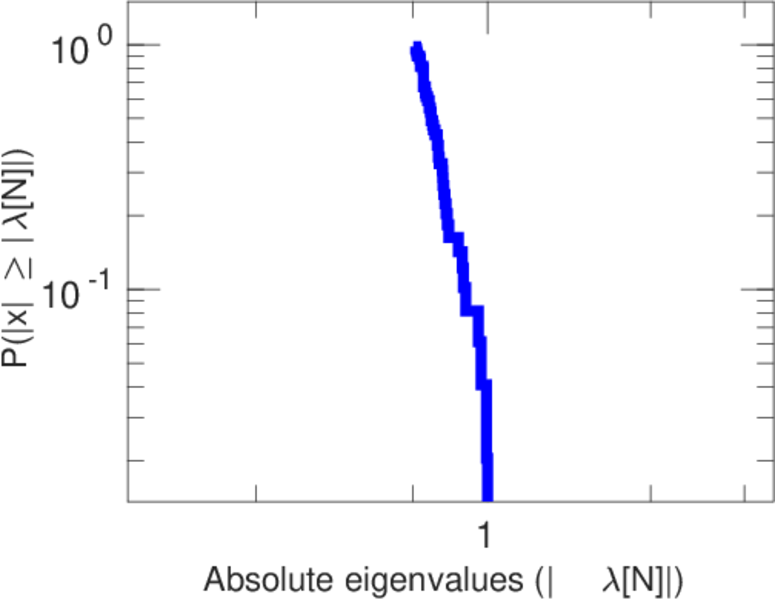
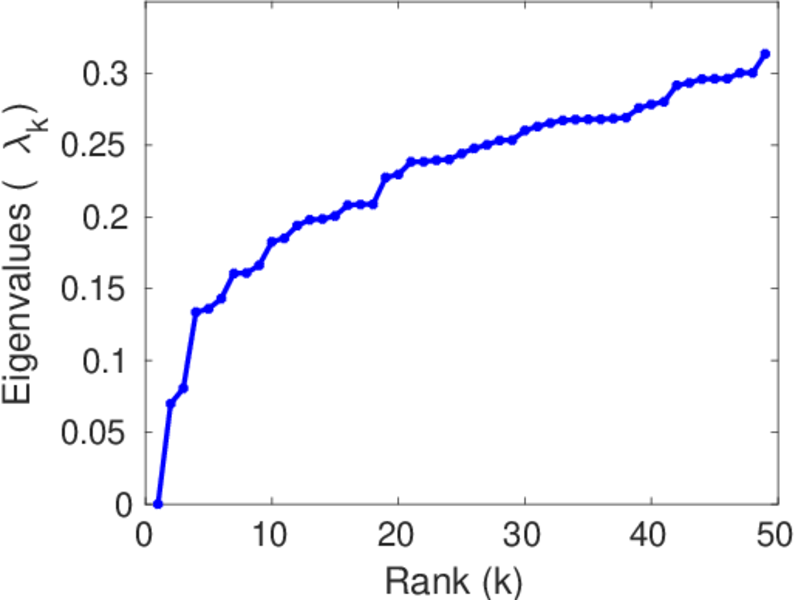
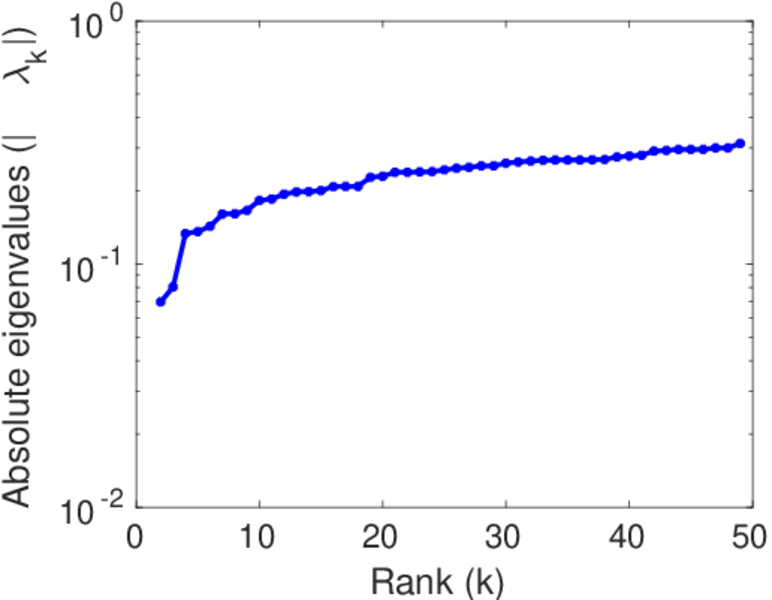
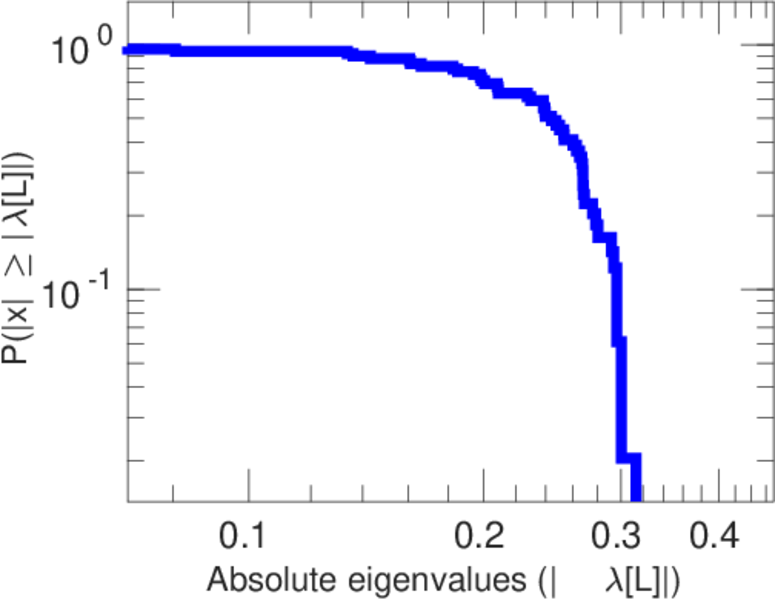
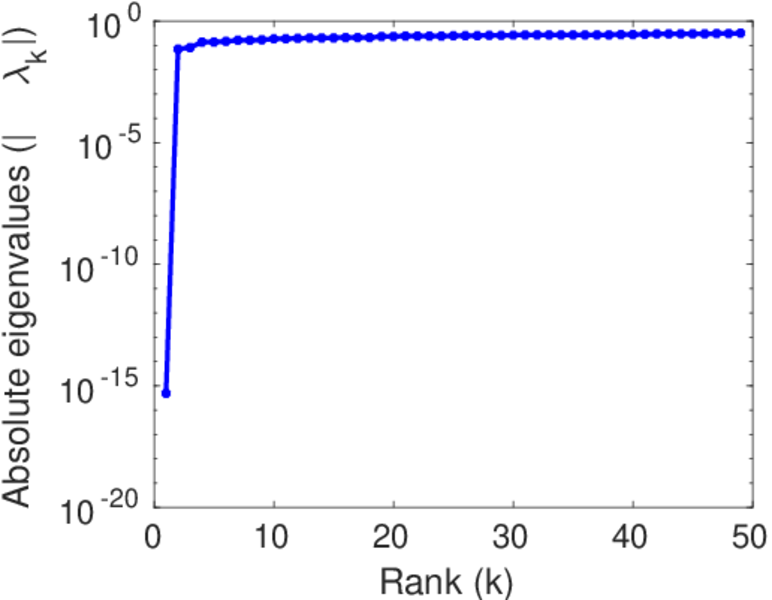
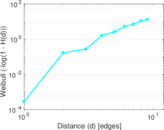
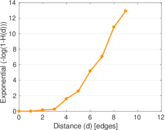
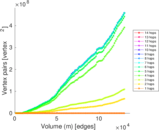
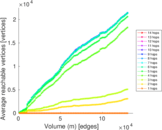
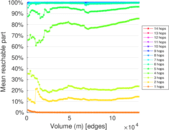
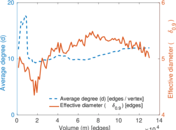
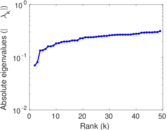
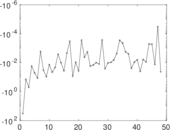
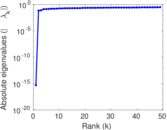
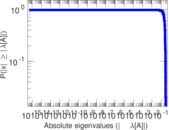
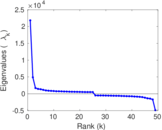
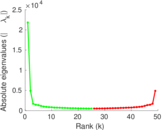
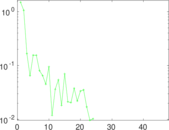
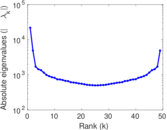
Plots


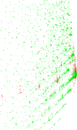

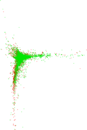


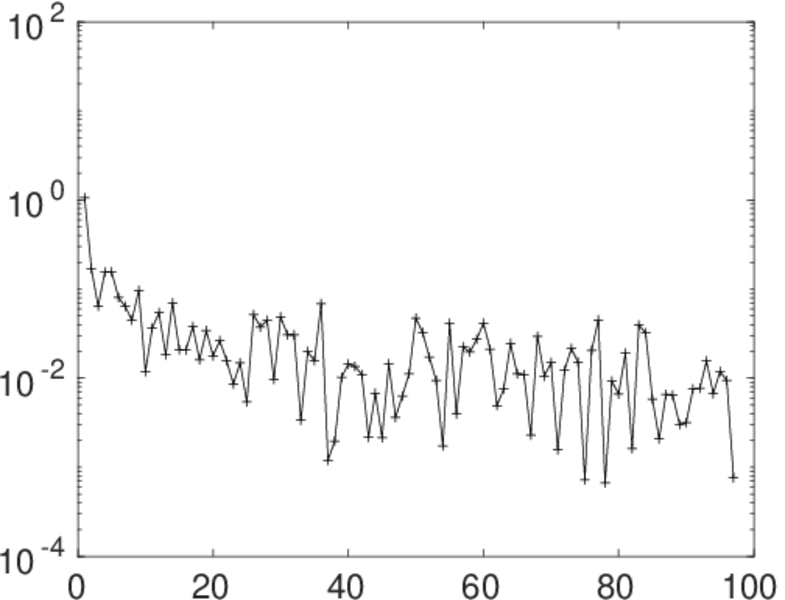
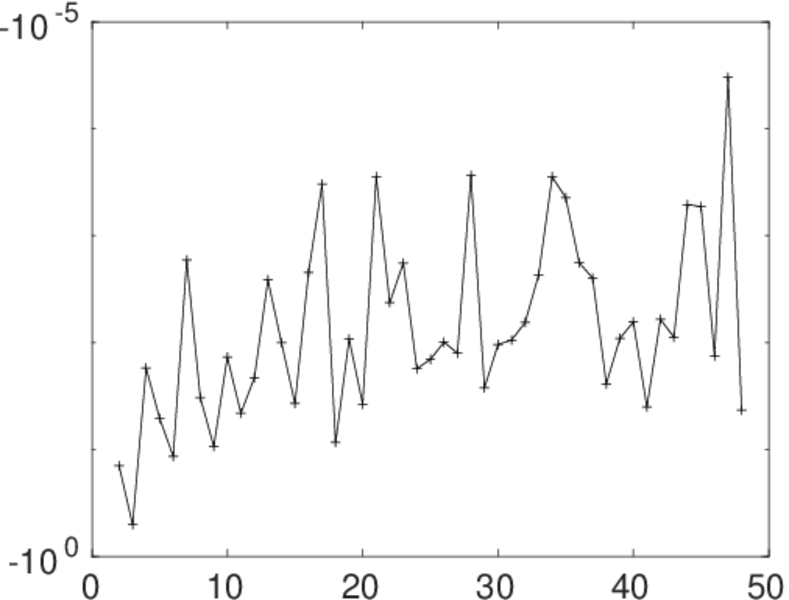
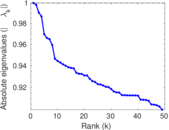
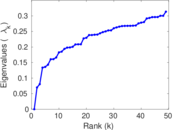
Matrix decompositions plots


Downloads
References
|
[1]
|
Jérôme Kunegis.
KONECT – The Koblenz Network Collection.
In Proc. Int. Conf. on World Wide Web Companion, pages
1343–1350, 2013.
[ http ]
|
|
[2]
|
Wikimedia Foundation.
Wikimedia downloads.
http://dumps.wikimedia.org/, January 2010.
|
 KONECT ‣ Networks ‣
Buy Me a Coffee
KONECT ‣ Networks ‣
Buy Me a Coffee