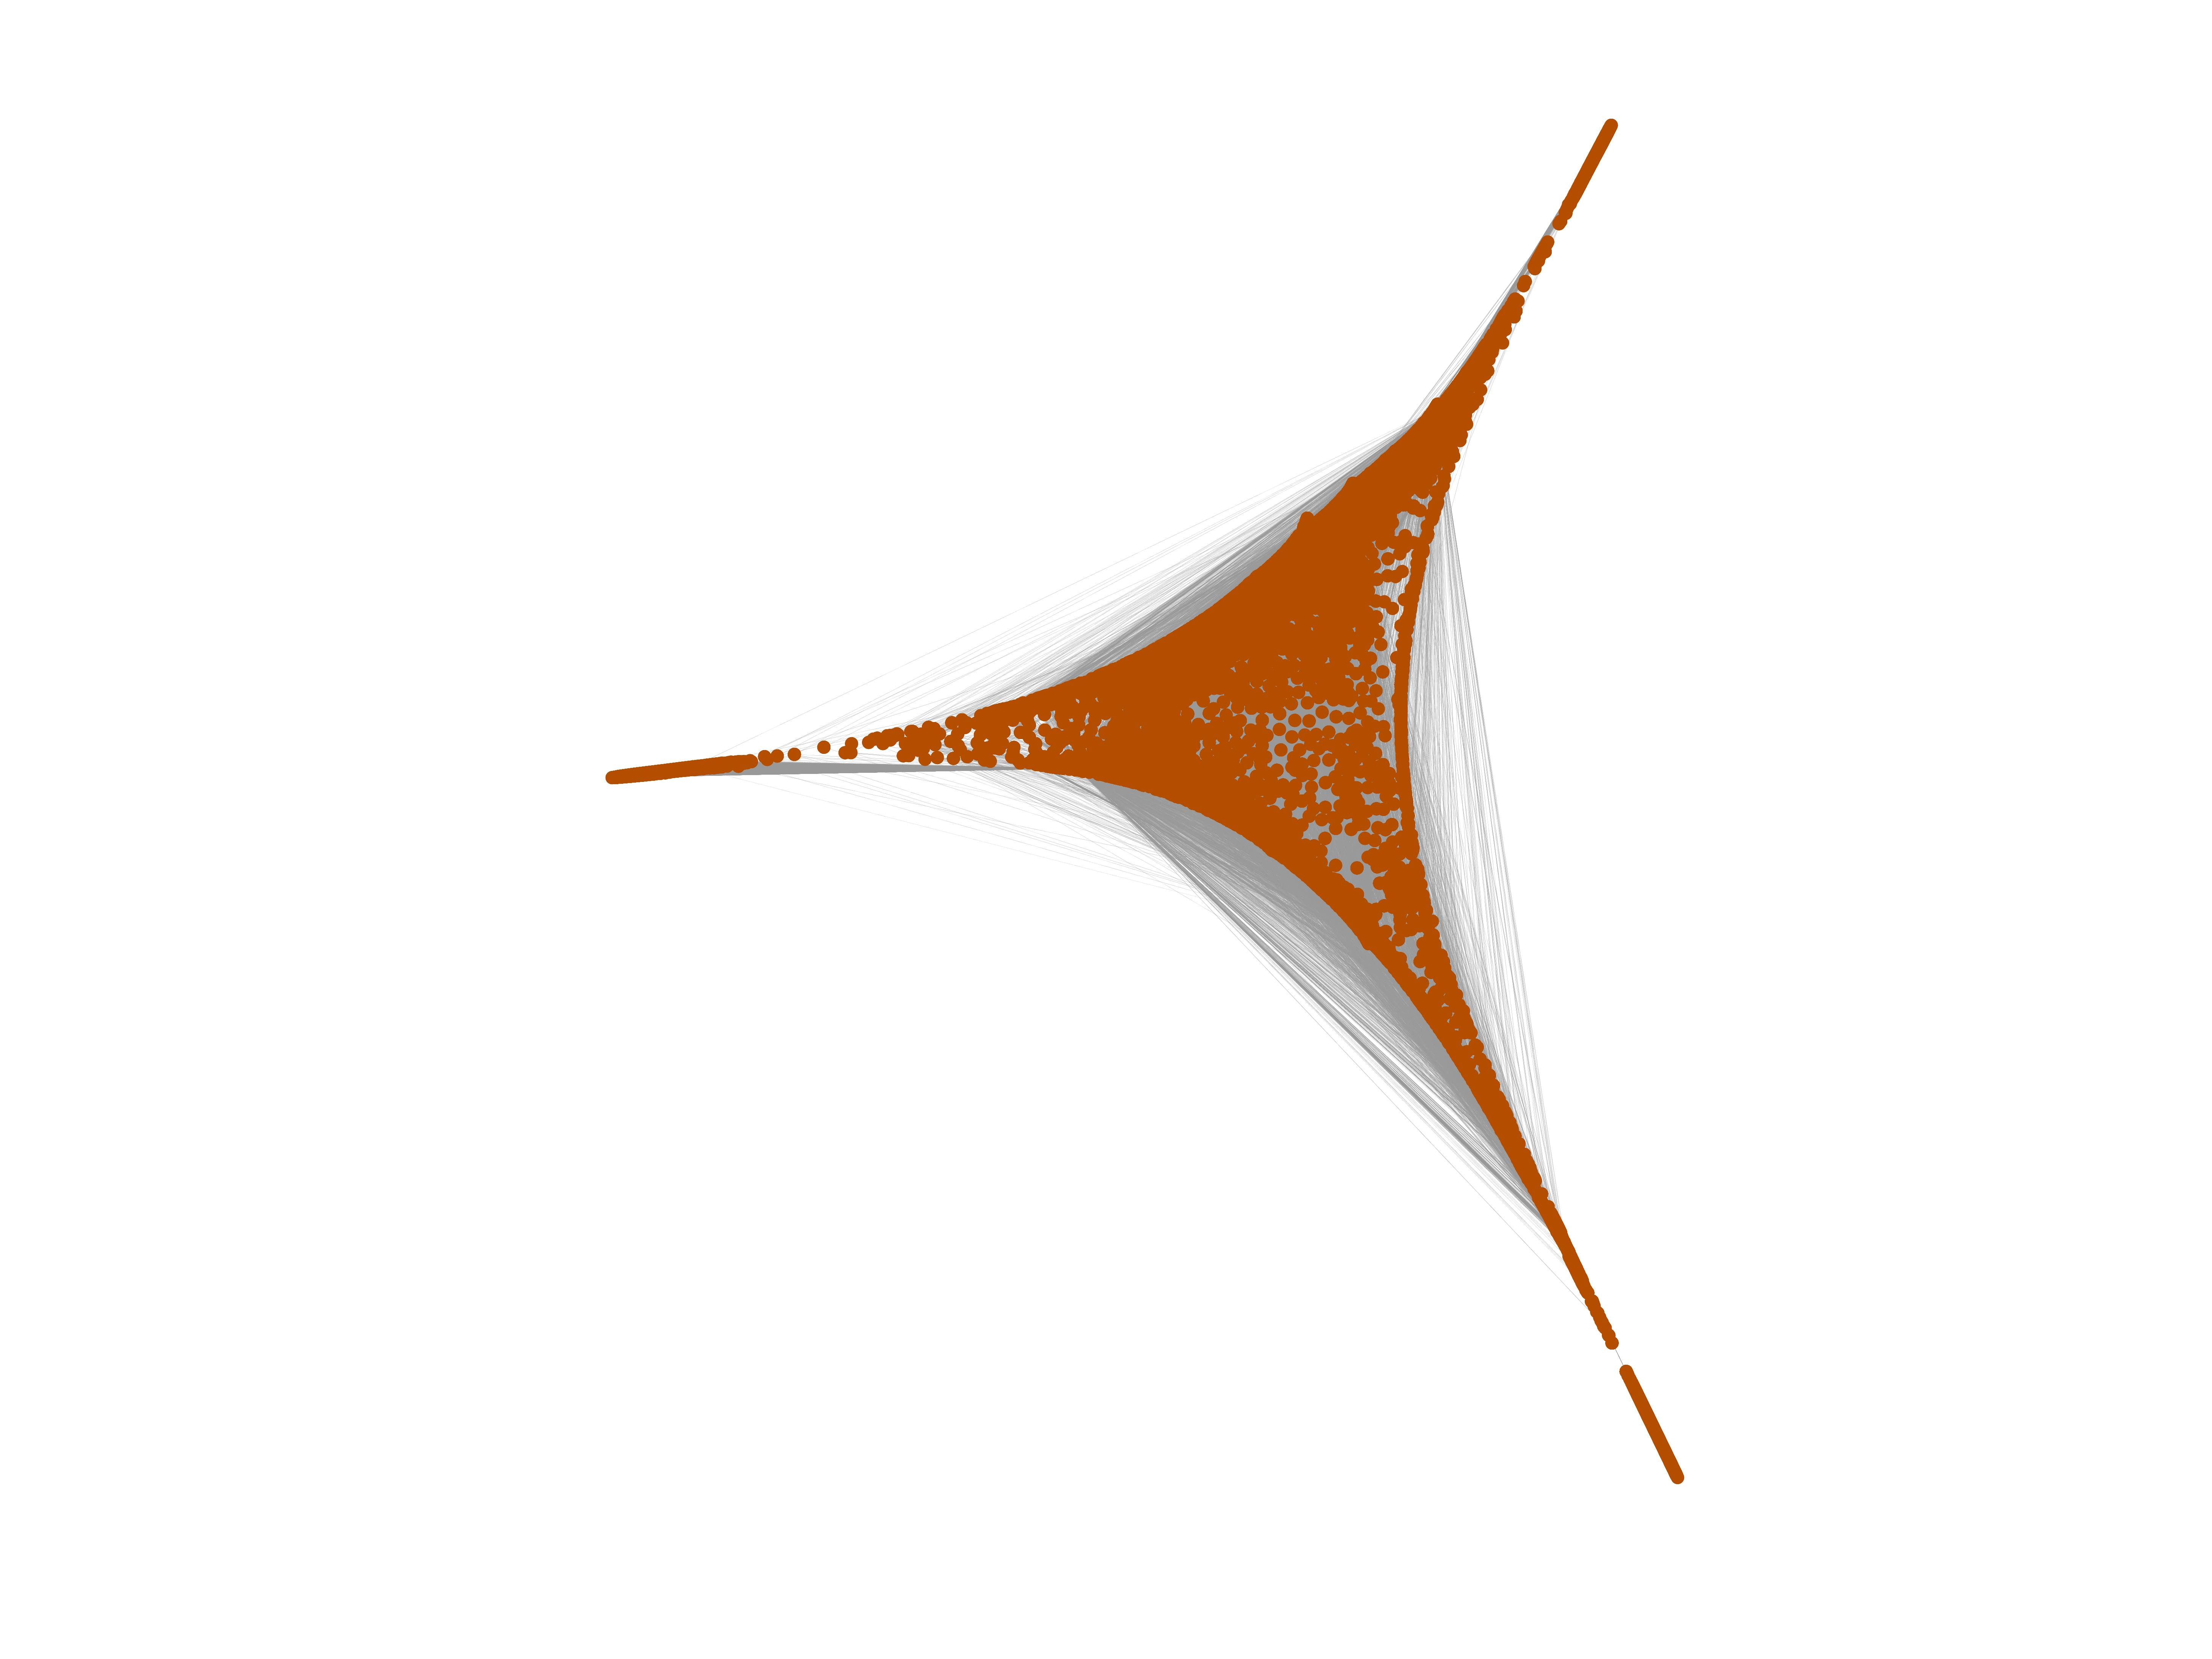
Wikivoyage edits (it)
This is the bipartite edit network of the Italian Wikivoyage. It contains users
and pages from the Italian Wikivoyage, connected by edit events. Each edge
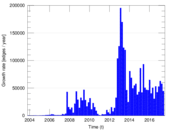
represents an edit. The dataset includes the timestamp of each edit.
Metadata
Statistics
| Size | n = | 31,501
|
| Left size | n1 = | 2,538
|
| Right size | n2 = | 28,963
|
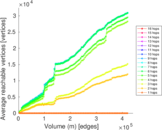
| Volume | m = | 419,474
|
| Unique edge count | m̿ = | 80,998
|
| Wedge count | s = | 233,719,503
|
| Claw count | z = | 947,377,766,551
|
| Cross count | x = | 3,370,127,980,678,628
|
| Square count | q = | 121,744,148
|
| 4-Tour count | T4 = | 1,909,097,784
|
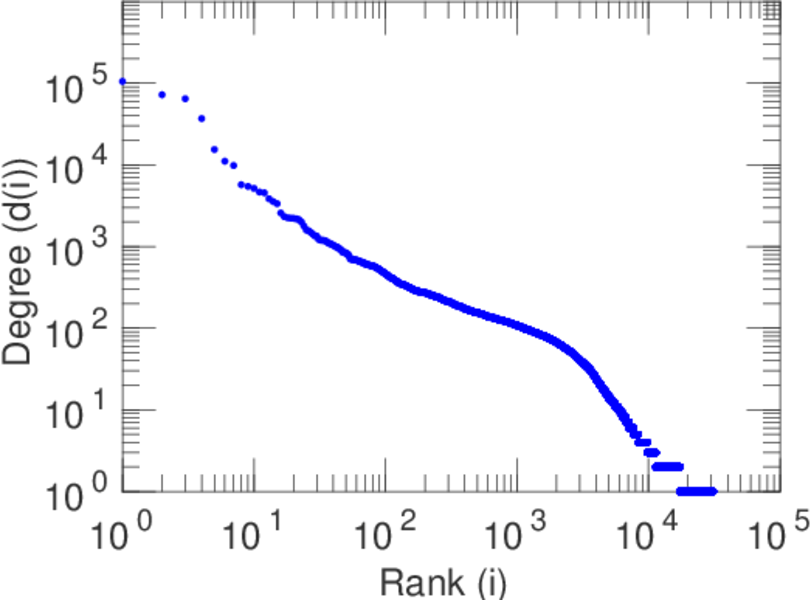
| Maximum degree | dmax = | 105,298
|
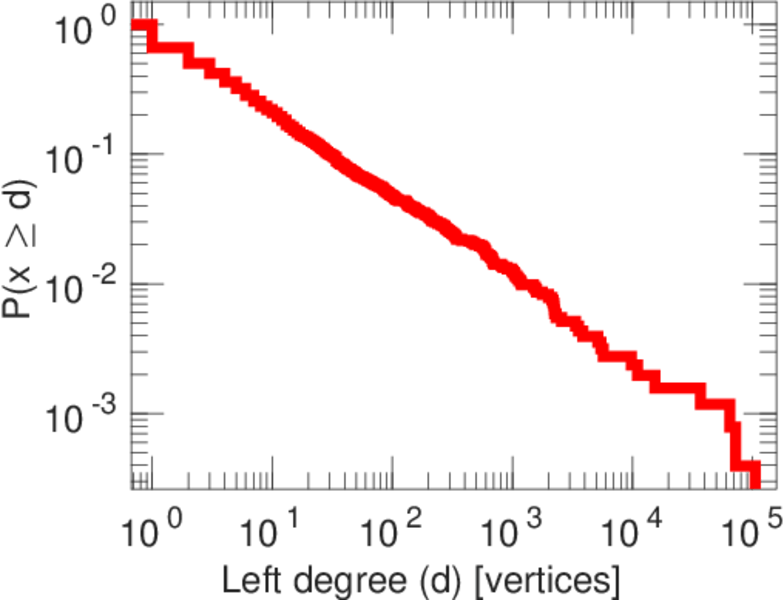
| Maximum left degree | d1max = | 105,298
|
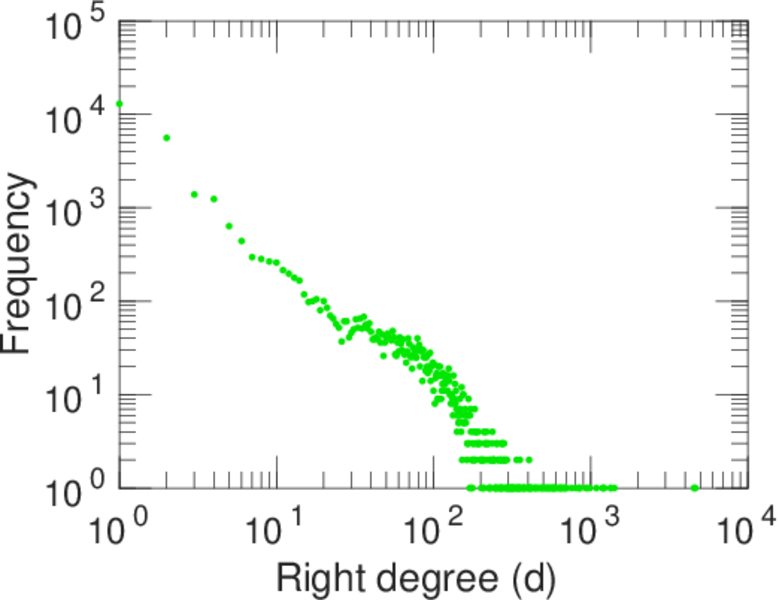
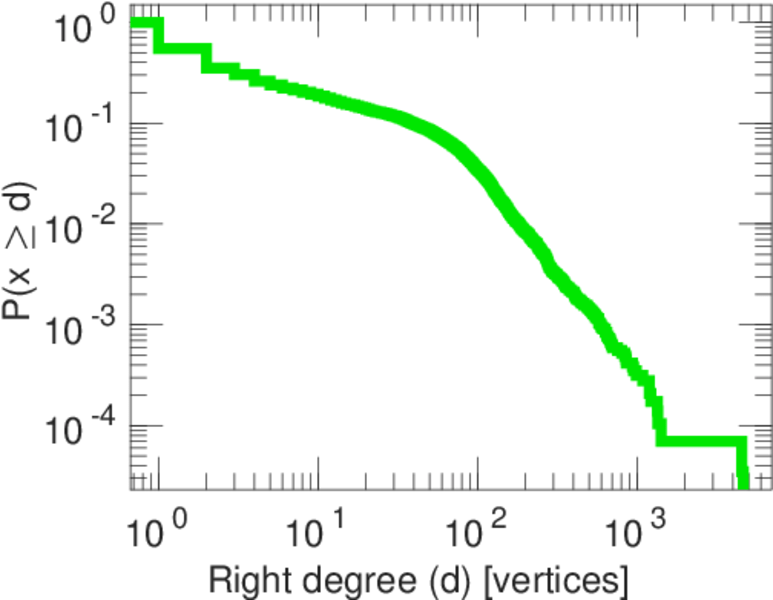
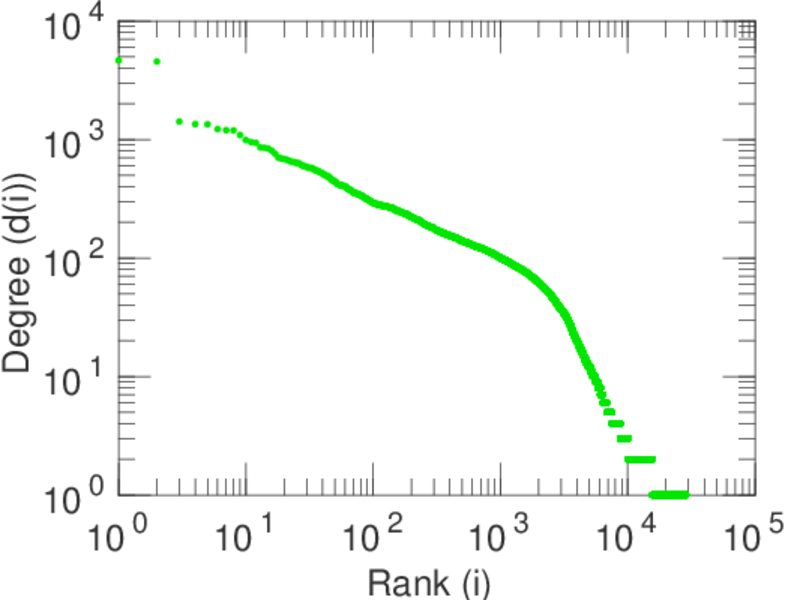
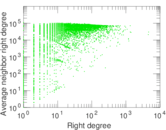
| Maximum right degree | d2max = | 4,645
|
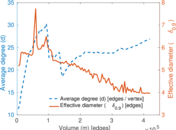
| Average degree | d = | 26.632 4
|
| Average left degree | d1 = | 165.277
|
| Average right degree | d2 = | 14.483 1
|
| Fill | p = | 0.001 101 89
|
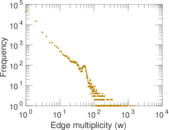
| Average edge multiplicity | m̃ = | 5.178 82
|
| Size of LCC | N = | 30,898
|
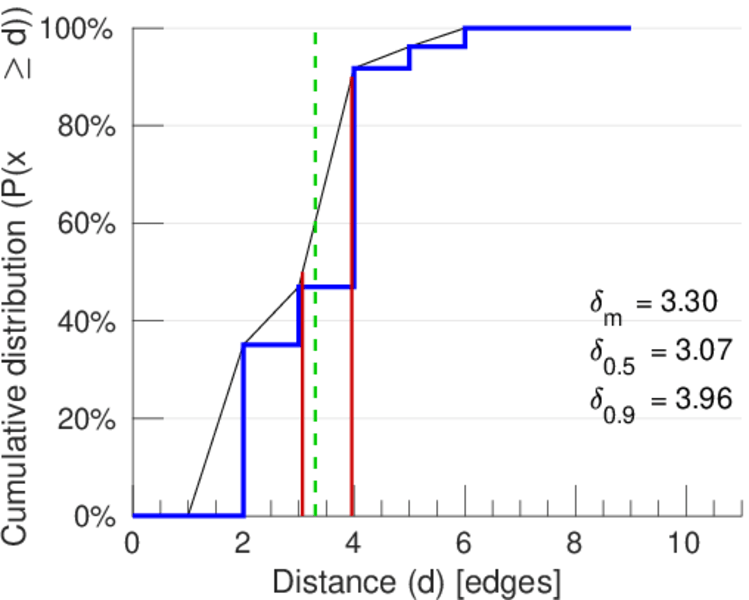
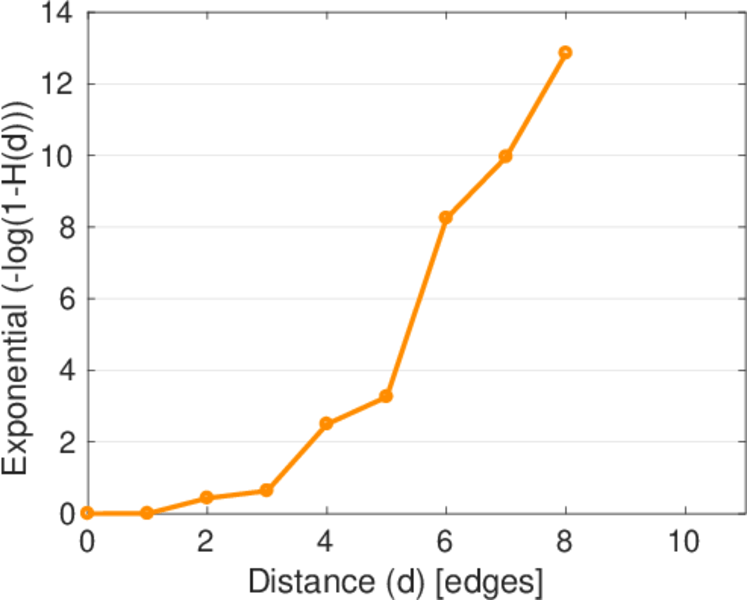
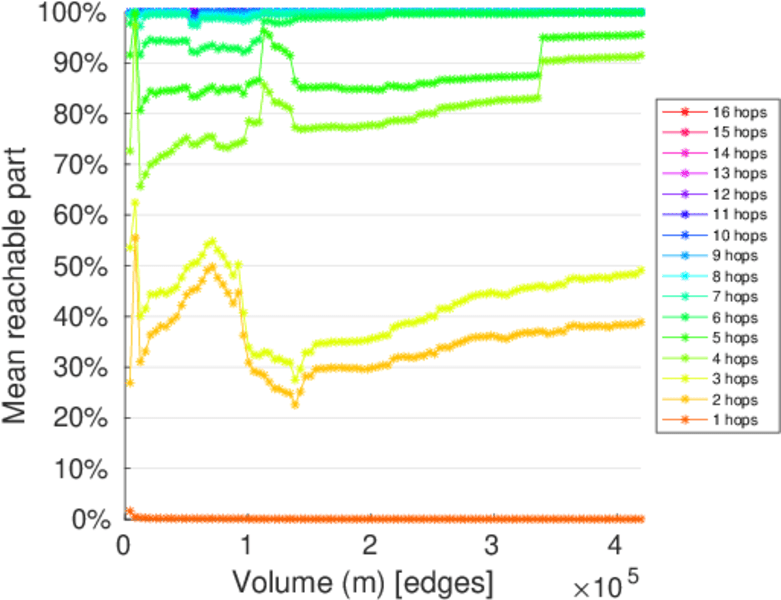
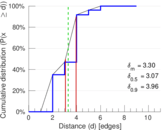
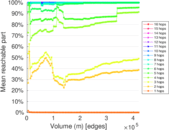
| Diameter | δ = | 11
|
| 50-Percentile effective diameter | δ0.5 = | 3.067 63
|
| 90-Percentile effective diameter | δ0.9 = | 3.960 59
|
| Median distance | δM = | 4
|
| Mean distance | δm = | 3.300 61
|
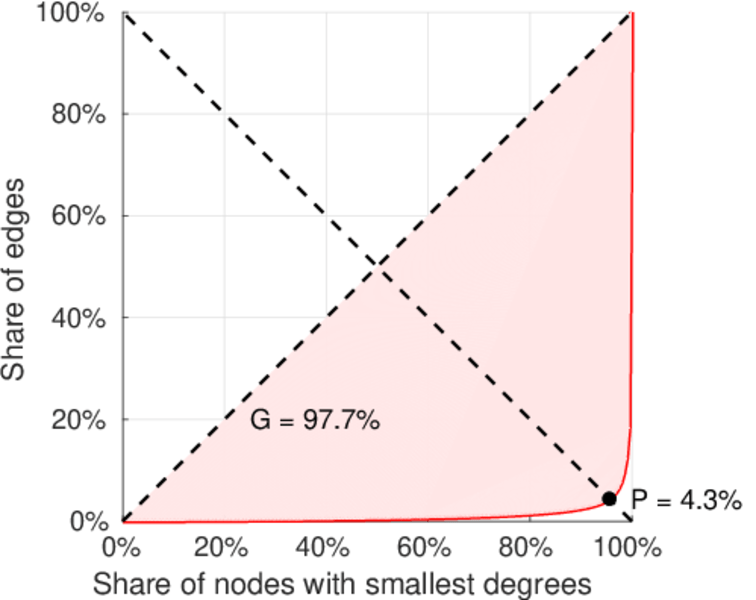
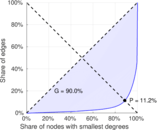
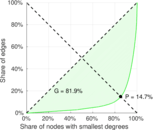
| Gini coefficient | G = | 0.901 896
|
| Balanced inequality ratio | P = | 0.112 204
|
| Left balanced inequality ratio | P1 = | 0.042 612 9
|
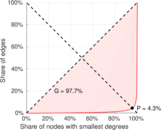
| Right balanced inequality ratio | P2 = | 0.146 944
|
| Relative edge distribution entropy | Her = | 0.718 827
|
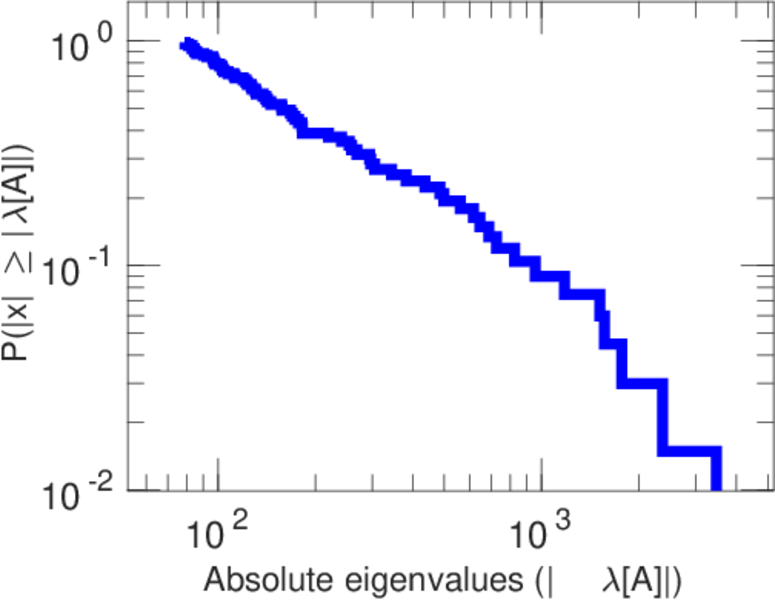
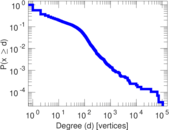
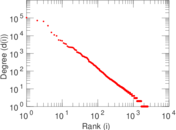
| Power law exponent | γ = | 2.767 12
|
| Tail power law exponent | γt = | 2.001 00
|
| Tail power law exponent with p | γ3 = | 2.001 00
|
| p-value | p = | 0.000 00
|
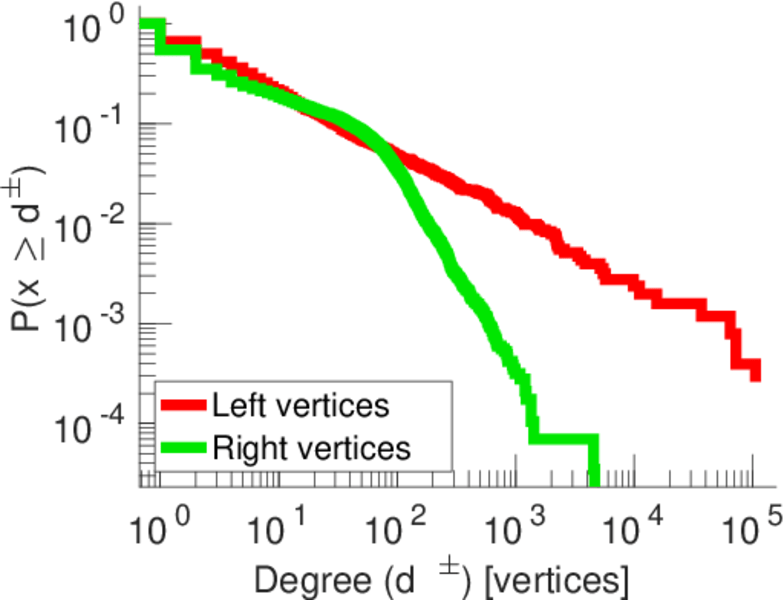
| Left tail power law exponent with p | γ3,1 = | 1.831 00
|
| Left p-value | p1 = | 0.000 00
|
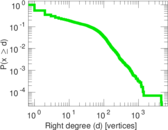
| Right tail power law exponent with p | γ3,2 = | 4.991 00
|
| Right p-value | p2 = | 0.060 000 0
|
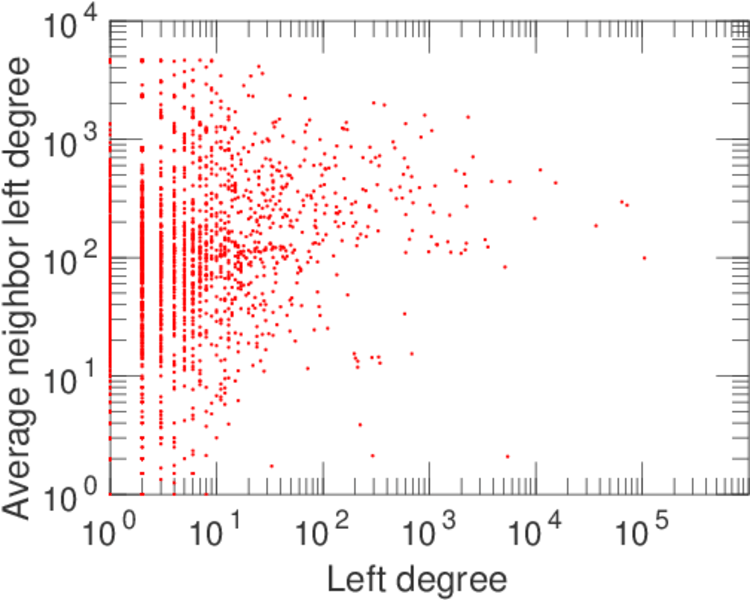
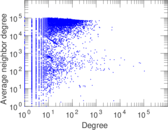
| Degree assortativity | ρ = | −0.254 768
|
| Degree assortativity p-value | pρ = | 0.000 00
|
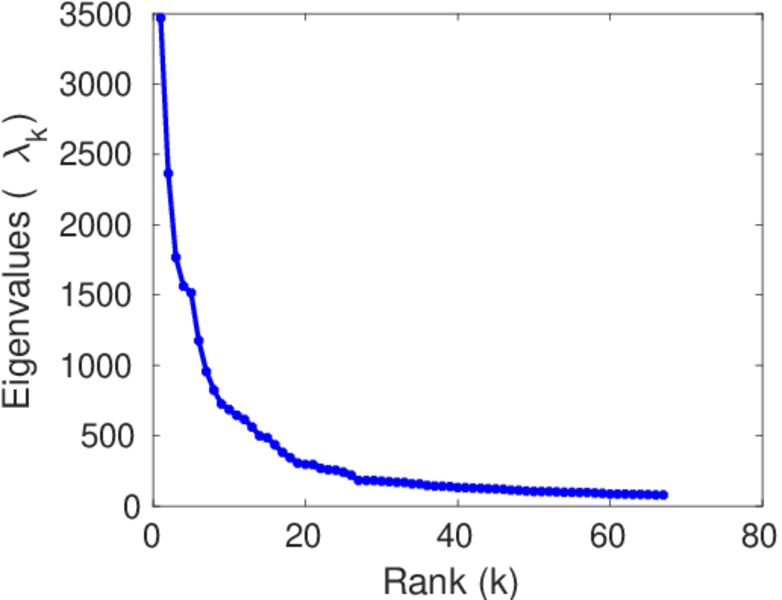
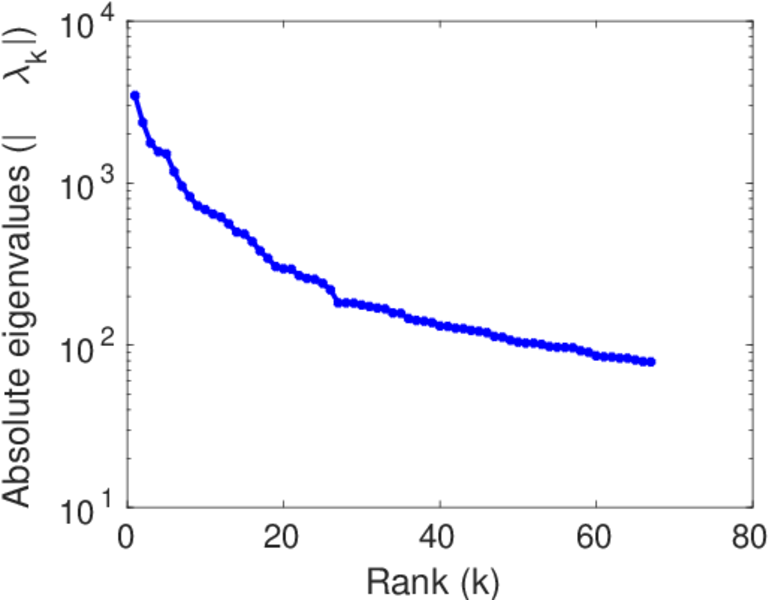
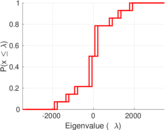
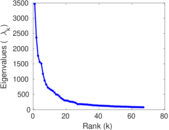
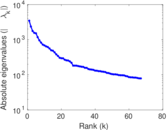
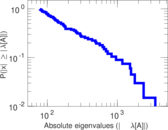
| Spectral norm | α = | 3,468.77
|
| Algebraic connectivity | a = | 0.011 697 0
|
| Spectral separation | |λ1[A] / λ2[A]| = | 1.467 30
|
| Controllability | C = | 27,715
|
| Relative controllability | Cr = | 0.888 501
|
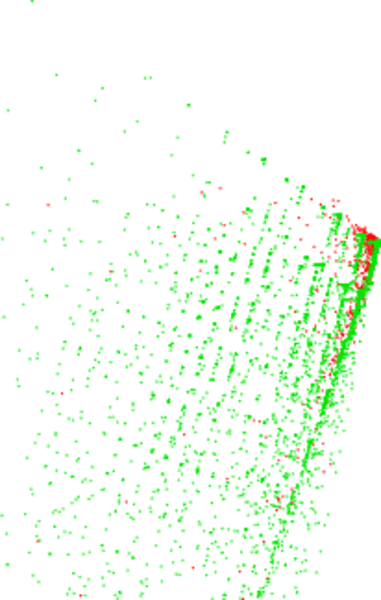
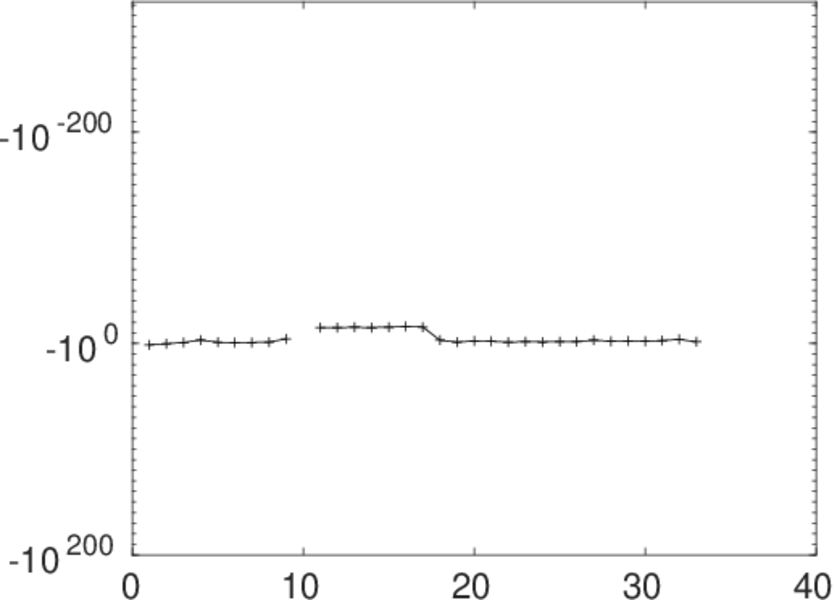
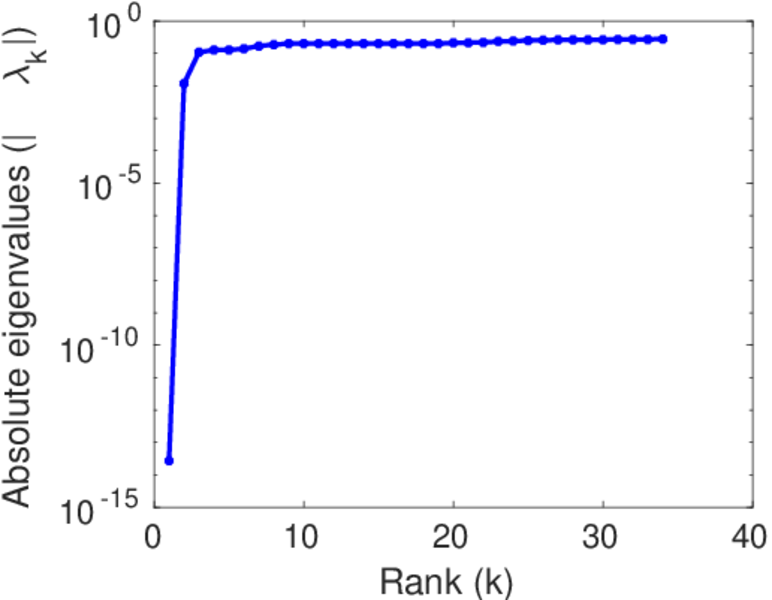
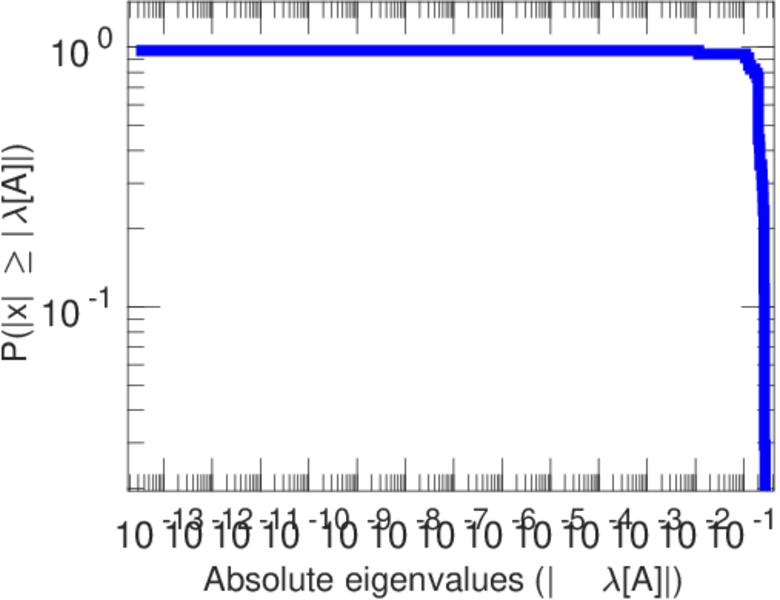
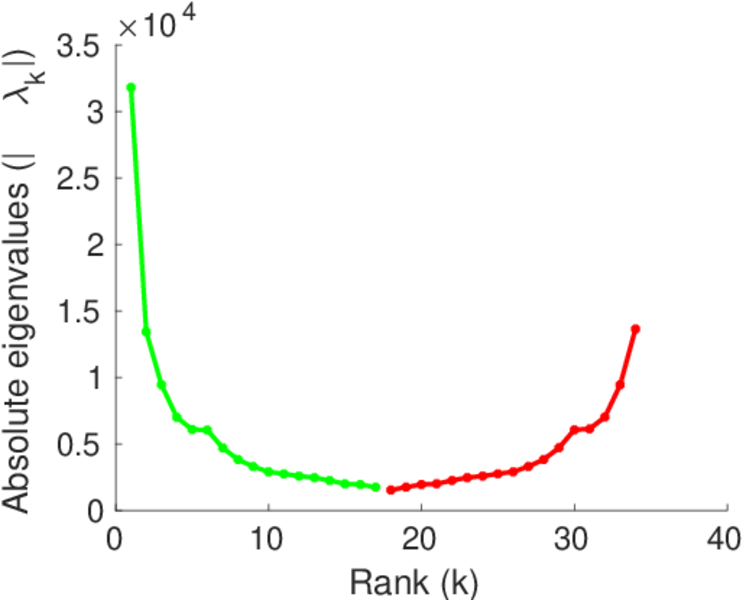
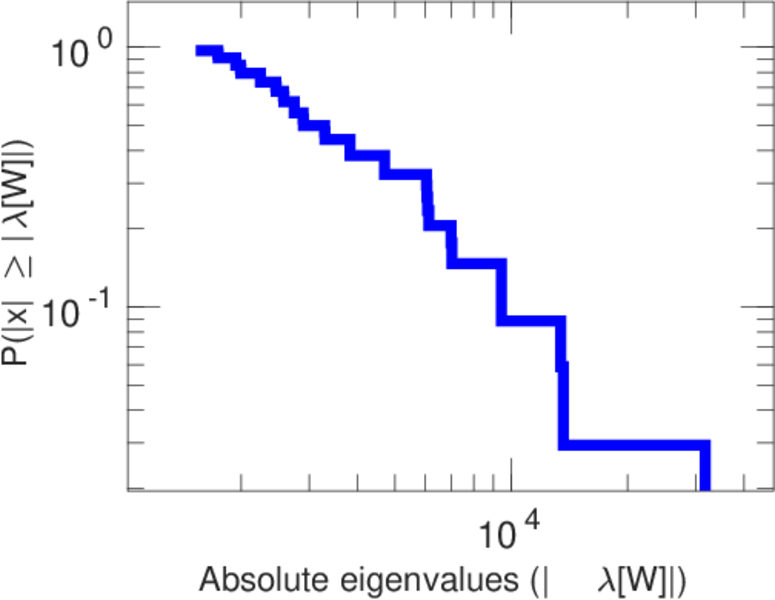
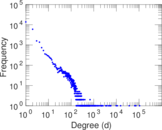
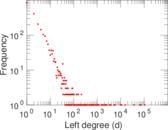
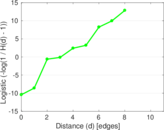
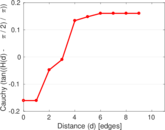
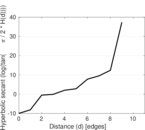
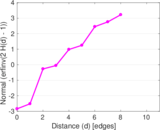
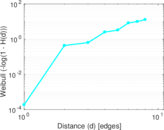
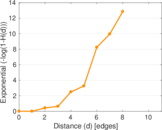
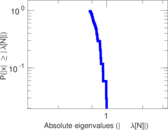
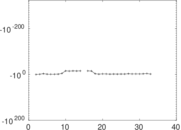
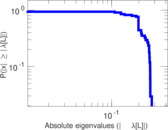
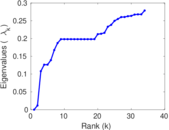
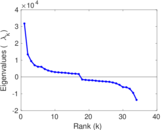
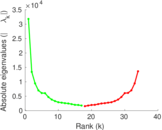
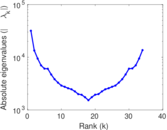
Plots


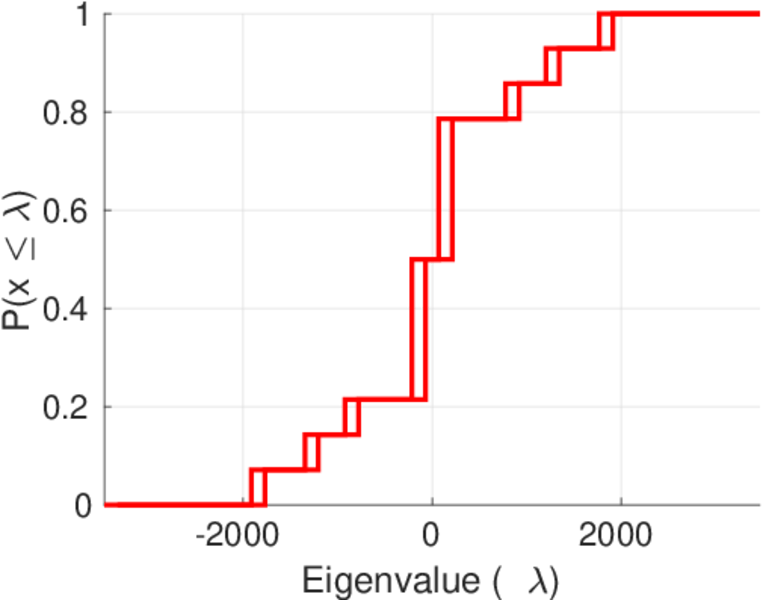
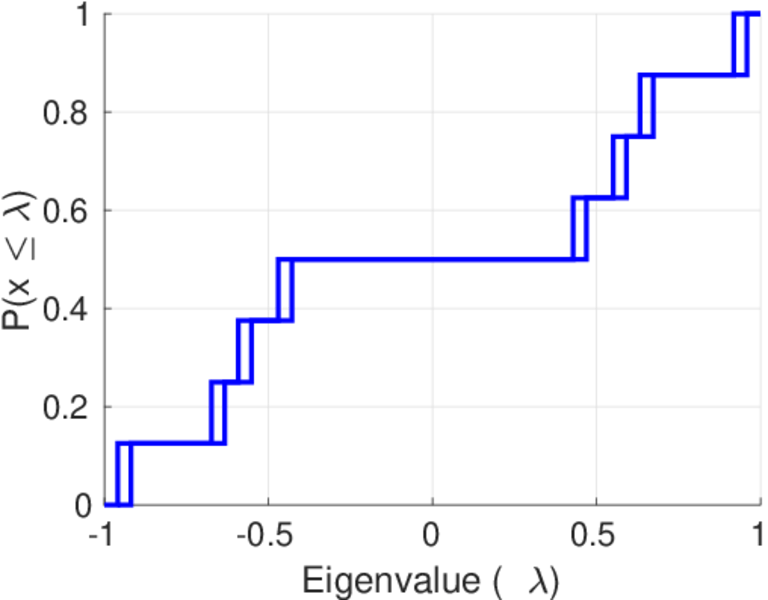
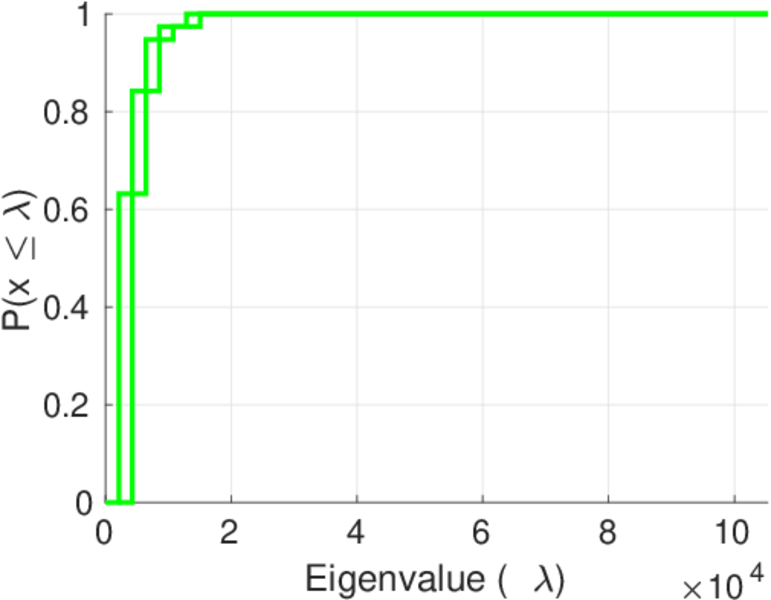
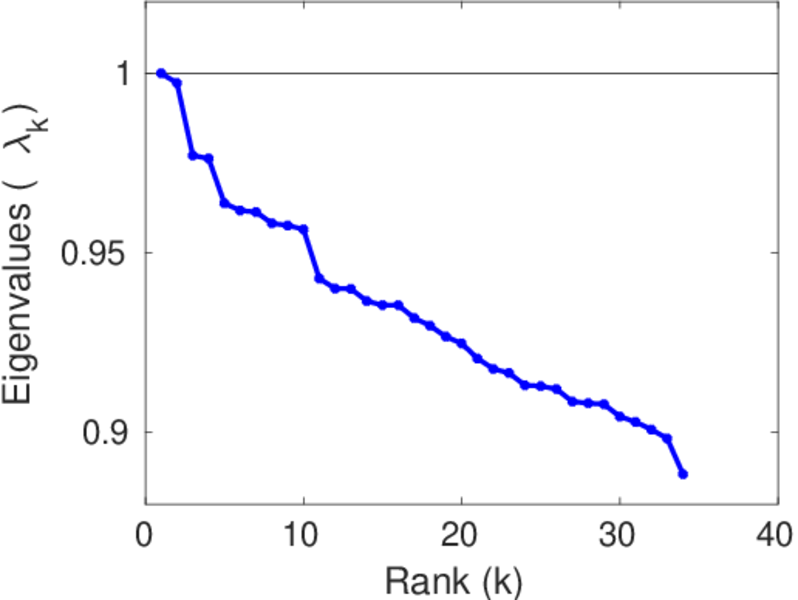
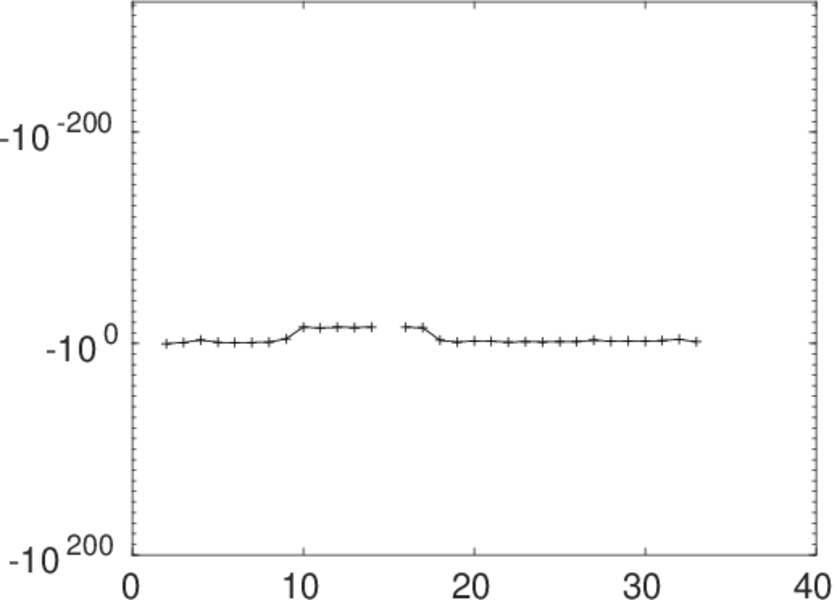
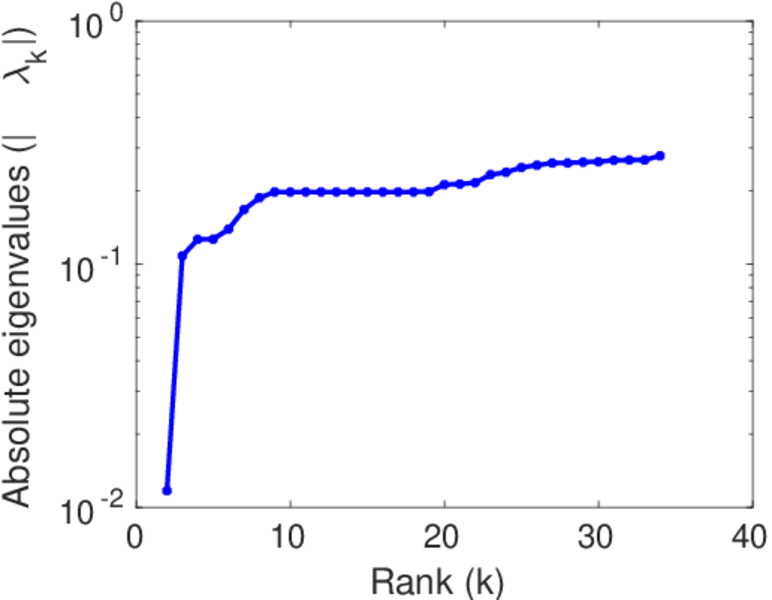
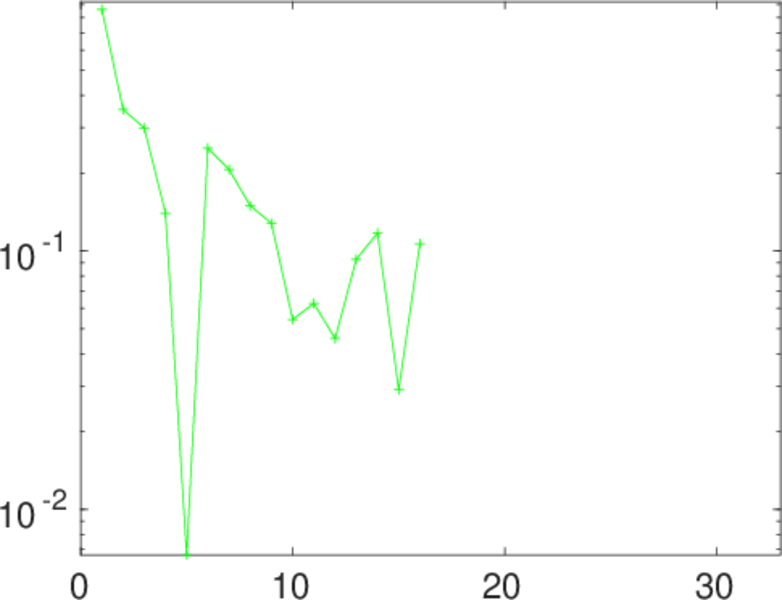
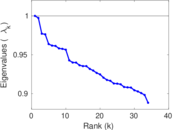
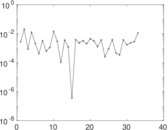
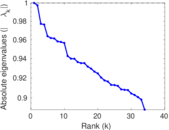
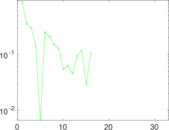
Matrix decompositions plots


Downloads
References
|
[1]
|
Jérôme Kunegis.
KONECT – The Koblenz Network Collection.
In Proc. Int. Conf. on World Wide Web Companion, pages
1343–1350, 2013.
[ http ]
|
|
[2]
|
Wikimedia Foundation.
Wikimedia downloads.
http://dumps.wikimedia.org/, January 2010.
|
 KONECT ‣ Networks ‣
Buy Me a Coffee
KONECT ‣ Networks ‣
Buy Me a Coffee