Wiktionary edits (it)
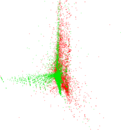
This is the bipartite edit network of the Italian Wiktionary. It contains users
and pages from the Italian Wiktionary, connected by edit events. Each edge
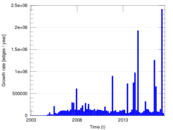
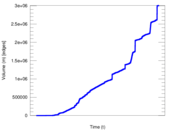
represents an edit. The dataset includes the timestamp of each edit.
Metadata
Statistics
| Size | n = | 462,041
|
| Left size | n1 = | 5,441
|
| Right size | n2 = | 456,600
|
| Volume | m = | 3,009,010
|
| Unique edge count | m̿ = | 2,052,595
|
| Wedge count | s = | 180,566,380,910
|
| Claw count | z = | 18,320,496,136,500,864
|
| Cross count | x = | 1.533 32 × 1021
|
| Square count | q = | 153,112,072,513
|
| 4-Tour count | T4 = | 1,947,166,850,778
|
| Maximum degree | dmax = | 501,233
|
| Maximum left degree | d1max = | 501,233
|
| Maximum right degree | d2max = | 7,709
|
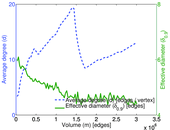
| Average degree | d = | 13.024 9
|
| Average left degree | d1 = | 553.025
|
| Average right degree | d2 = | 6.590 04
|
| Fill | p = | 0.000 826 207
|
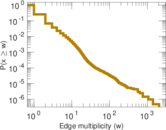
| Average edge multiplicity | m̃ = | 1.465 95
|
| Size of LCC | N = | 460,903
|
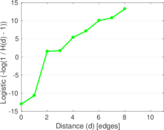
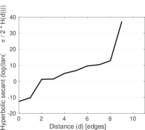
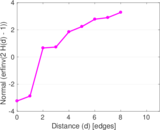
| Diameter | δ = | 12
|
| 50-Percentile effective diameter | δ0.5 = | 1.606 00
|
| 90-Percentile effective diameter | δ0.9 = | 3.349 14
|
| Median distance | δM = | 2
|
| Mean distance | δm = | 2.331 48
|
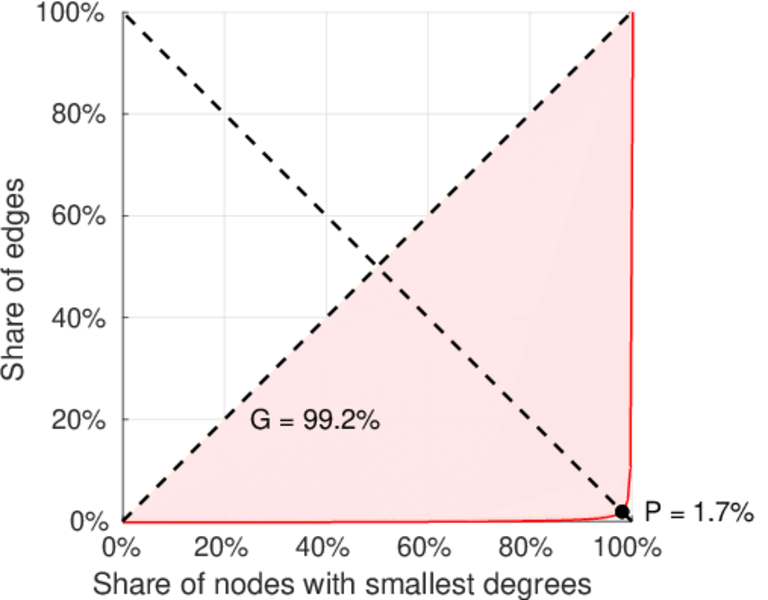
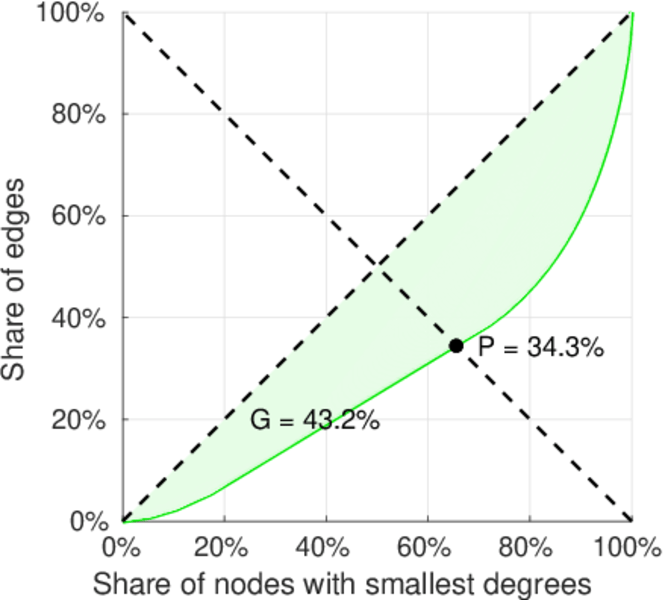
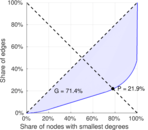
| Gini coefficient | G = | 0.715 092
|
| Balanced inequality ratio | P = | 0.217 809
|
| Left balanced inequality ratio | P1 = | 0.017 219 9
|
| Right balanced inequality ratio | P2 = | 0.343 073
|
| Relative edge distribution entropy | Her = | 0.669 394
|
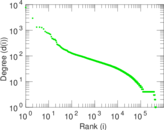
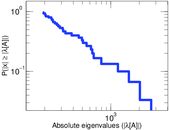
| Power law exponent | γ = | 1.785 20
|
| Tail power law exponent | γt = | 4.081 00
|
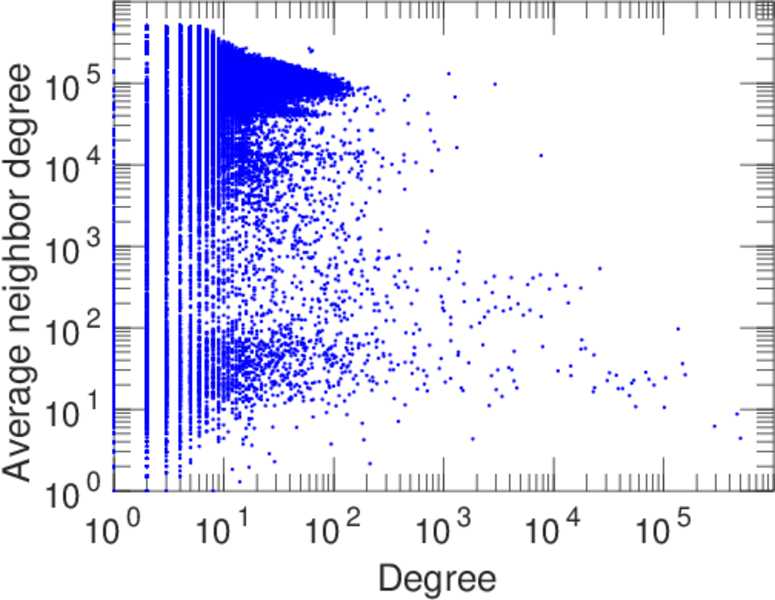
| Degree assortativity | ρ = | −0.449 033
|
| Degree assortativity p-value | pρ = | 0.000 00
|
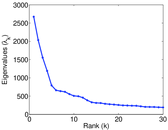
| Spectral norm | α = | 2,673.56
|
| Algebraic connectivity | a = | 0.045 204 3
|
| Spectral separation | |λ1[A] / λ2[A]| = | 1.314 99
|
| Controllability | C = | 452,014
|
| Relative controllability | Cr = | 0.979 507
|
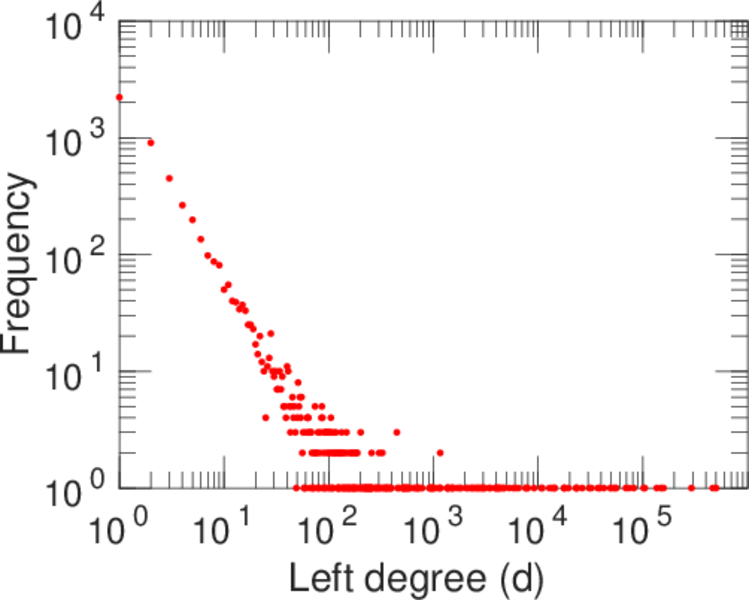
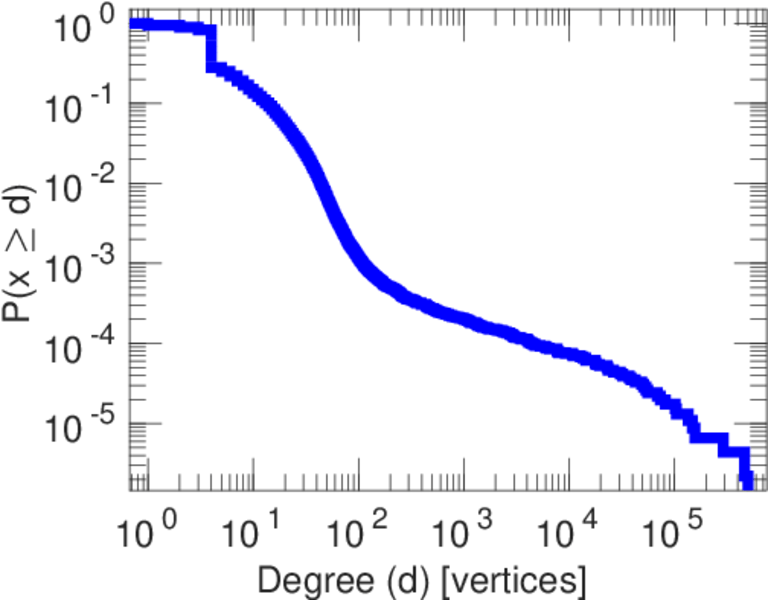
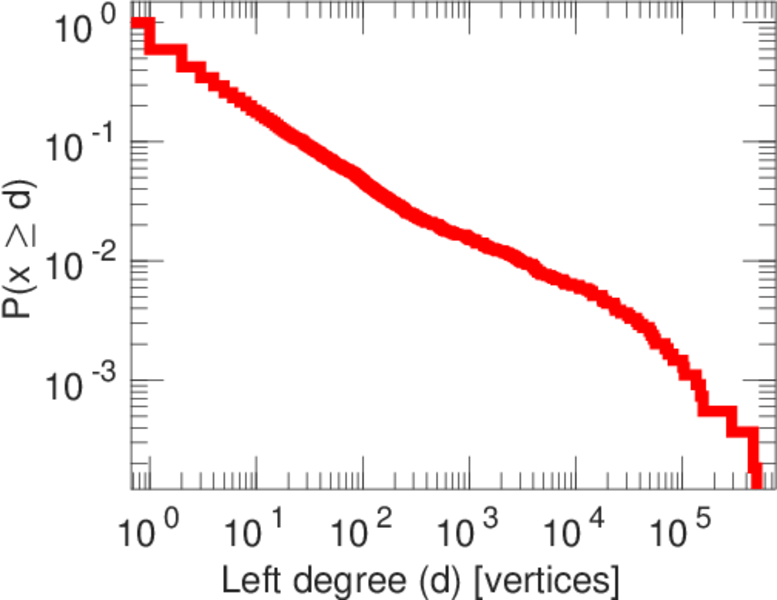
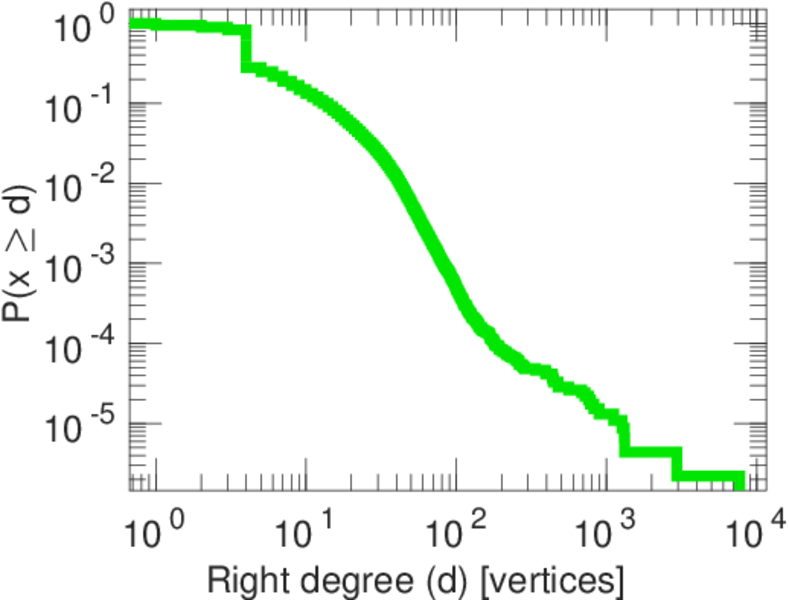
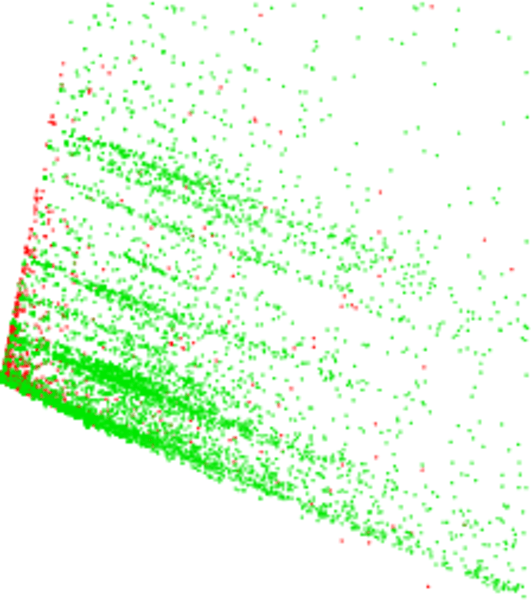
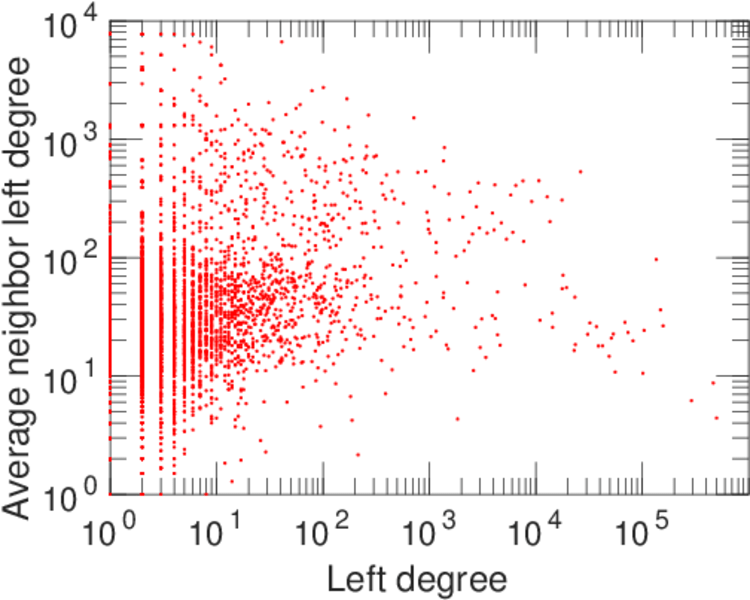
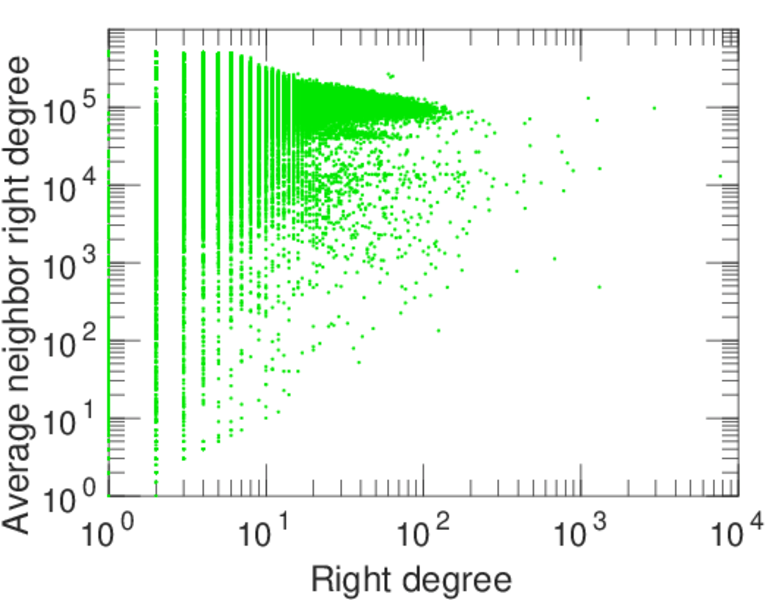
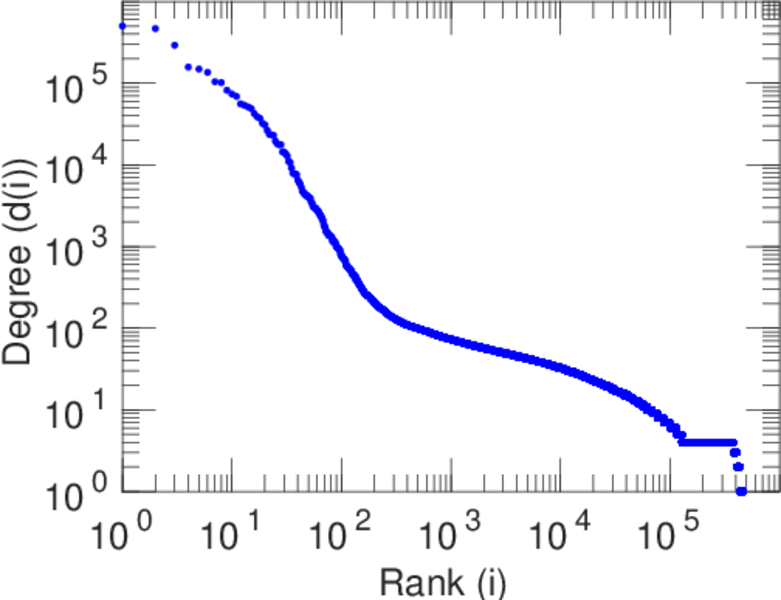
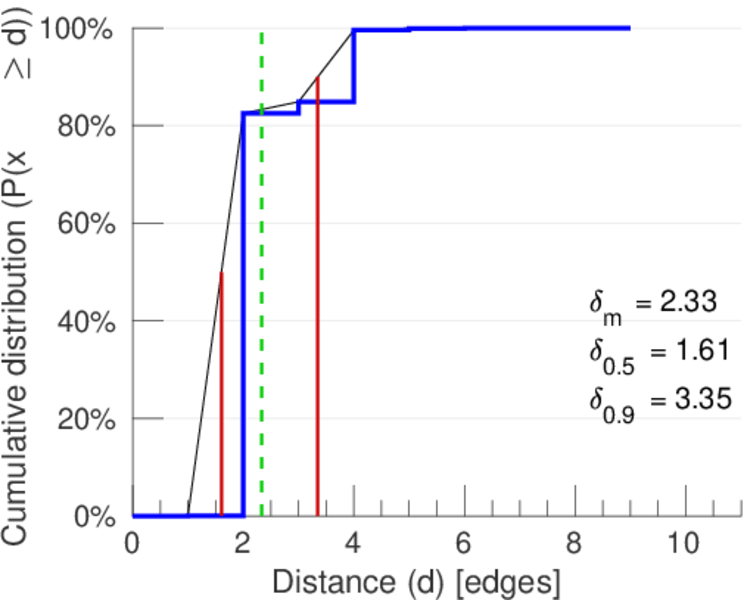
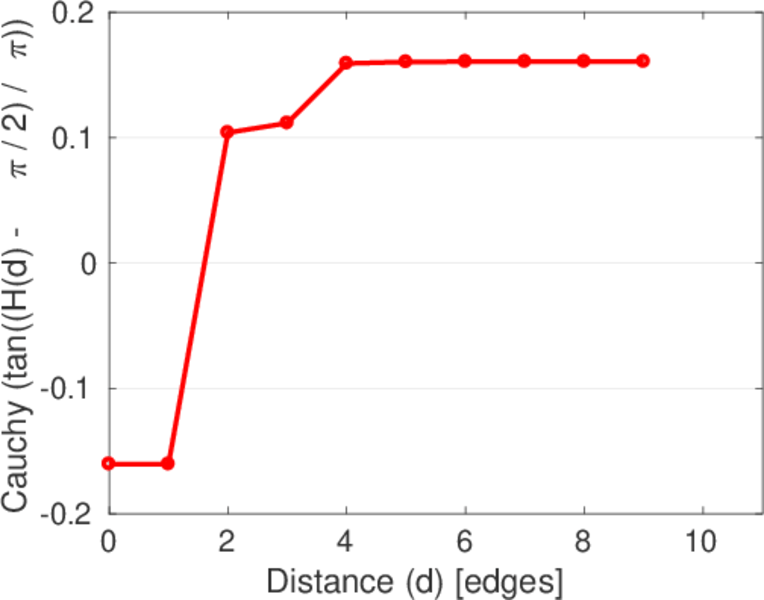
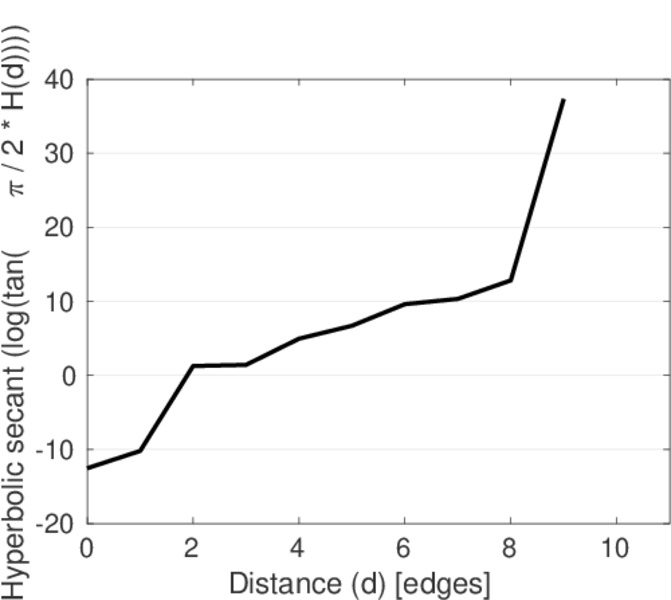
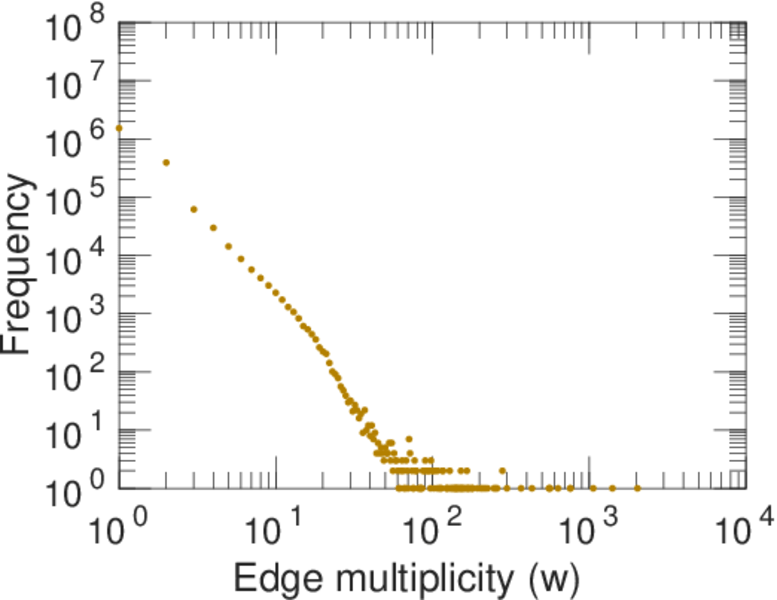
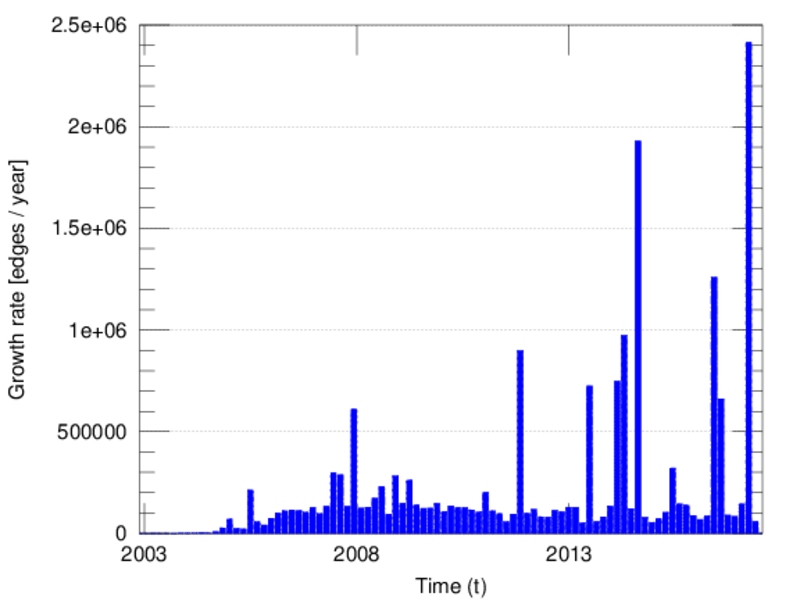
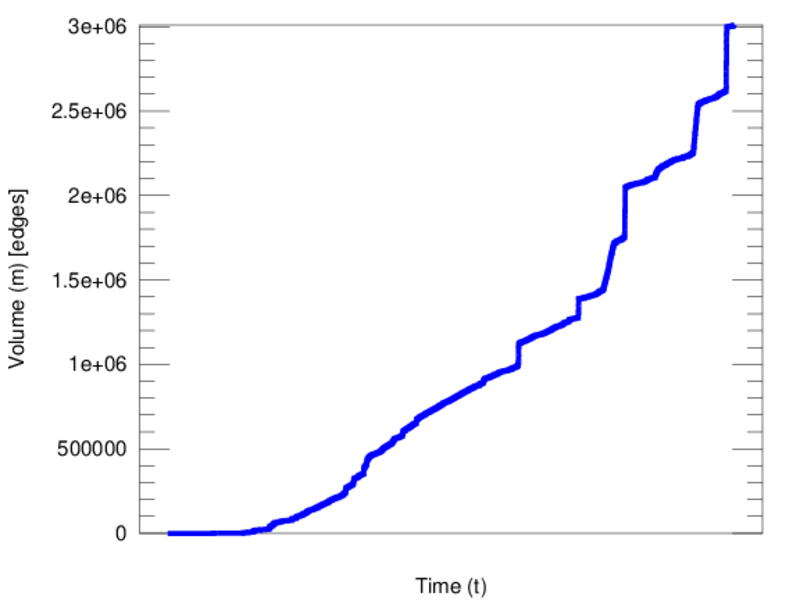
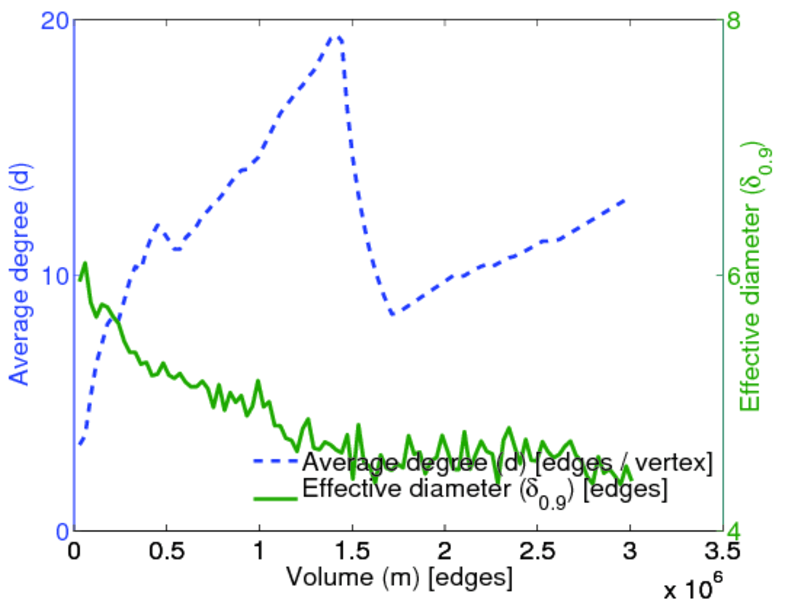
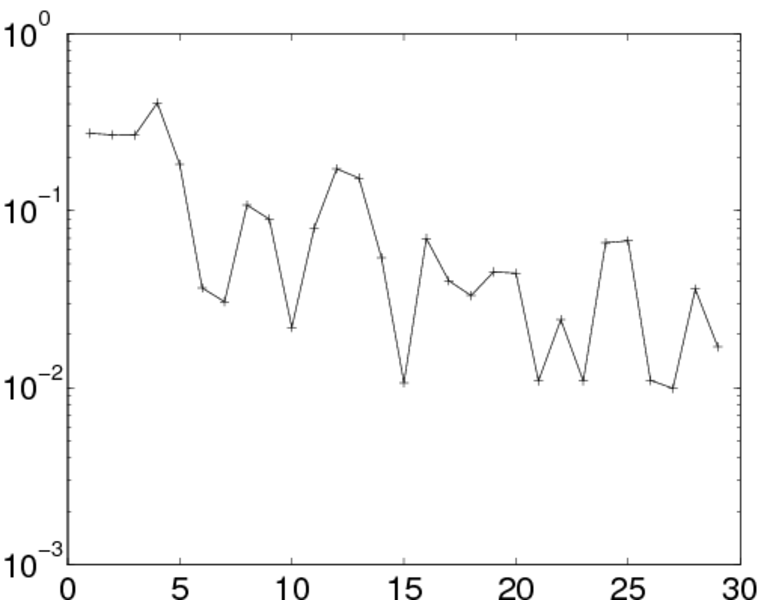
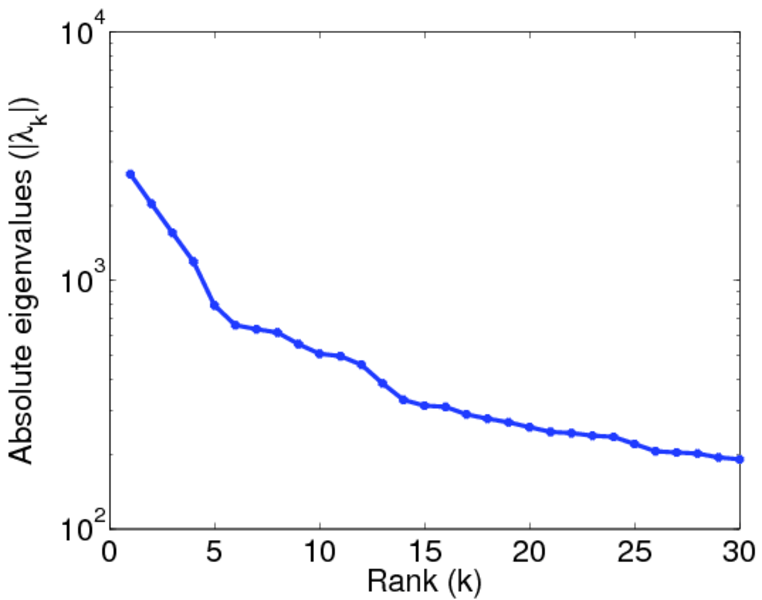
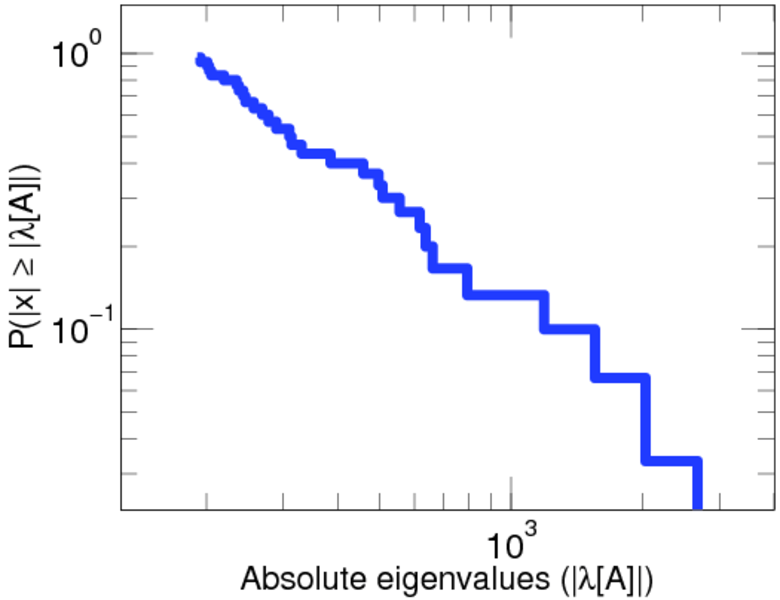
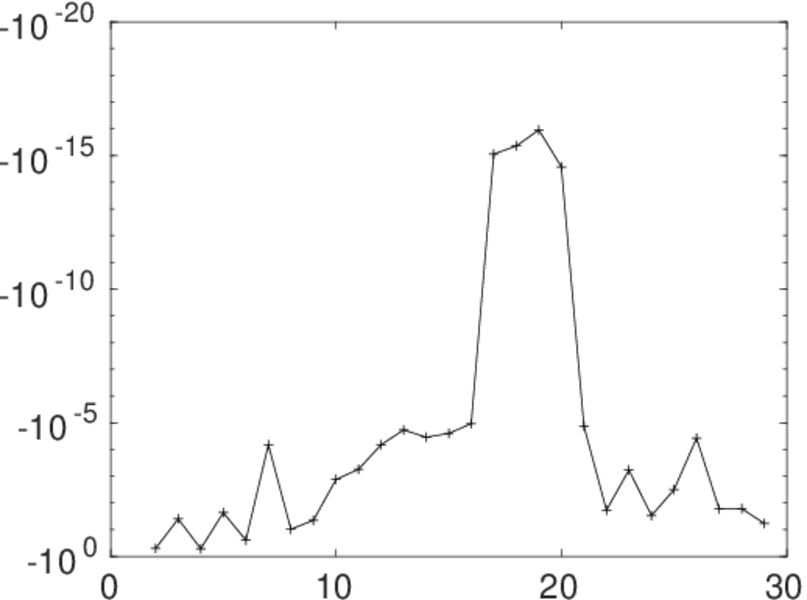
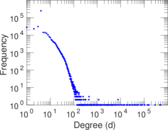
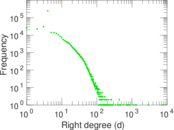
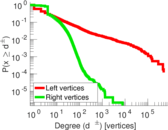
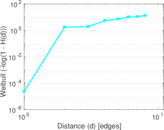
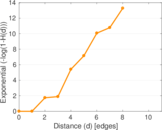
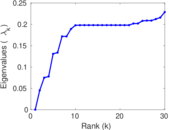
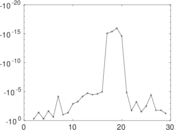
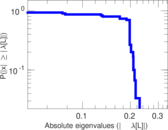
Plots


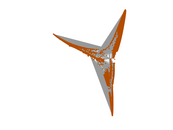


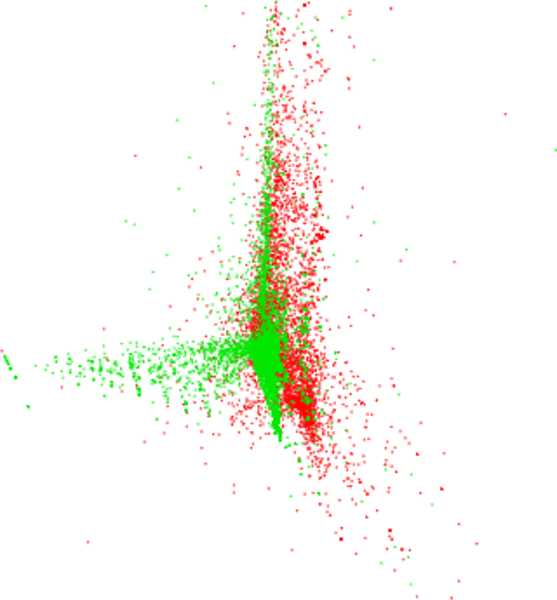
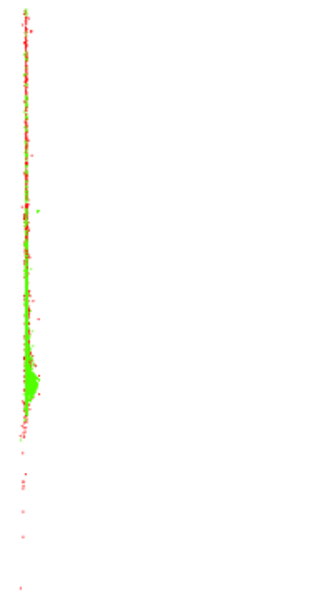
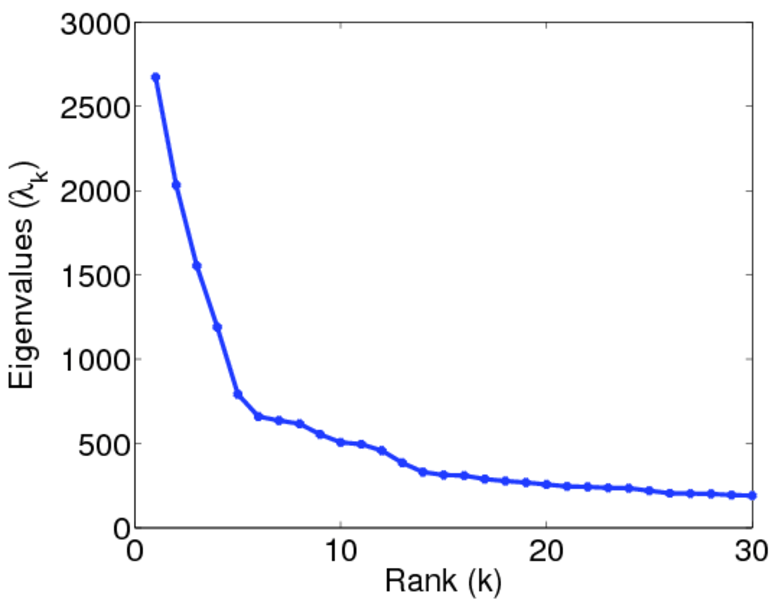
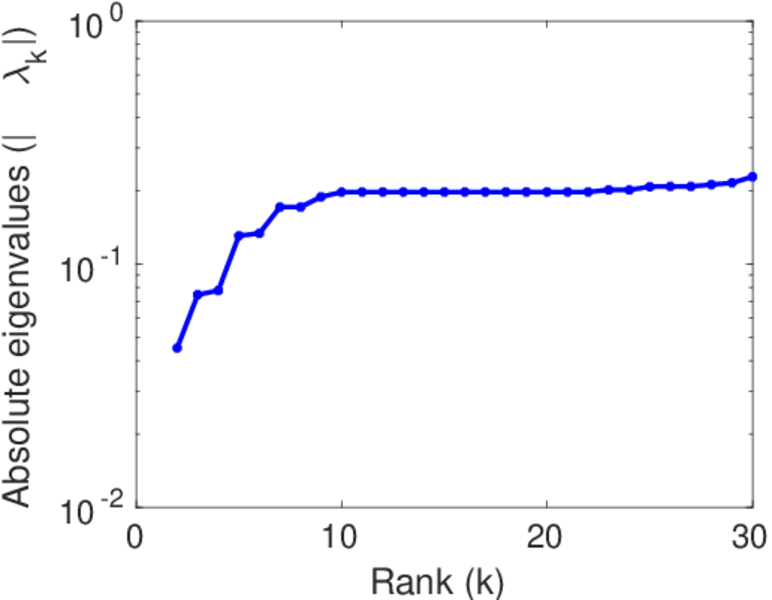
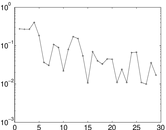
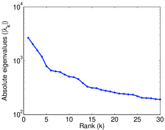
Matrix decompositions plots

Downloads
References
|
[1]
|
Jérôme Kunegis.
KONECT – The Koblenz Network Collection.
In Proc. Int. Conf. on World Wide Web Companion, pages
1343–1350, 2013.
[ http ]
|
|
[2]
|
Wikimedia Foundation.
Wikimedia downloads.
http://dumps.wikimedia.org/, January 2010.
|
 KONECT ‣ Networks ‣
Buy Me a Coffee
KONECT ‣ Networks ‣
Buy Me a Coffee