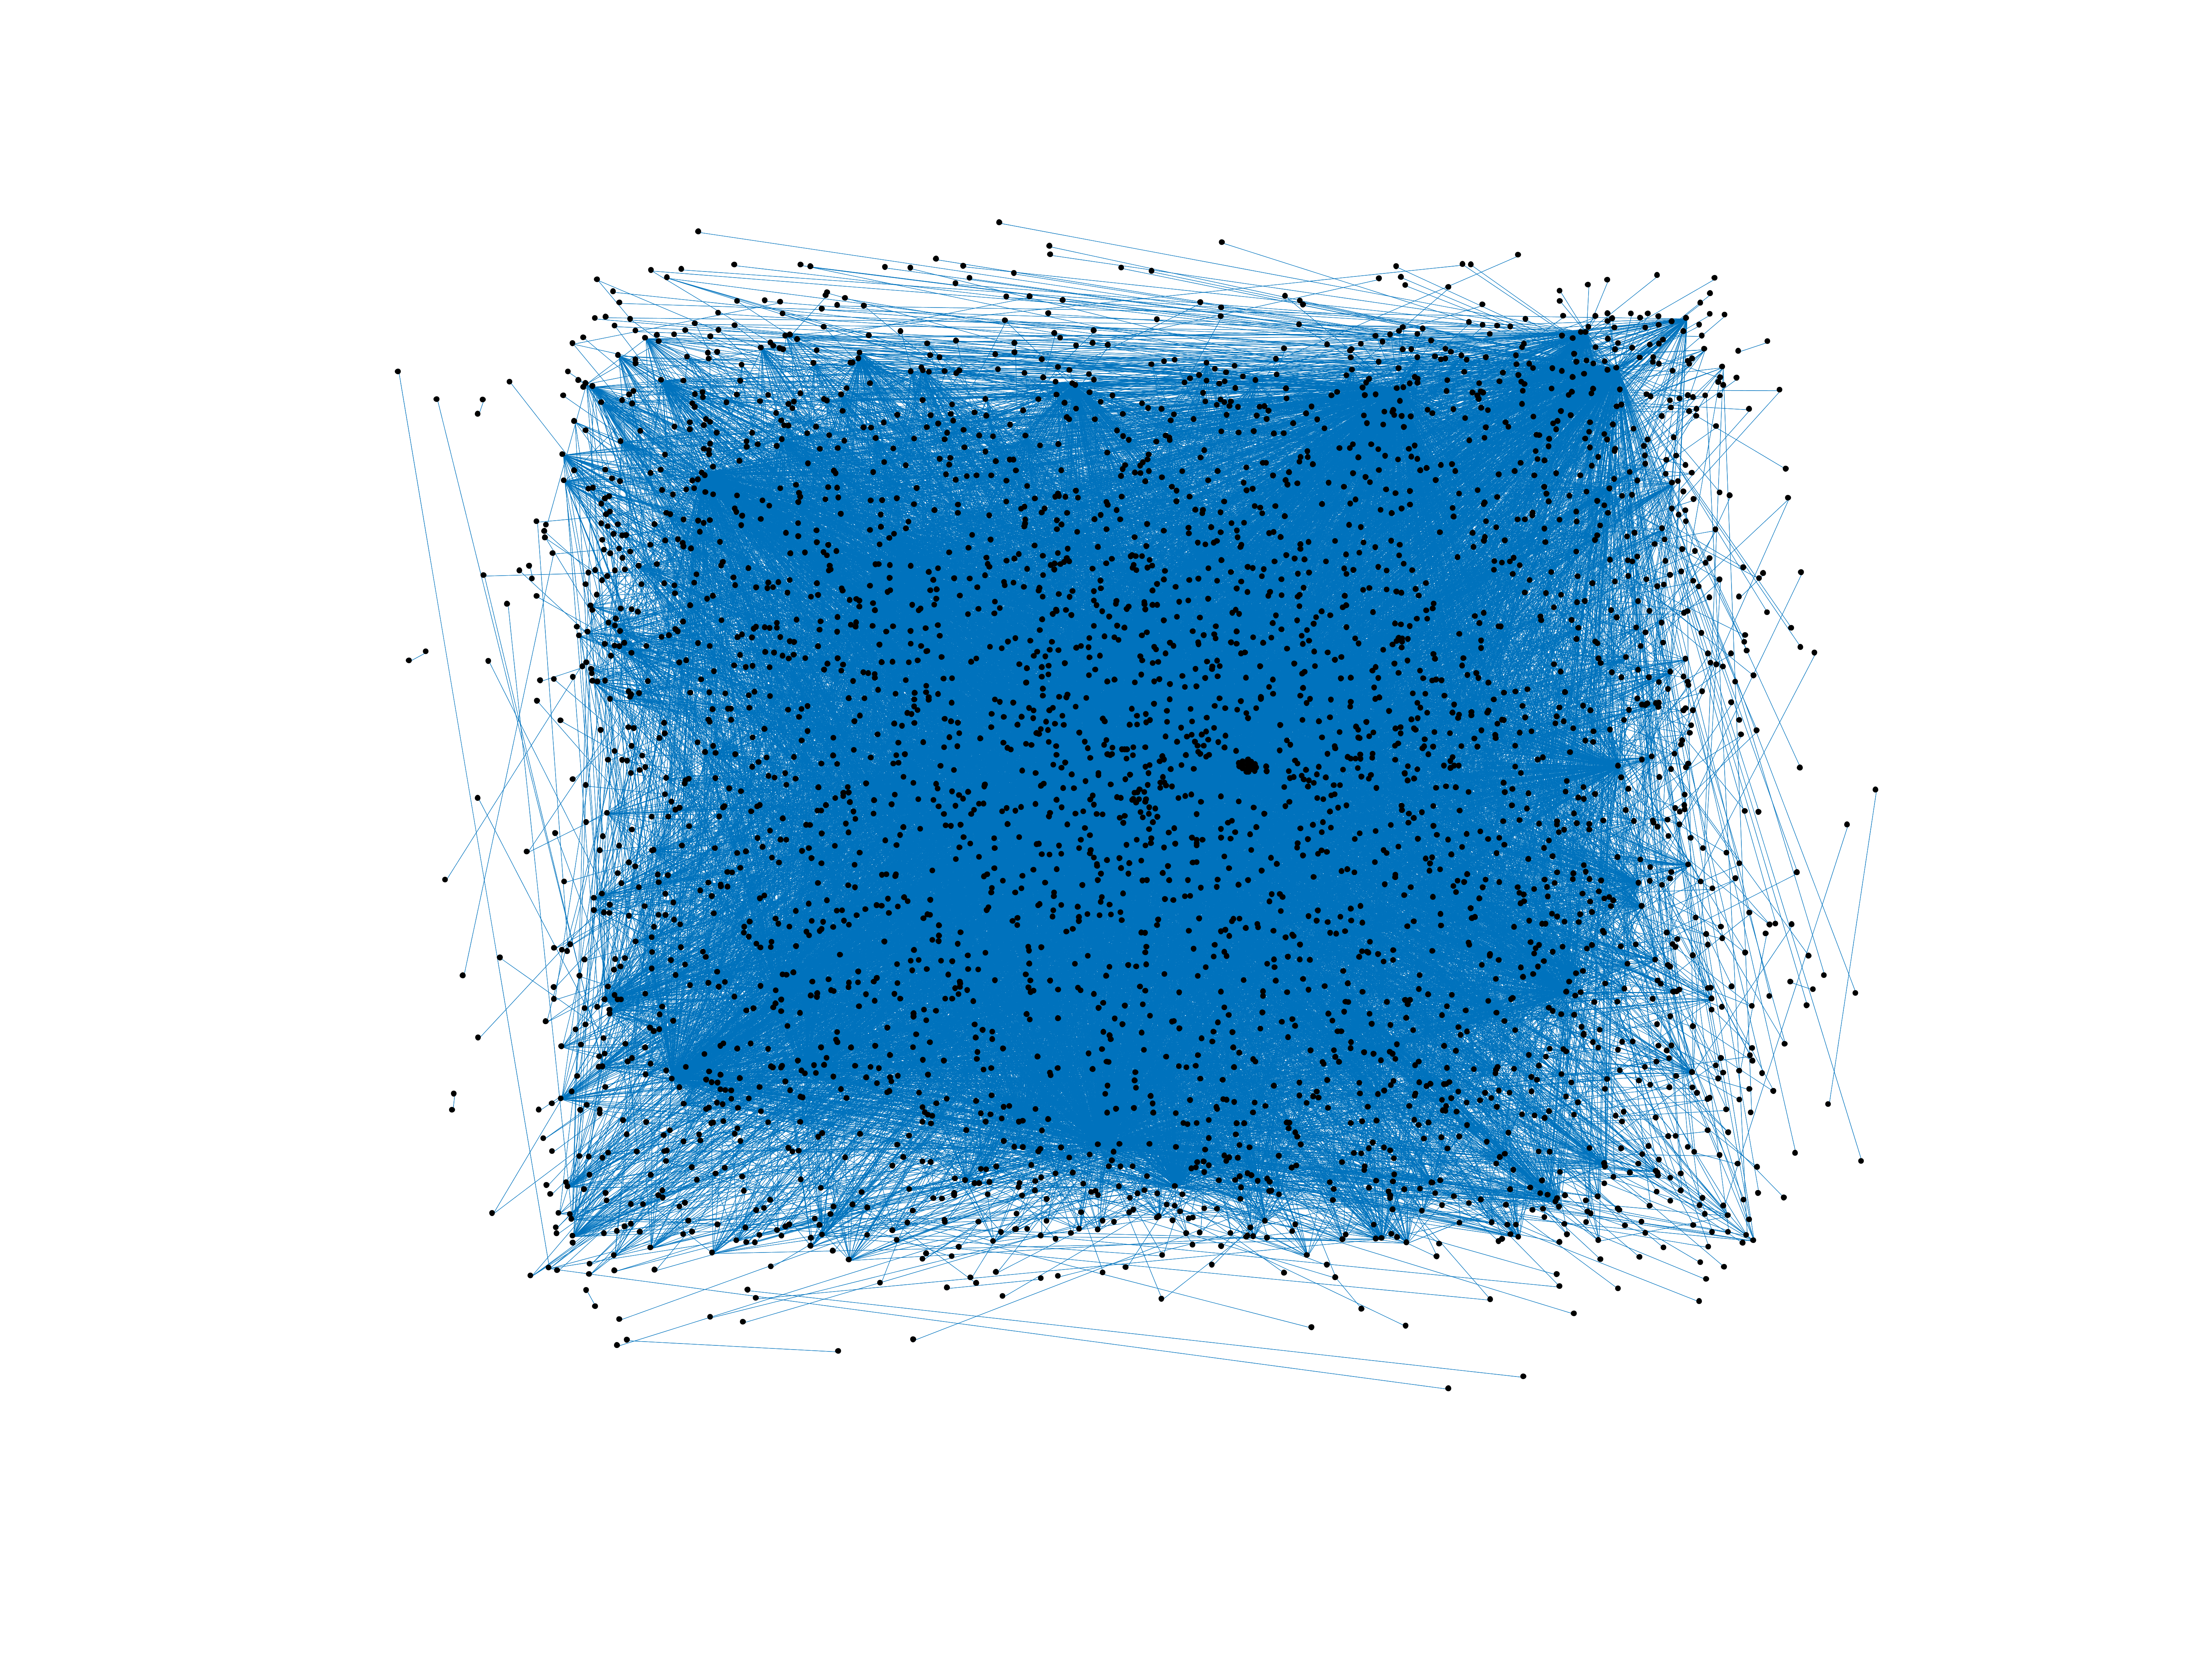
Wikipedia edits (iu)
This is the bipartite edit network of the Inuktitut Wikipedia. It contains
users and pages from the Inuktitut Wikipedia, connected by edit events. Each
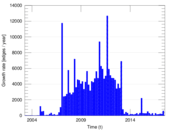
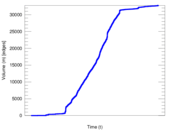
edge represents an edit. The dataset includes the timestamp of each edit.
Metadata
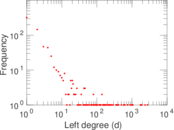
Statistics
| Size | n = | 3,586
|
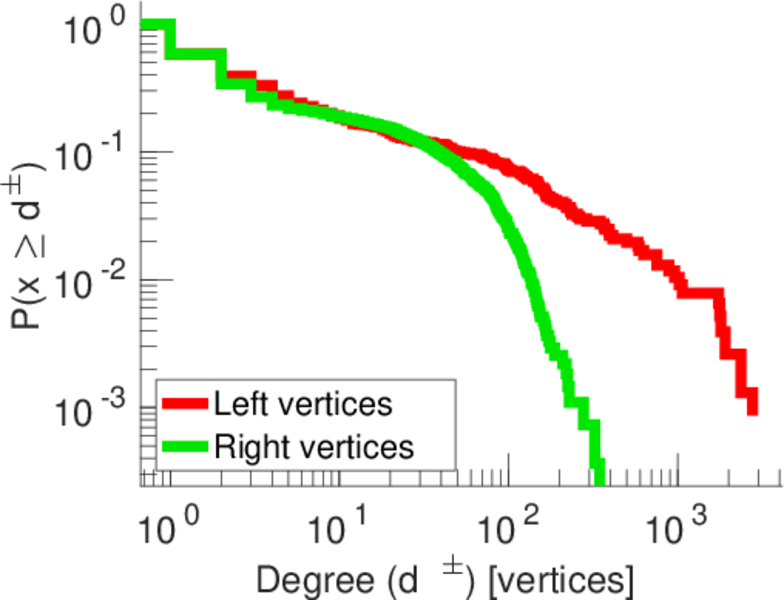
| Left size | n1 = | 767
|
| Right size | n2 = | 2,819
|
| Volume | m = | 32,761
|
| Unique edge count | m̿ = | 14,110
|
| Wedge count | s = | 1,964,580
|
| Claw count | z = | 300,930,918
|
| Cross count | x = | 47,456,860,419
|
| Square count | q = | 5,907,516
|
| 4-Tour count | T4 = | 55,159,660
|
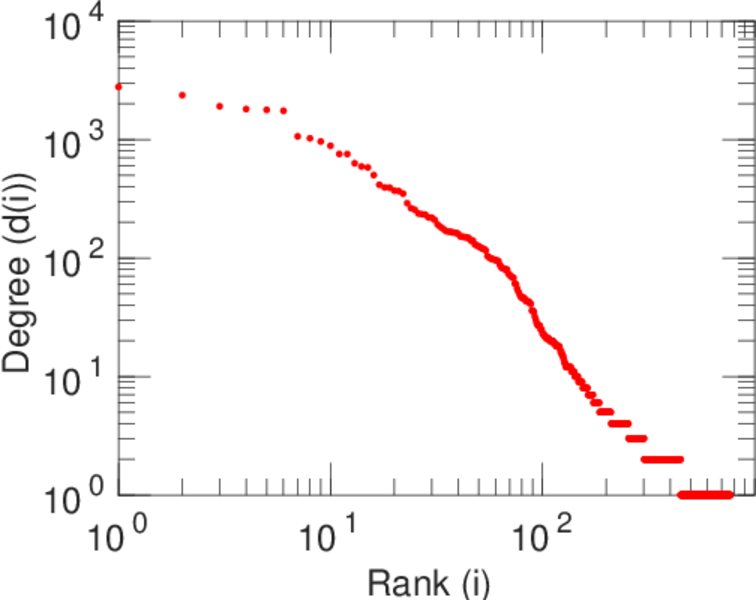
| Maximum degree | dmax = | 2,776
|
| Maximum left degree | d1max = | 2,776
|
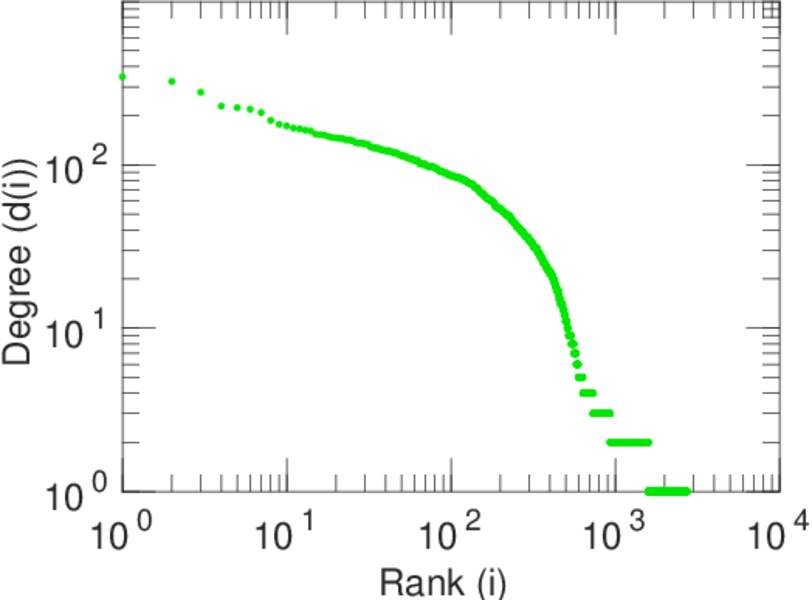
| Maximum right degree | d2max = | 346
|
| Average degree | d = | 18.271 6
|
| Average left degree | d1 = | 42.713 2
|
| Average right degree | d2 = | 11.621 5
|
| Fill | p = | 0.006 525 84
|
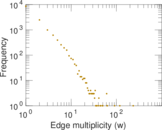
| Average edge multiplicity | m̃ = | 2.321 83
|
| Size of LCC | N = | 2,969
|
| Diameter | δ = | 12
|
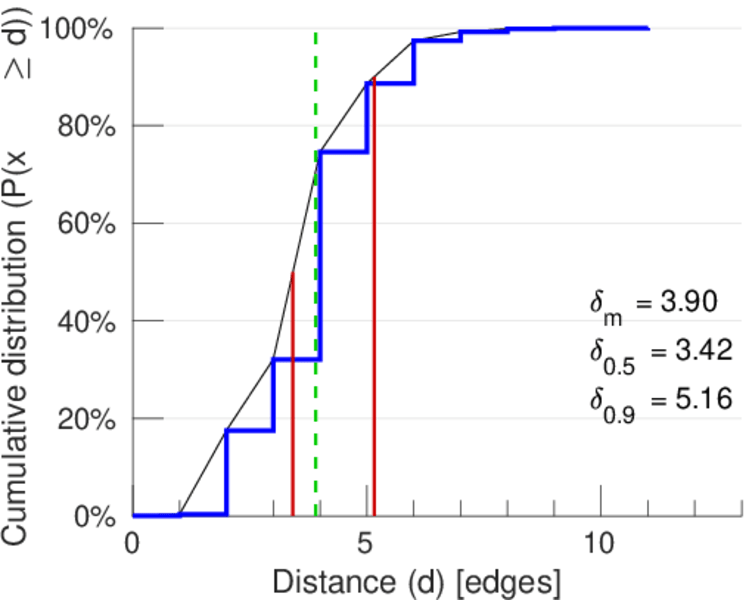
| 50-Percentile effective diameter | δ0.5 = | 3.421 43
|
| 90-Percentile effective diameter | δ0.9 = | 5.158 53
|
| Median distance | δM = | 4
|
| Mean distance | δm = | 3.904 80
|
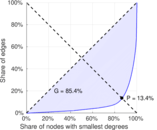
| Gini coefficient | G = | 0.852 427
|
| Balanced inequality ratio | P = | 0.139 037
|
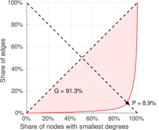
| Left balanced inequality ratio | P1 = | 0.088 519 9
|
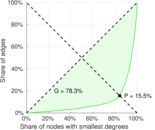
| Right balanced inequality ratio | P2 = | 0.154 757
|
| Relative edge distribution entropy | Her = | 0.801 362
|
| Power law exponent | γ = | 2.199 59
|
| Tail power law exponent | γt = | 1.771 00
|
| Tail power law exponent with p | γ3 = | 1.771 00
|
| p-value | p = | 0.000 00
|
| Left tail power law exponent with p | γ3,1 = | 1.671 00
|
| Left p-value | p1 = | 0.000 00
|
| Right tail power law exponent with p | γ3,2 = | 1.811 00
|
| Right p-value | p2 = | 0.000 00
|
| Degree assortativity | ρ = | −0.214 112
|
| Degree assortativity p-value | pρ = | 5.377 76 × 10−146
|
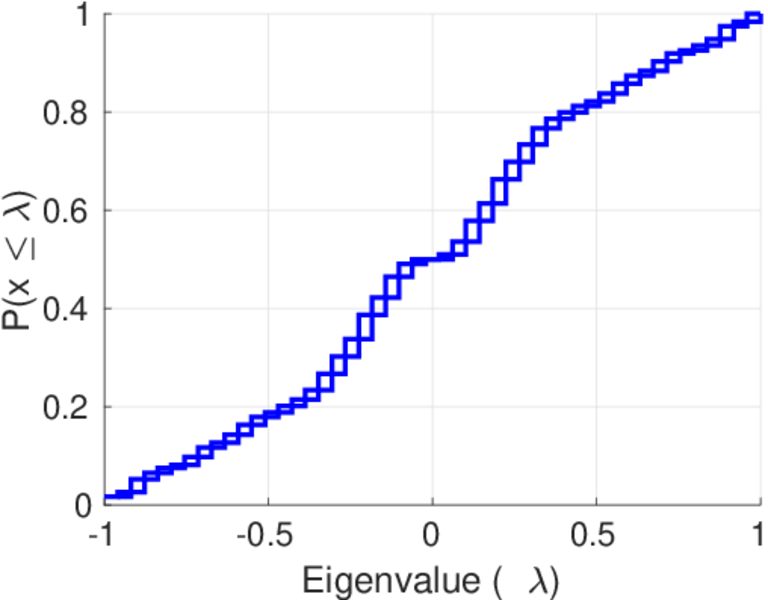
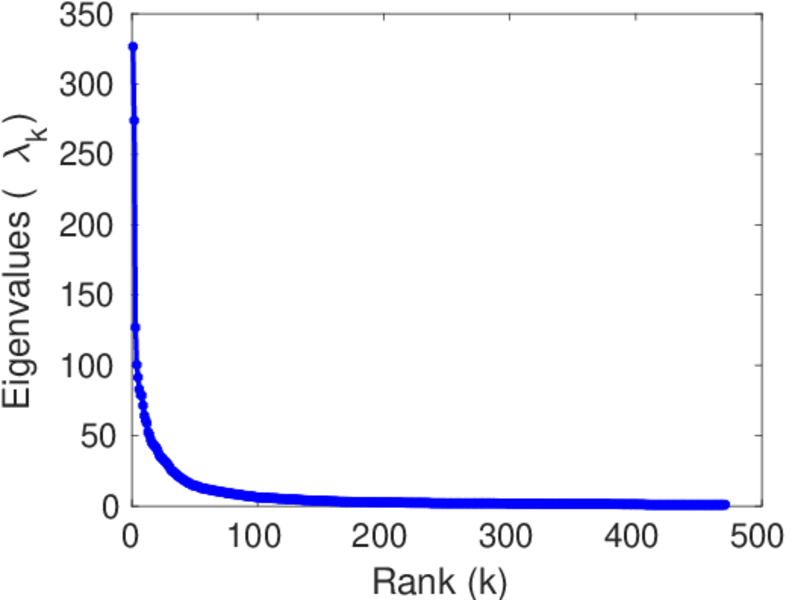
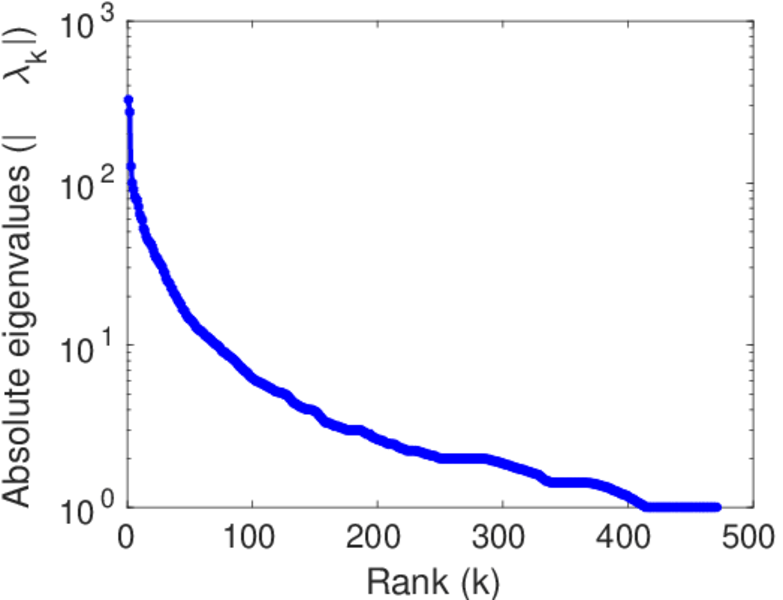
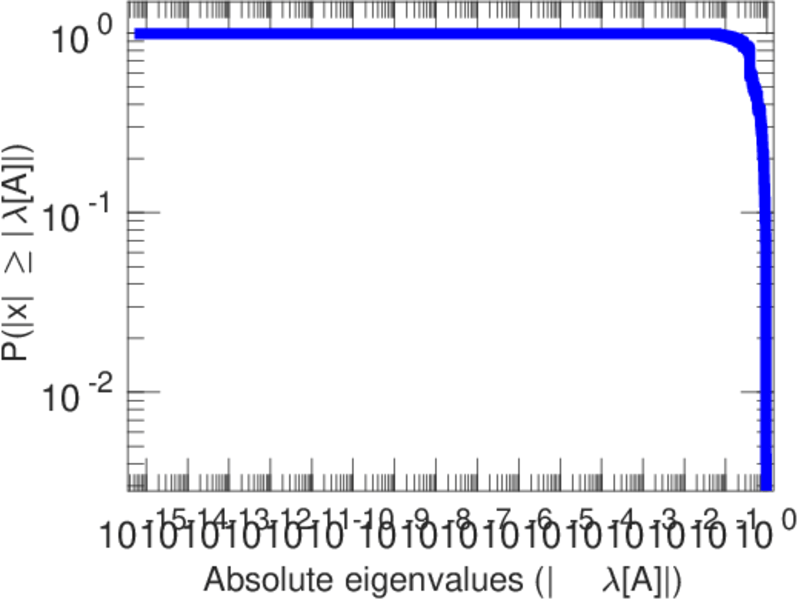
| Spectral norm | α = | 326.552
|
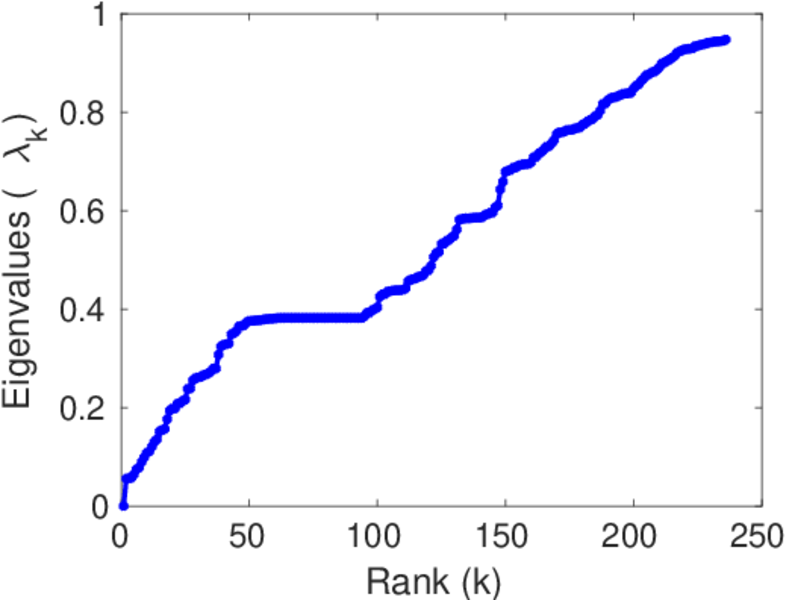
| Algebraic connectivity | a = | 0.055 814 3
|
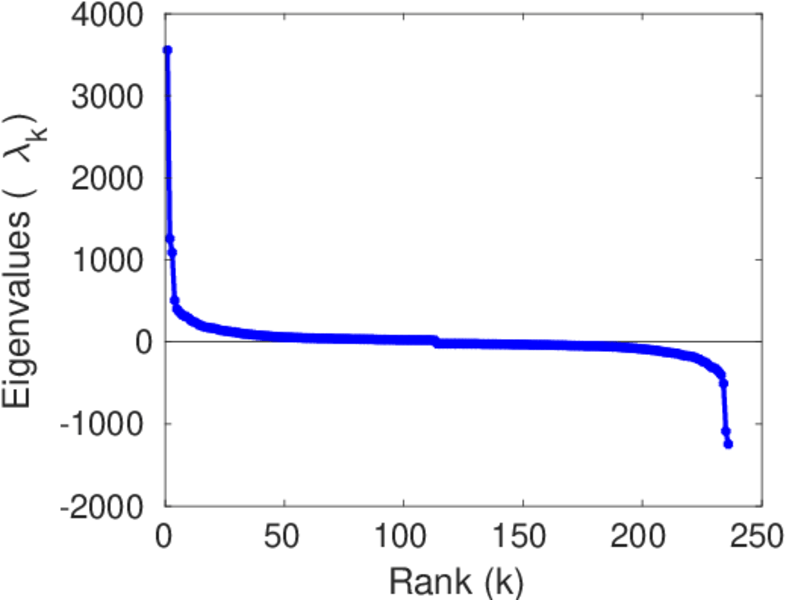
| Spectral separation | |λ1[A] / λ2[A]| = | 1.191 79
|
| Controllability | C = | 2,097
|
| Relative controllability | Cr = | 0.598 972
|
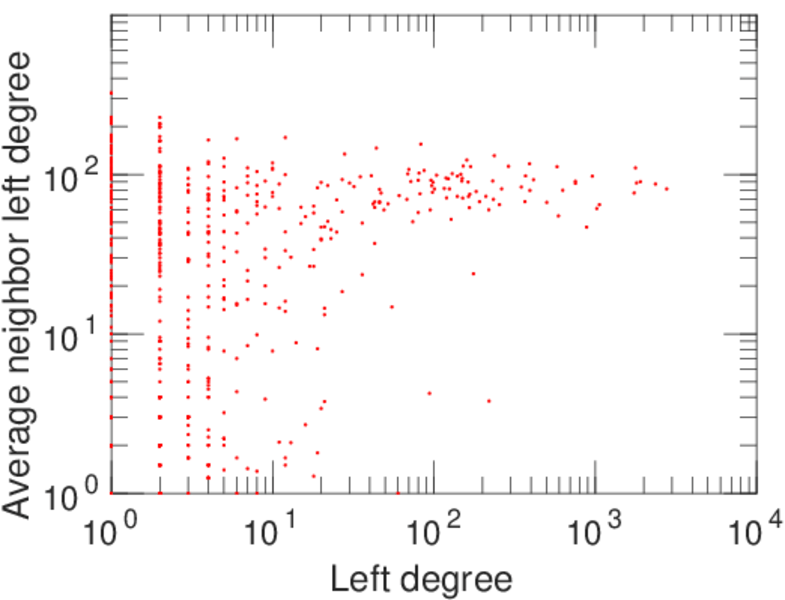
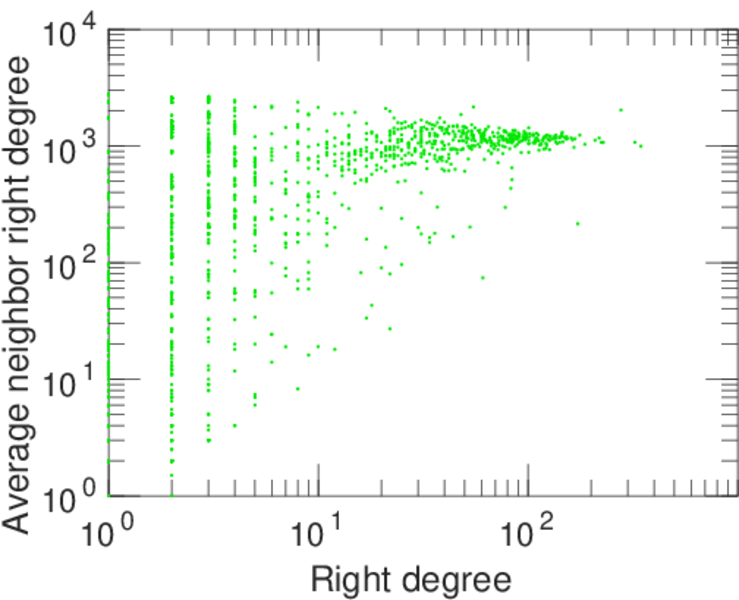
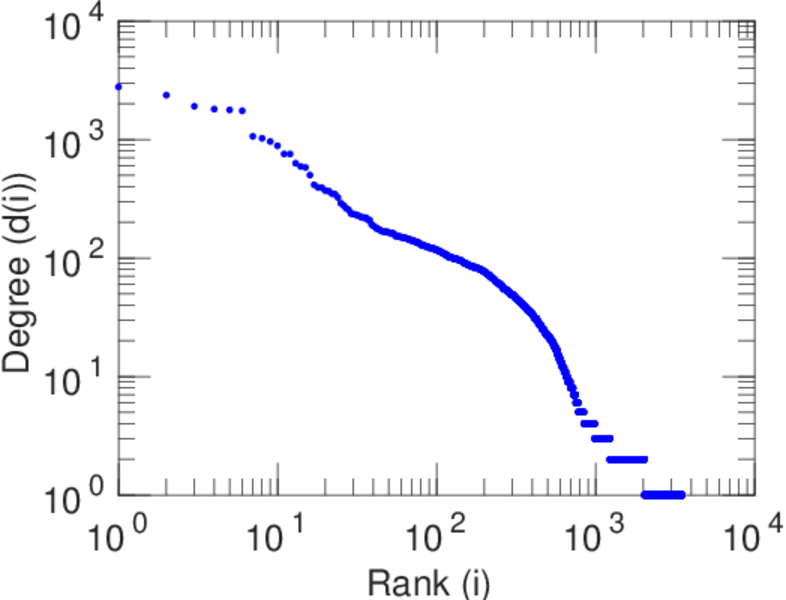
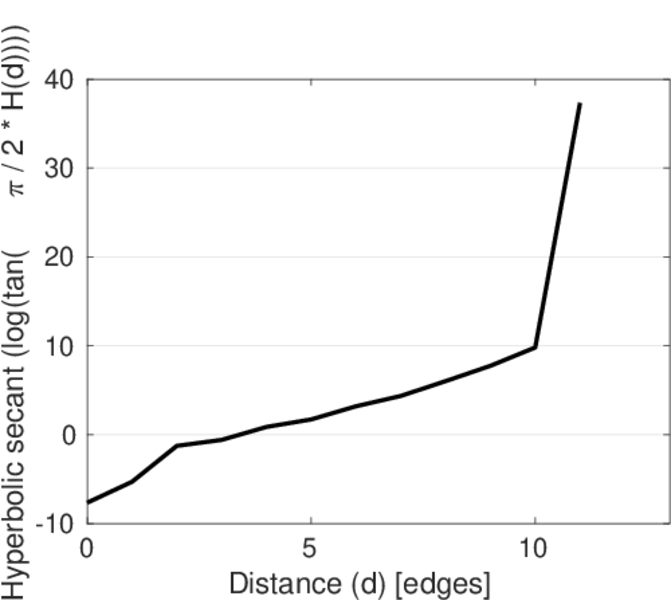
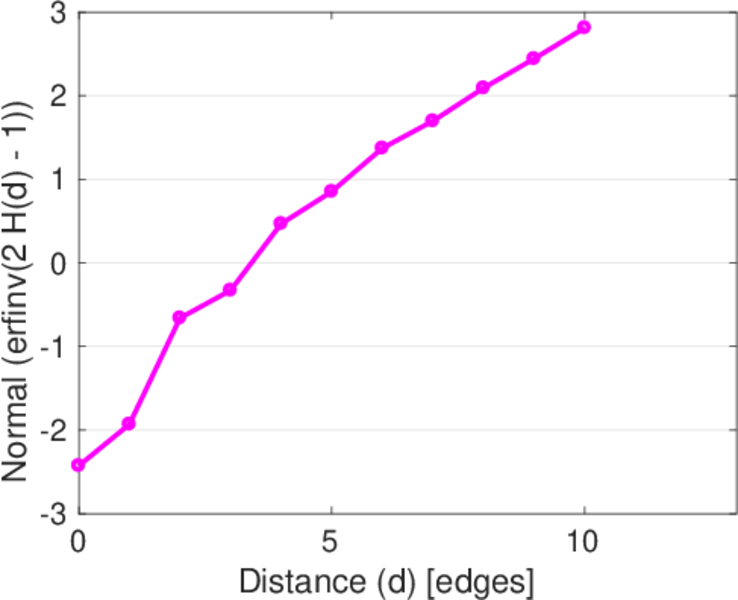
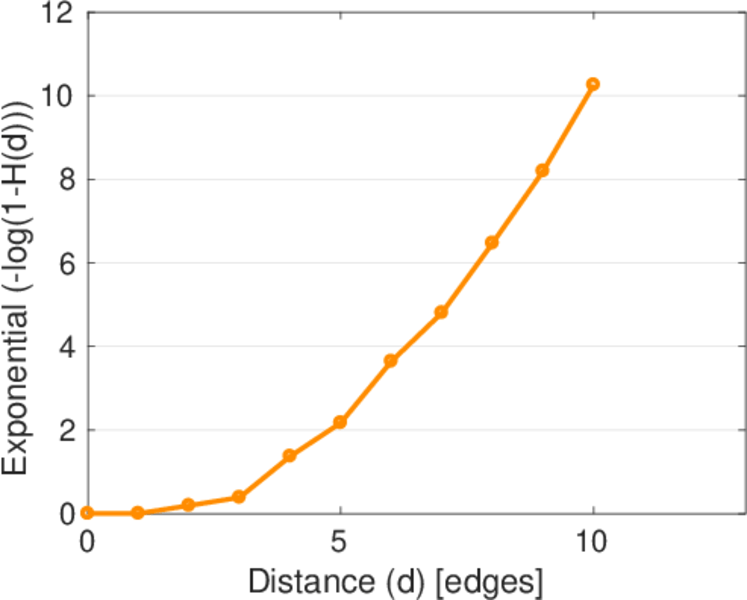
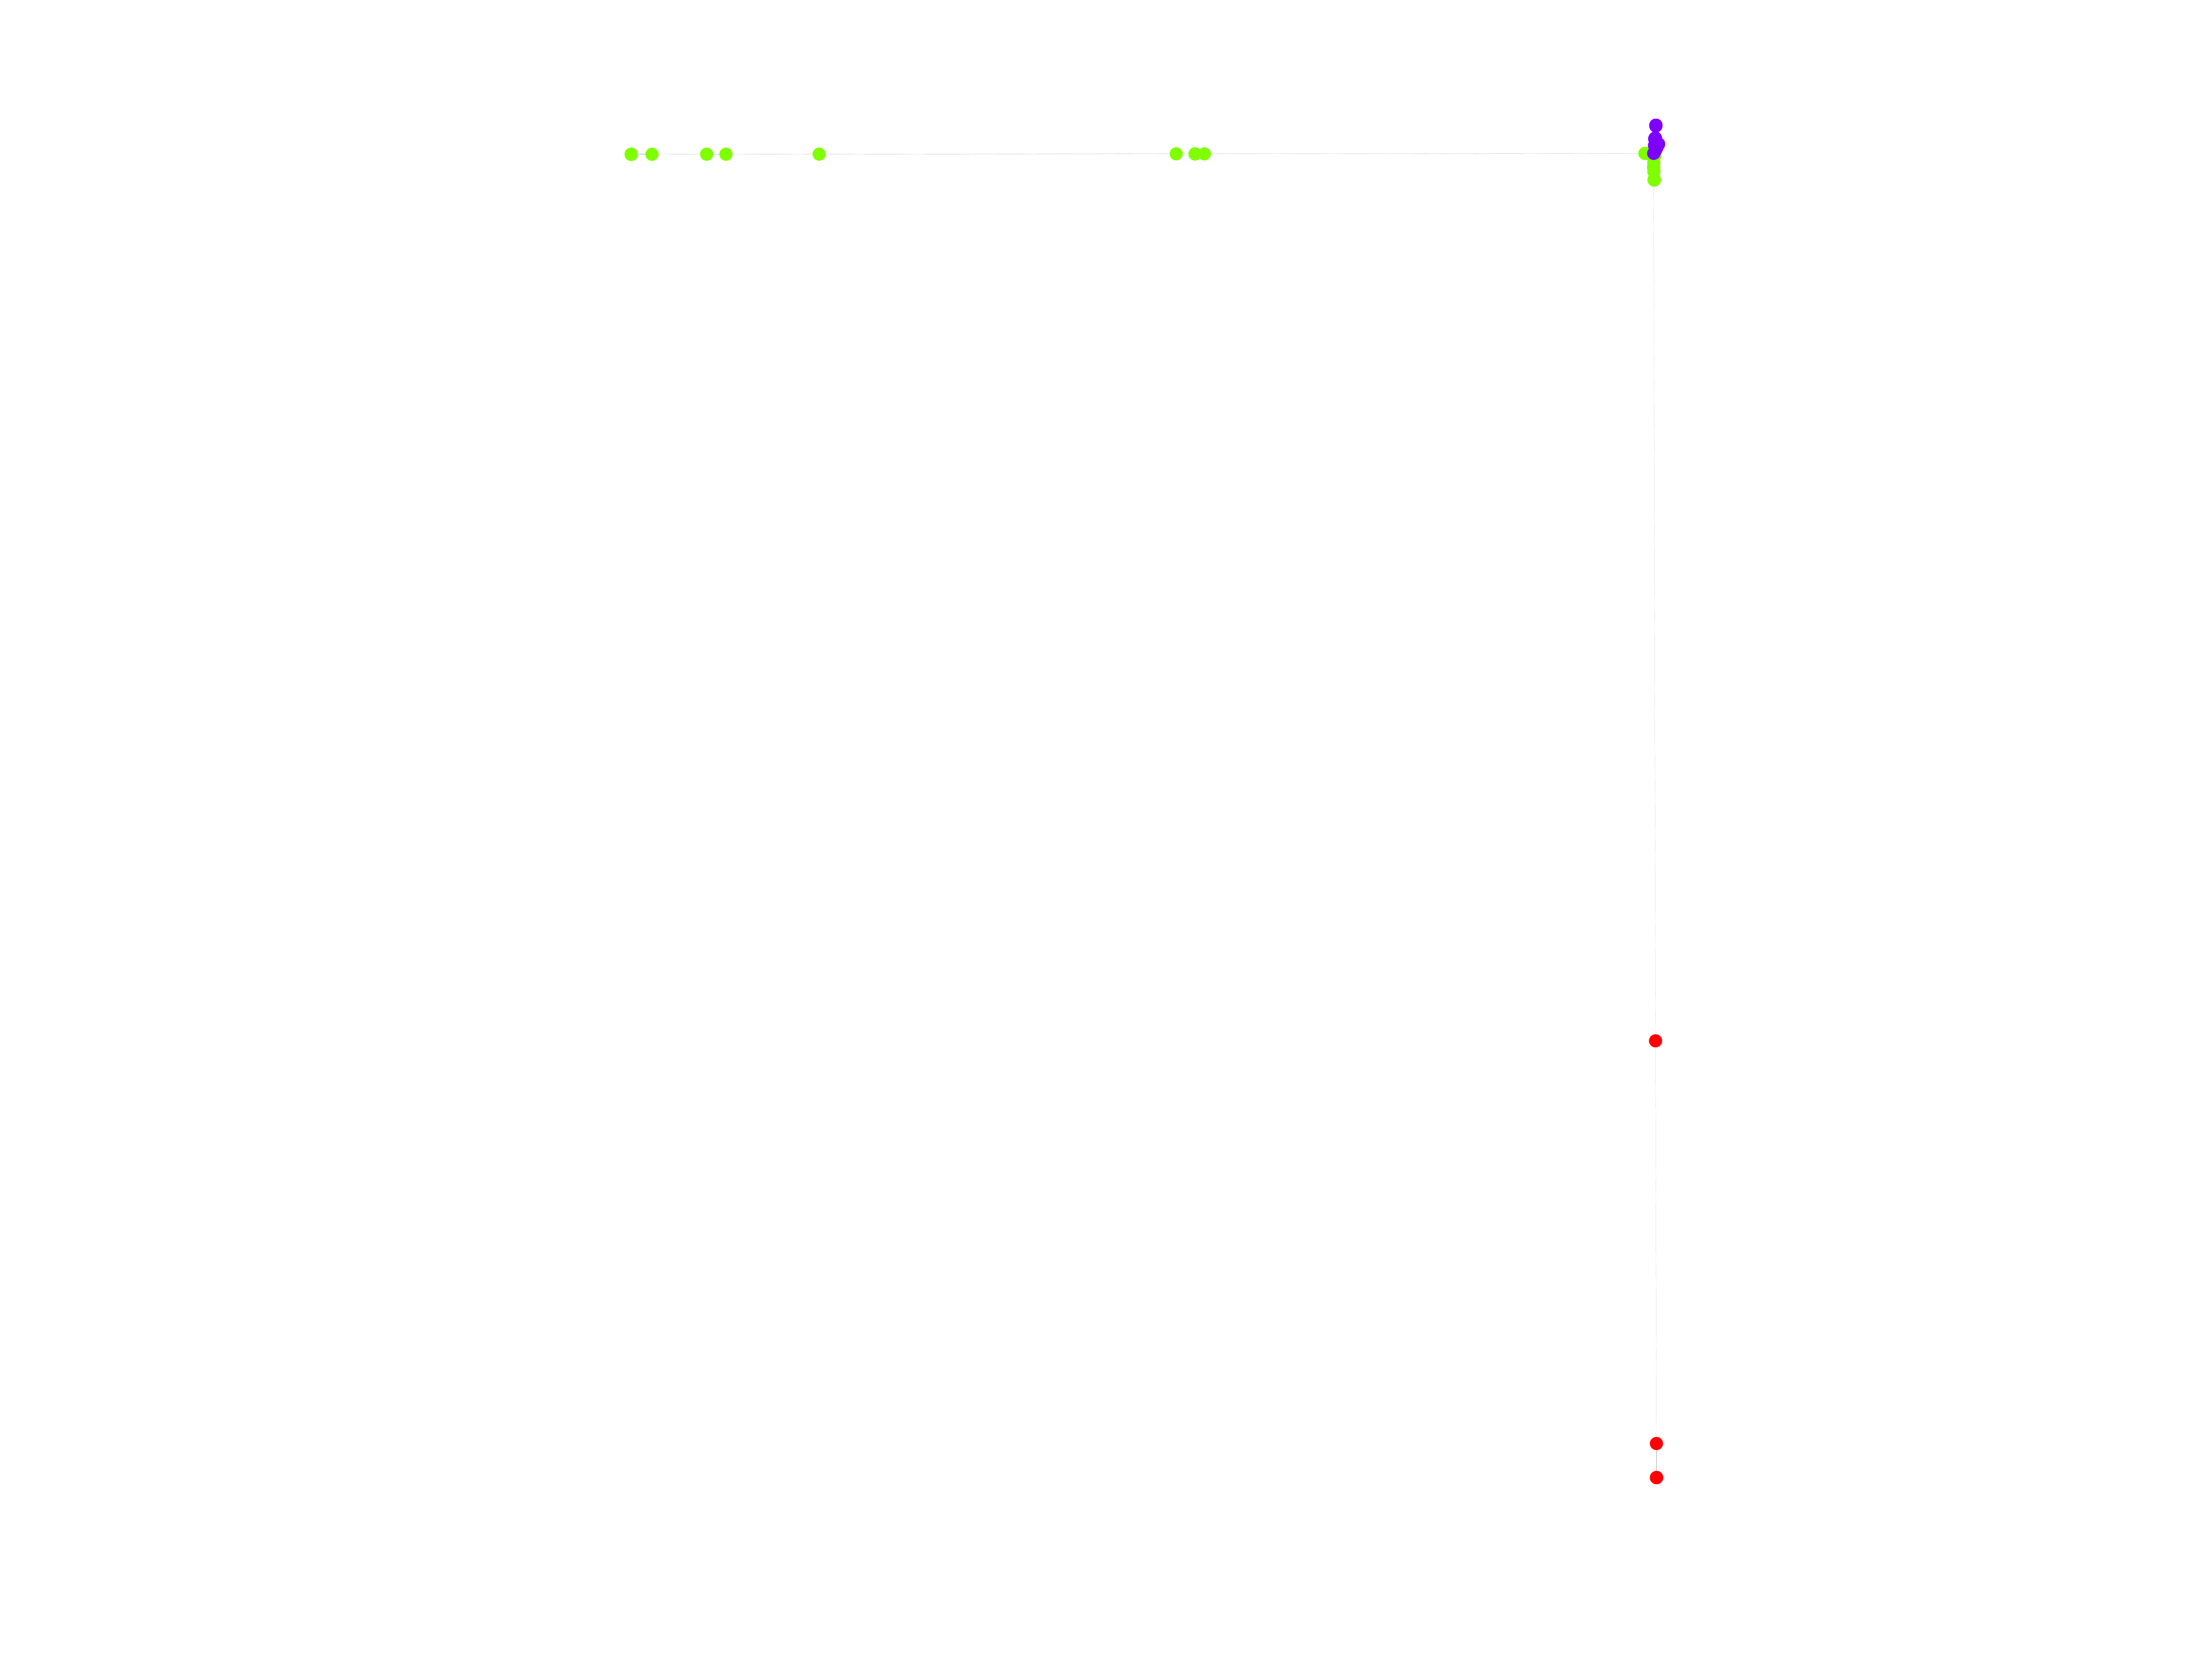
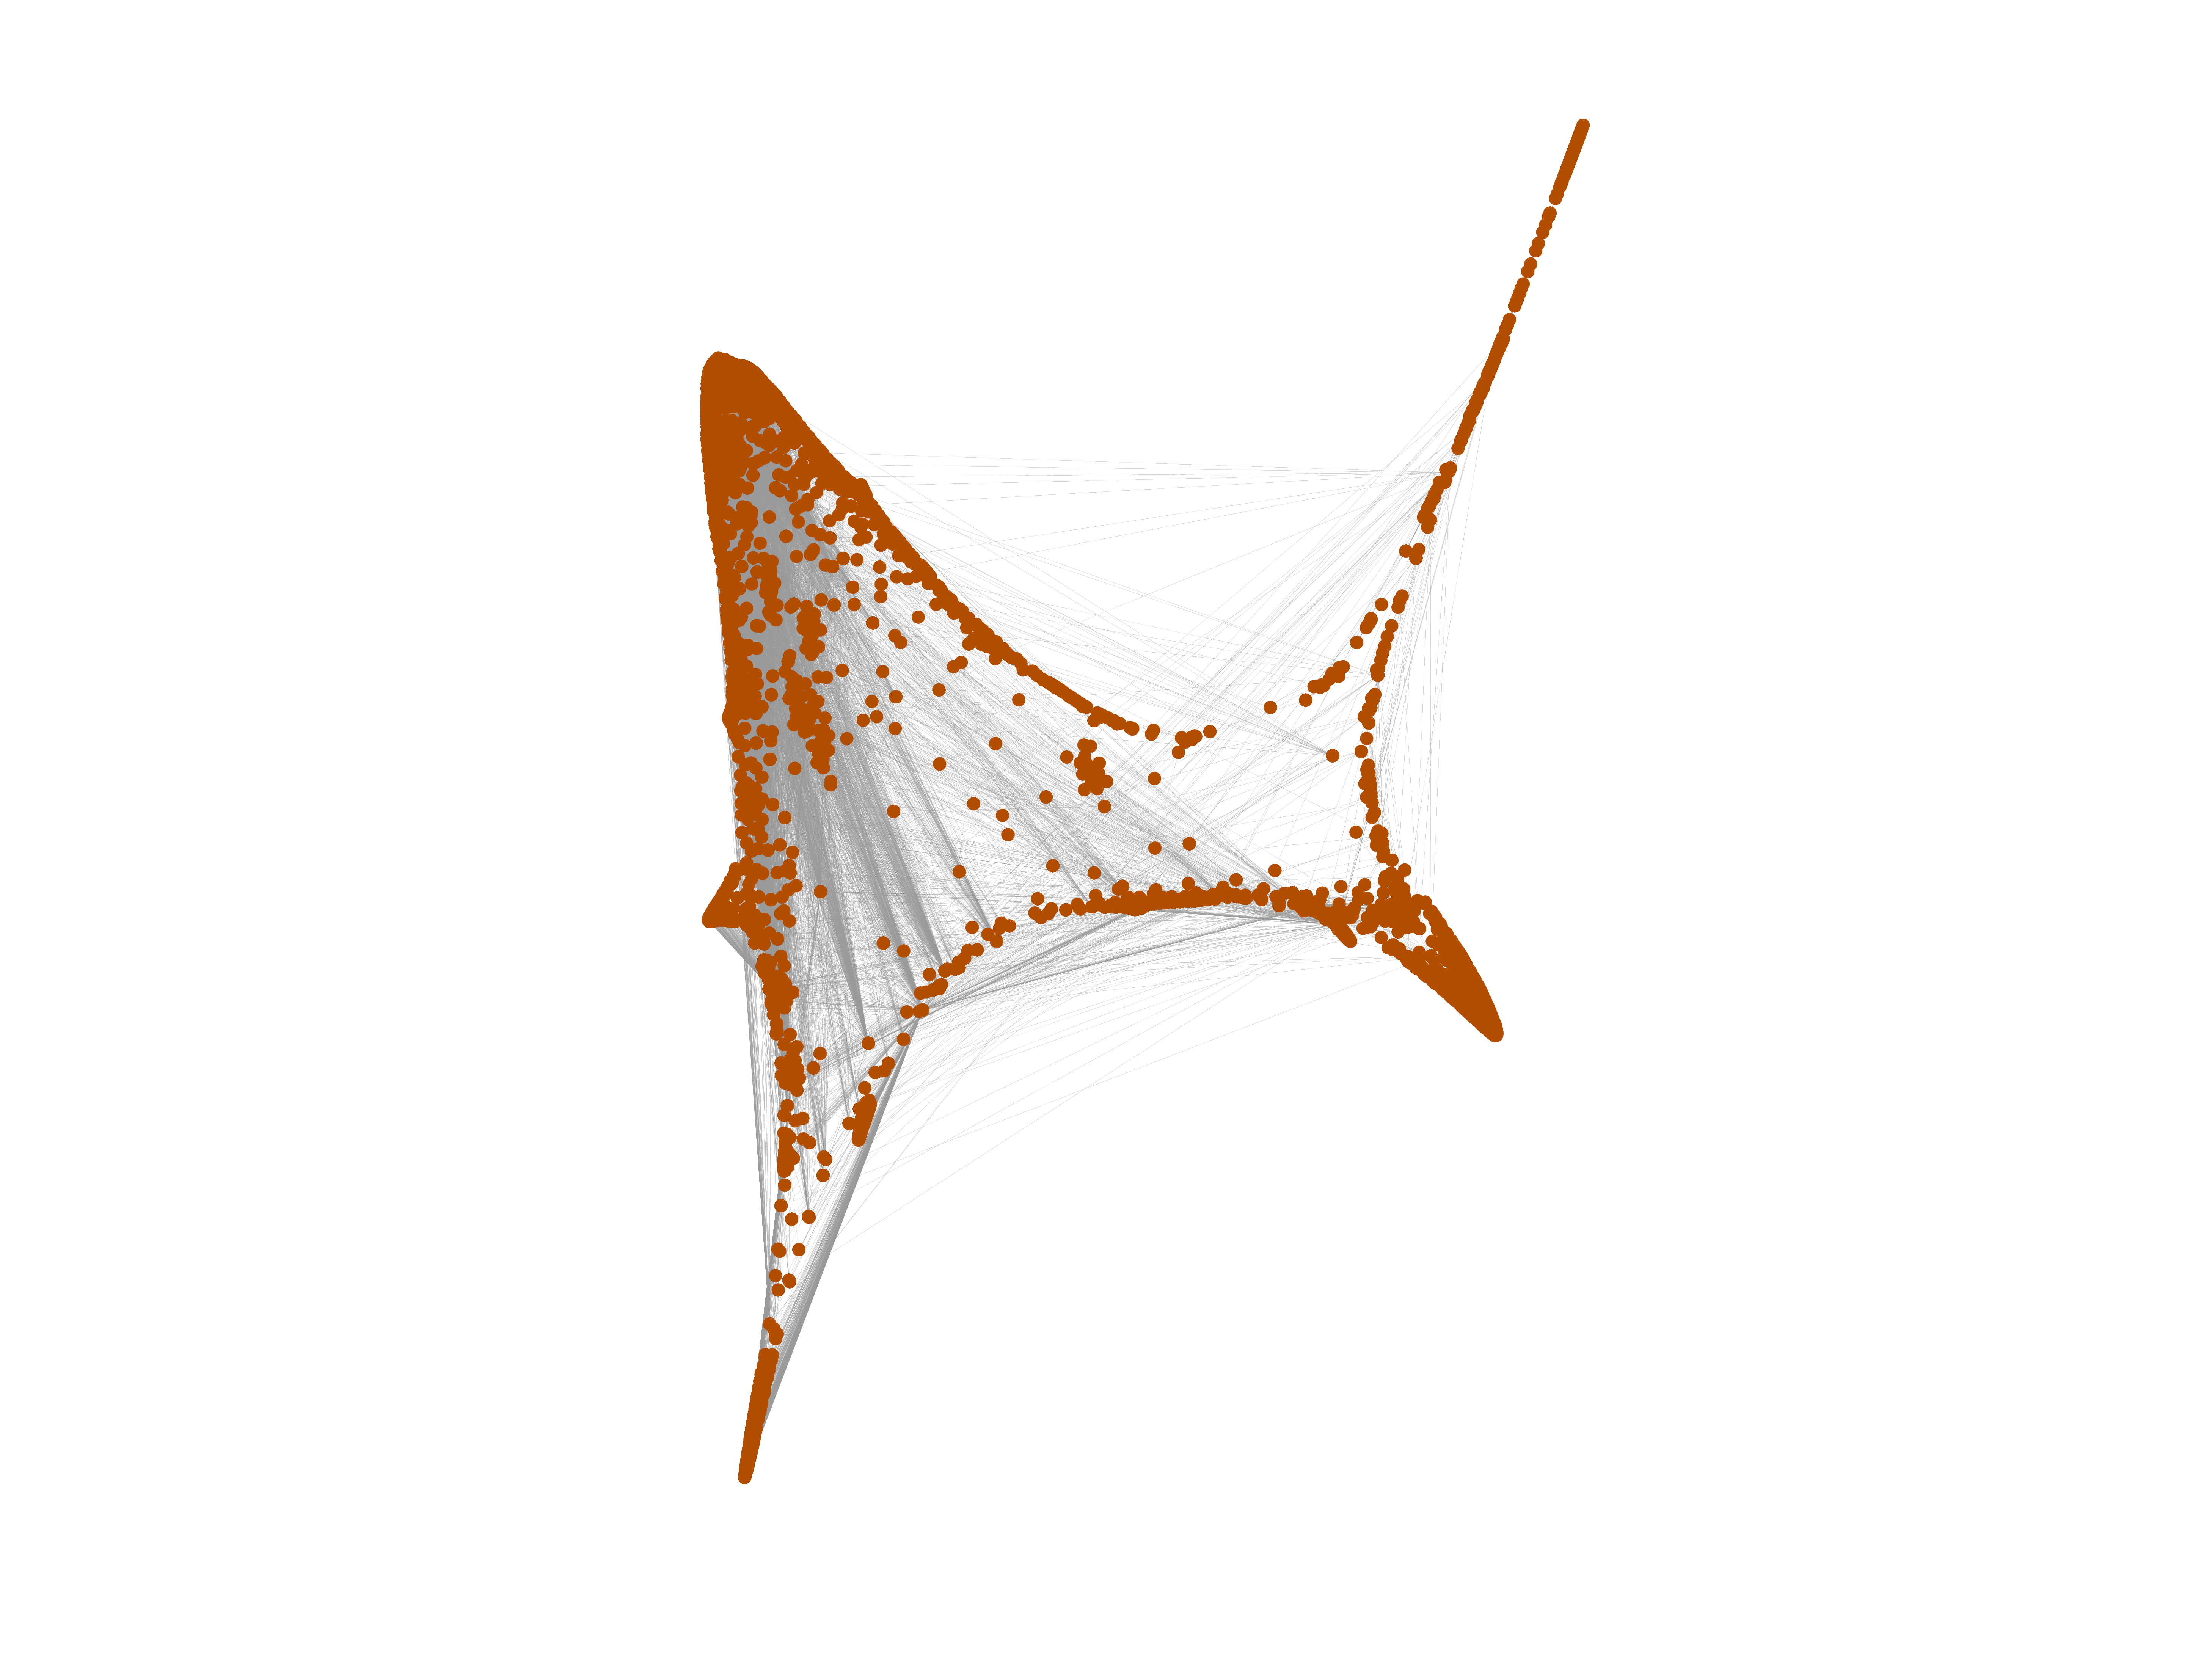
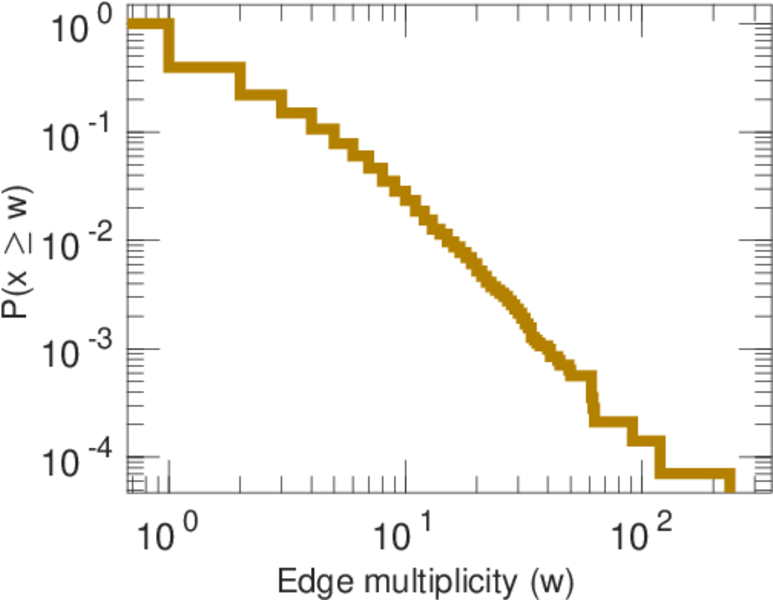
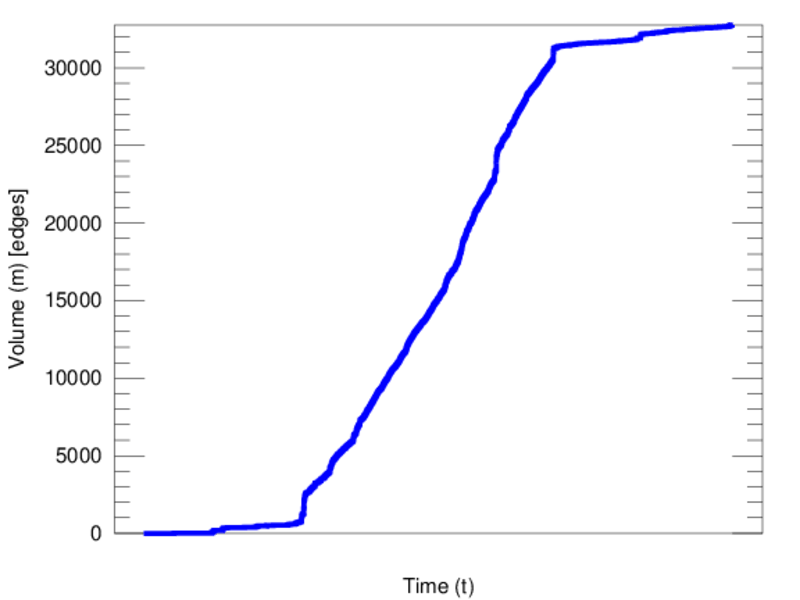
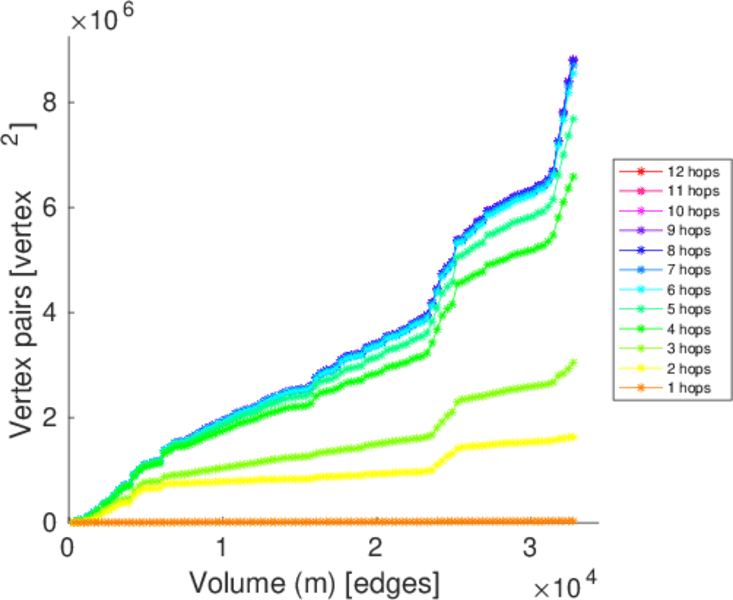
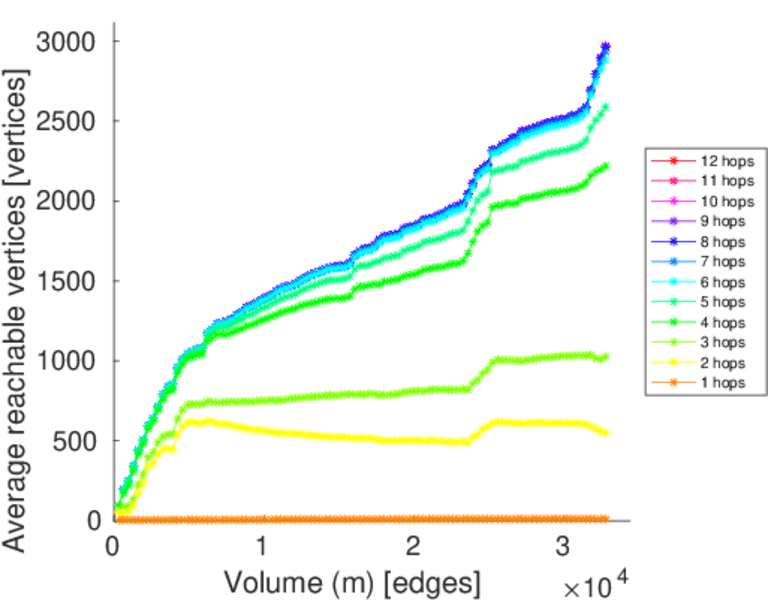
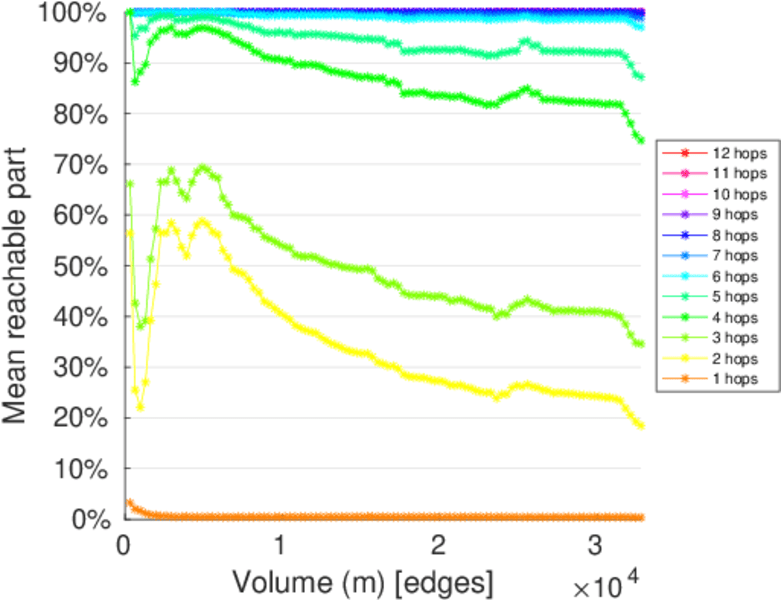
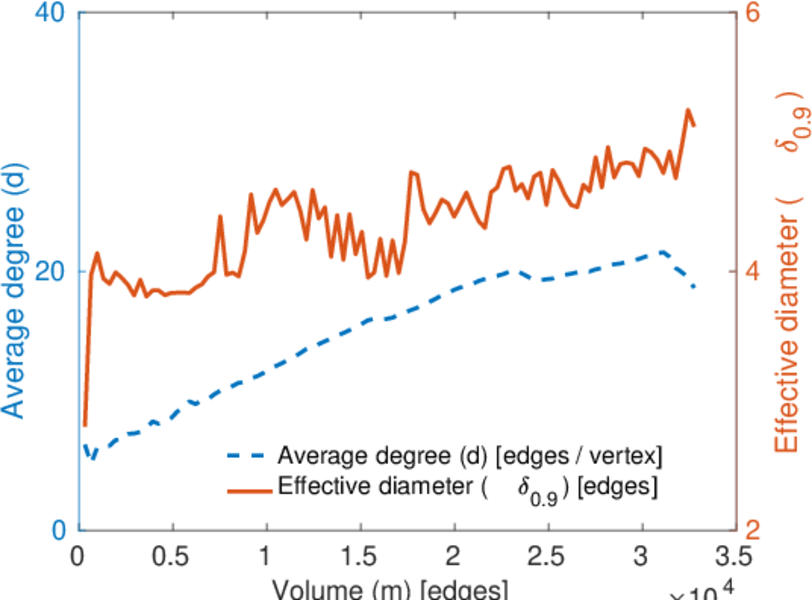
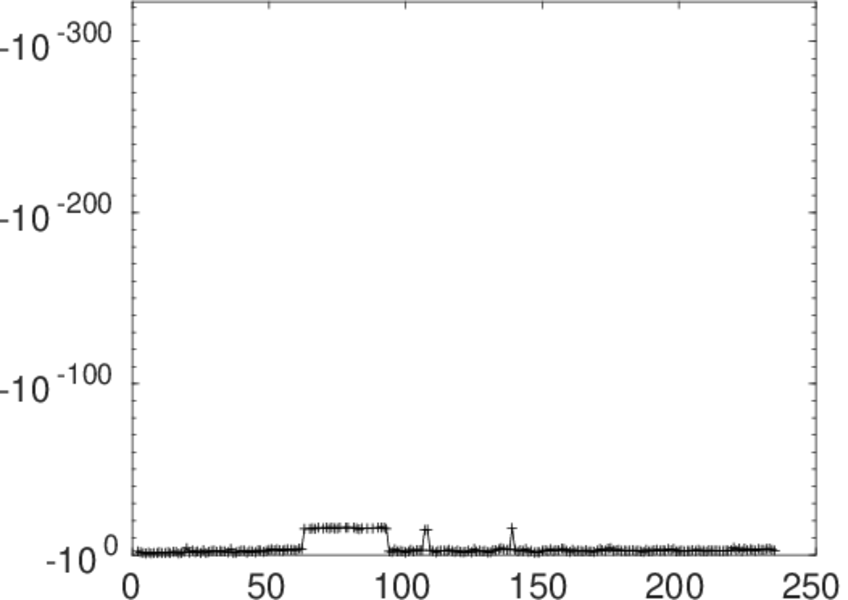
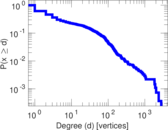
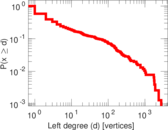
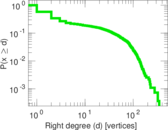
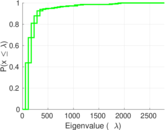
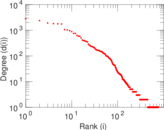
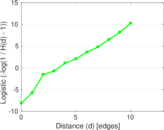
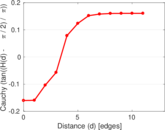
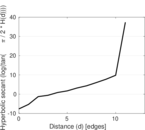
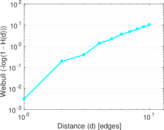
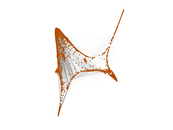
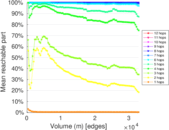
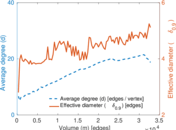
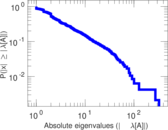
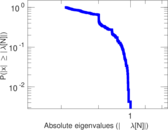
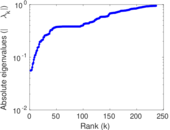
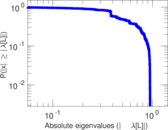
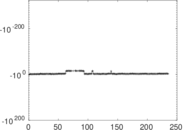
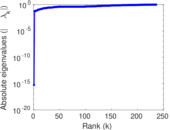
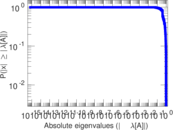
Plots


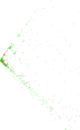

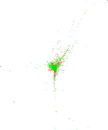


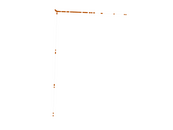


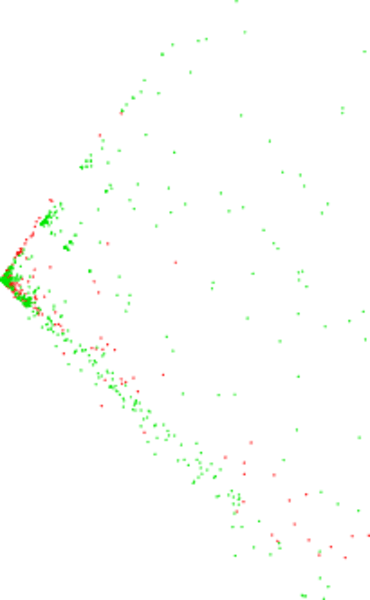
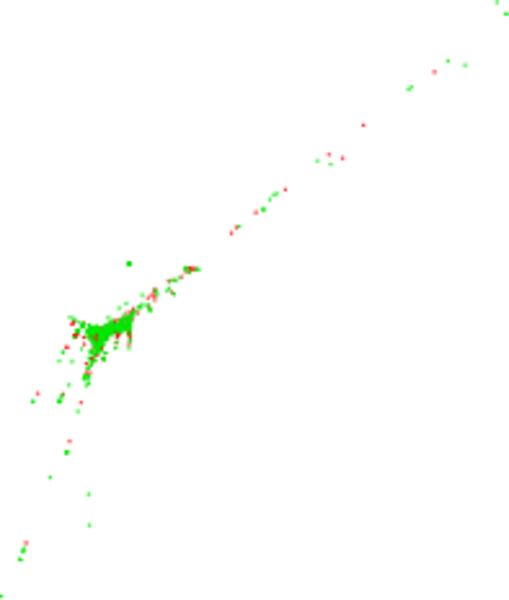
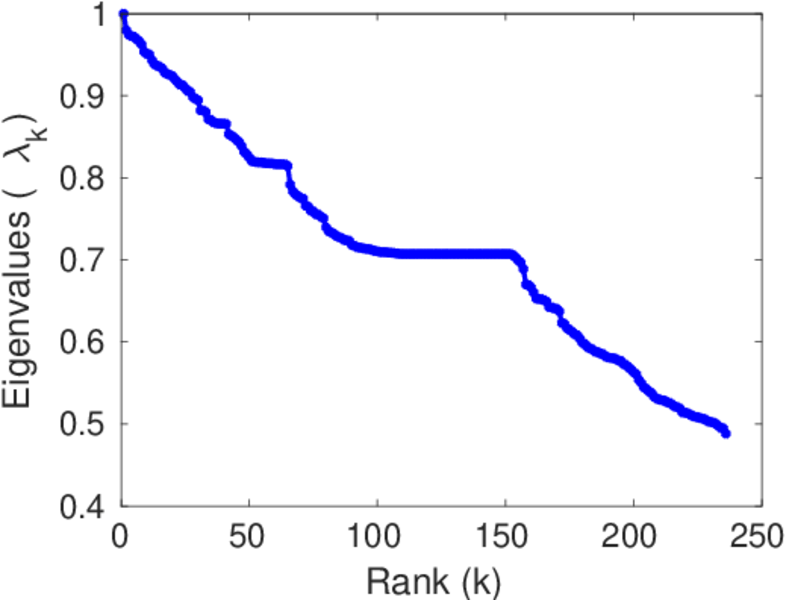
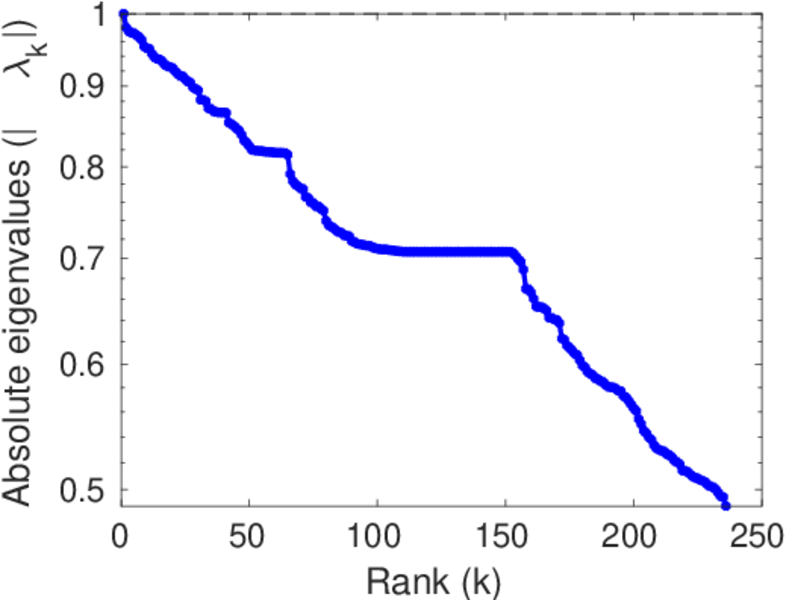
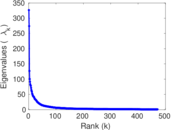
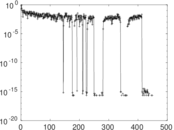
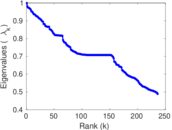
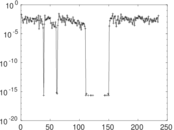
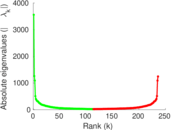
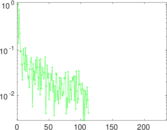
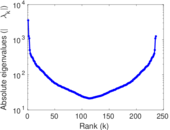
Matrix decompositions plots


Downloads
References
|
[1]
|
Jérôme Kunegis.
KONECT – The Koblenz Network Collection.
In Proc. Int. Conf. on World Wide Web Companion, pages
1343–1350, 2013.
[ http ]
|
|
[2]
|
Wikimedia Foundation.
Wikimedia downloads.
http://dumps.wikimedia.org/, January 2010.
|
 KONECT ‣ Networks ‣
Buy Me a Coffee
KONECT ‣ Networks ‣
Buy Me a Coffee