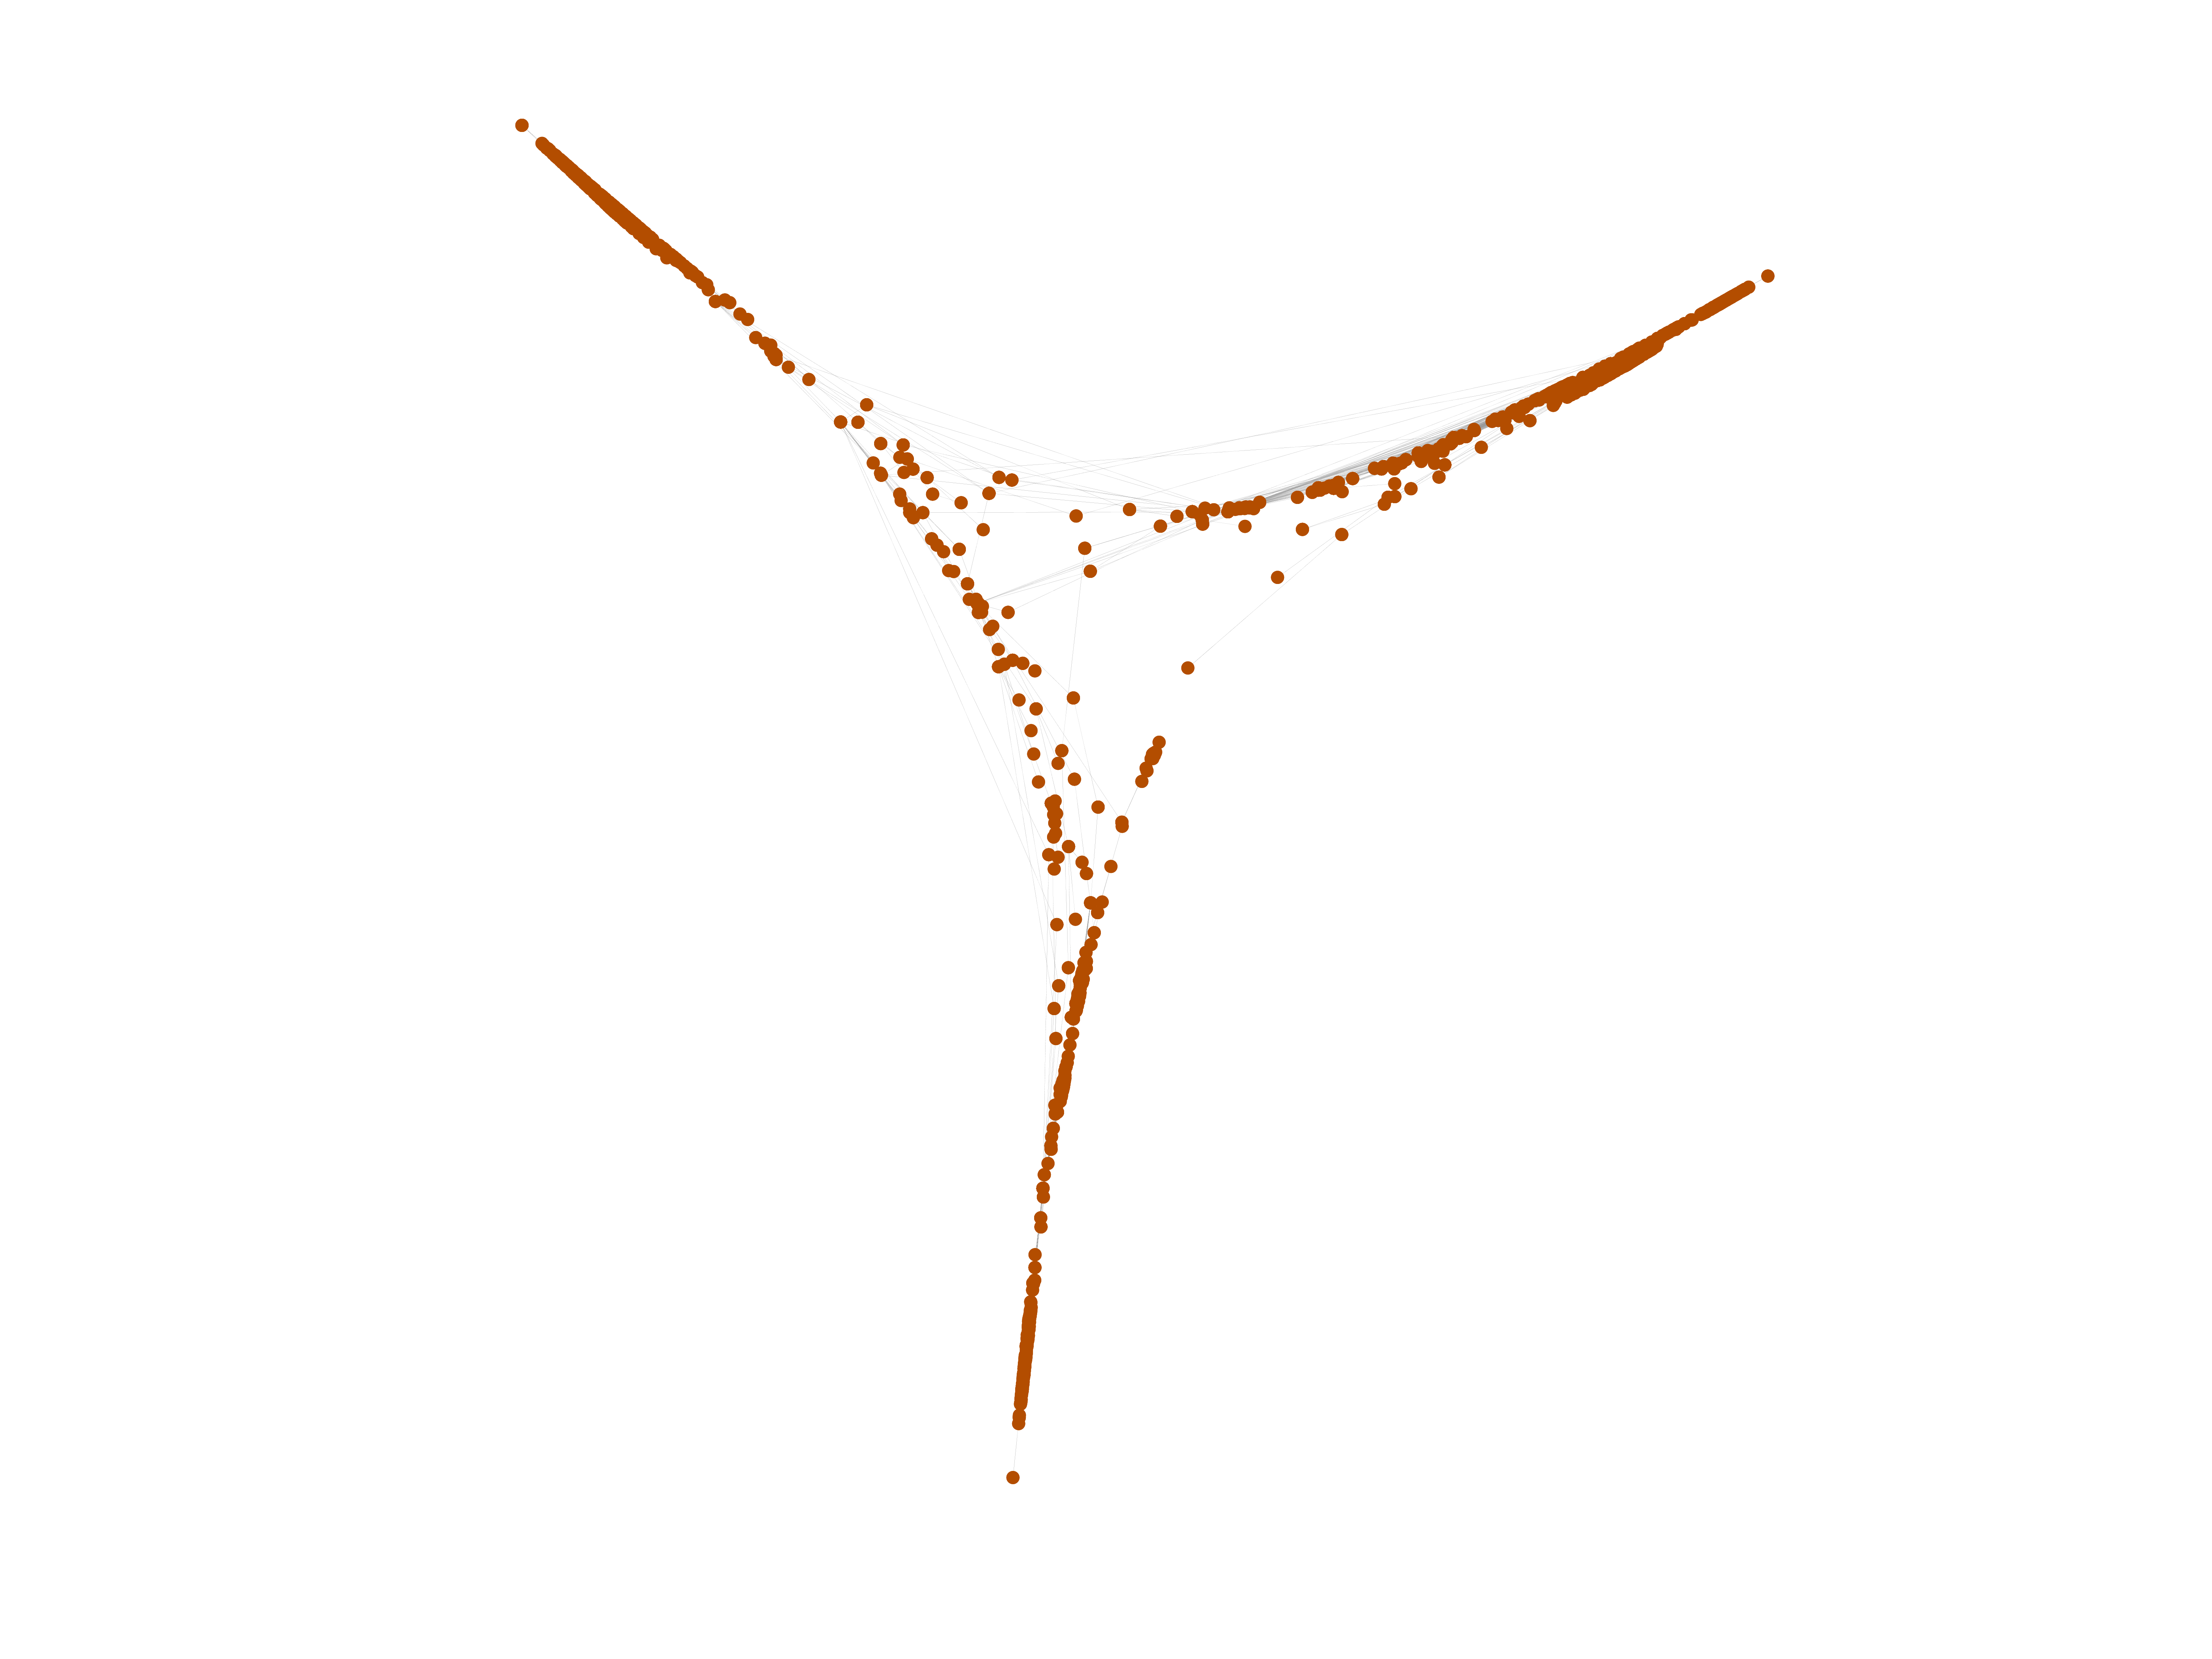
Wiktionary edits (iu)
This is the bipartite edit network of the Inuktitut Wiktionary. It contains
users and pages from the Inuktitut Wiktionary, connected by edit events. Each
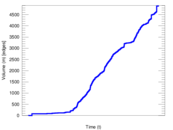
edge represents an edit. The dataset includes the timestamp of each edit.
Metadata
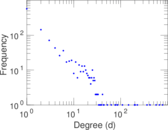
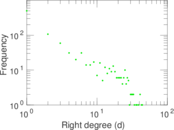
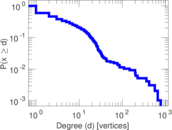
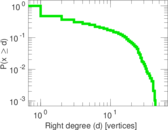
Statistics
| Size | n = | 1,152
|
| Left size | n1 = | 183
|
| Right size | n2 = | 969
|
| Volume | m = | 4,910
|
| Unique edge count | m̿ = | 2,432
|
| Wedge count | s = | 155,979
|
| Claw count | z = | 8,850,183
|
| Cross count | x = | 424,464,789
|
| Square count | q = | 173,931
|
| 4-Tour count | T4 = | 2,020,536
|
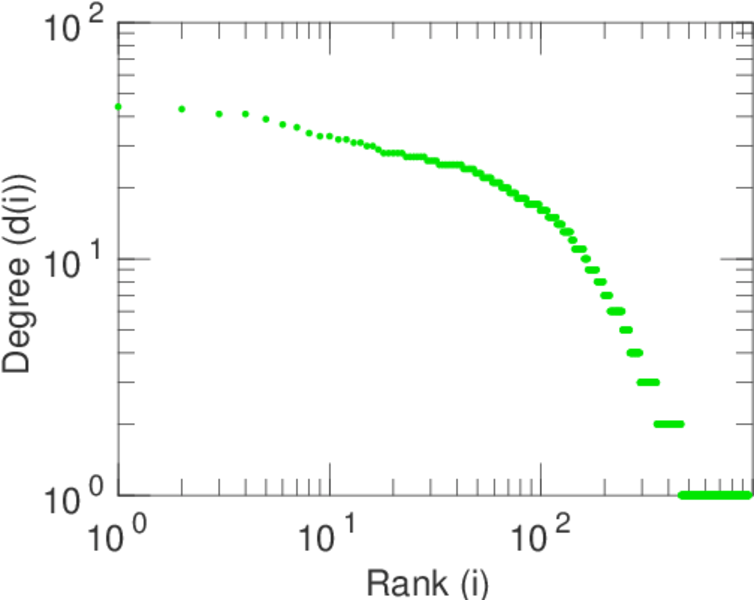
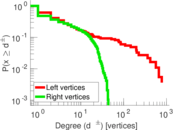
| Maximum degree | dmax = | 780
|
| Maximum left degree | d1max = | 780
|
| Maximum right degree | d2max = | 44
|
| Average degree | d = | 8.524 31
|
| Average left degree | d1 = | 26.830 6
|
| Average right degree | d2 = | 5.067 08
|
| Fill | p = | 0.013 714 8
|
| Average edge multiplicity | m̃ = | 2.018 91
|
| Size of LCC | N = | 842
|
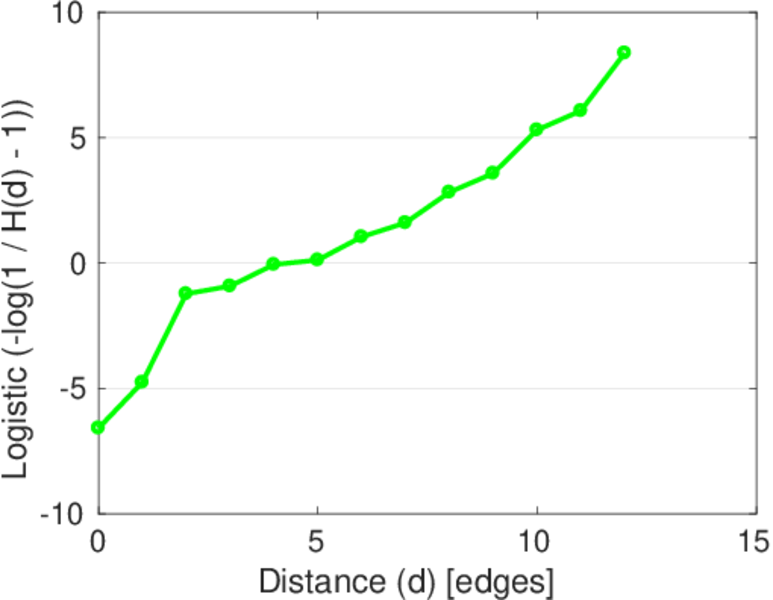
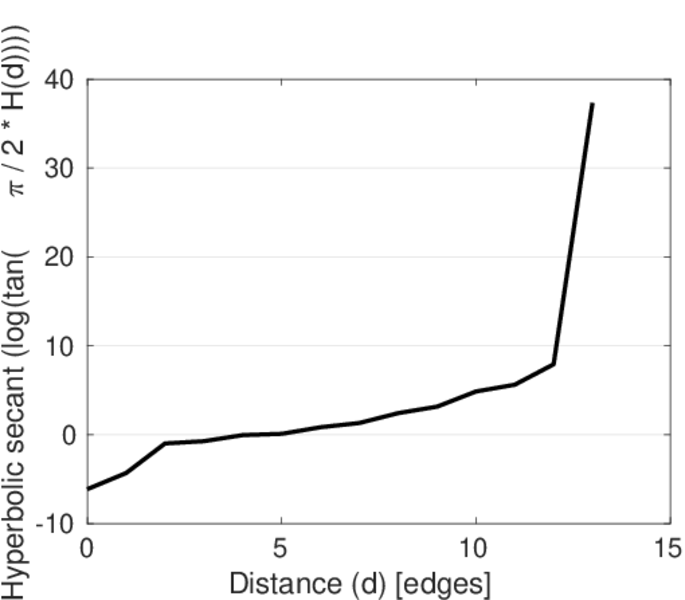
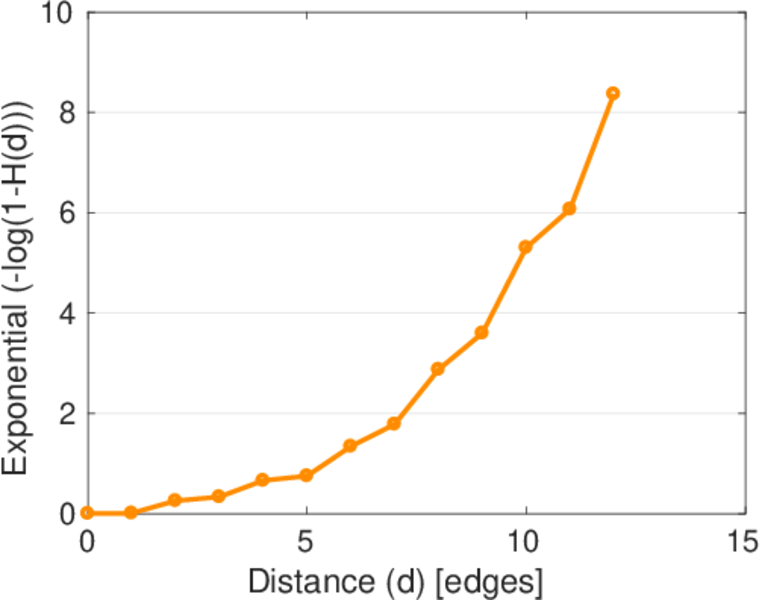
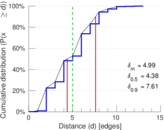
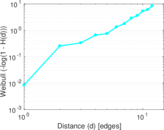
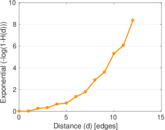
| Diameter | δ = | 14
|
| 50-Percentile effective diameter | δ0.5 = | 4.380 02
|
| 90-Percentile effective diameter | δ0.9 = | 7.611 28
|
| Median distance | δM = | 5
|
| Mean distance | δm = | 4.992 25
|
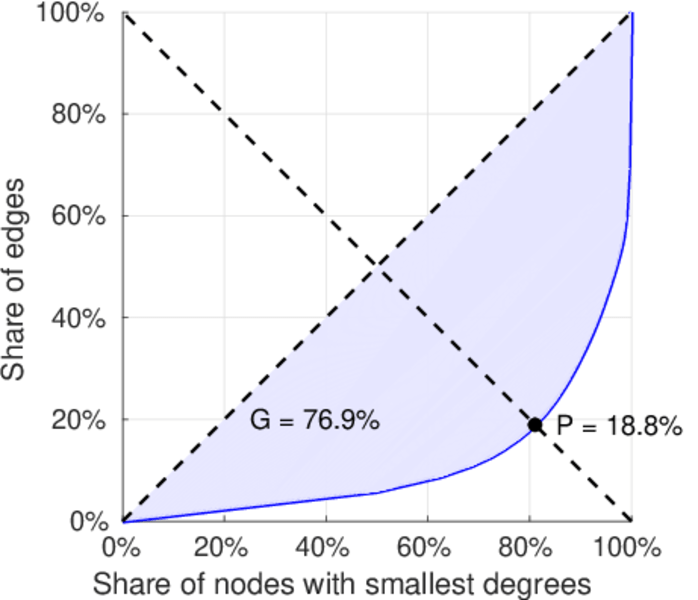
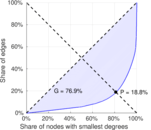
| Gini coefficient | G = | 0.757 900
|
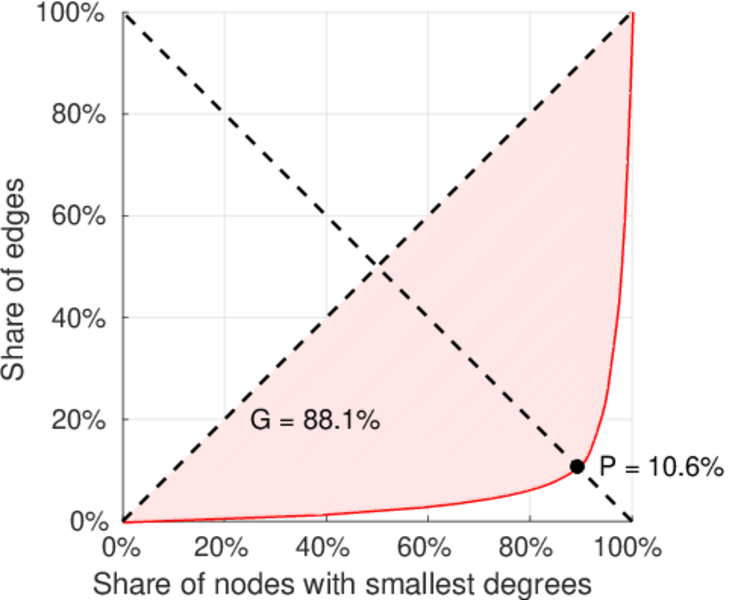
| Balanced inequality ratio | P = | 0.197 556
|
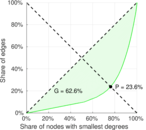
| Left balanced inequality ratio | P1 = | 0.105 703
|
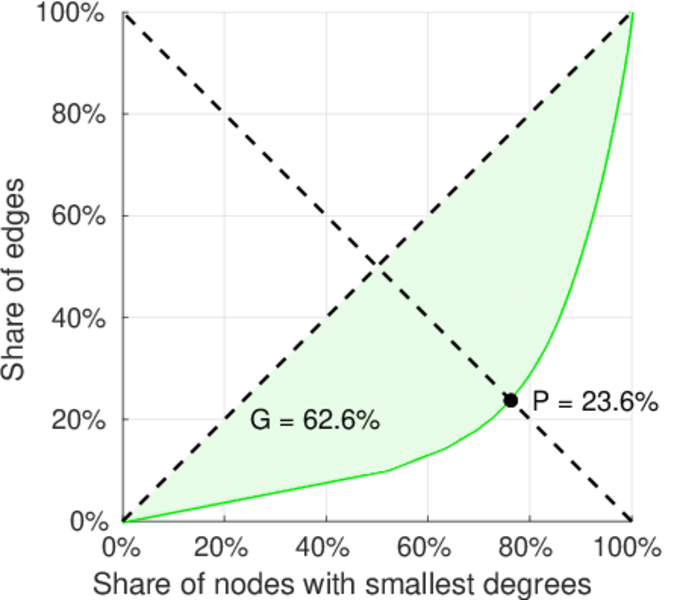
| Right balanced inequality ratio | P2 = | 0.235 642
|
| Relative edge distribution entropy | Her = | 0.810 293
|
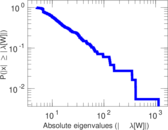
| Power law exponent | γ = | 2.548 55
|
| Tail power law exponent | γt = | 1.921 00
|
| Tail power law exponent with p | γ3 = | 1.921 00
|
| p-value | p = | 0.000 00
|
| Left tail power law exponent with p | γ3,1 = | 1.691 00
|
| Left p-value | p1 = | 0.207 000
|
| Right tail power law exponent with p | γ3,2 = | 8.471 00
|
| Right p-value | p2 = | 0.234 000
|
| Degree assortativity | ρ = | +0.216 985
|
| Degree assortativity p-value | pρ = | 2.638 70 × 10−27
|
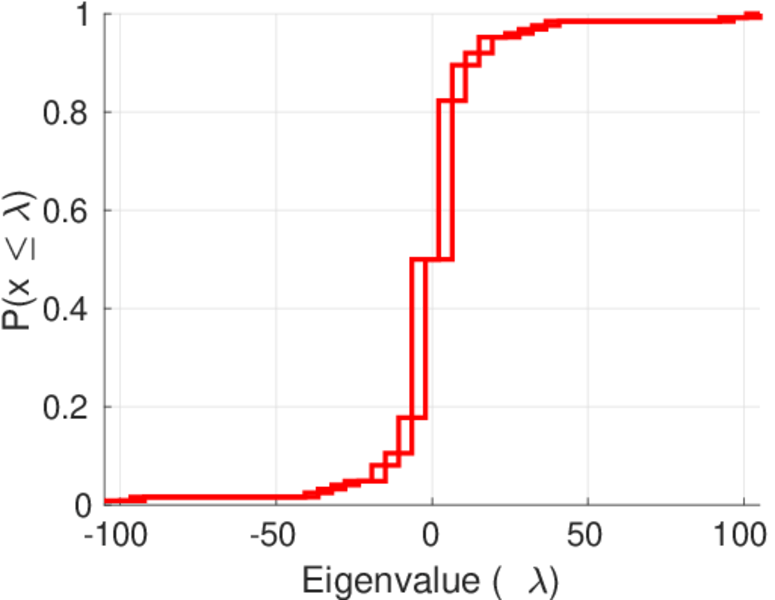
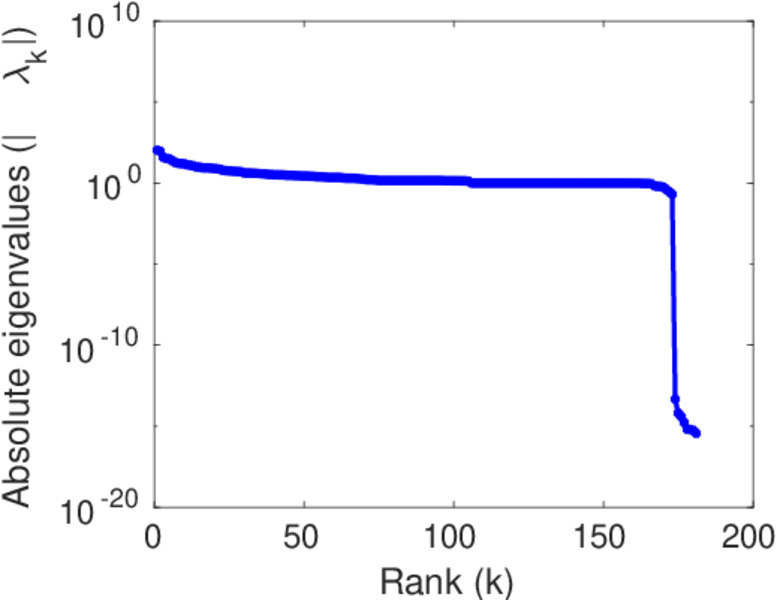
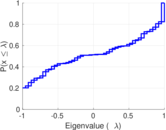
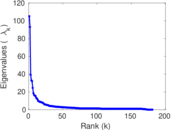
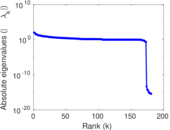
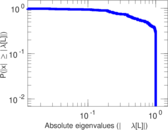
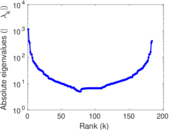
| Spectral norm | α = | 105.088
|
| Algebraic connectivity | a = | 0.012 894 7
|
| Spectral separation | |λ1[A] / λ2[A]| = | 1.130 03
|
| Controllability | C = | 796
|
| Relative controllability | Cr = | 0.697 023
|
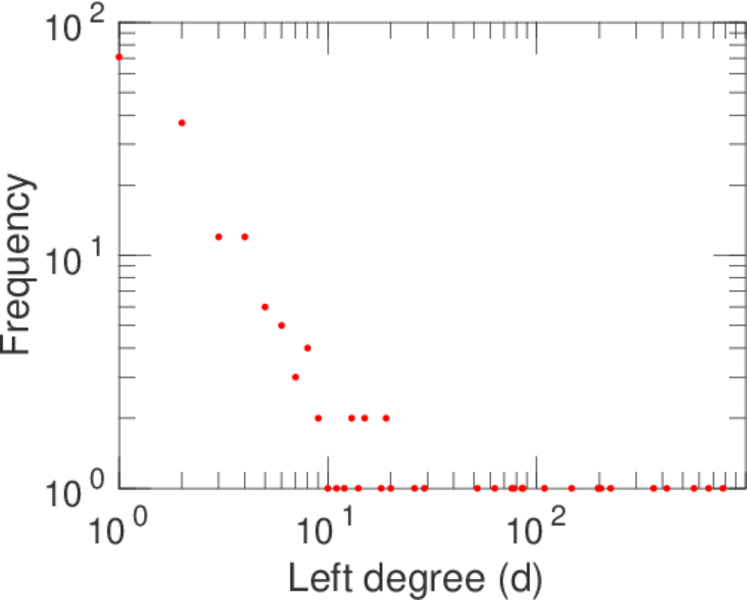
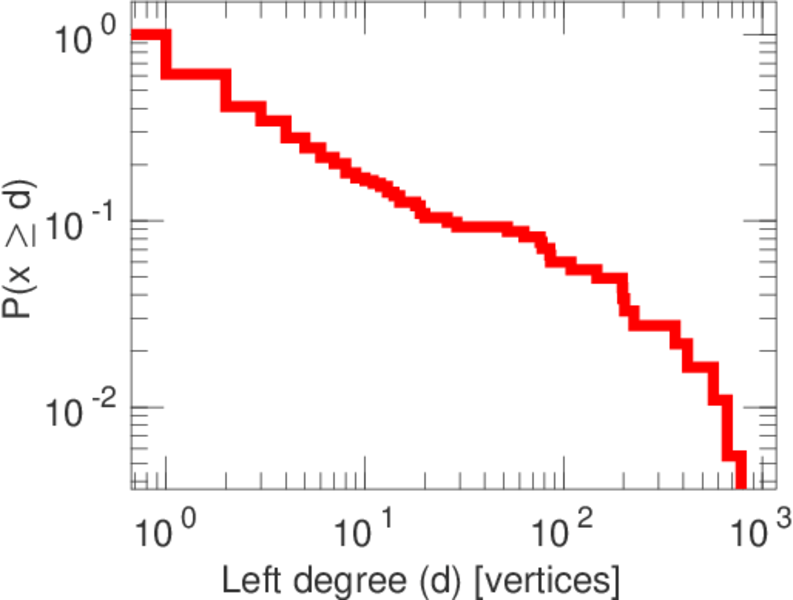
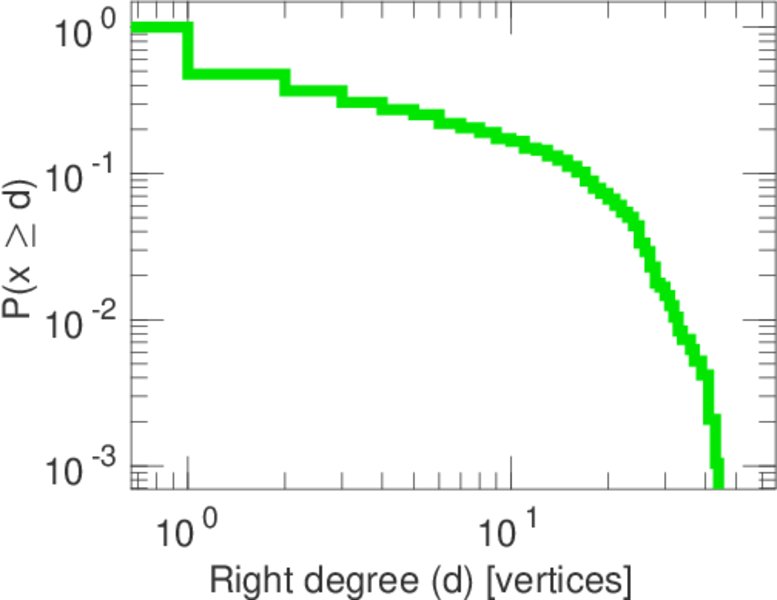
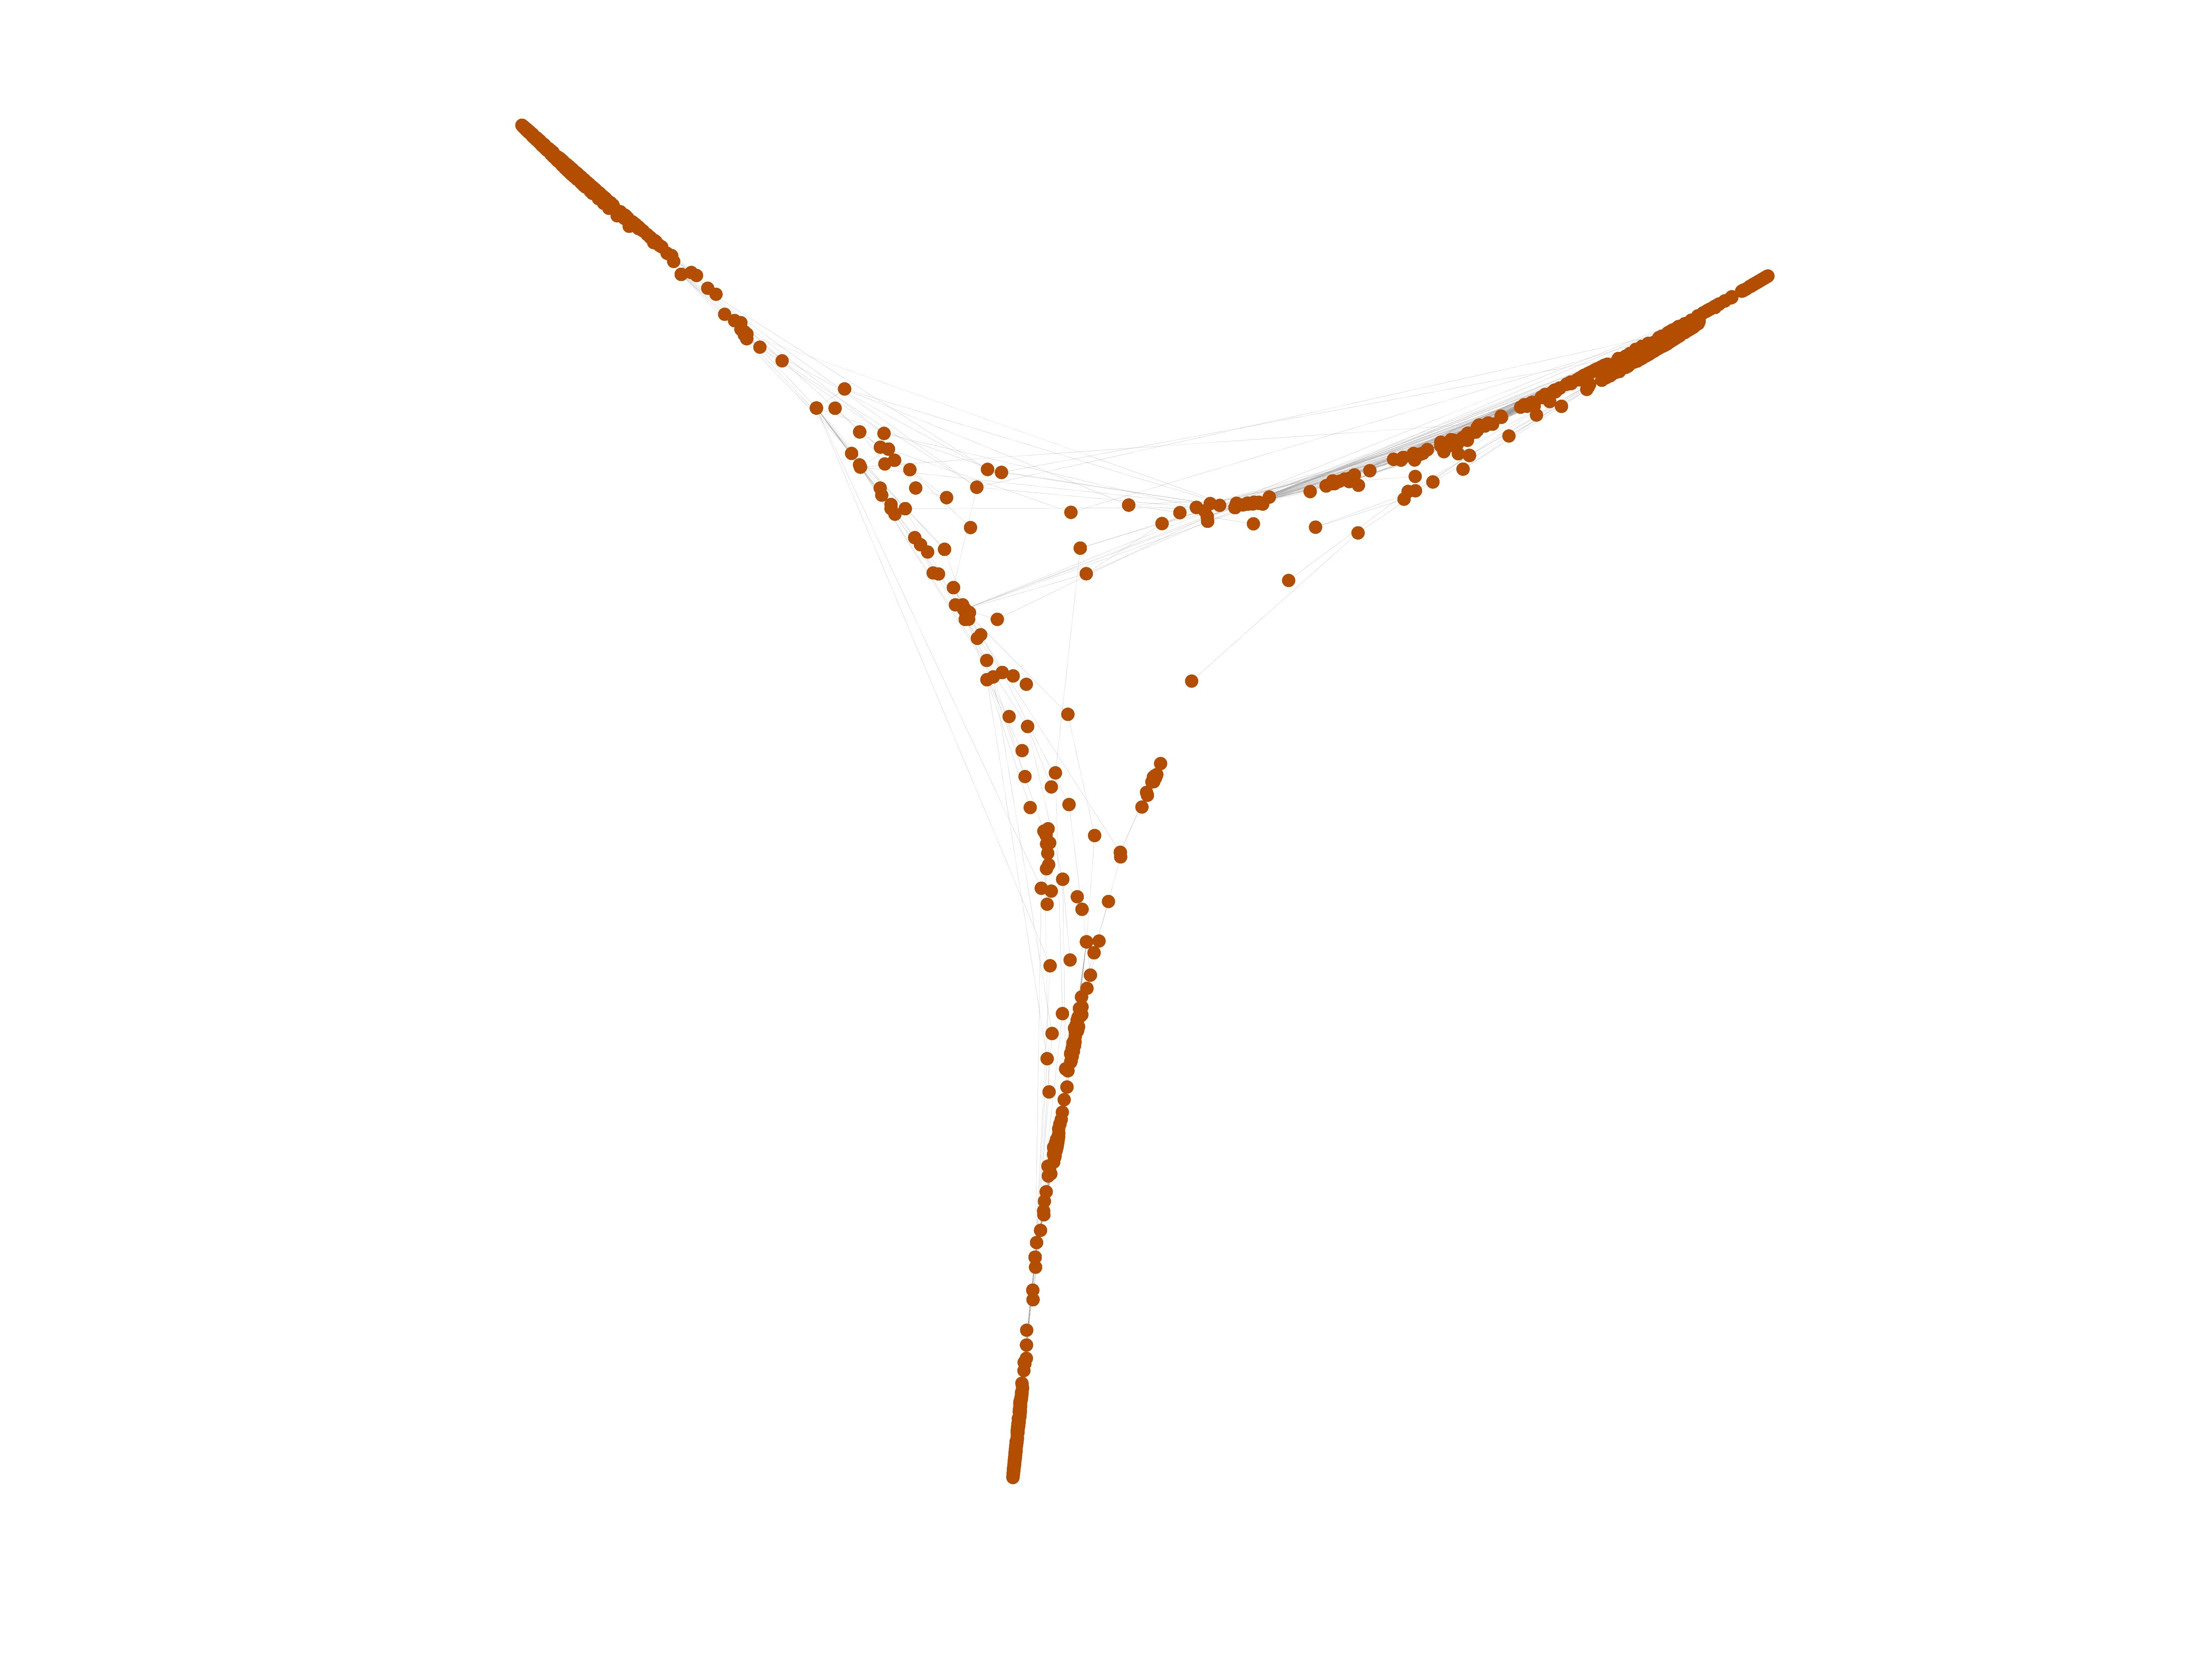
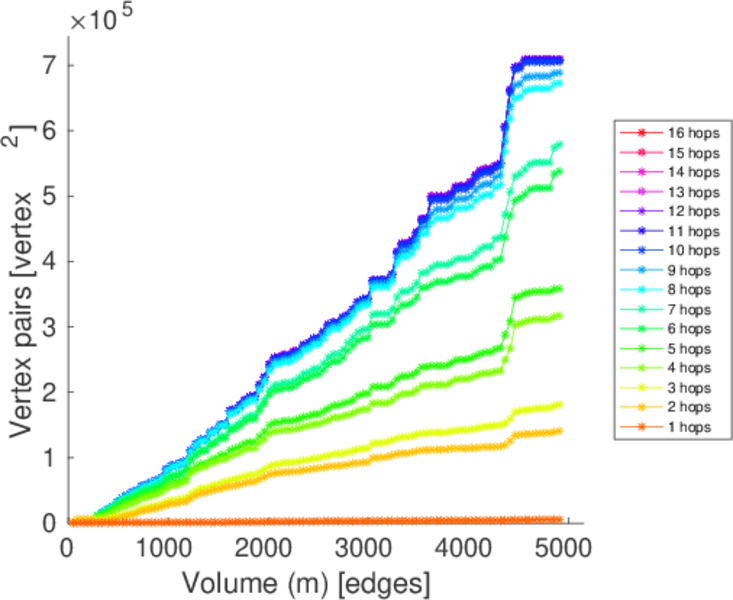
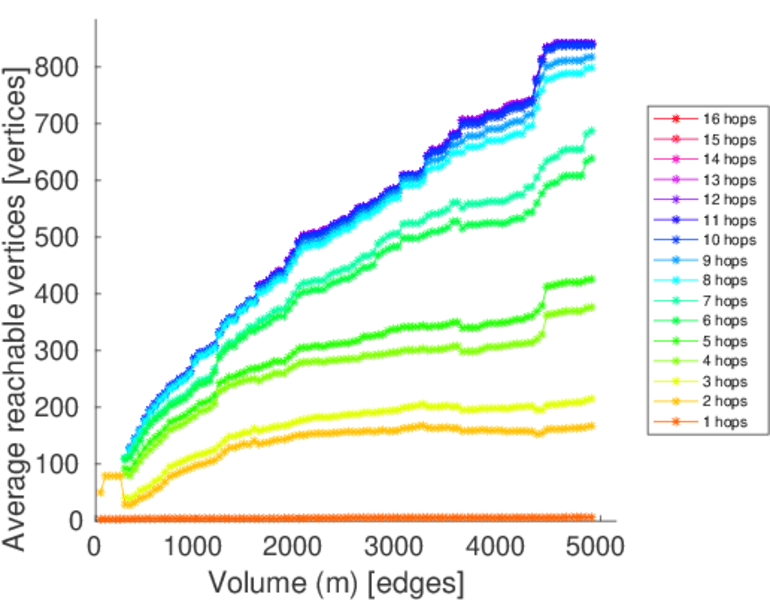
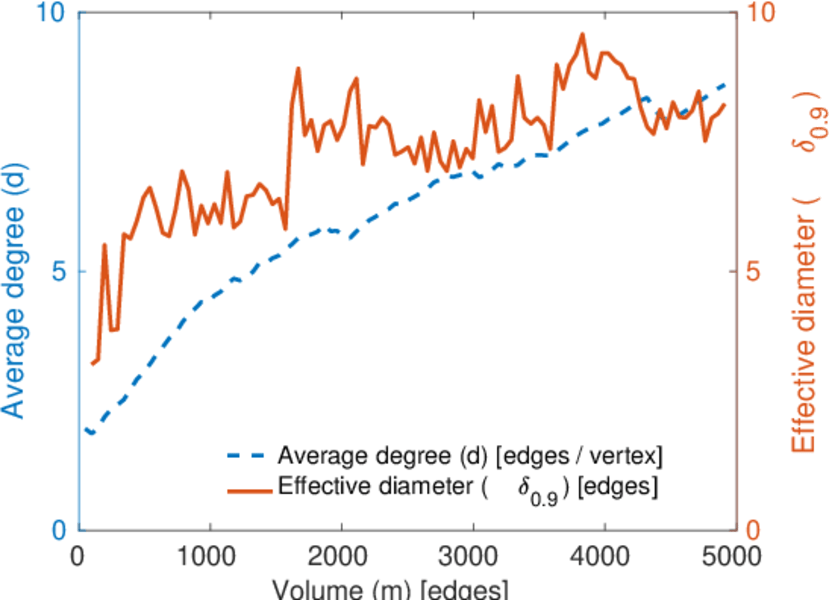
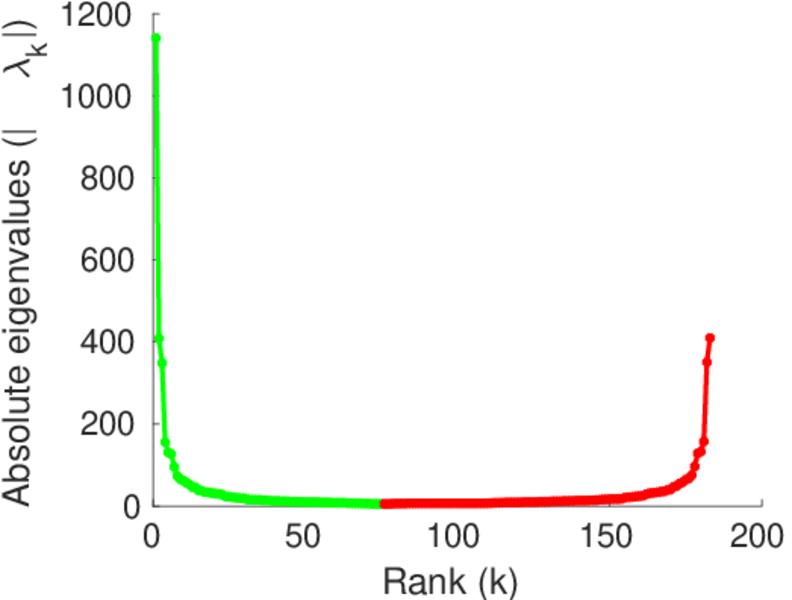
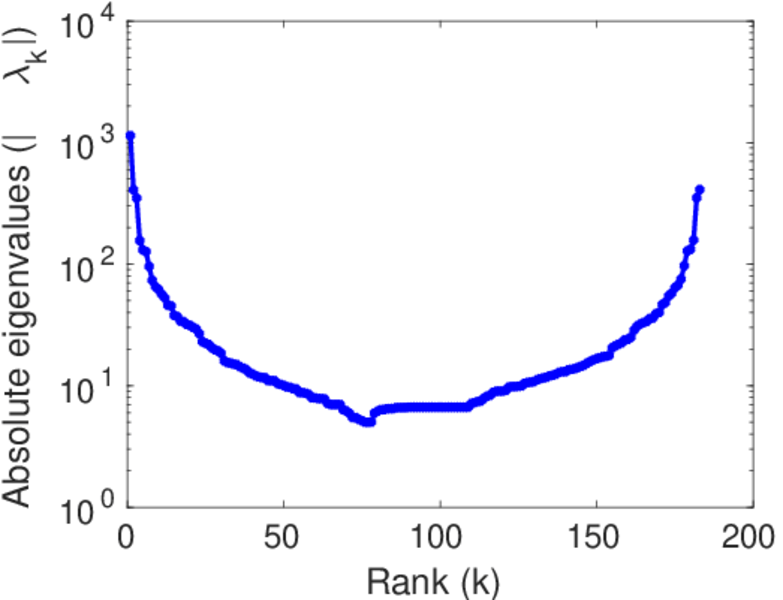
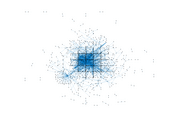
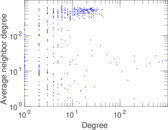
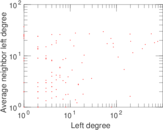
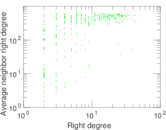
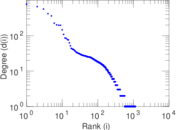
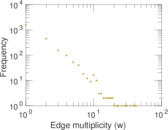
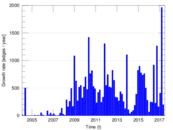
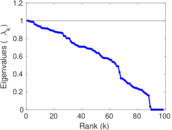
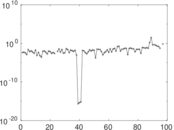
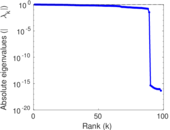
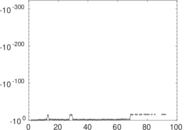
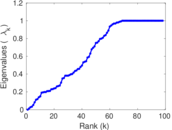
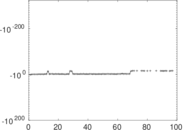
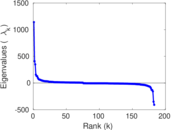
Plots


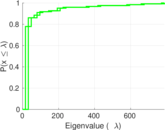


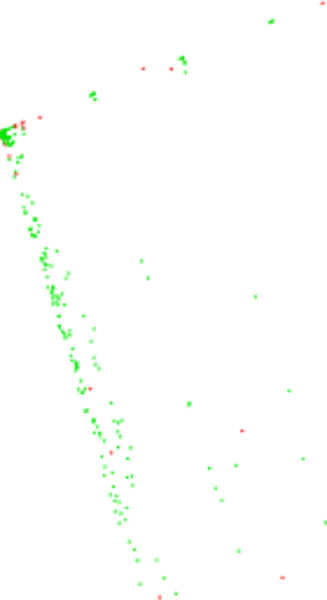
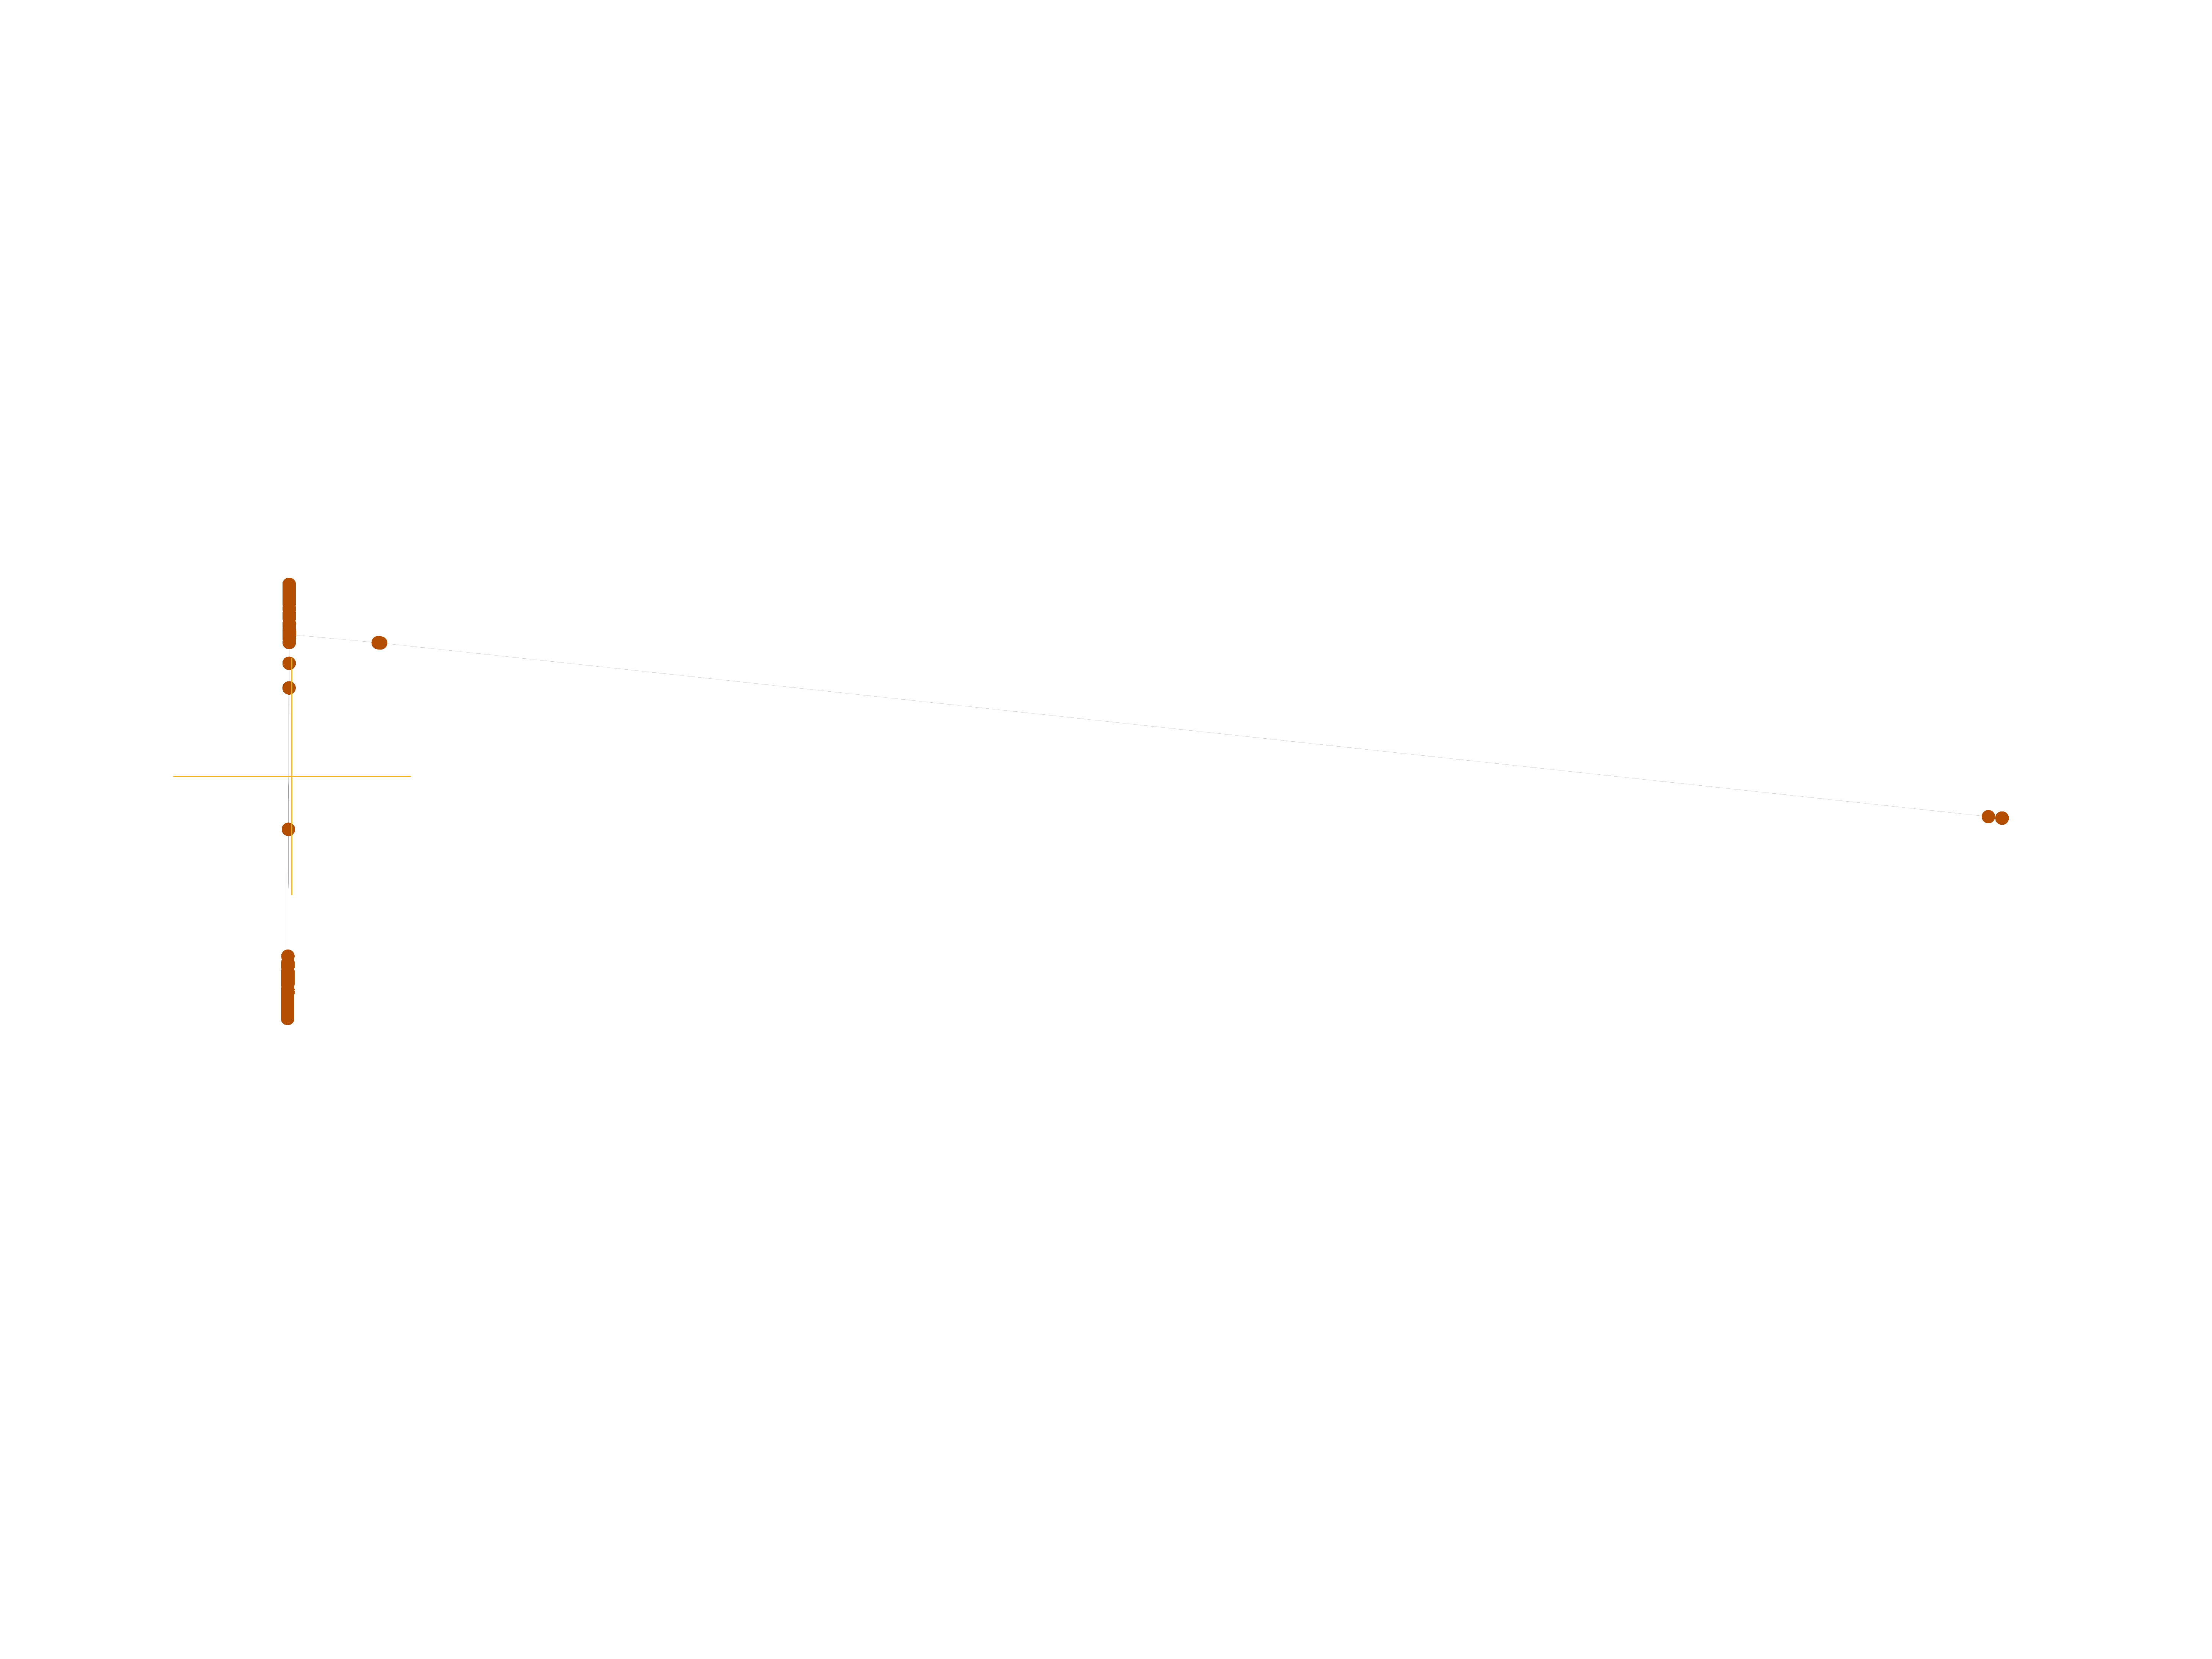
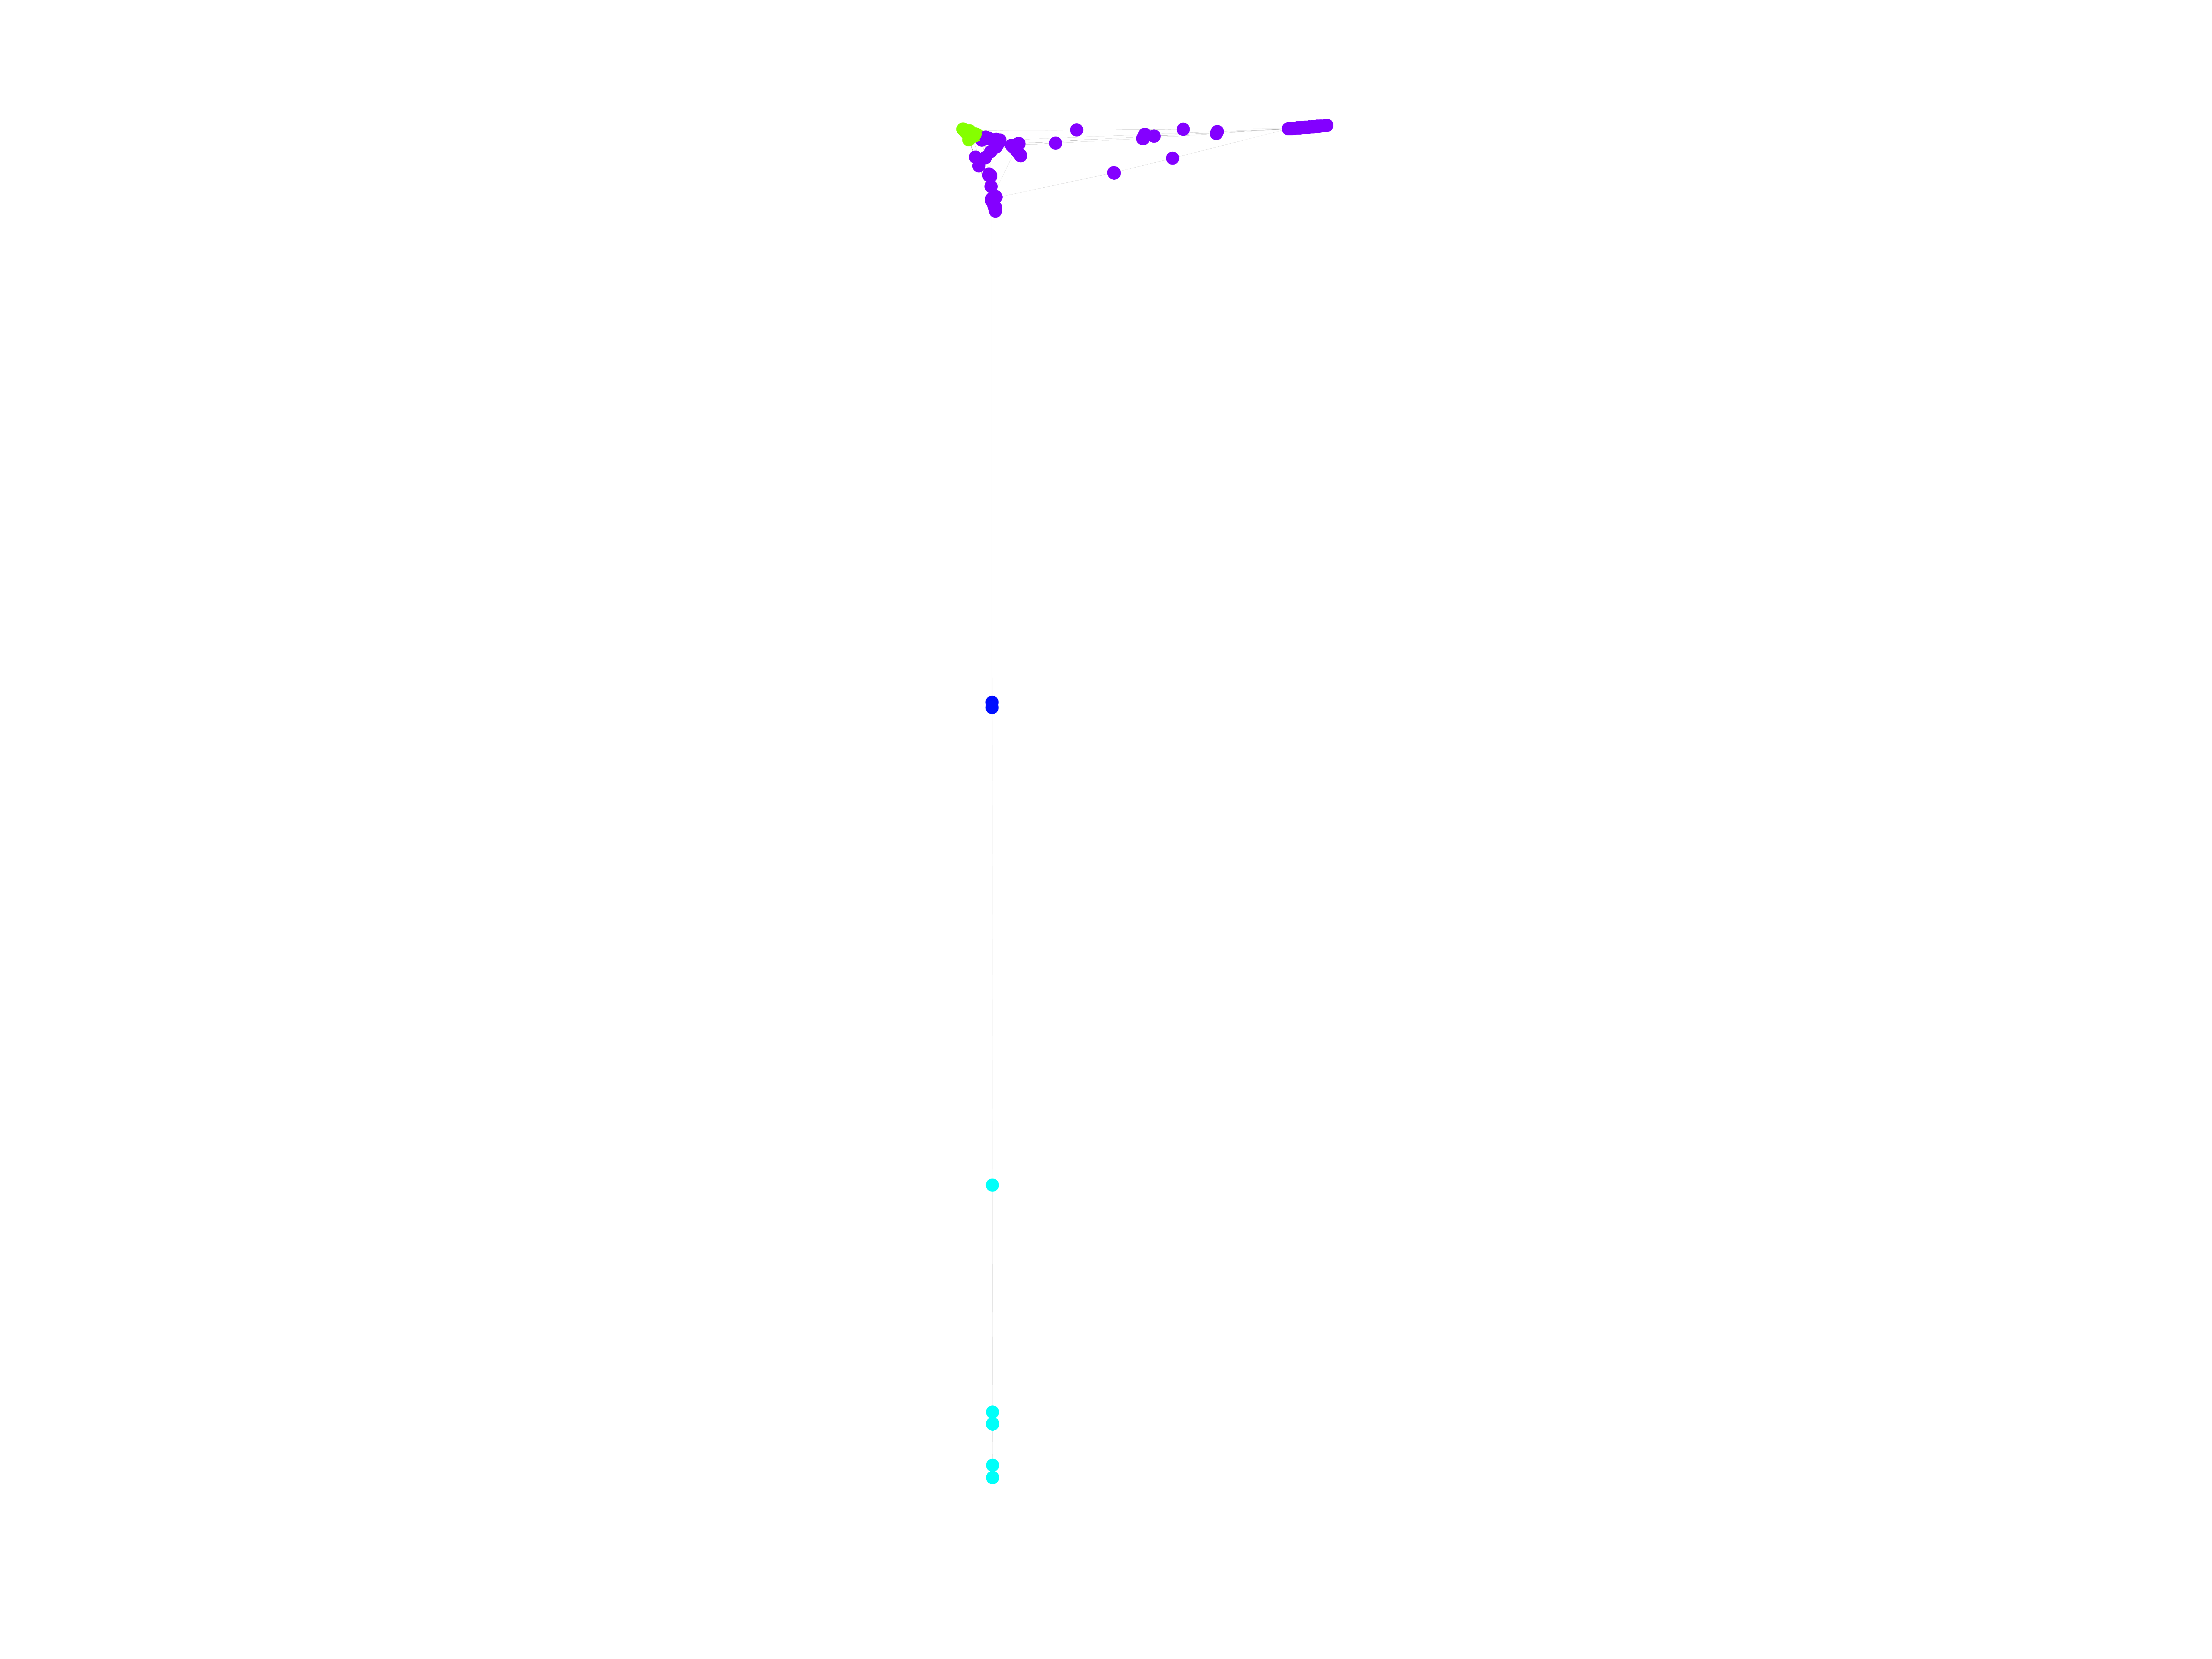
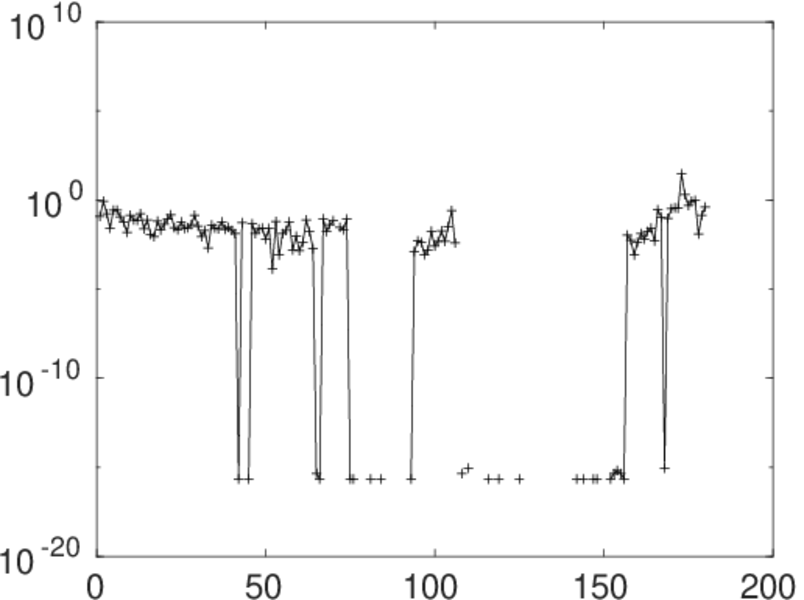
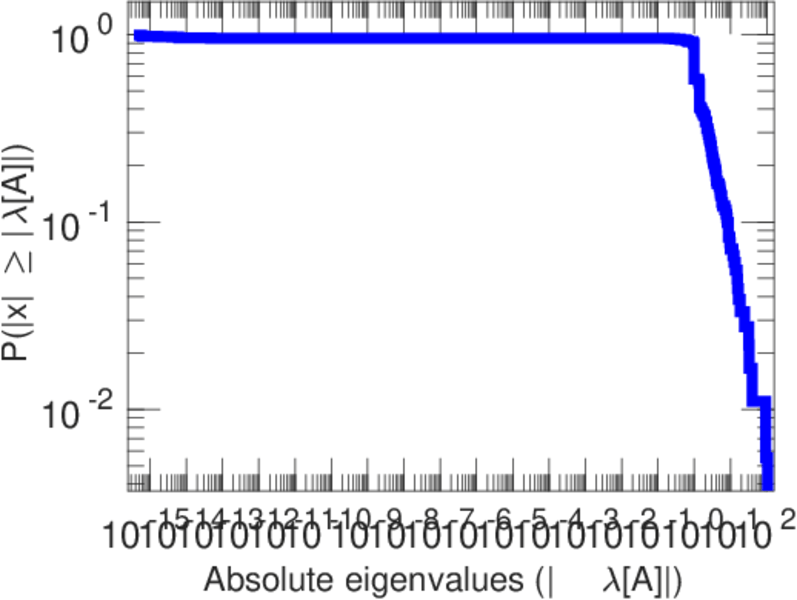
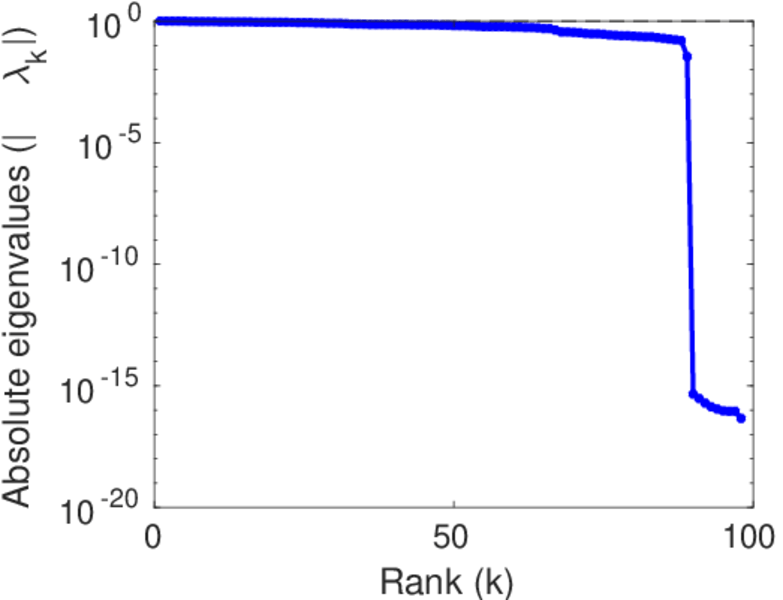
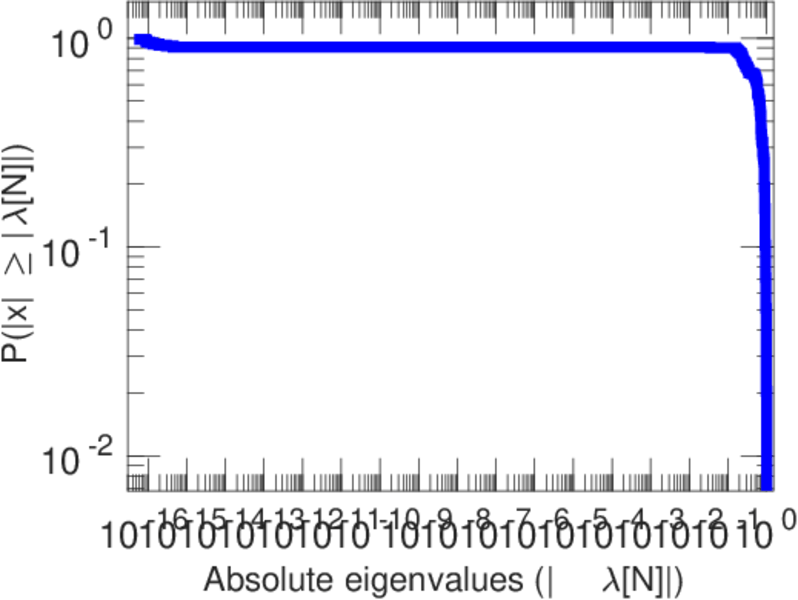
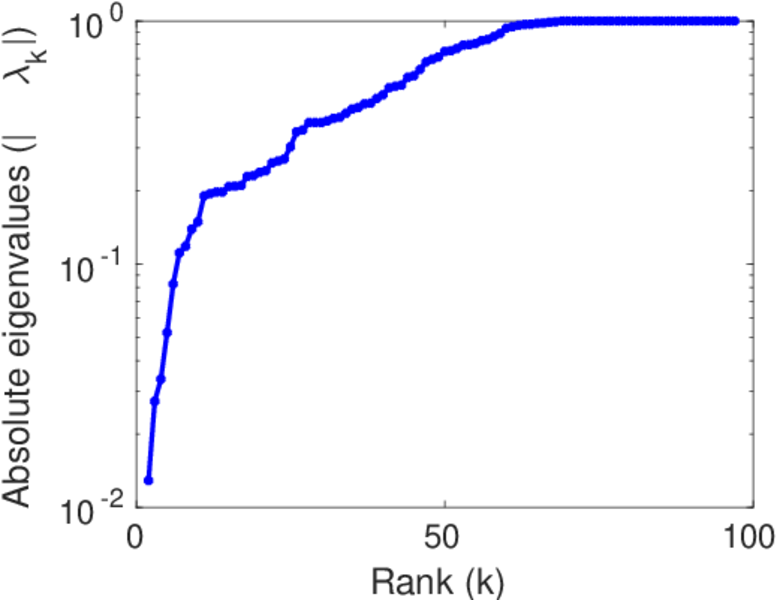
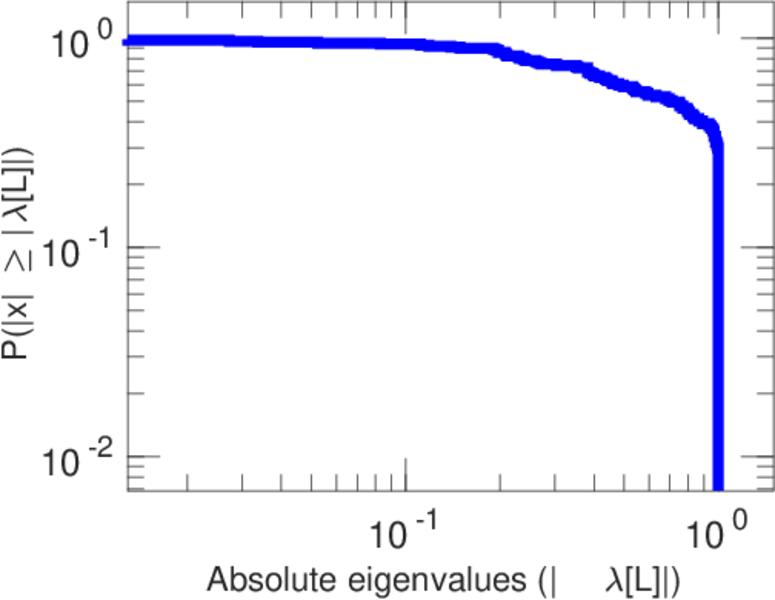
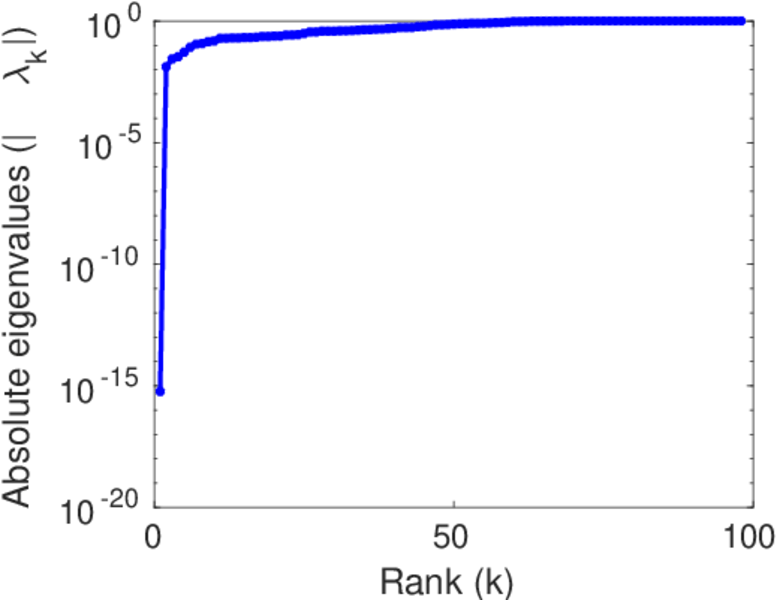
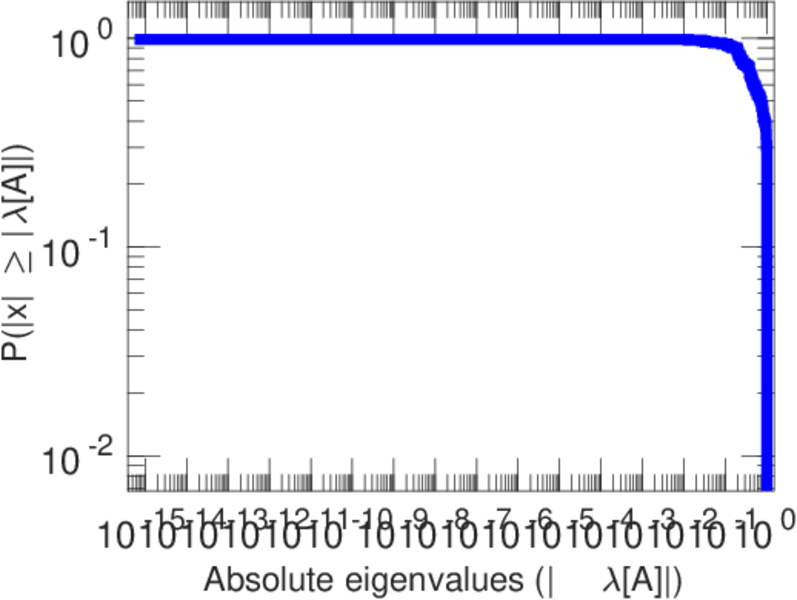
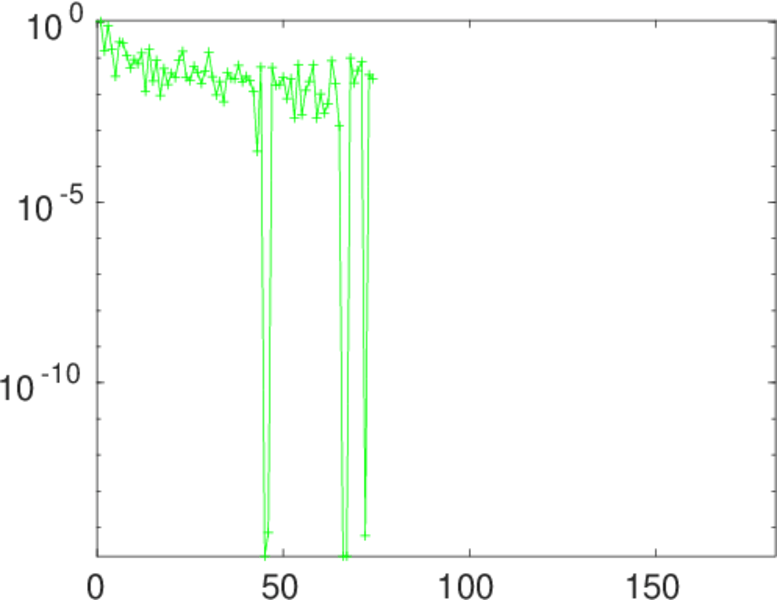
Matrix decompositions plots


Downloads
References
|
[1]
|
Jérôme Kunegis.
KONECT – The Koblenz Network Collection.
In Proc. Int. Conf. on World Wide Web Companion, pages
1343–1350, 2013.
[ http ]
|
|
[2]
|
Wikimedia Foundation.
Wikimedia downloads.
http://dumps.wikimedia.org/, January 2010.
|
 KONECT ‣ Networks ‣
Buy Me a Coffee
KONECT ‣ Networks ‣
Buy Me a Coffee