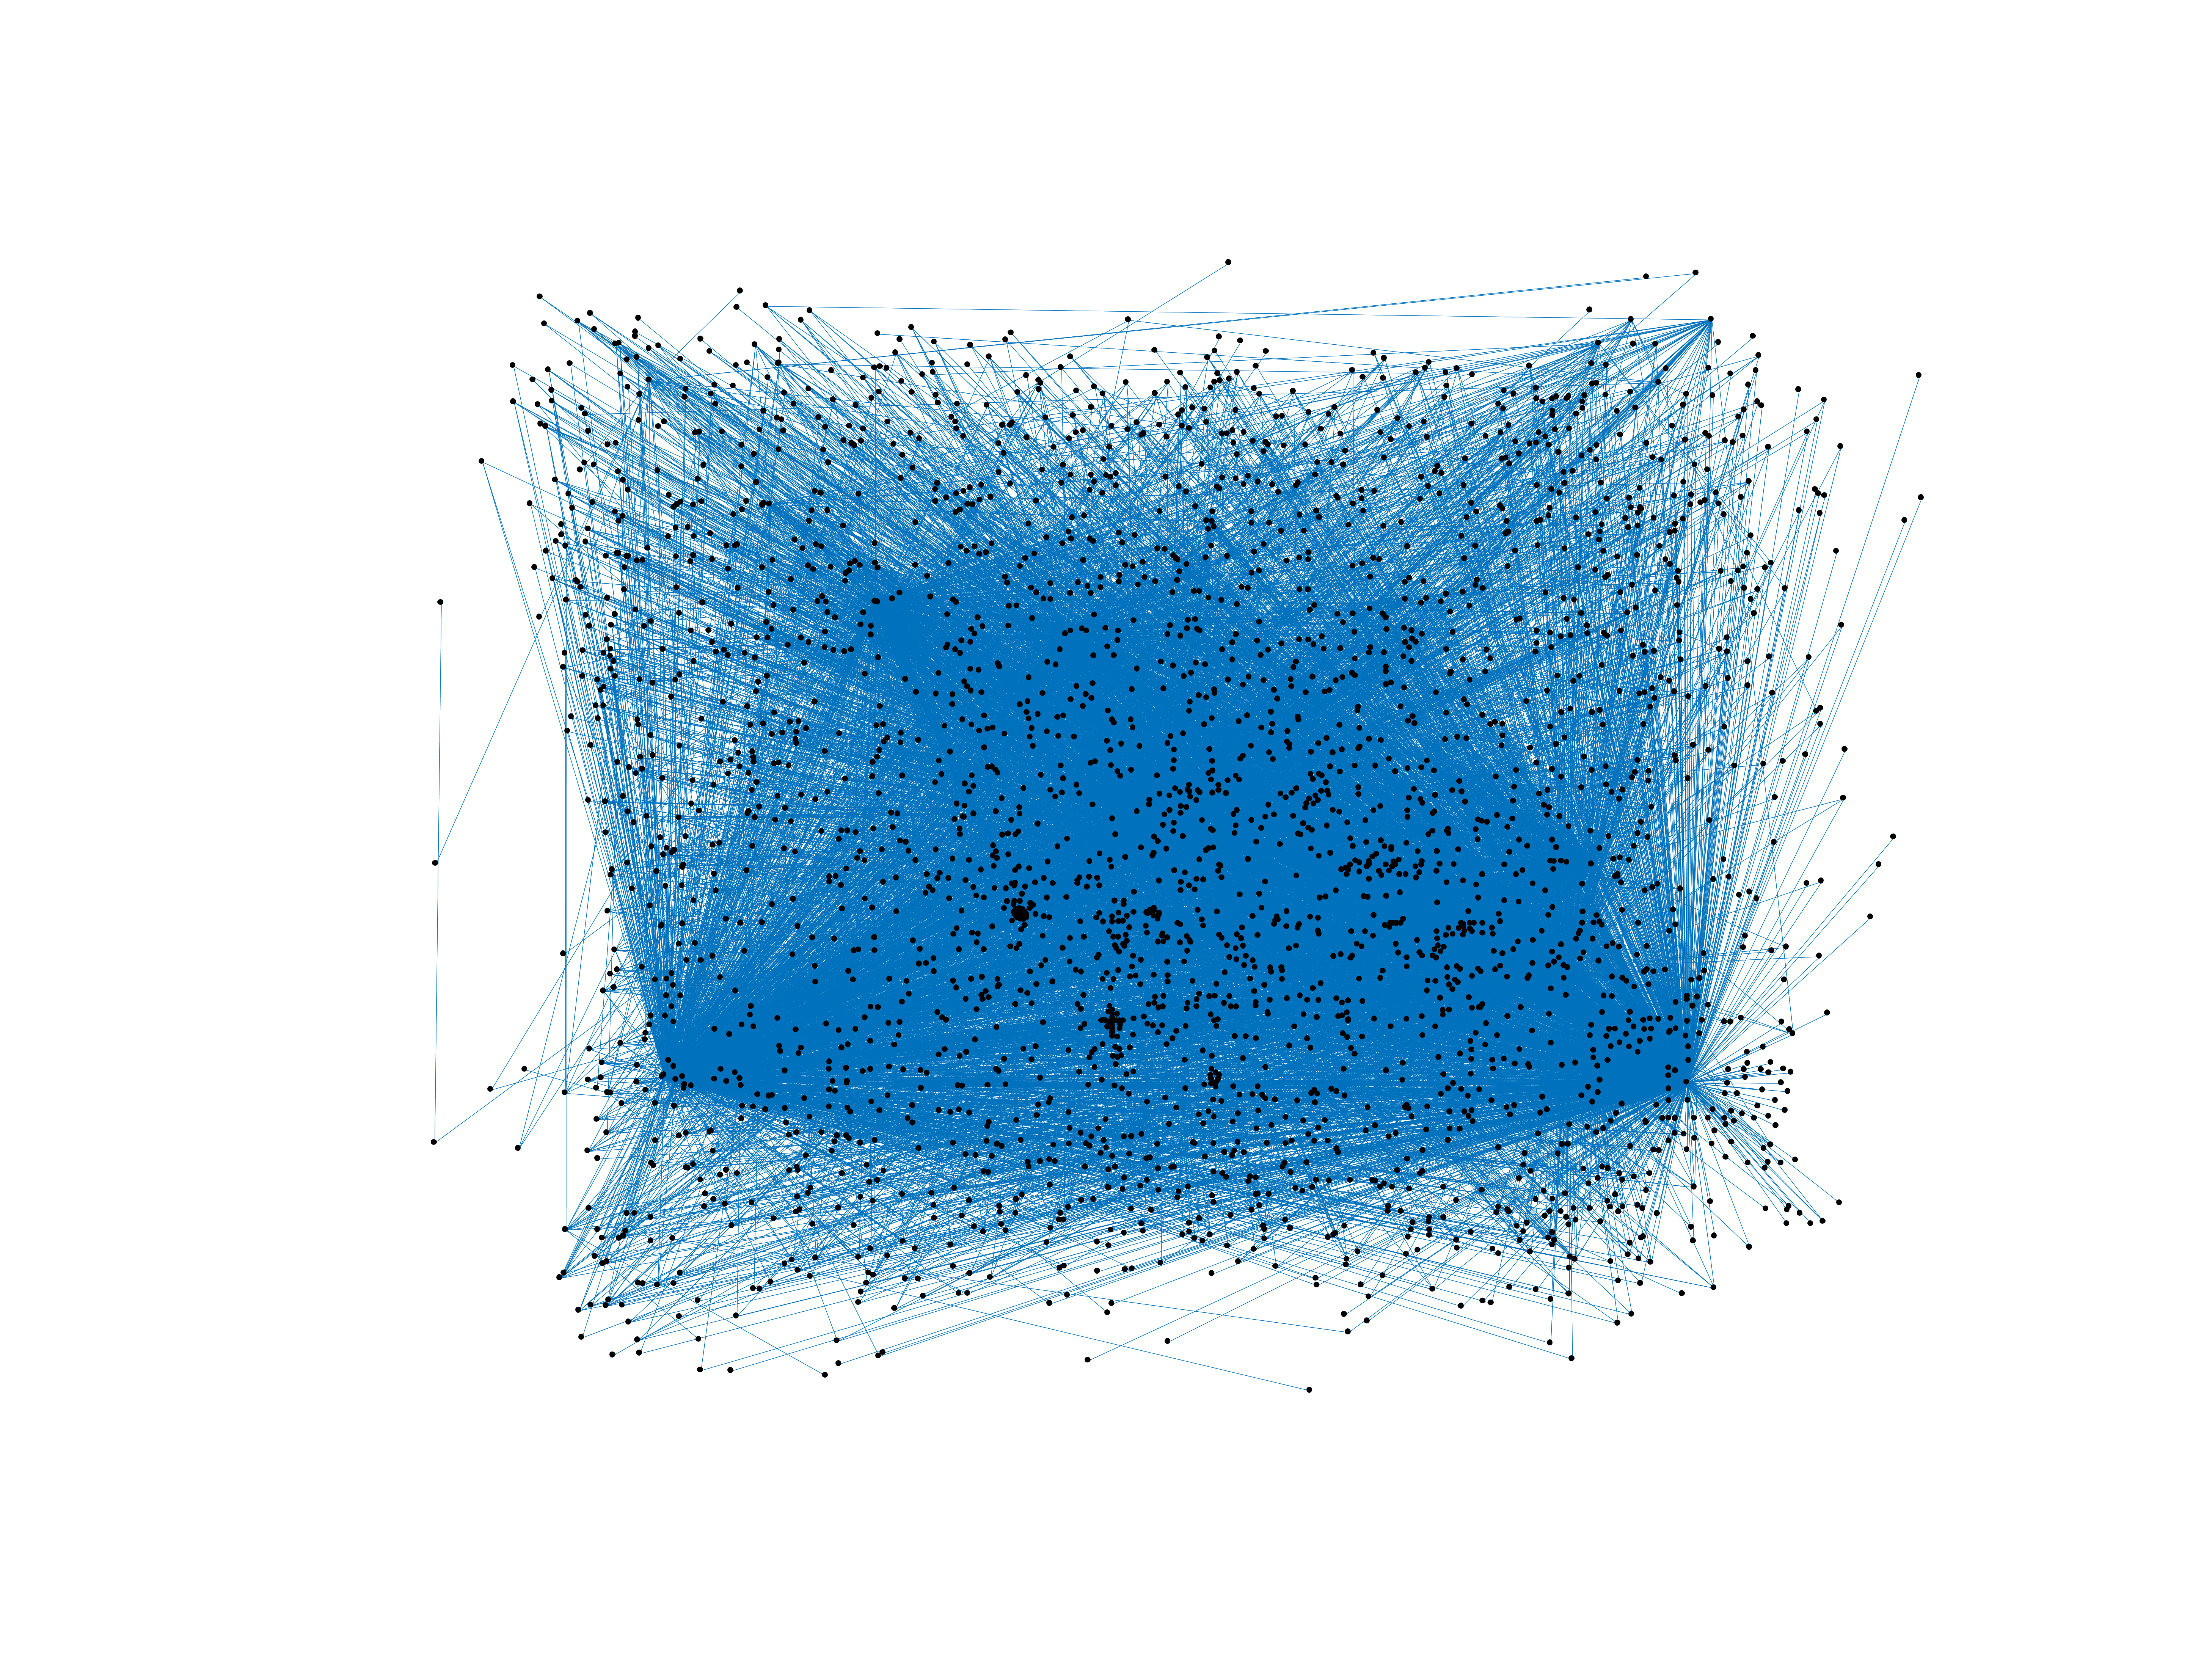
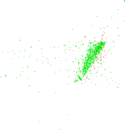
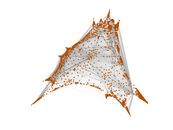
Wikipedia edits (jam)
This is the bipartite edit network of the Jamaican Creole English Wikipedia. It
contains users and pages from the Jamaican Creole English Wikipedia, connected
by edit events. Each edge represents an edit. The dataset includes the
timestamp of each edit.
Metadata
Statistics
| Size | n = | 2,922
|
| Left size | n1 = | 177
|
| Right size | n2 = | 2,745
|
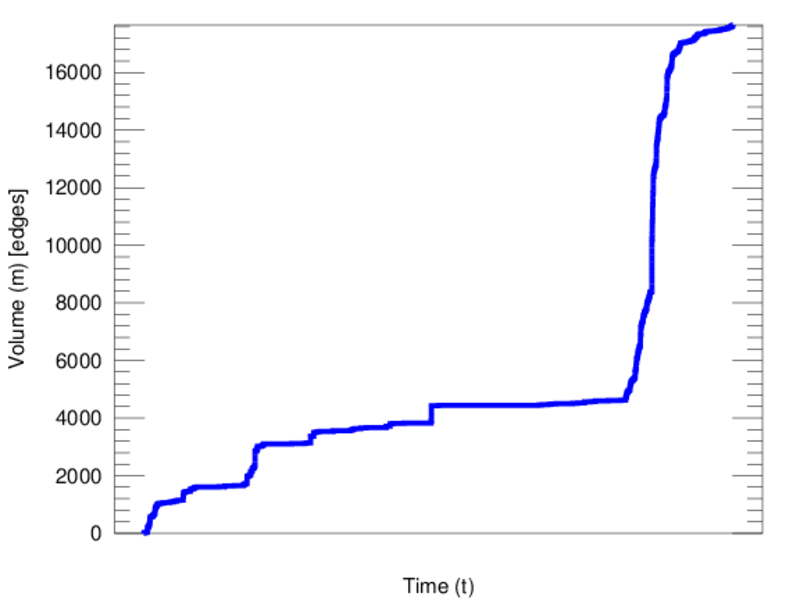
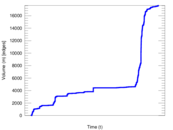
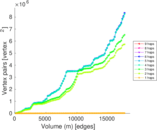
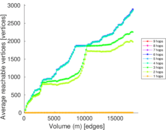
| Volume | m = | 17,647
|
| Unique edge count | m̿ = | 10,389
|
| Wedge count | s = | 5,576,208
|
| Claw count | z = | 2,736,425,967
|
| Cross count | x = | 1,140,722,258,253
|
| Square count | q = | 5,232,285
|
| 4-Tour count | T4 = | 64,203,286
|
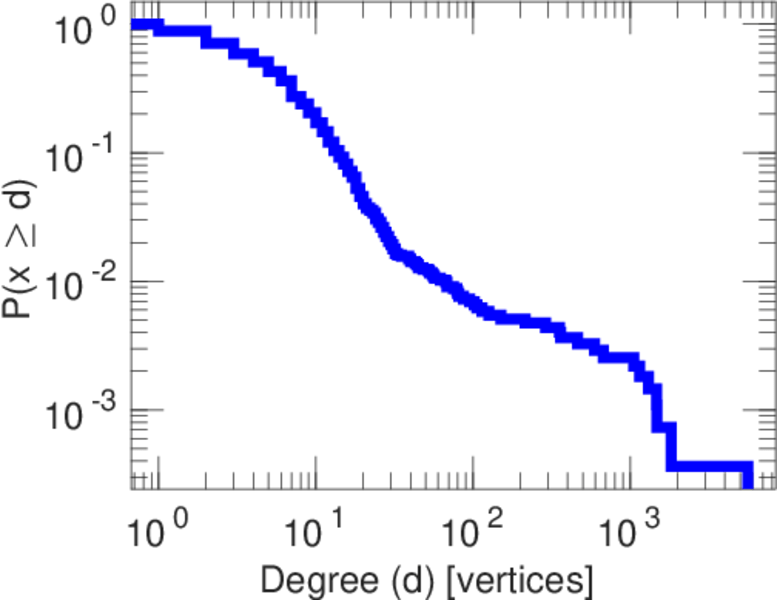
| Maximum degree | dmax = | 5,590
|
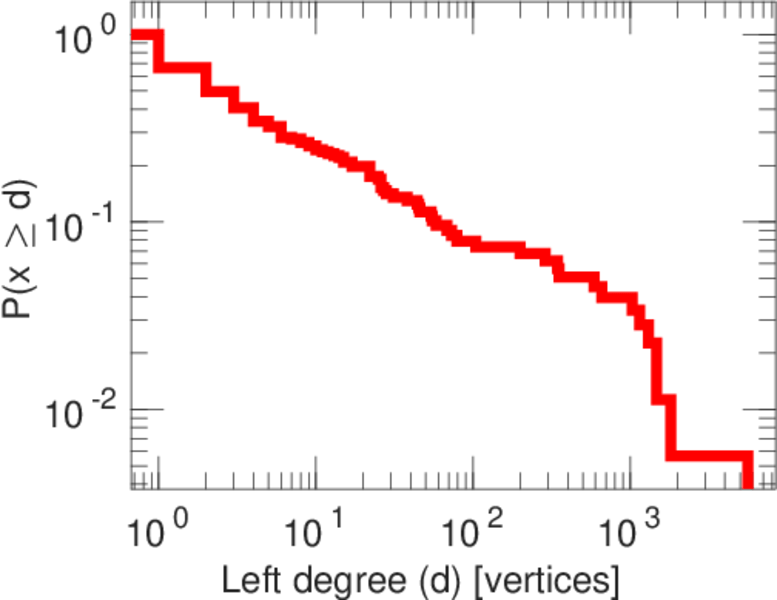
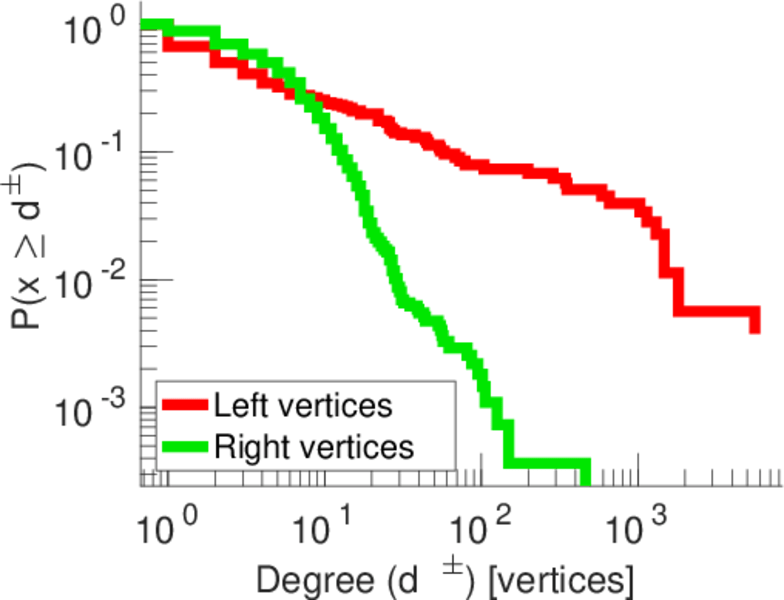
| Maximum left degree | d1max = | 5,590
|
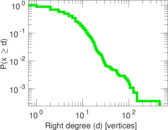
| Maximum right degree | d2max = | 462
|
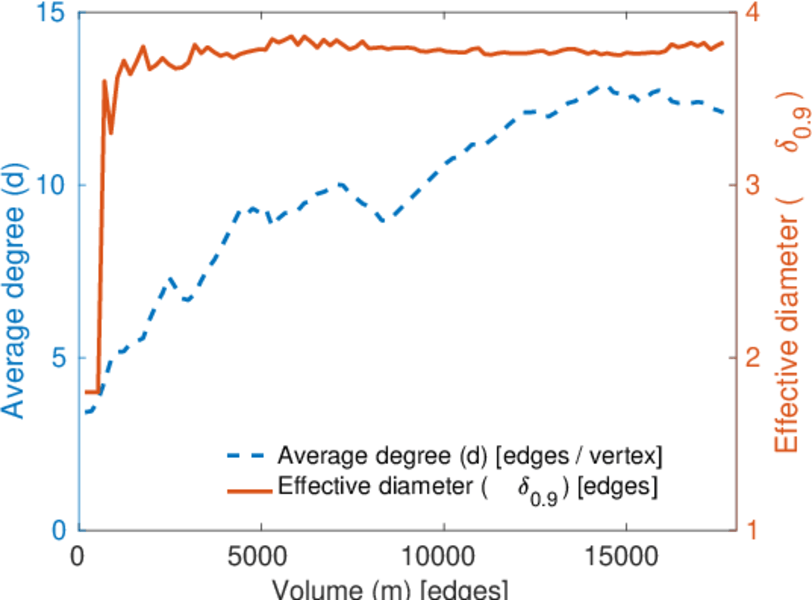
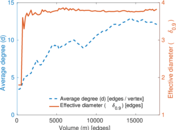
| Average degree | d = | 12.078 7
|
| Average left degree | d1 = | 99.700 6
|
| Average right degree | d2 = | 6.428 78
|
| Fill | p = | 0.021 382 5
|
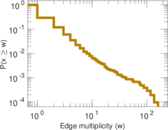
| Average edge multiplicity | m̃ = | 1.698 62
|
| Size of LCC | N = | 2,889
|
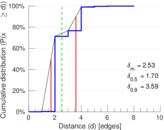
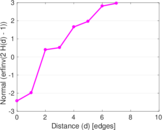
| Diameter | δ = | 9
|
| 50-Percentile effective diameter | δ0.5 = | 1.699 58
|
| 90-Percentile effective diameter | δ0.9 = | 3.594 44
|
| Median distance | δM = | 2
|
| Mean distance | δm = | 2.528 47
|
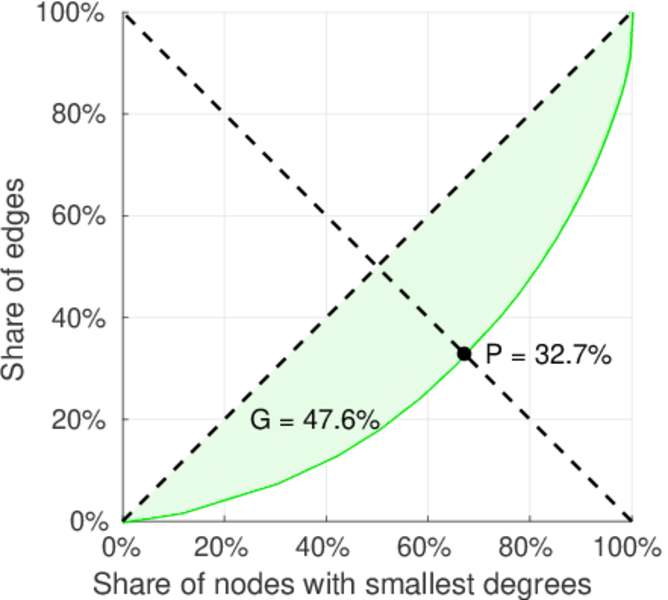
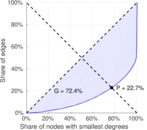
| Gini coefficient | G = | 0.725 903
|
| Balanced inequality ratio | P = | 0.227 801
|
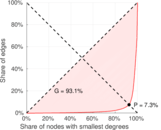
| Left balanced inequality ratio | P1 = | 0.072 816 9
|
| Right balanced inequality ratio | P2 = | 0.327 478
|
| Relative edge distribution entropy | Her = | 0.740 583
|
| Power law exponent | γ = | 1.912 11
|
| Tail power law exponent | γt = | 3.141 00
|
| Tail power law exponent with p | γ3 = | 3.141 00
|
| p-value | p = | 0.000 00
|
| Left tail power law exponent with p | γ3,1 = | 1.561 00
|
| Left p-value | p1 = | 0.057 000 0
|
| Right tail power law exponent with p | γ3,2 = | 8.411 00
|
| Right p-value | p2 = | 0.406 000
|
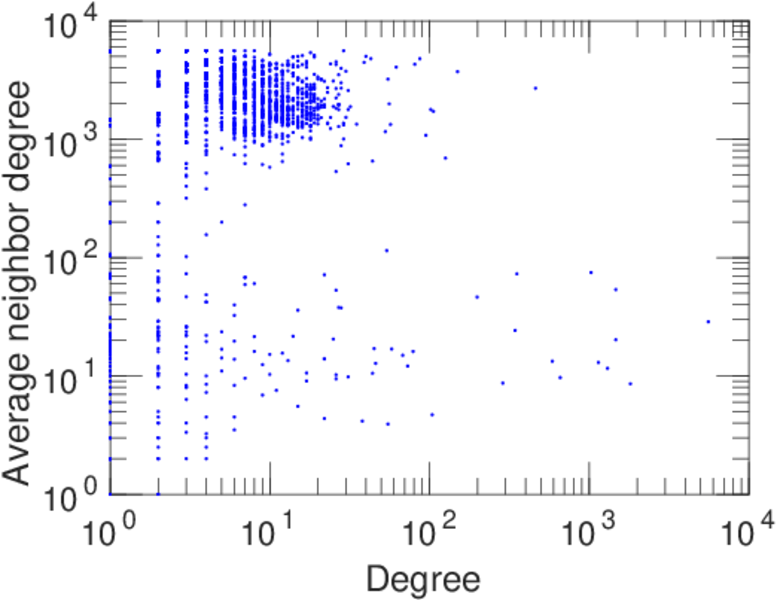
| Degree assortativity | ρ = | −0.275 906
|
| Degree assortativity p-value | pρ = | 7.356 84 × 10−181
|
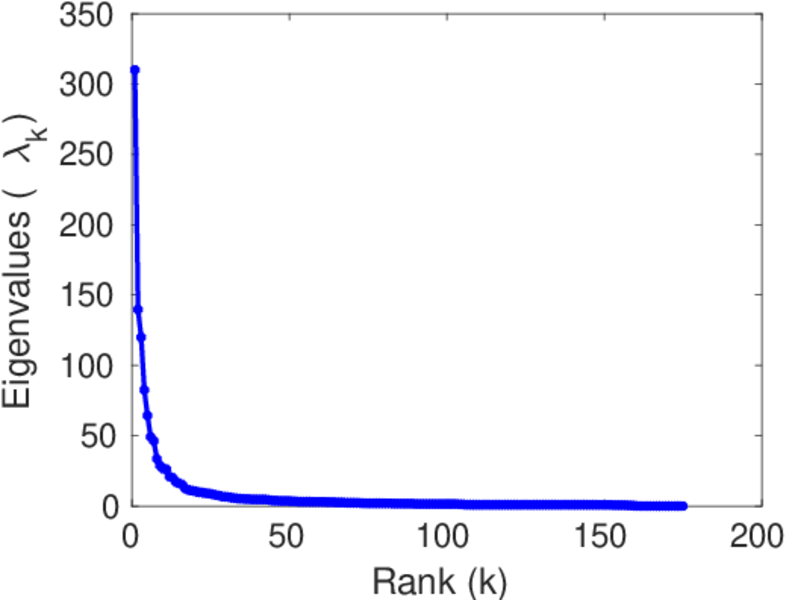
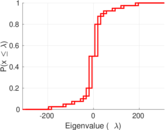
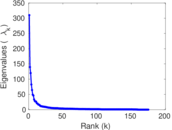
| Spectral norm | α = | 309.997
|
| Algebraic connectivity | a = | 0.188 405
|
| Spectral separation | |λ1[A] / λ2[A]| = | 2.219 47
|
| Controllability | C = | 2,596
|
| Relative controllability | Cr = | 0.889 650
|
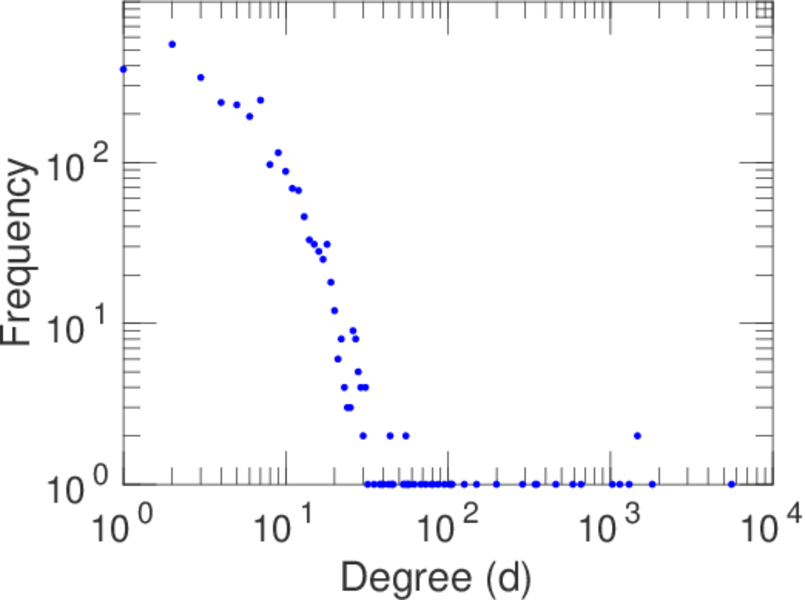
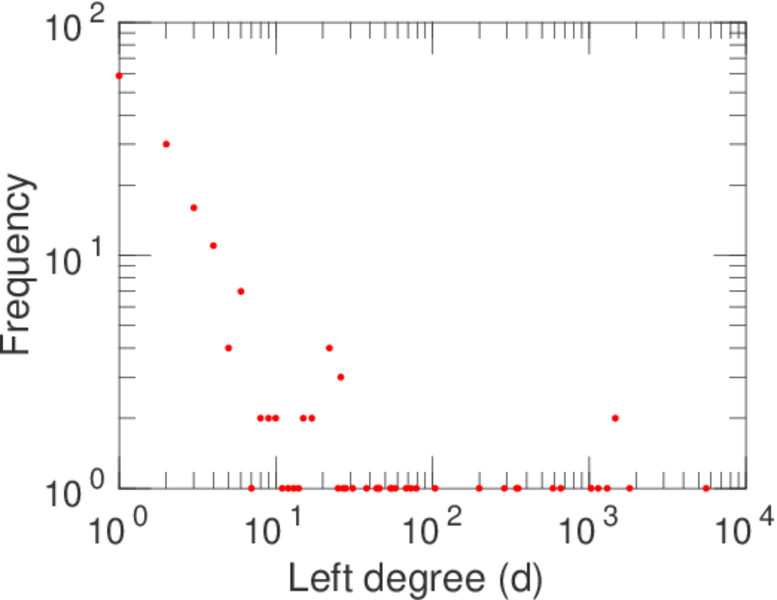
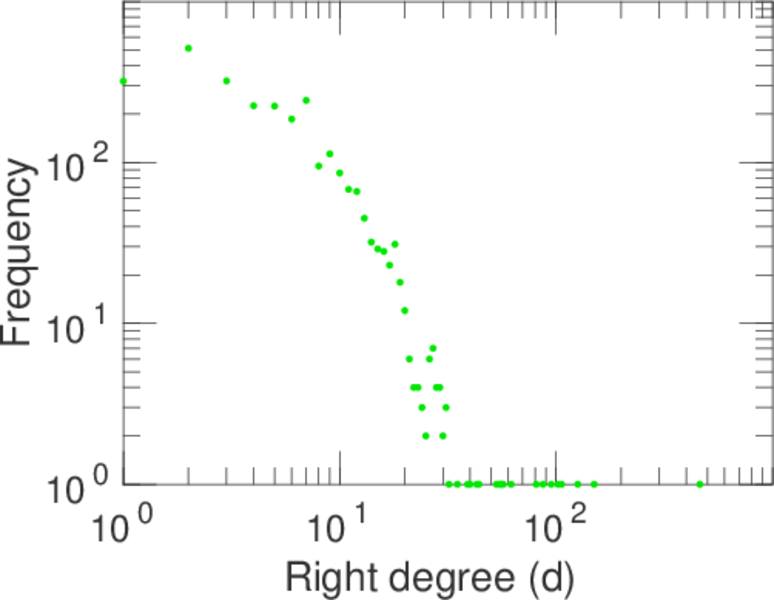
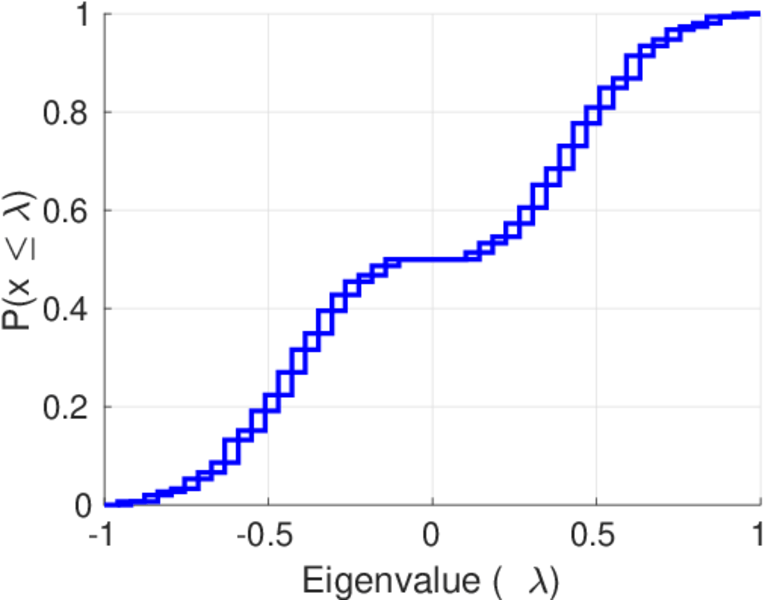
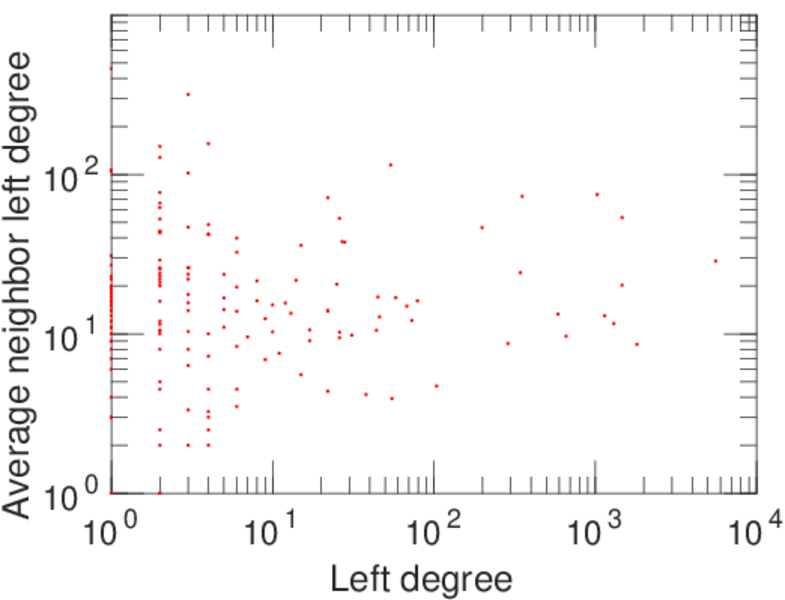
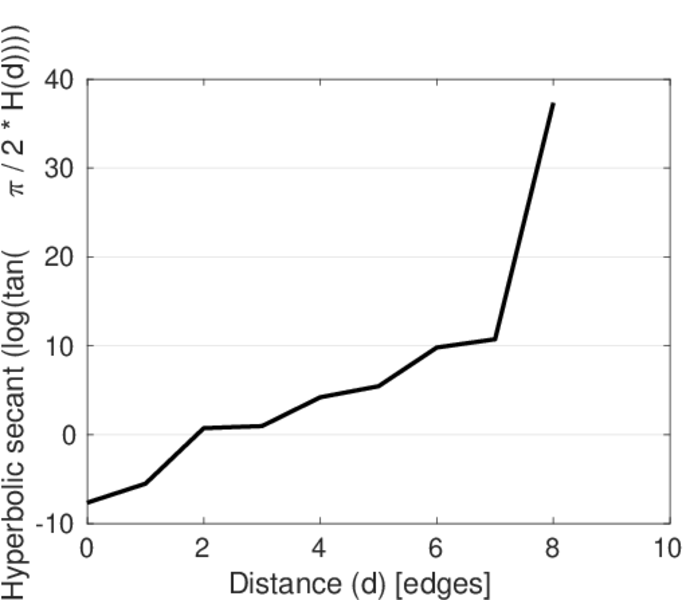
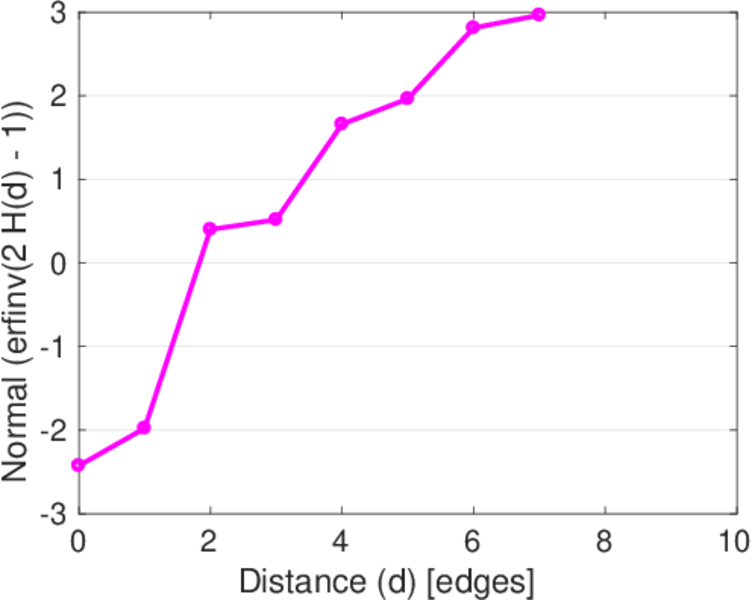
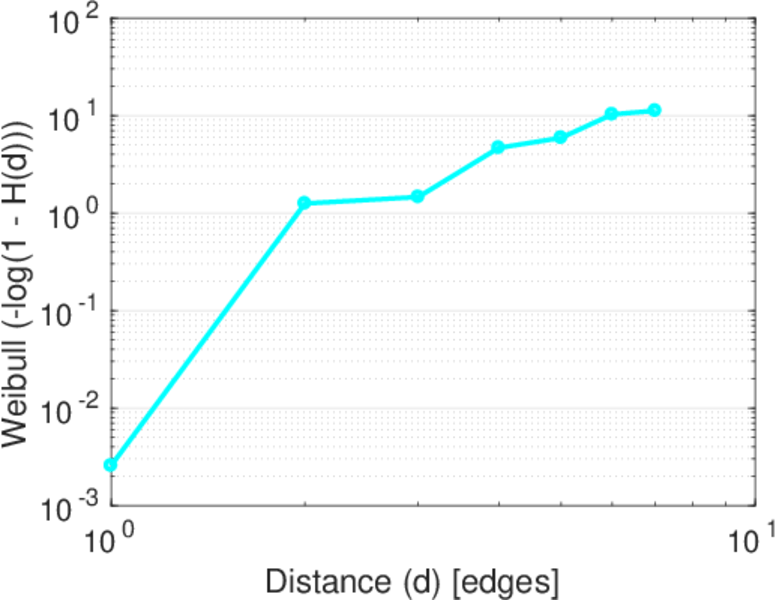
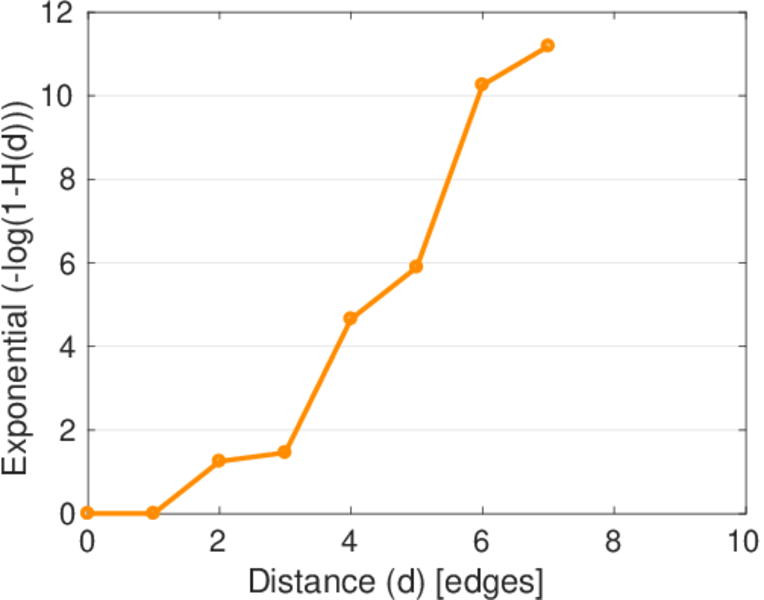
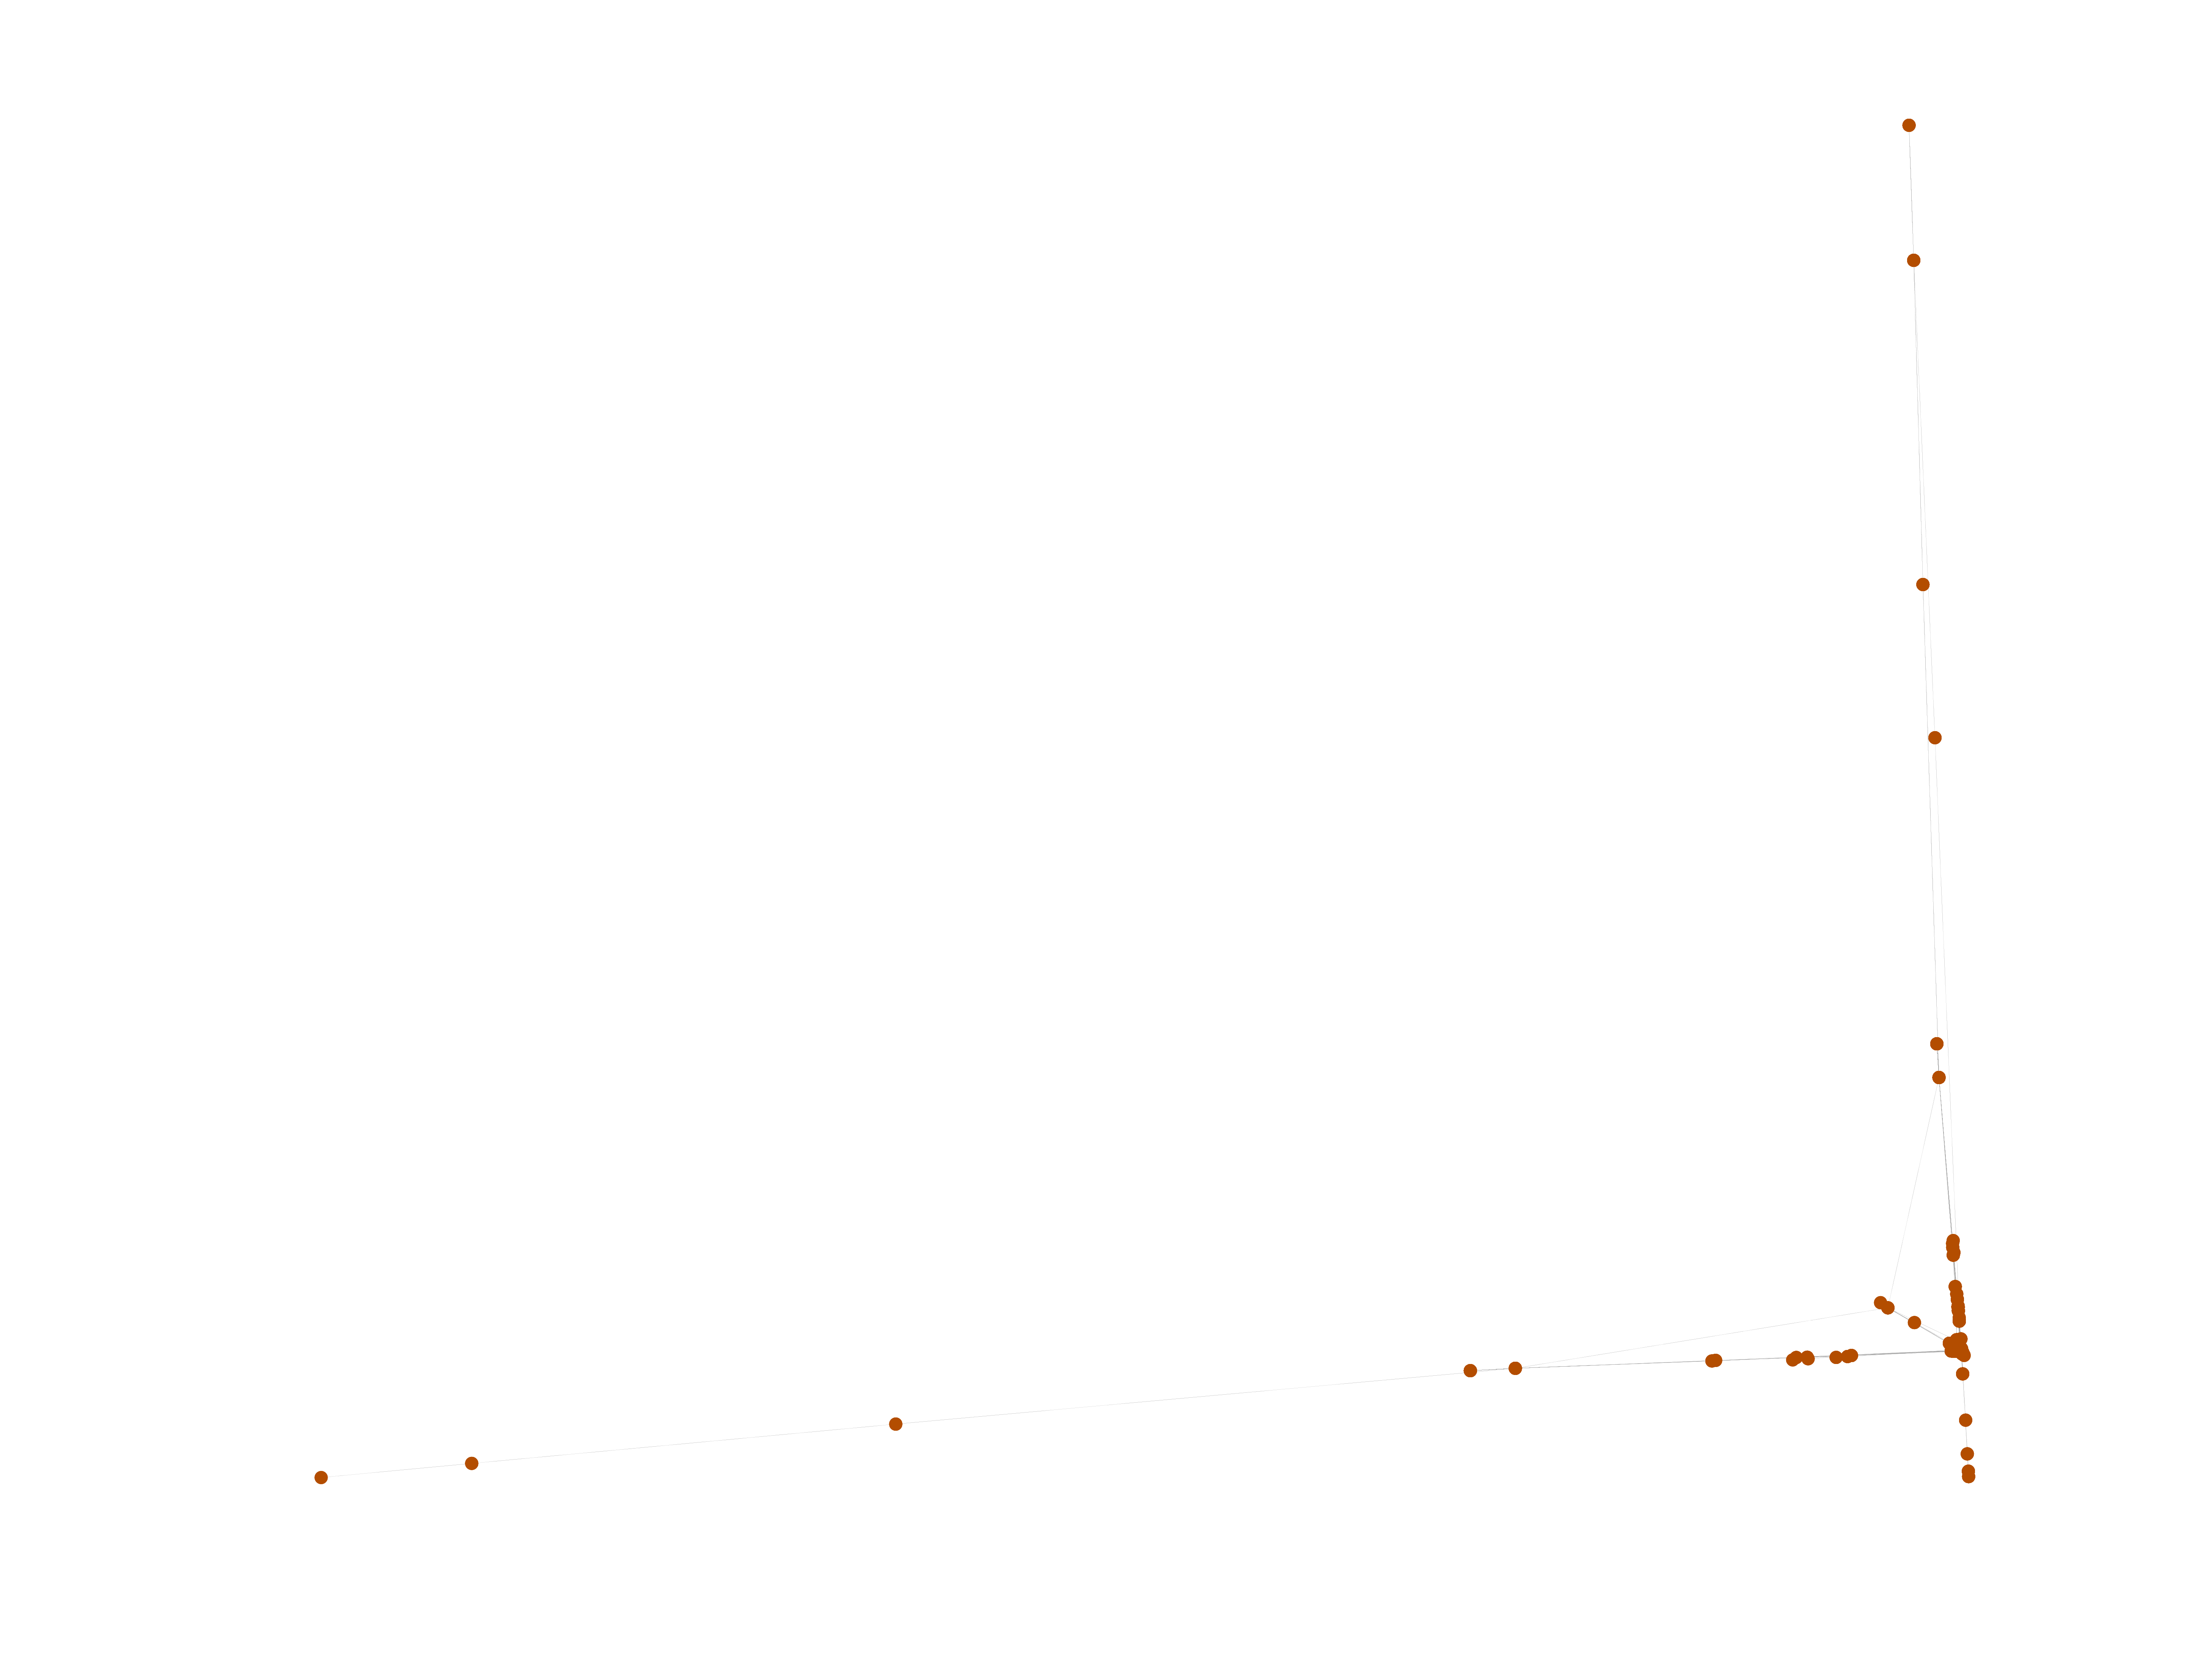
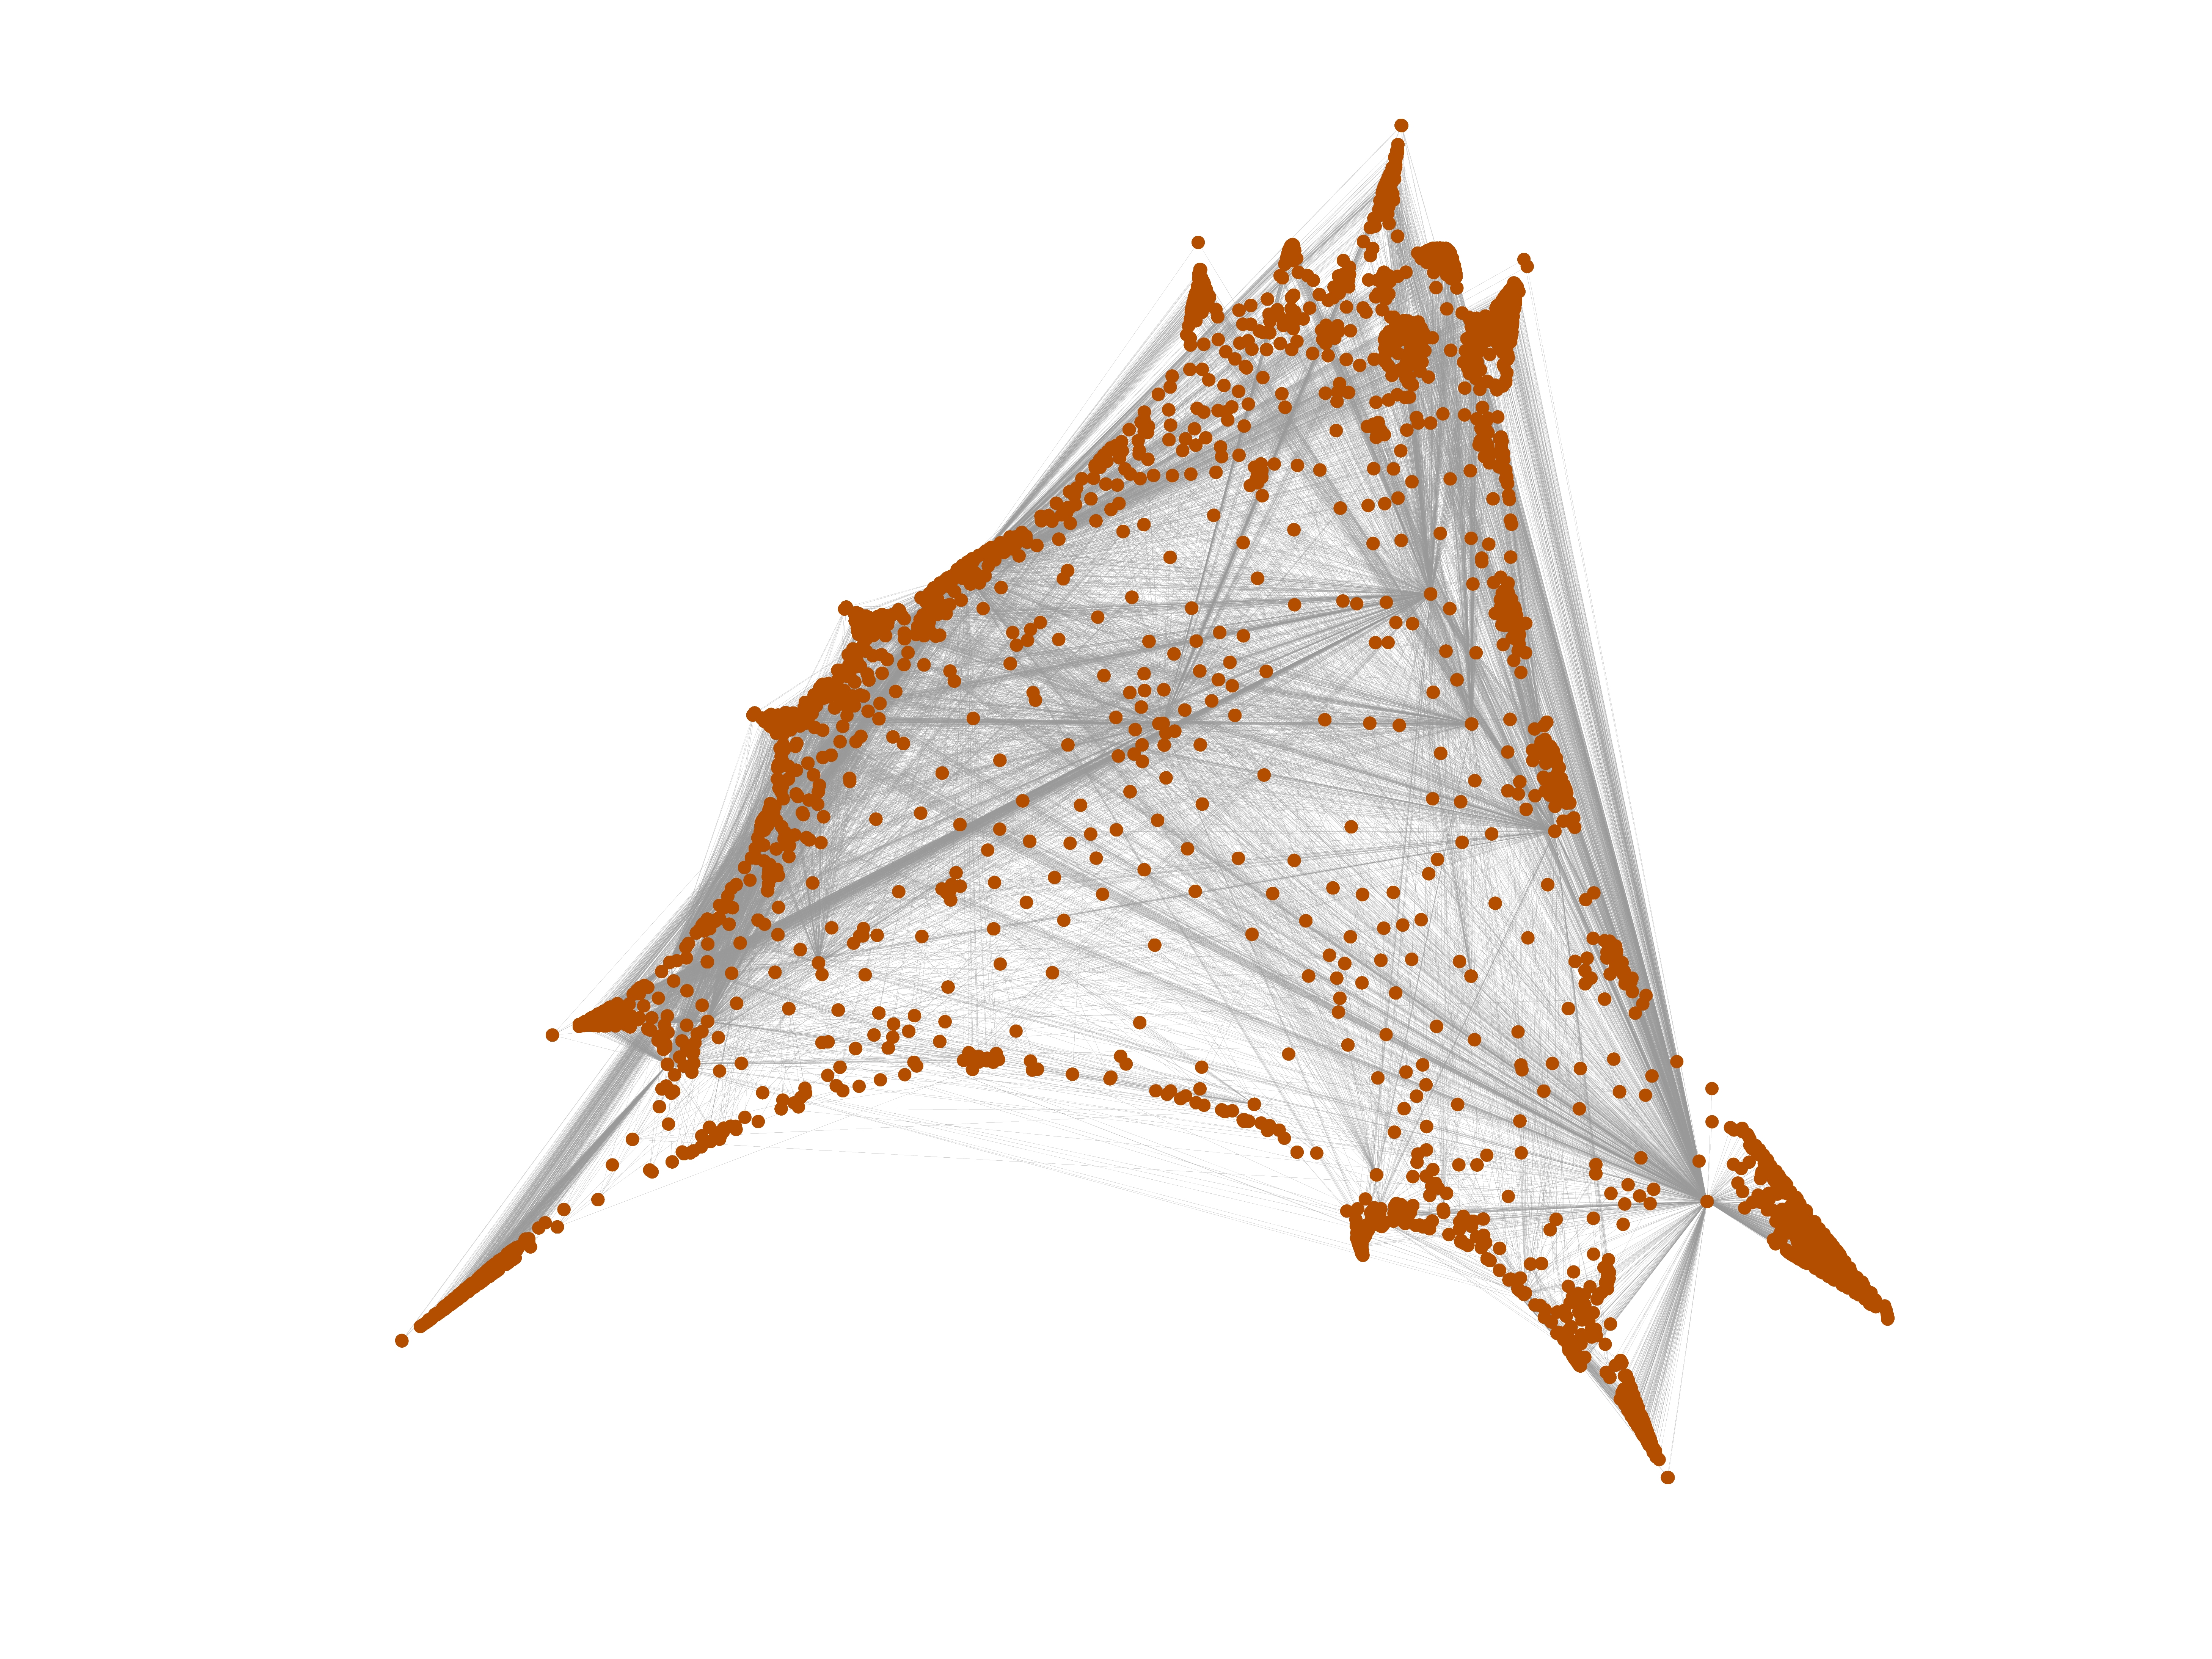
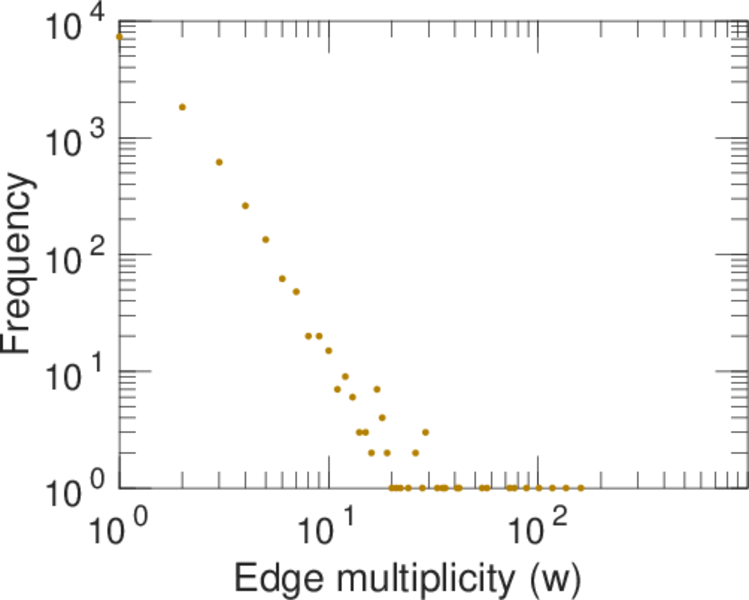
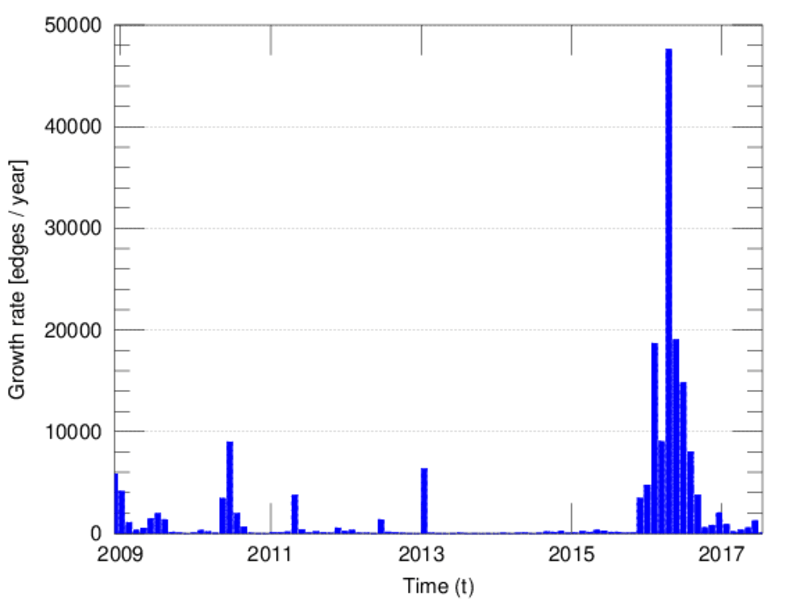
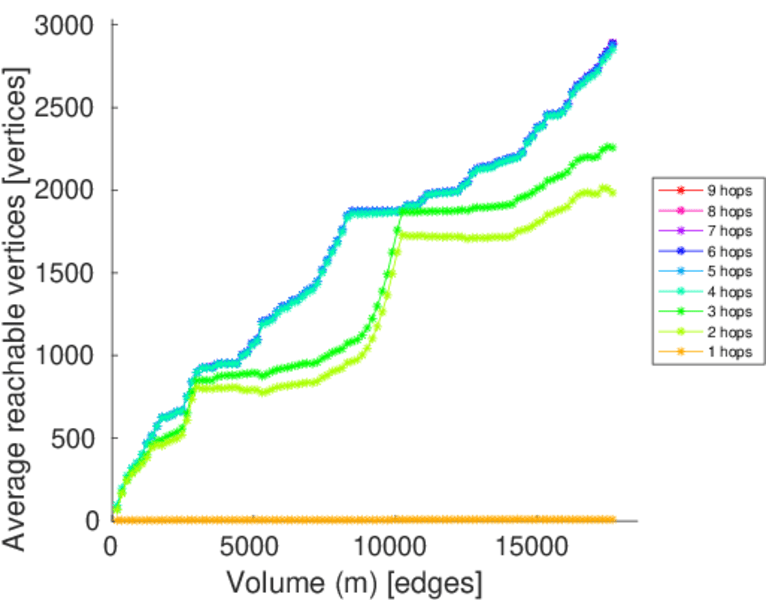
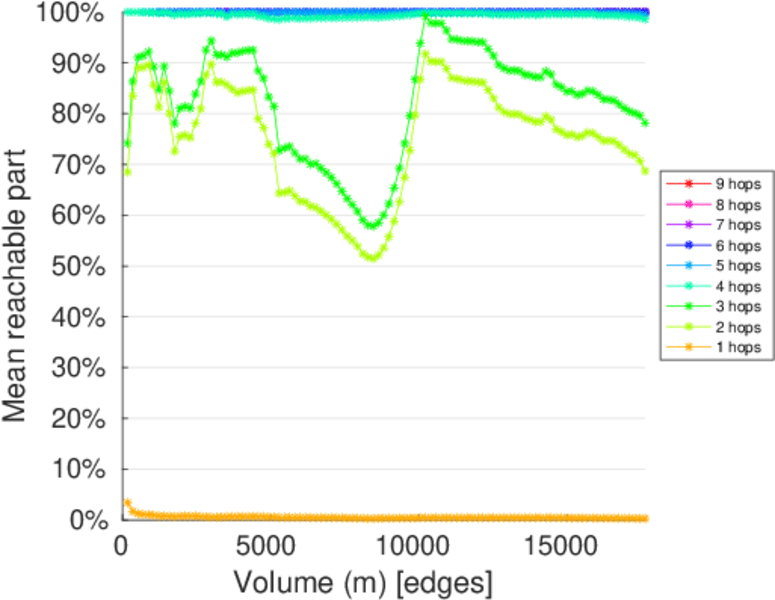
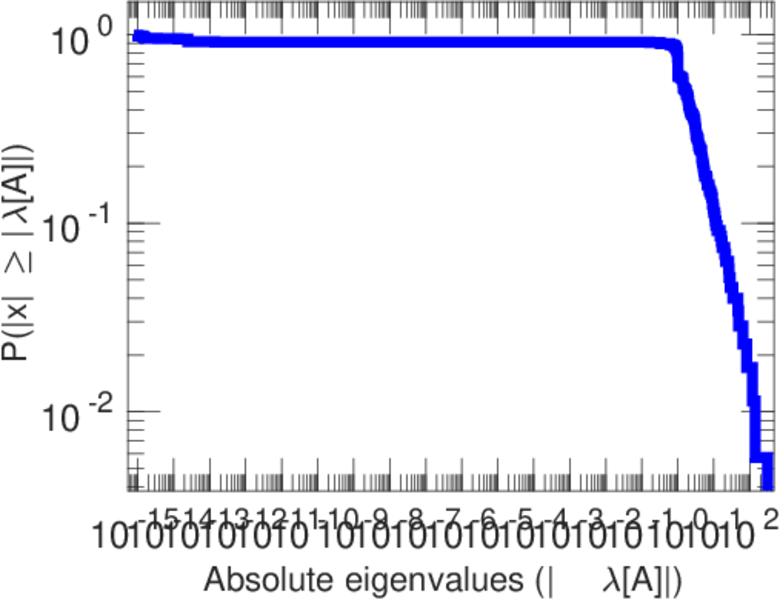
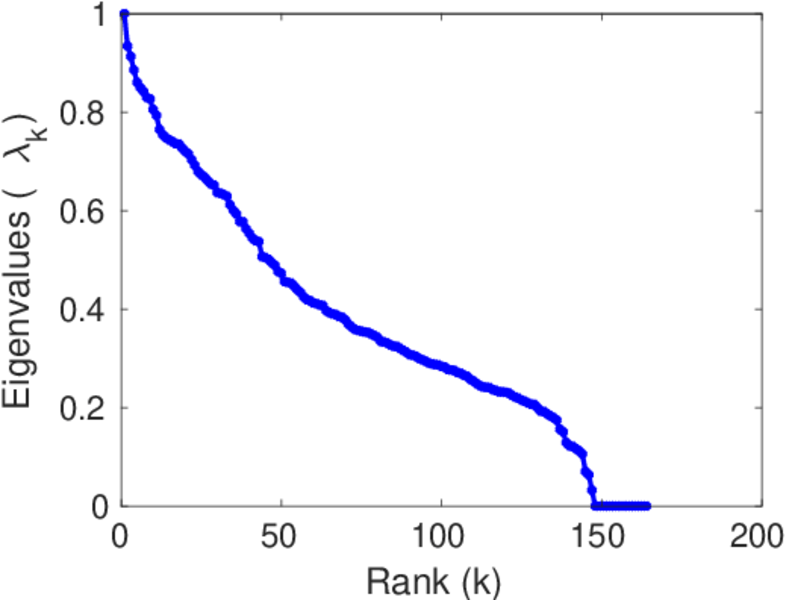
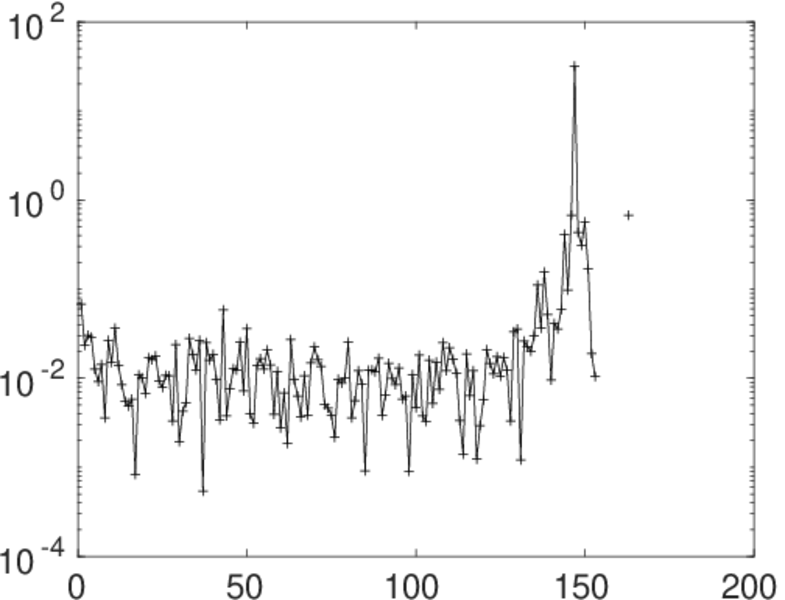
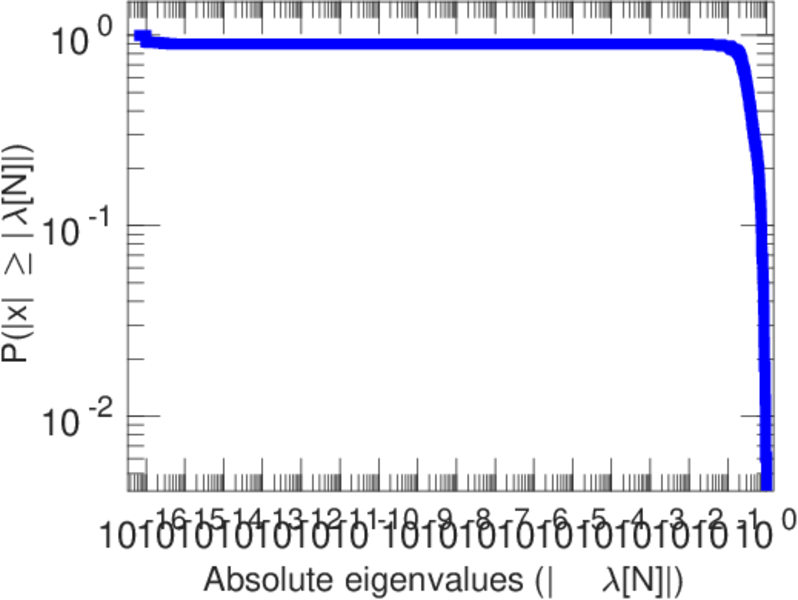
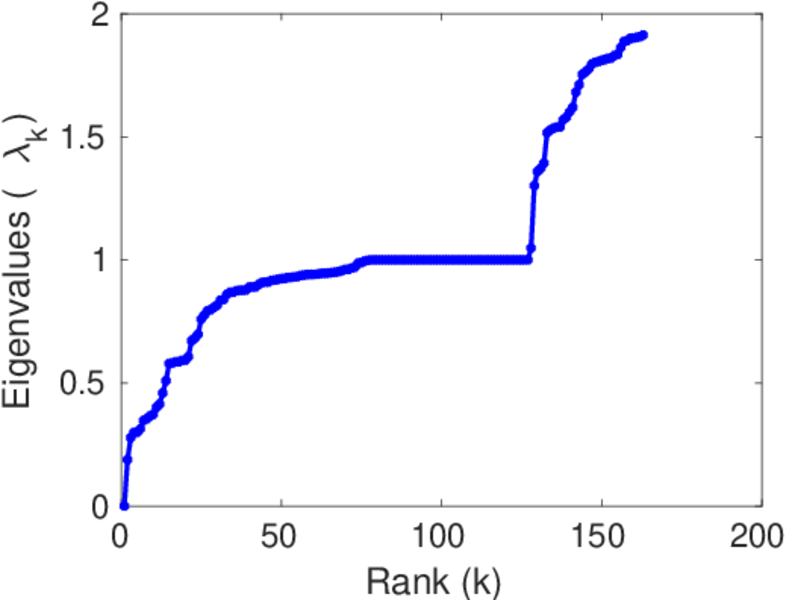
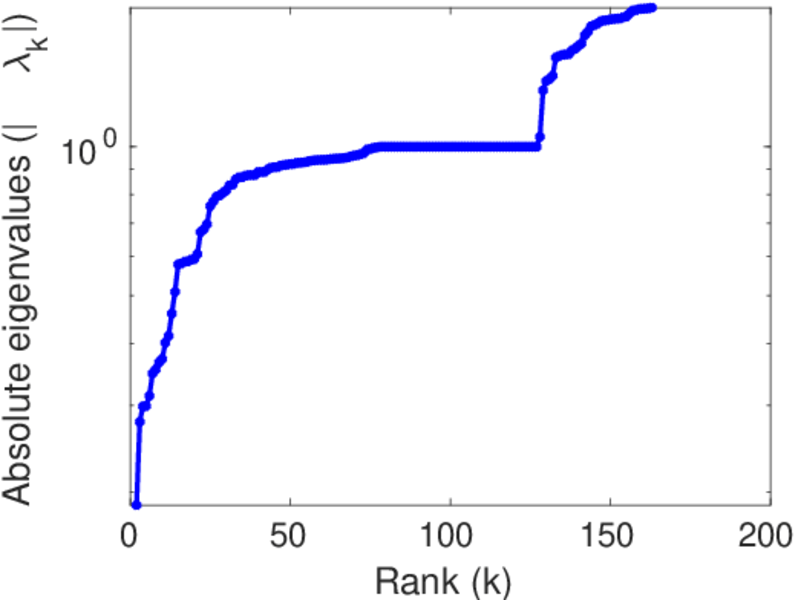
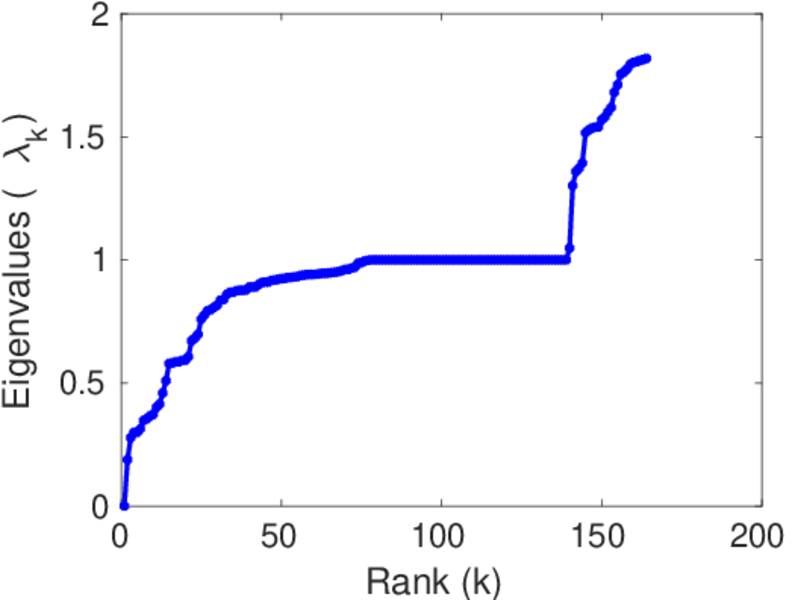
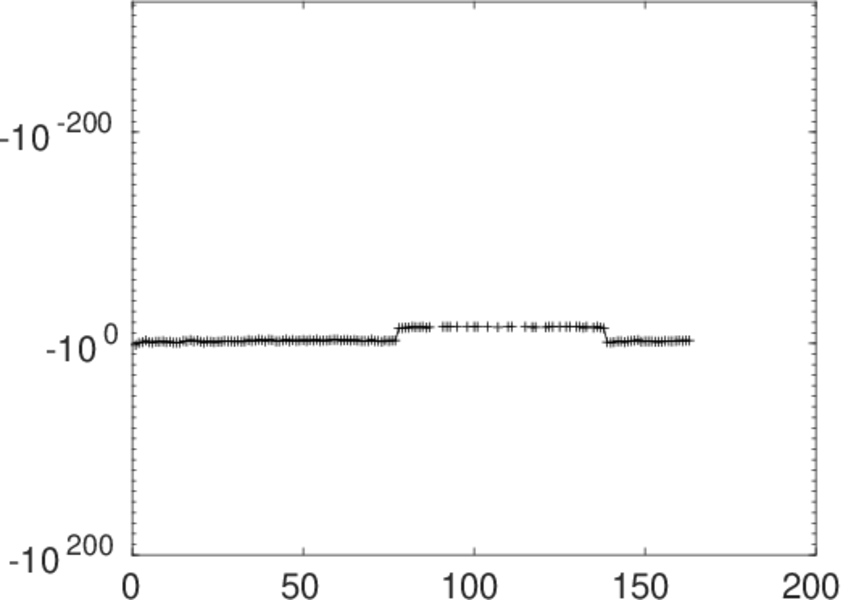
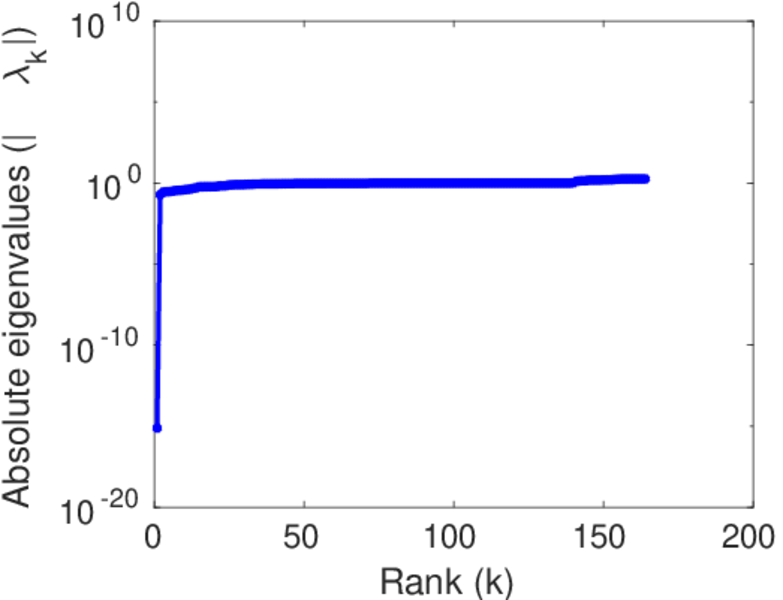
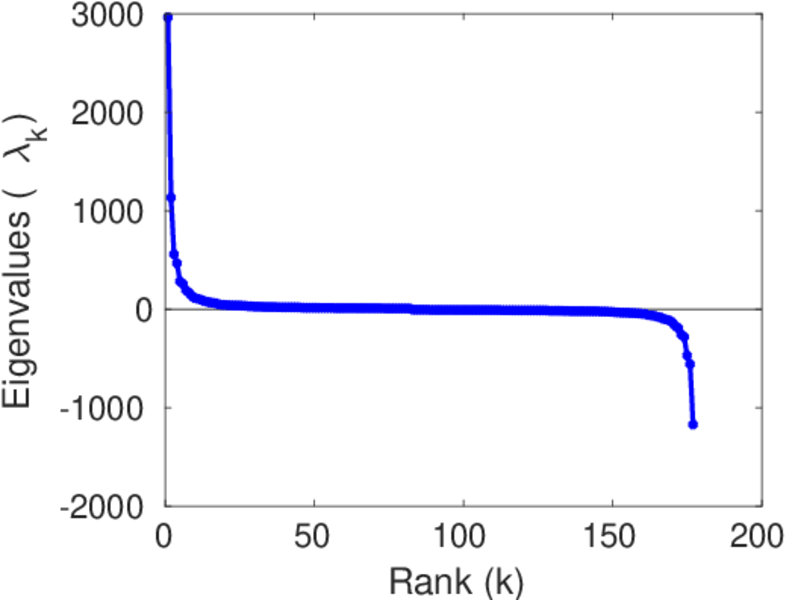
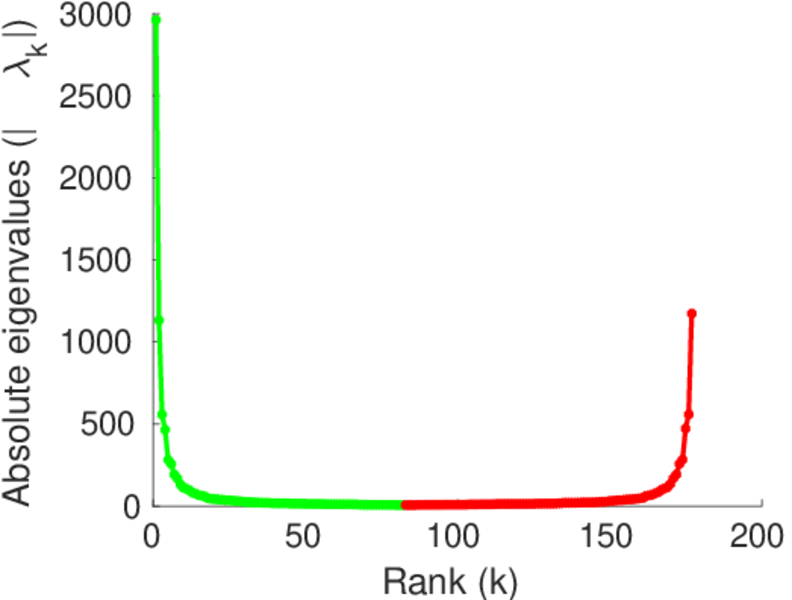
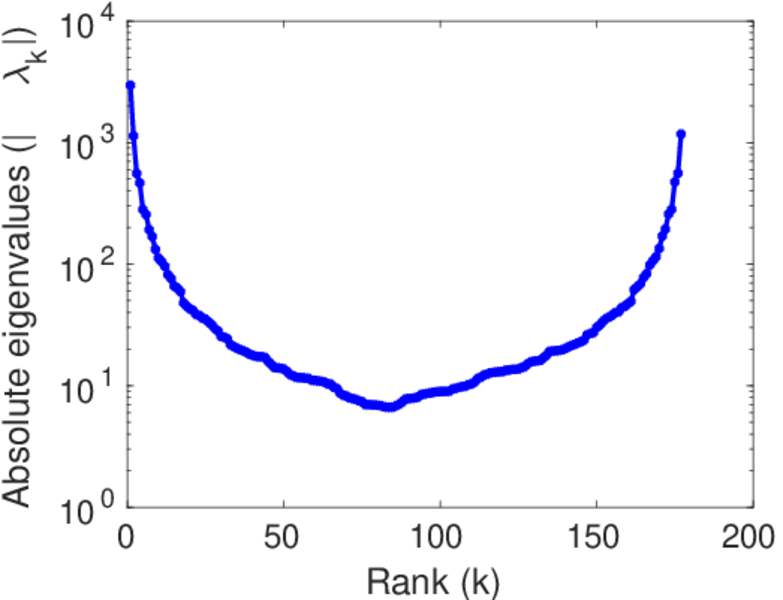
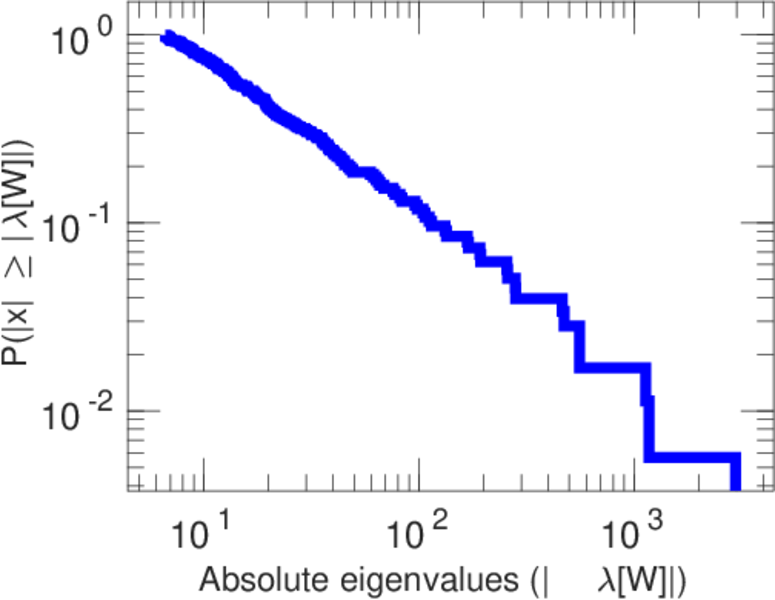
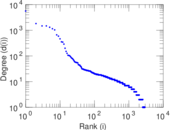
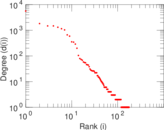
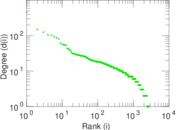
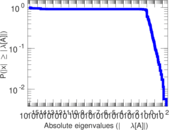
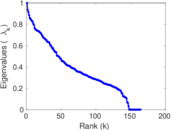
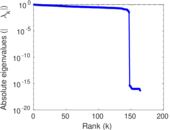
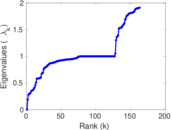
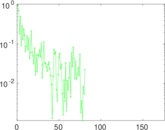
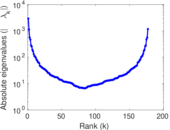
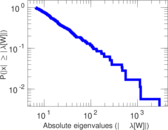
Plots


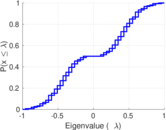
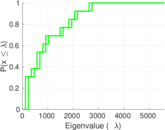


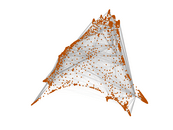
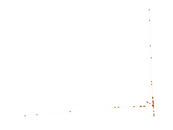


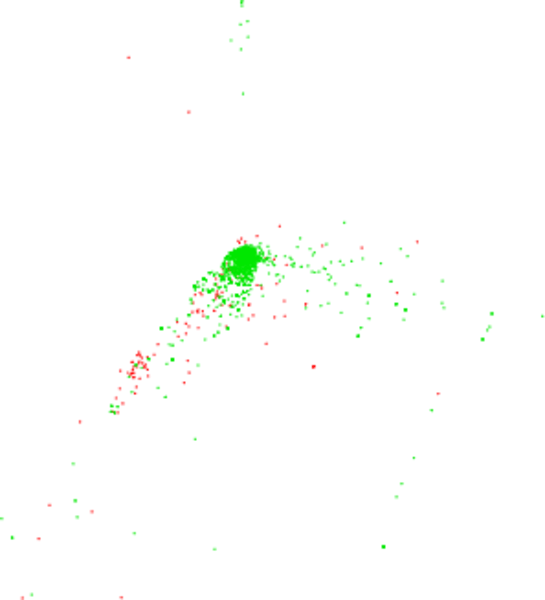
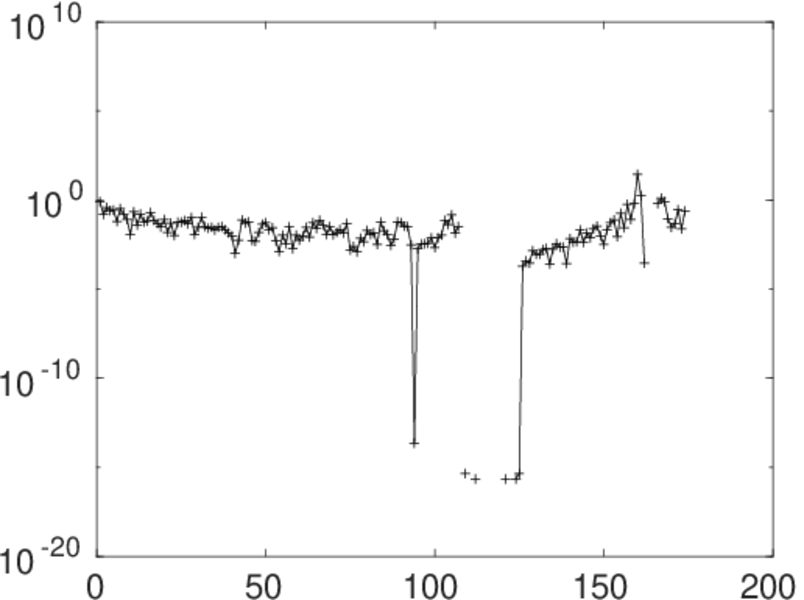
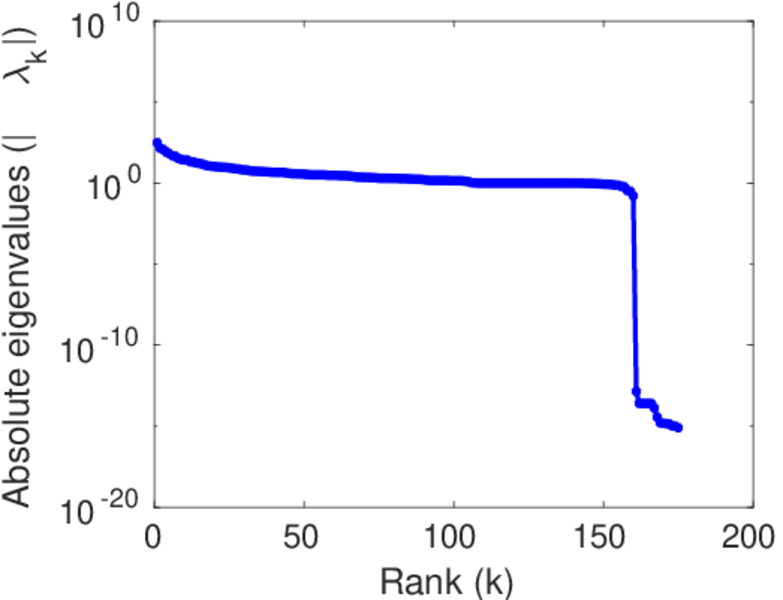
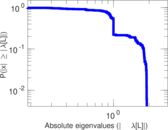
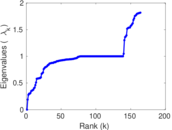
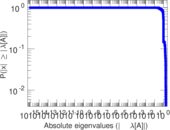
Matrix decompositions plots


Downloads
References
|
[1]
|
Jérôme Kunegis.
KONECT – The Koblenz Network Collection.
In Proc. Int. Conf. on World Wide Web Companion, pages
1343–1350, 2013.
[ http ]
|
|
[2]
|
Wikimedia Foundation.
Wikimedia downloads.
http://dumps.wikimedia.org/, January 2010.
|
 KONECT ‣ Networks ‣
Buy Me a Coffee
KONECT ‣ Networks ‣
Buy Me a Coffee