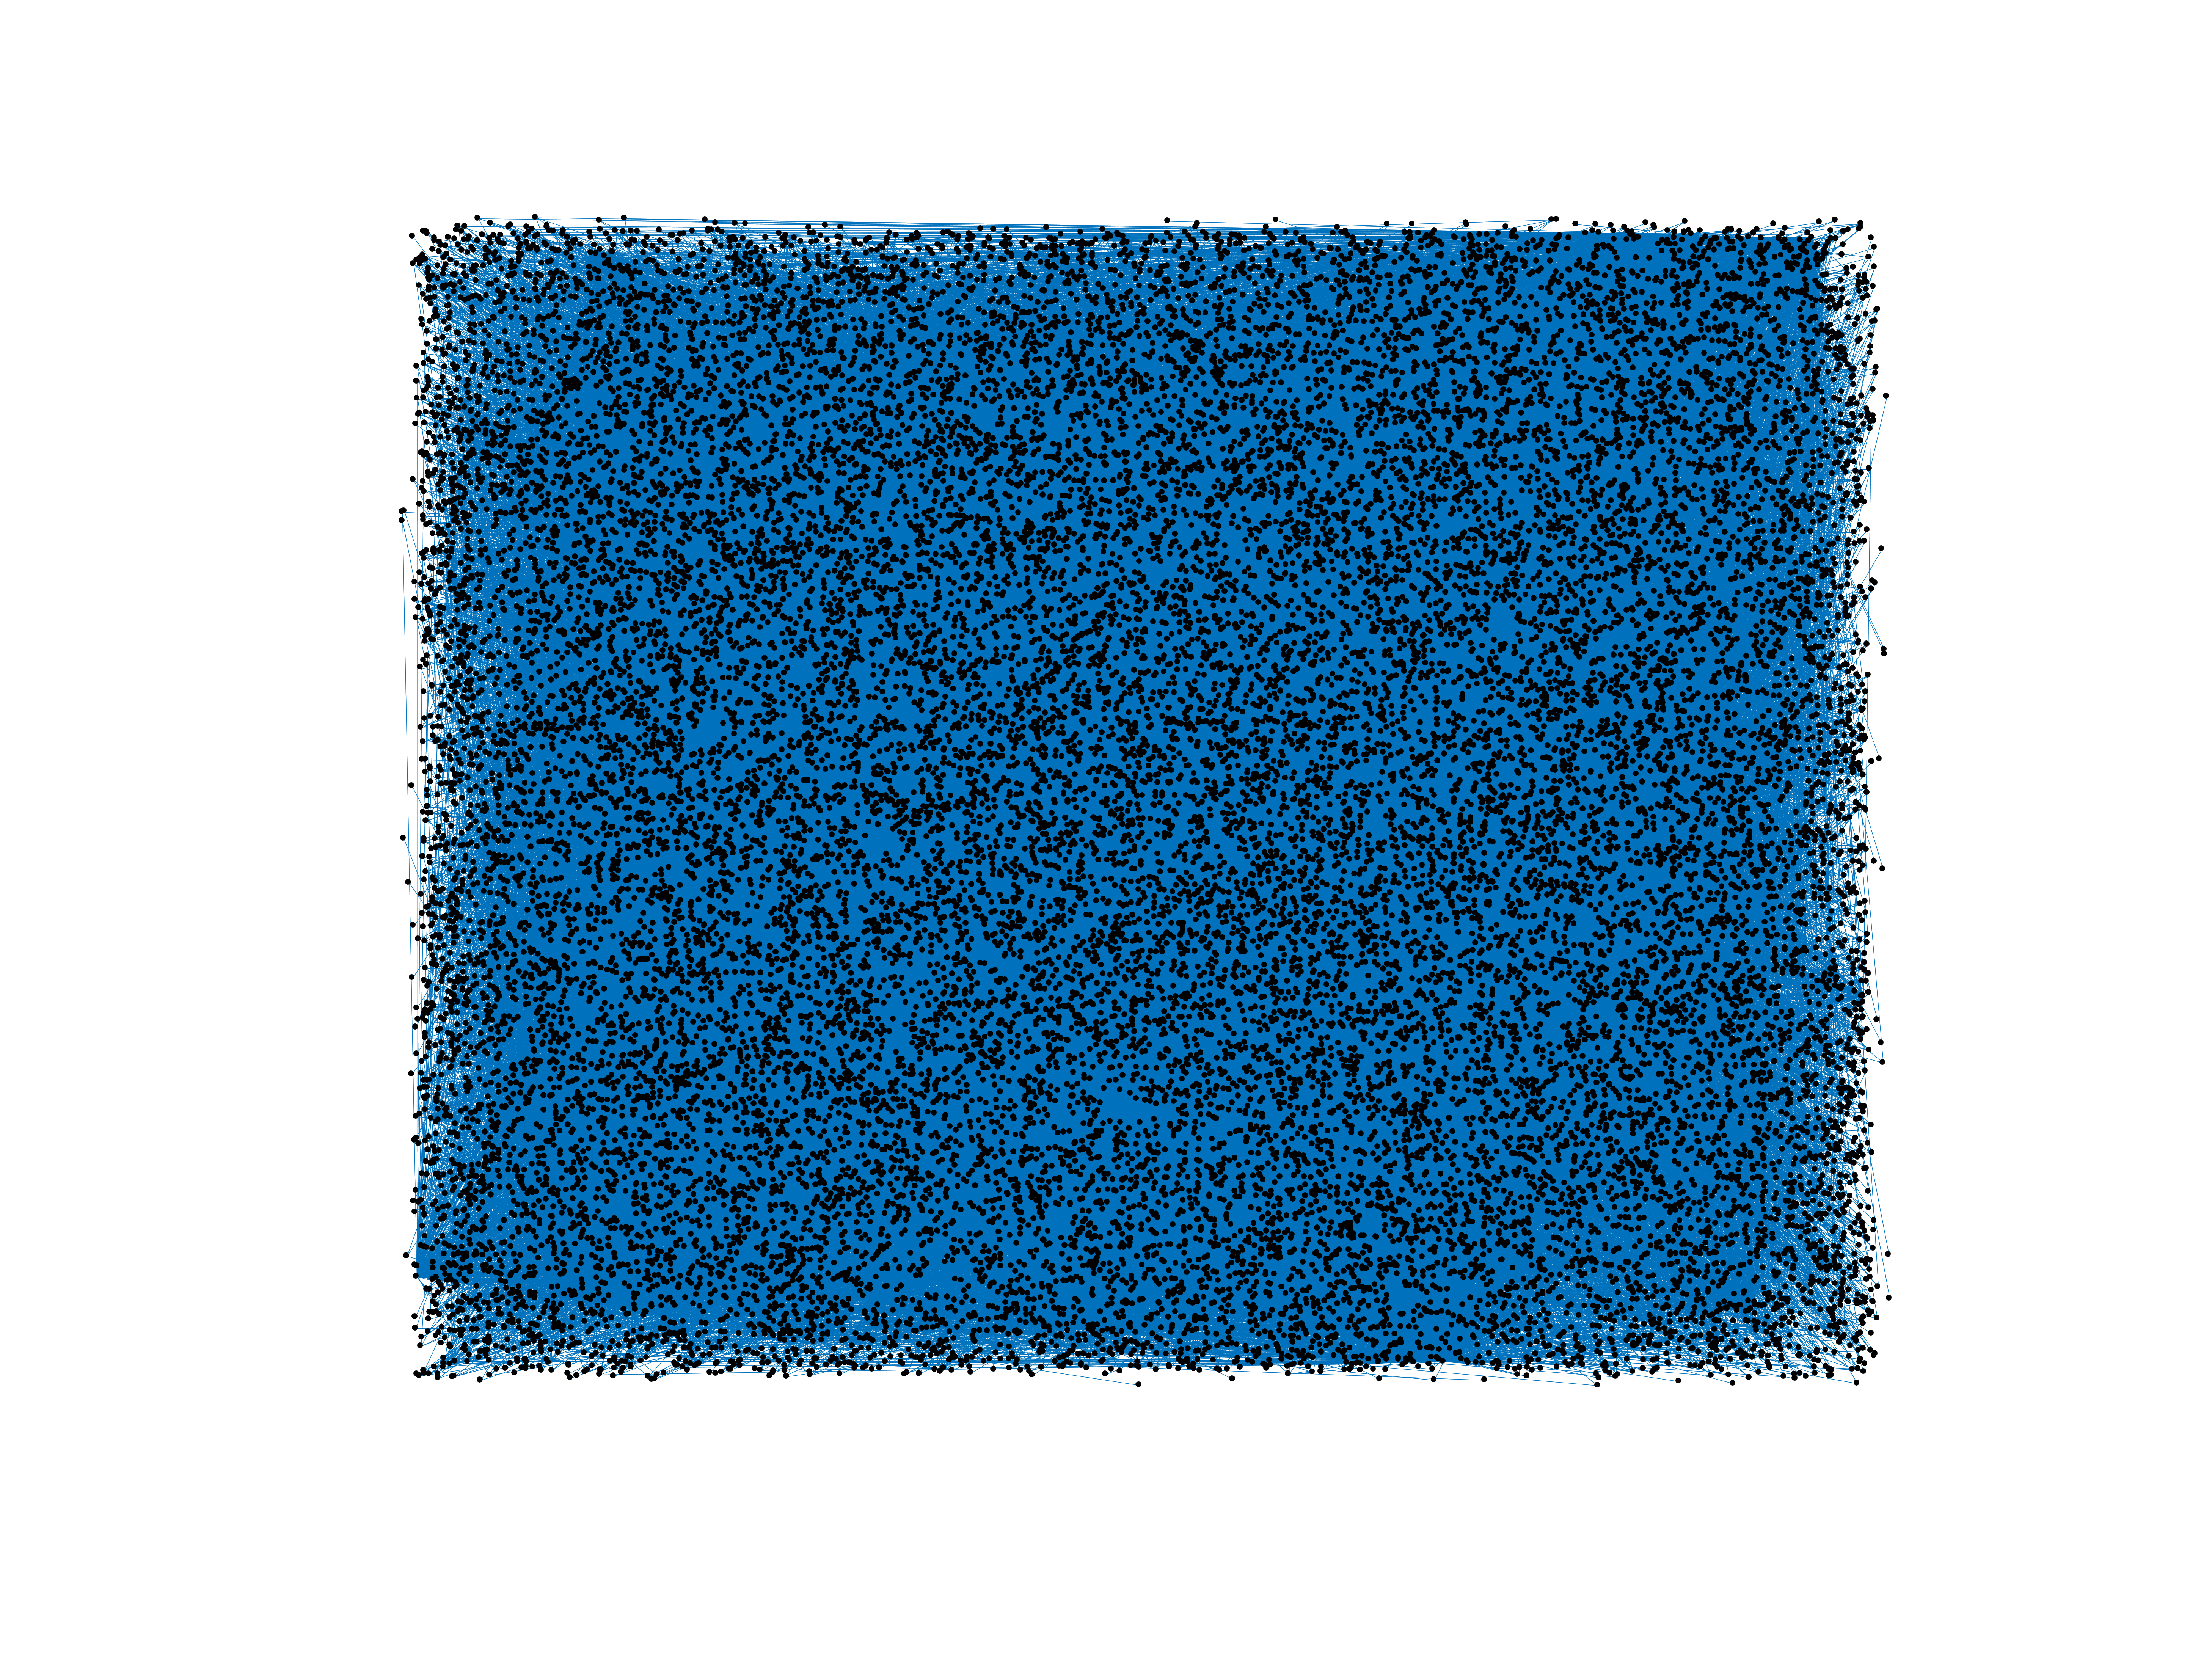
Wikinews edits (ja)
This is the bipartite edit network of the Japanese Wikinews. It contains users
and pages from the Japanese Wikinews, connected by edit events. Each edge
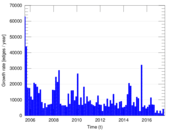
represents an edit. The dataset includes the timestamp of each edit.
Metadata
Statistics
| Size | n = | 26,220
|
| Left size | n1 = | 1,142
|
| Right size | n2 = | 25,078
|
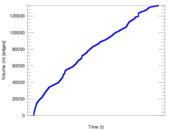
| Volume | m = | 132,830
|
| Unique edge count | m̿ = | 64,370
|
| Wedge count | s = | 111,882,862
|
| Claw count | z = | 269,254,820,897
|
| Cross count | x = | 623,542,759,745,365
|
| Square count | q = | 25,231,940
|
| 4-Tour count | T4 = | 649,530,308
|
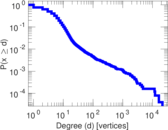
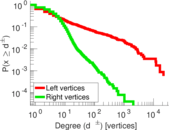
| Maximum degree | dmax = | 21,651
|
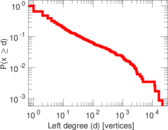
| Maximum left degree | d1max = | 21,651
|
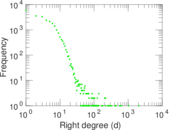
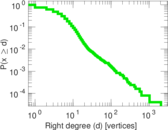
| Maximum right degree | d2max = | 2,060
|
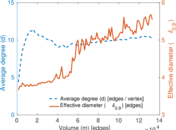
| Average degree | d = | 10.132 0
|
| Average left degree | d1 = | 116.313
|
| Average right degree | d2 = | 5.296 67
|
| Fill | p = | 0.002 247 63
|
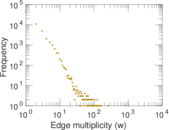
| Average edge multiplicity | m̃ = | 2.063 54
|
| Size of LCC | N = | 25,562
|
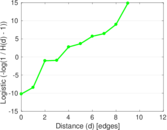
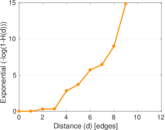
| Diameter | δ = | 14
|
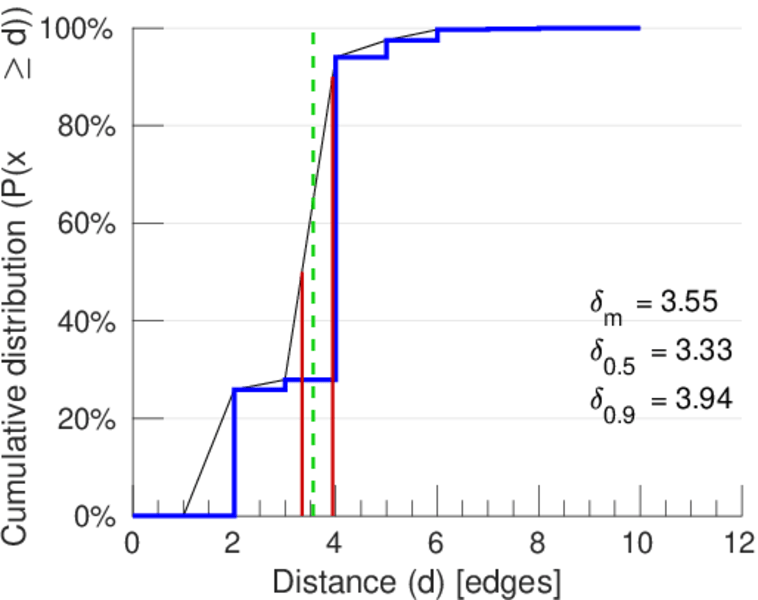
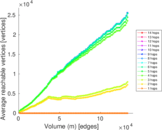
| 50-Percentile effective diameter | δ0.5 = | 3.334 13
|
| 90-Percentile effective diameter | δ0.9 = | 3.939 34
|
| Median distance | δM = | 4
|
| Mean distance | δm = | 3.552 15
|
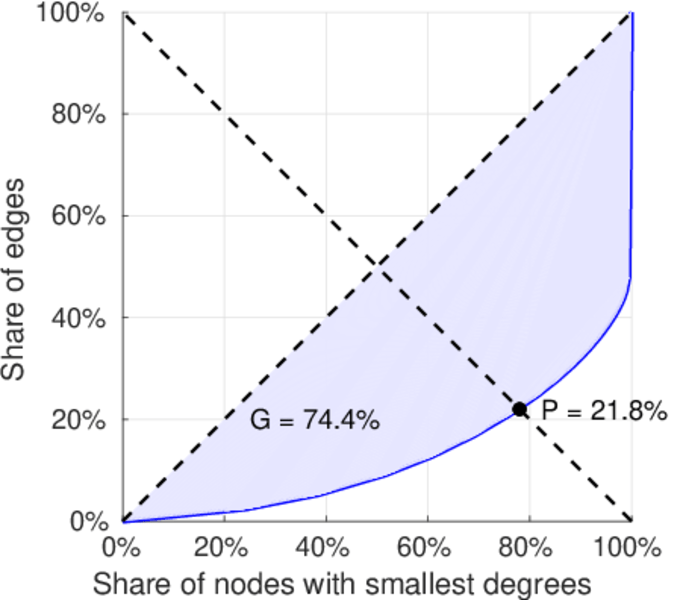
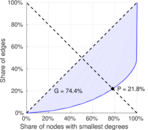
| Gini coefficient | G = | 0.745 091
|
| Balanced inequality ratio | P = | 0.218 196
|
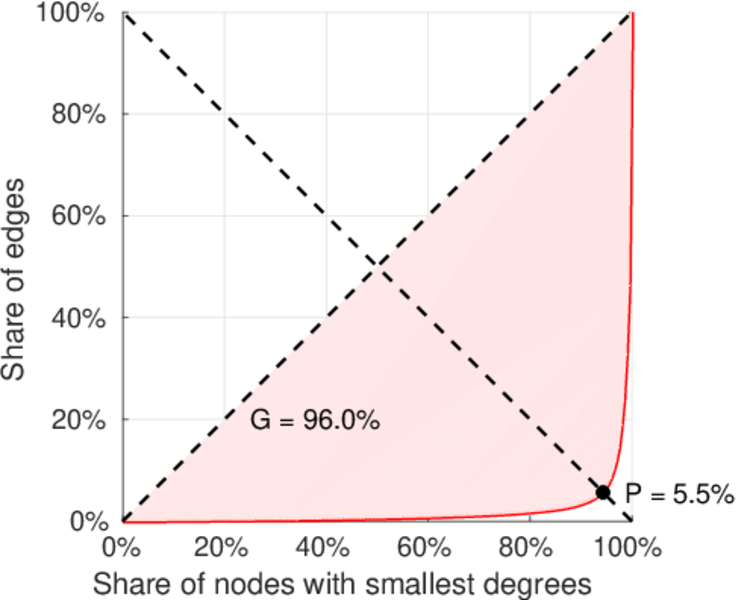
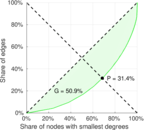
| Left balanced inequality ratio | P1 = | 0.055 040 3
|
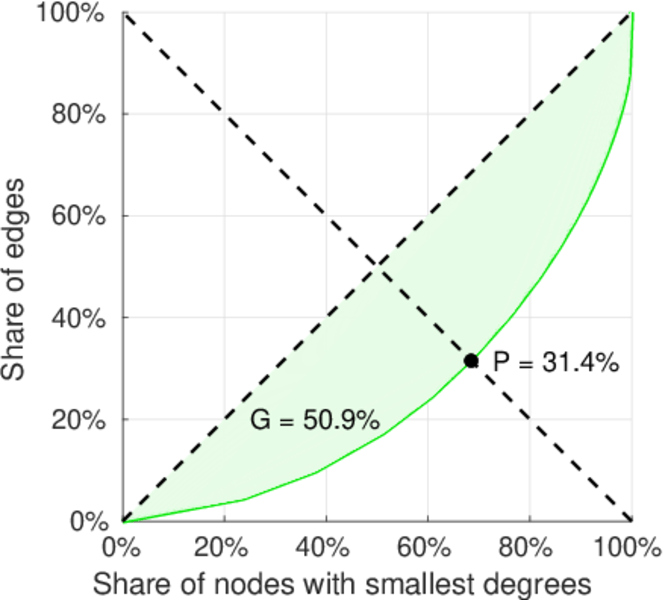
| Right balanced inequality ratio | P2 = | 0.313 709
|
| Relative edge distribution entropy | Her = | 0.742 787
|
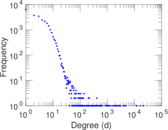
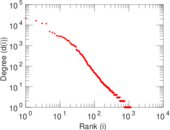
| Power law exponent | γ = | 2.311 99
|
| Tail power law exponent | γt = | 1.561 00
|
| Tail power law exponent with p | γ3 = | 1.561 00
|
| p-value | p = | 0.117 000
|
| Left tail power law exponent with p | γ3,1 = | 1.661 00
|
| Left p-value | p1 = | 0.003 000 00
|
| Right tail power law exponent with p | γ3,2 = | 4.881 00
|
| Right p-value | p2 = | 0.000 00
|
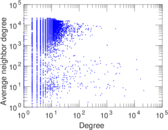
| Degree assortativity | ρ = | −0.168 243
|
| Degree assortativity p-value | pρ = | 0.000 00
|
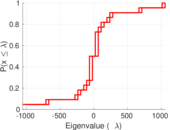
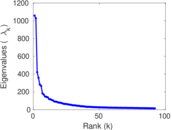
| Spectral norm | α = | 1,057.97
|
| Algebraic connectivity | a = | 0.027 756 4
|
| Spectral separation | |λ1[A] / λ2[A]| = | 1.030 19
|
| Controllability | C = | 24,011
|
| Relative controllability | Cr = | 0.917 326
|
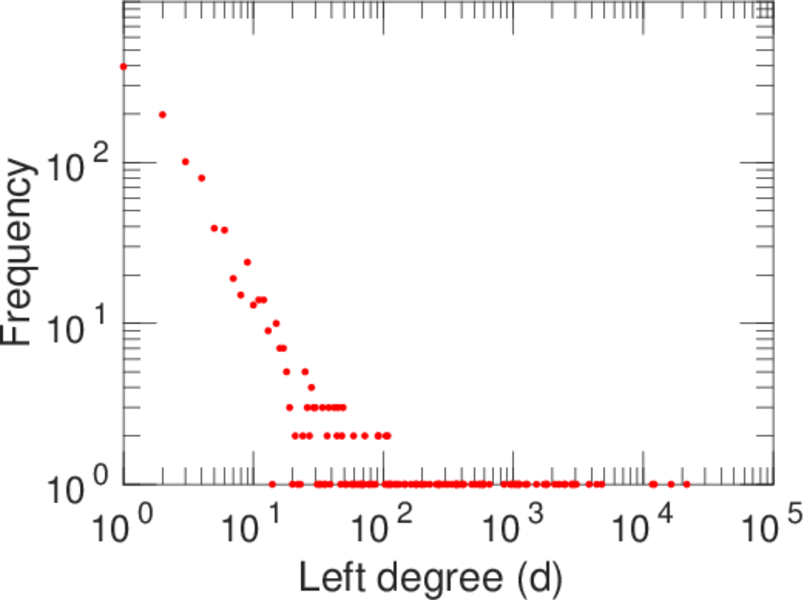
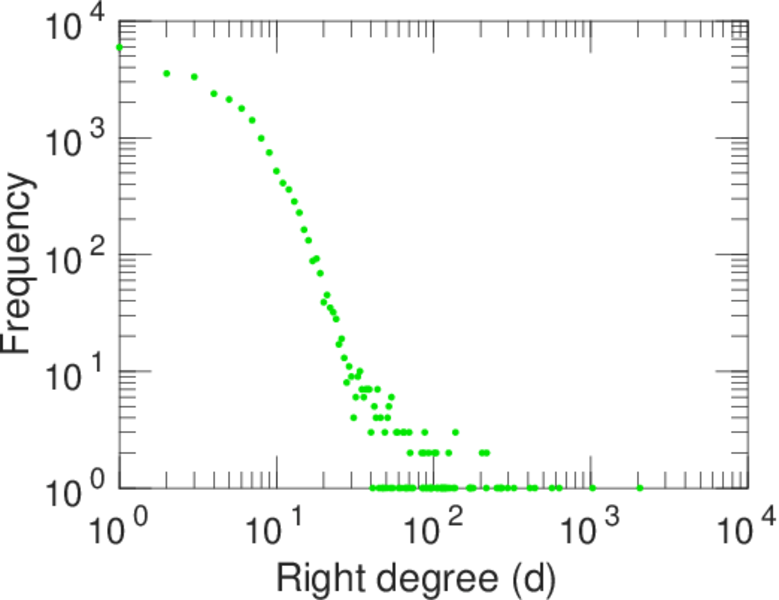
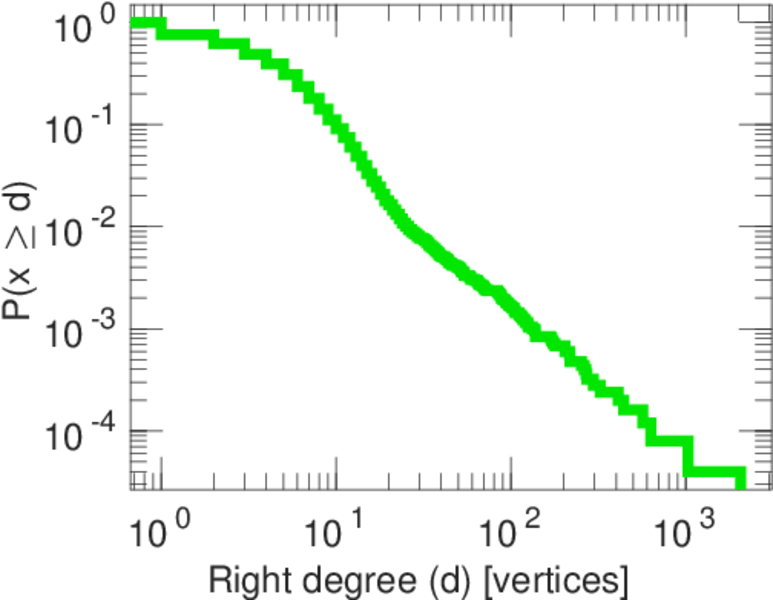
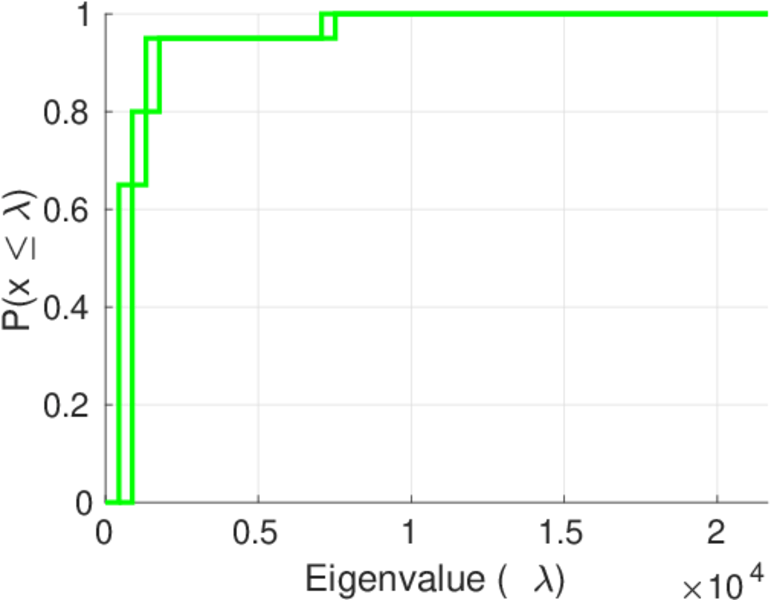
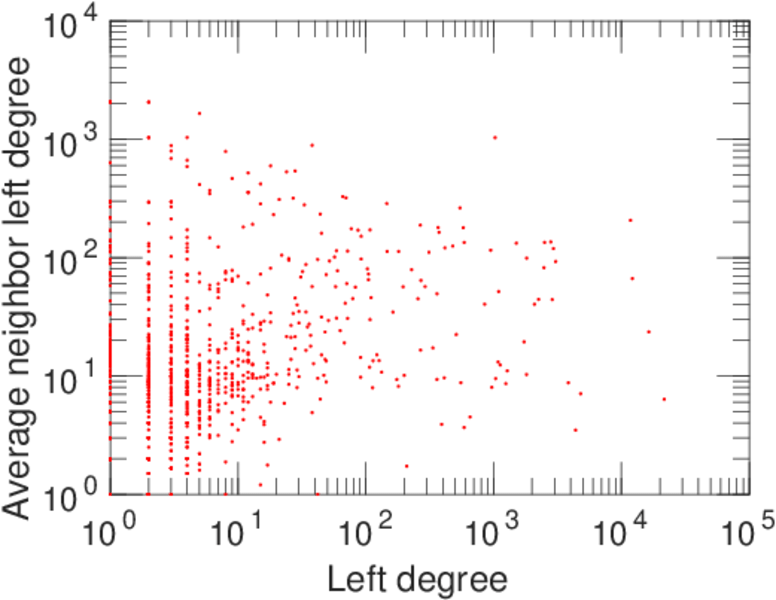
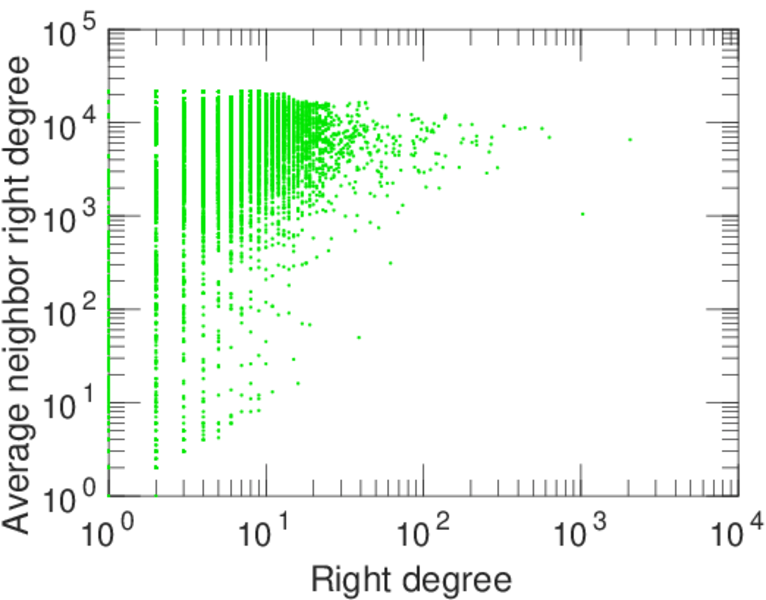
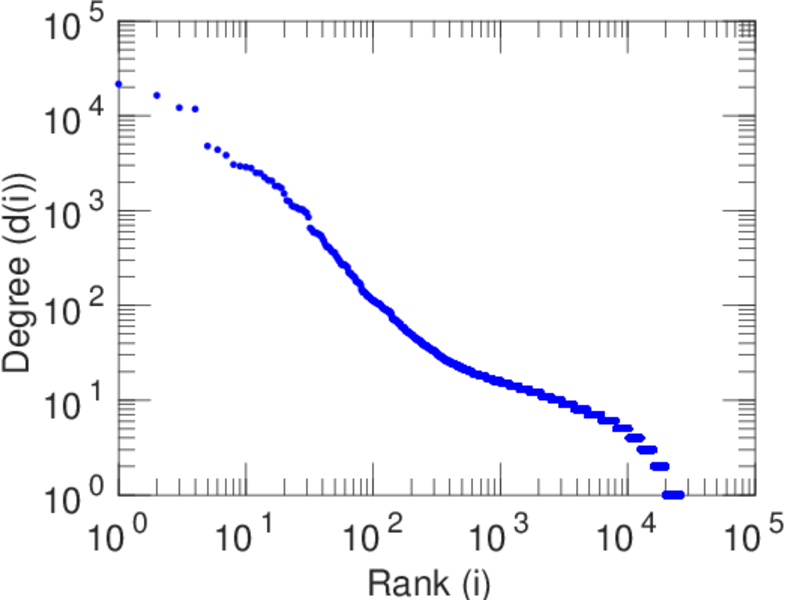
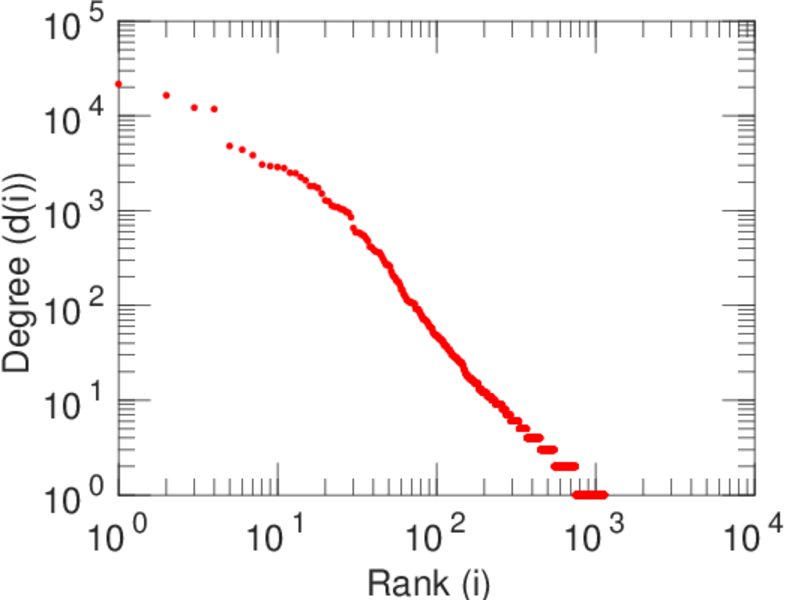
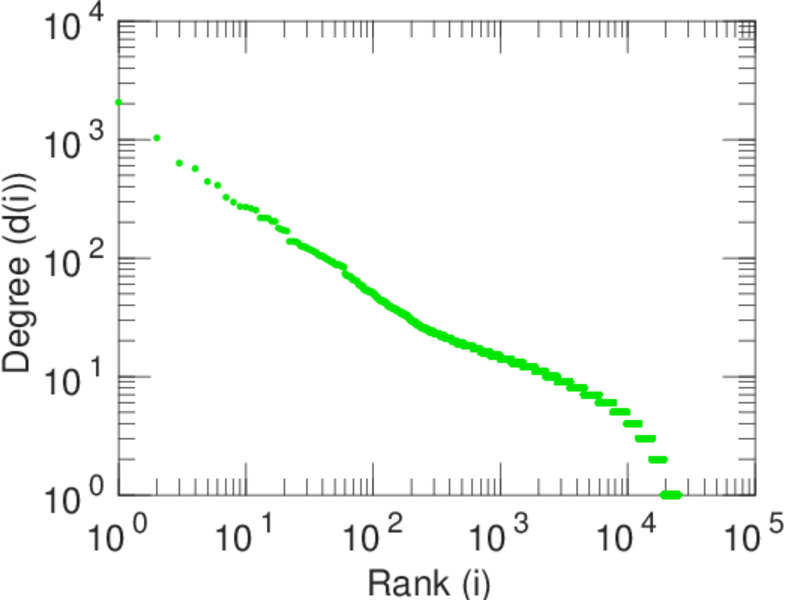
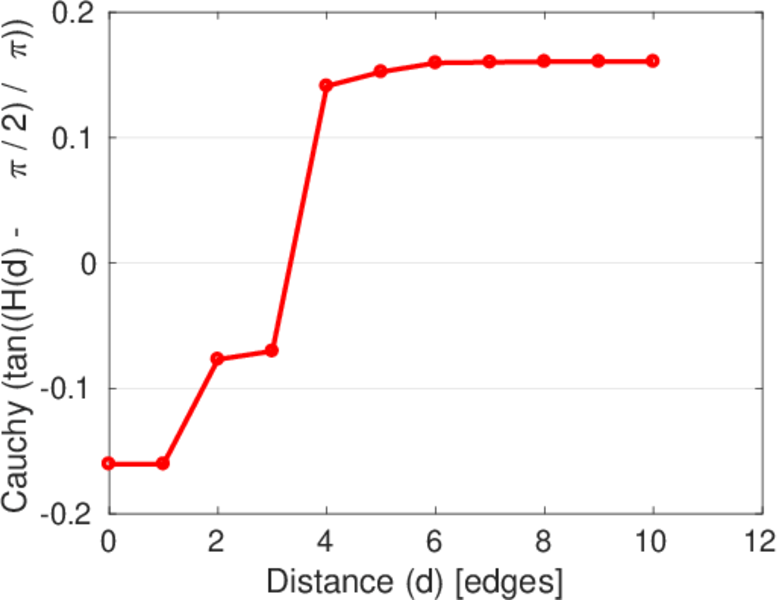
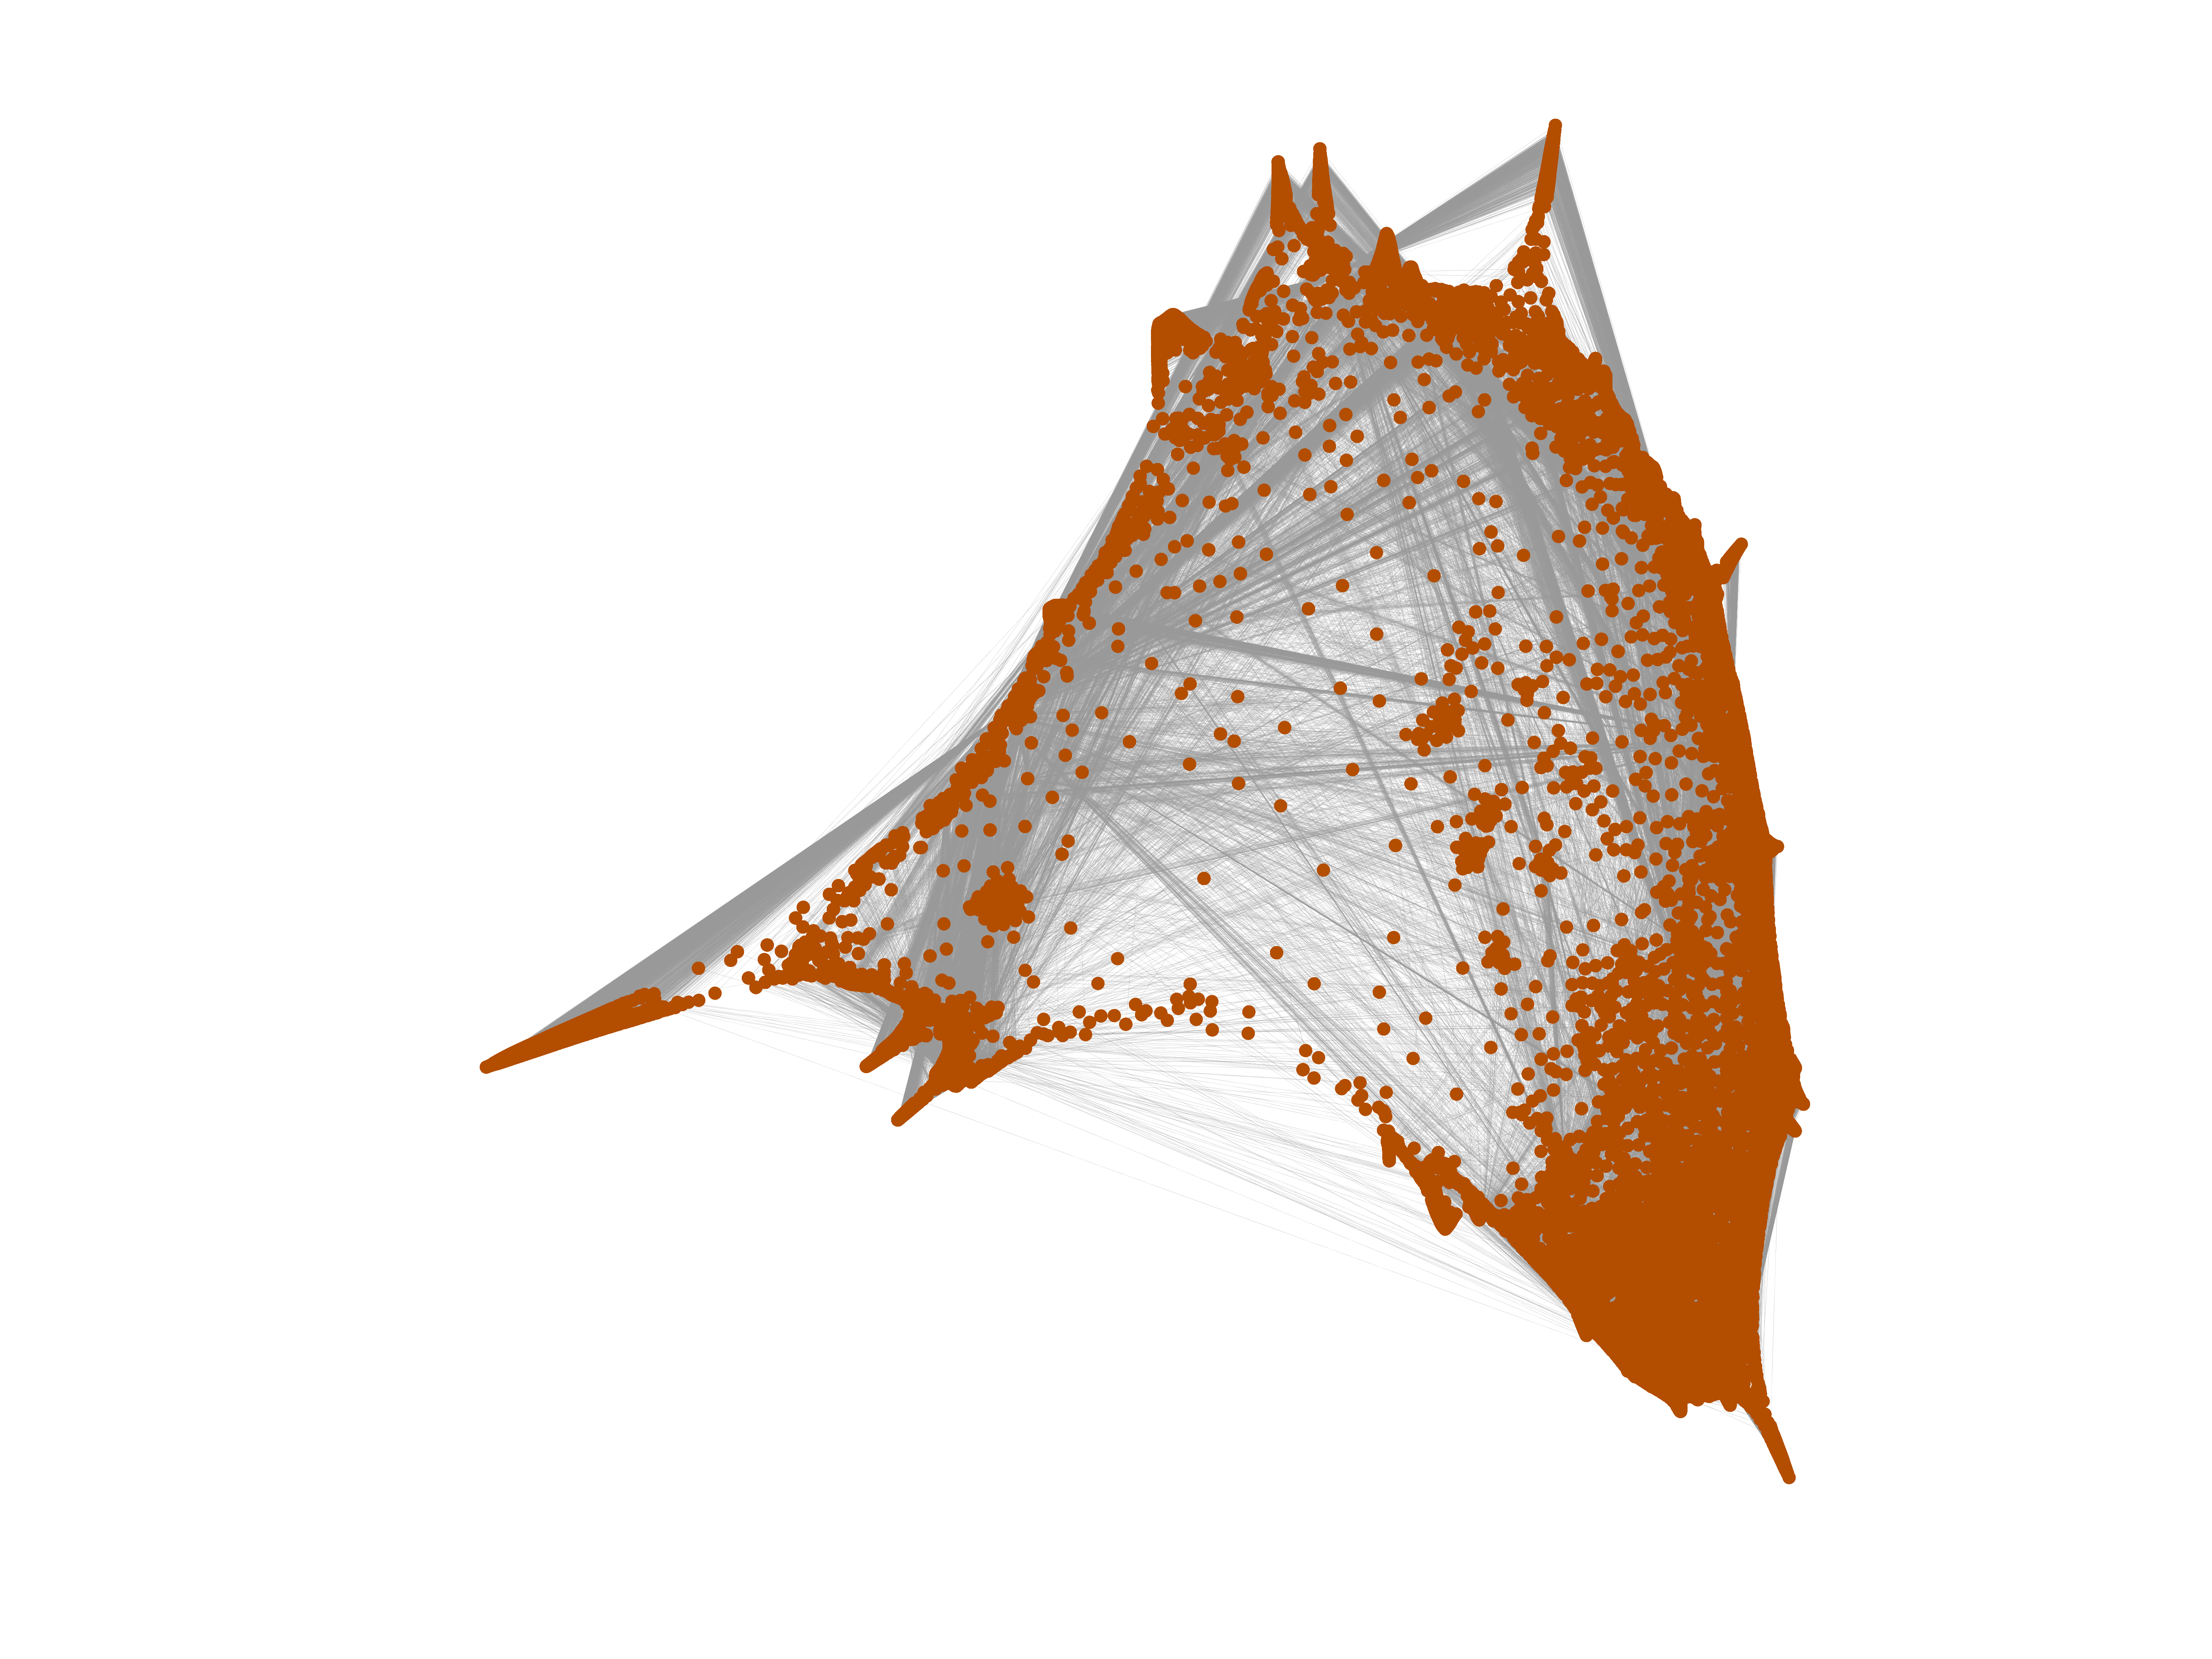
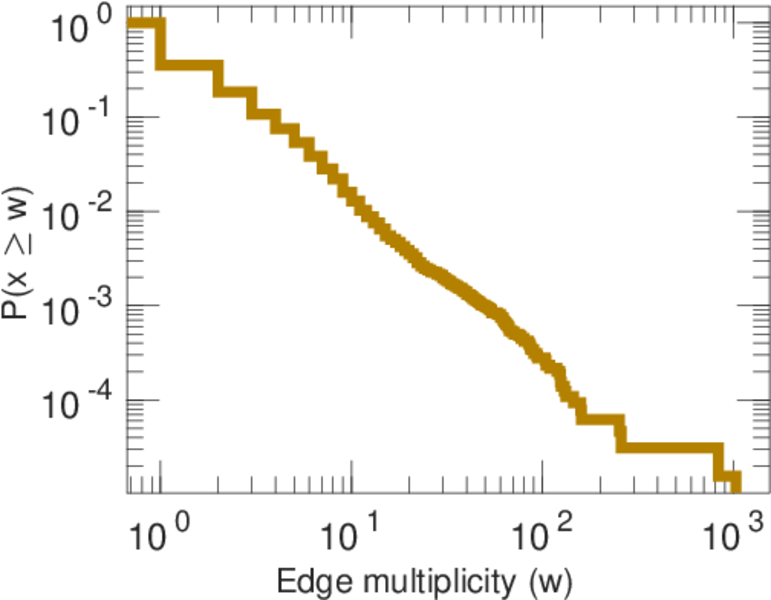
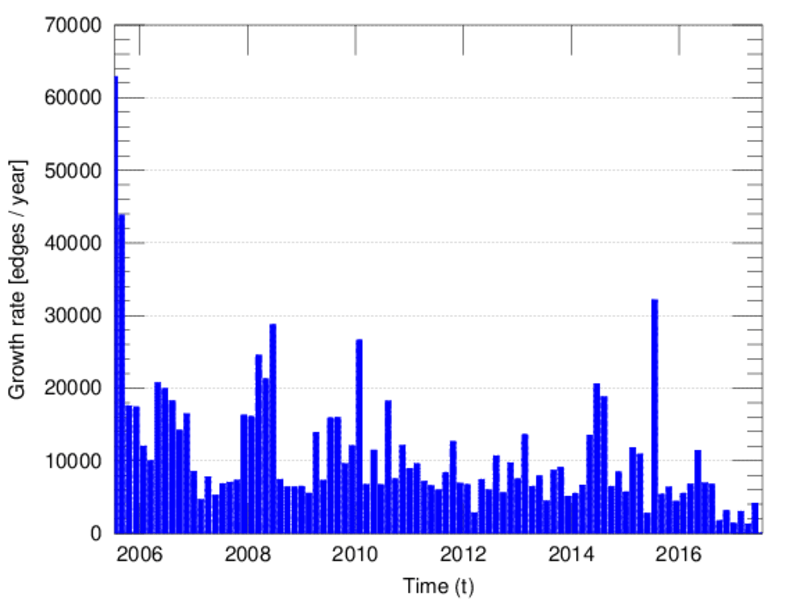
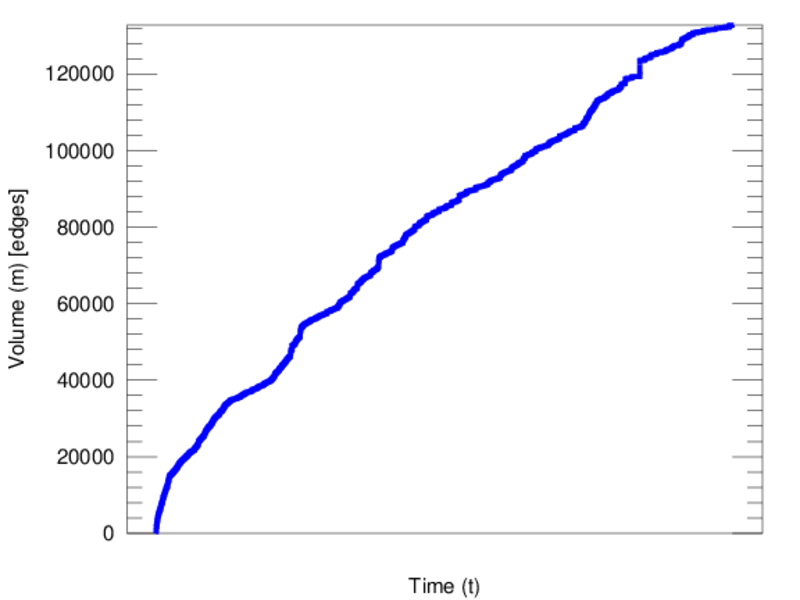
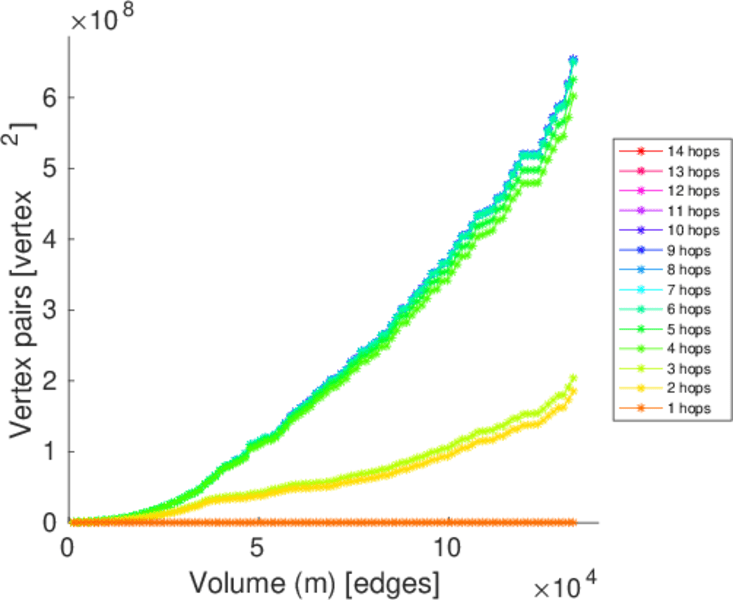
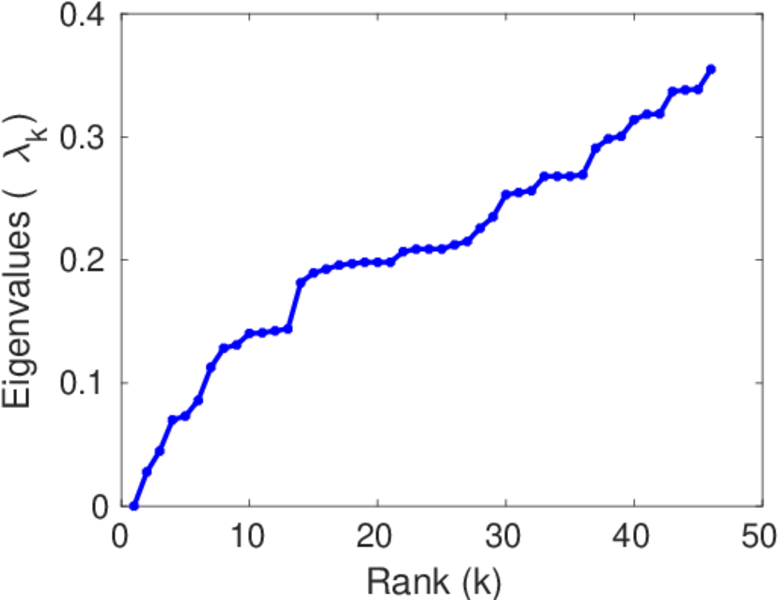
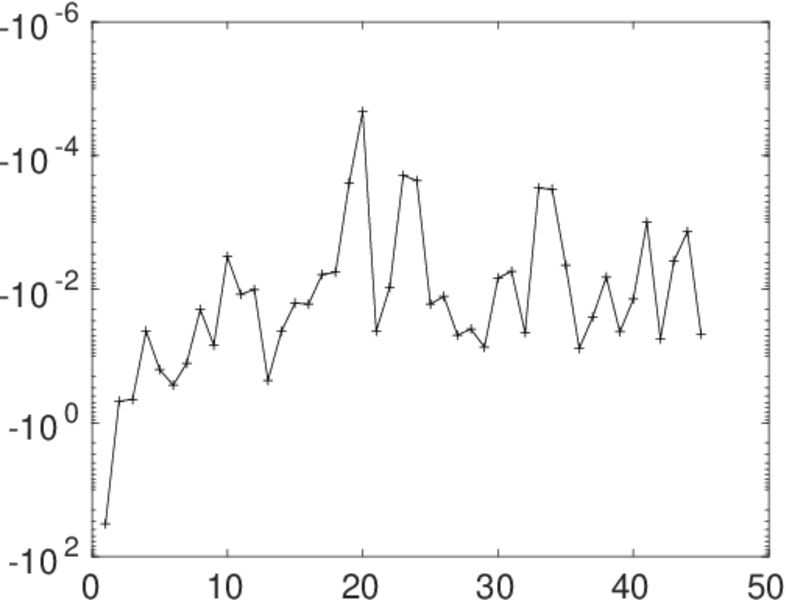
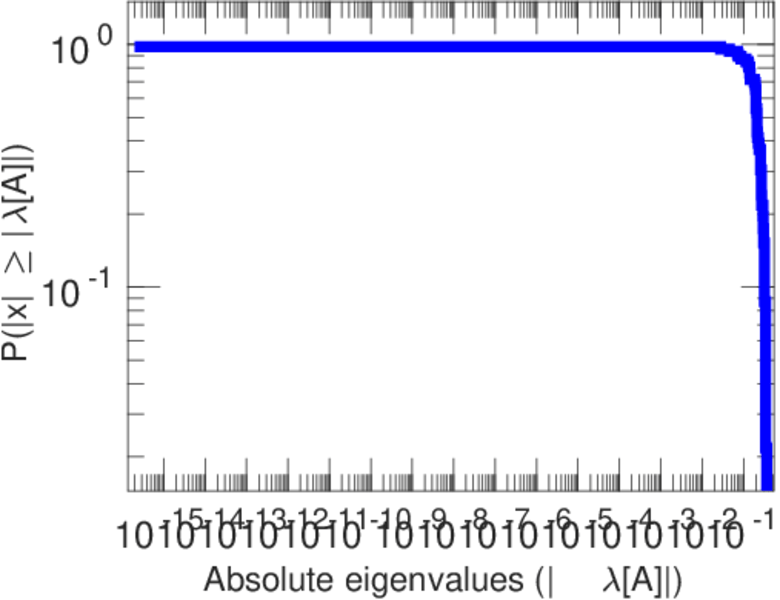
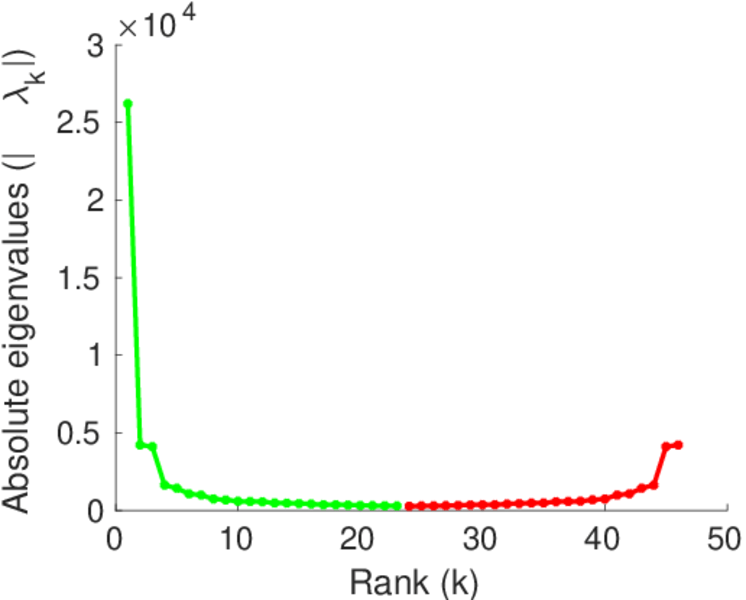
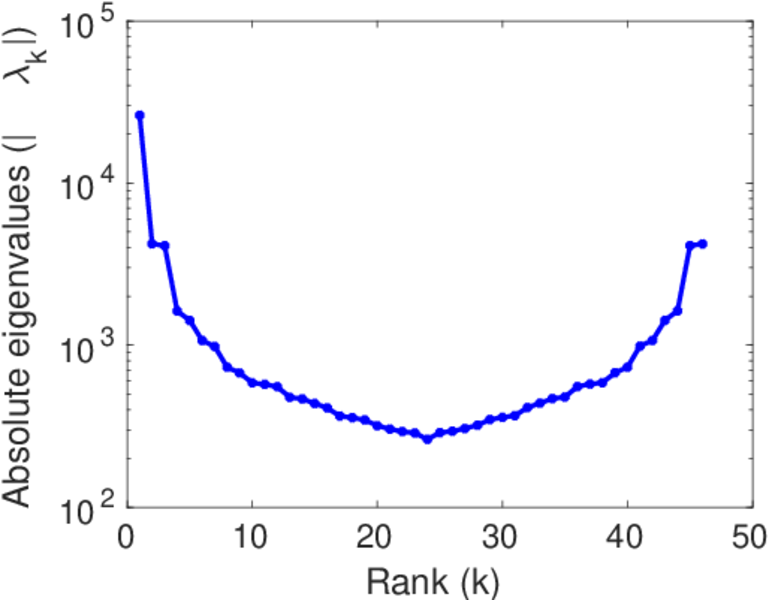
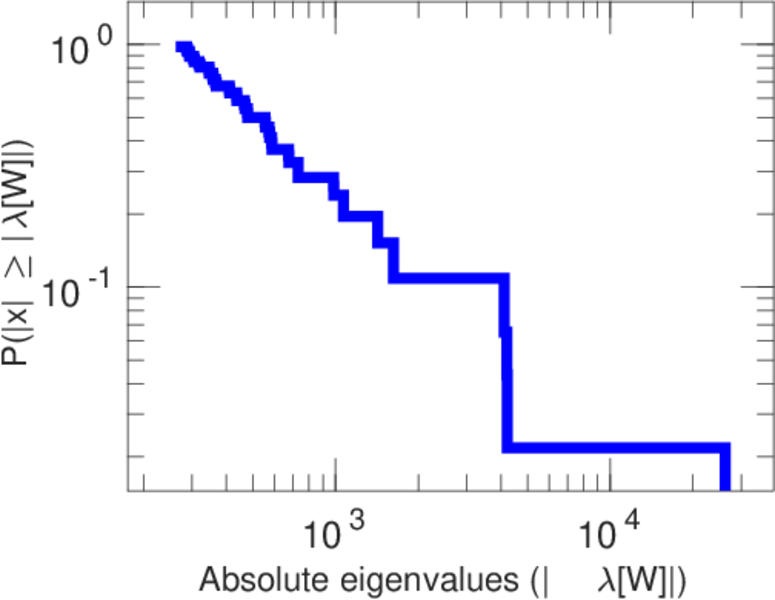
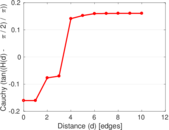
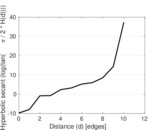
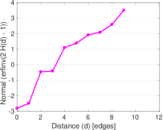
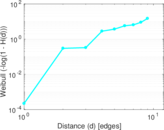
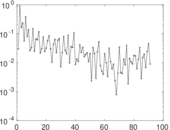
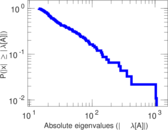
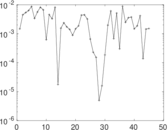
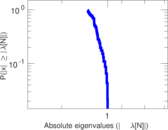
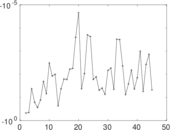
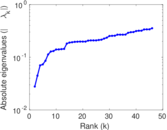
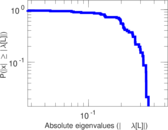
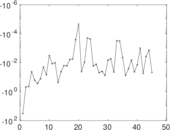
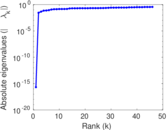
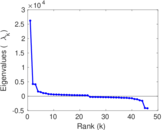
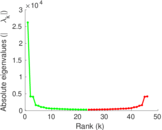
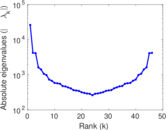
Plots


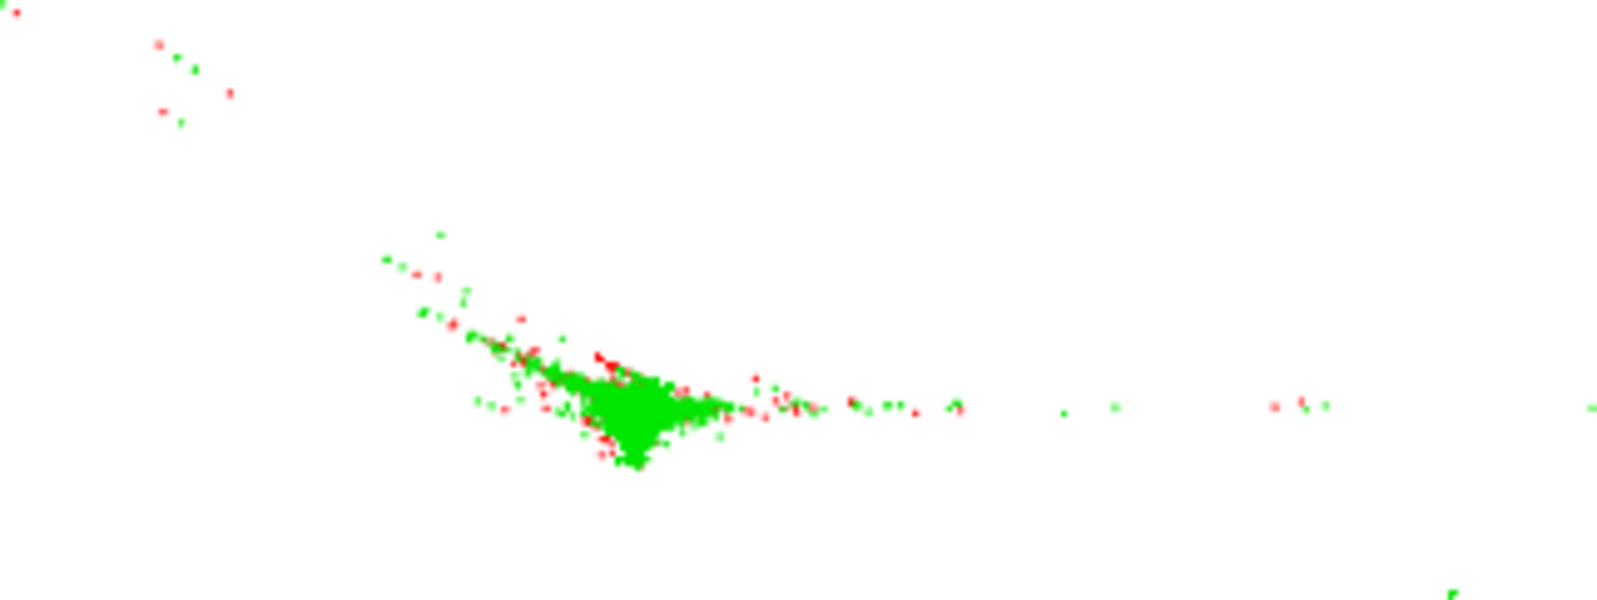
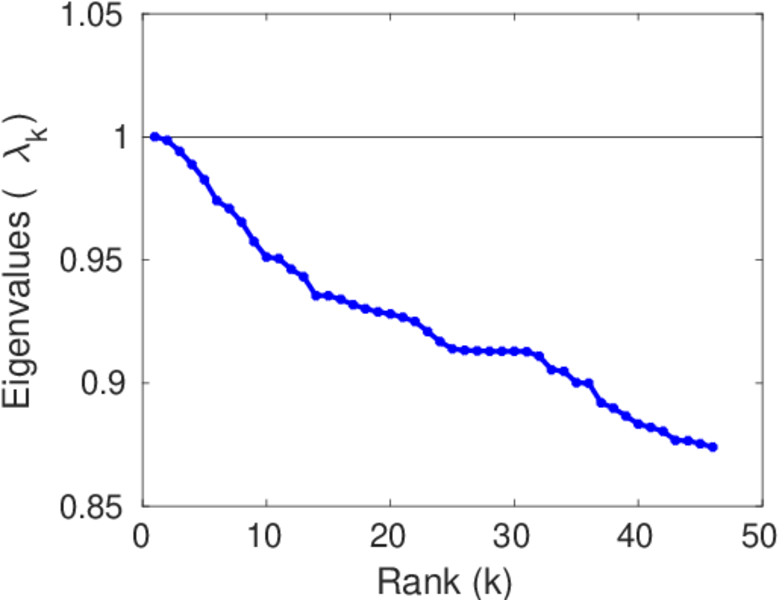
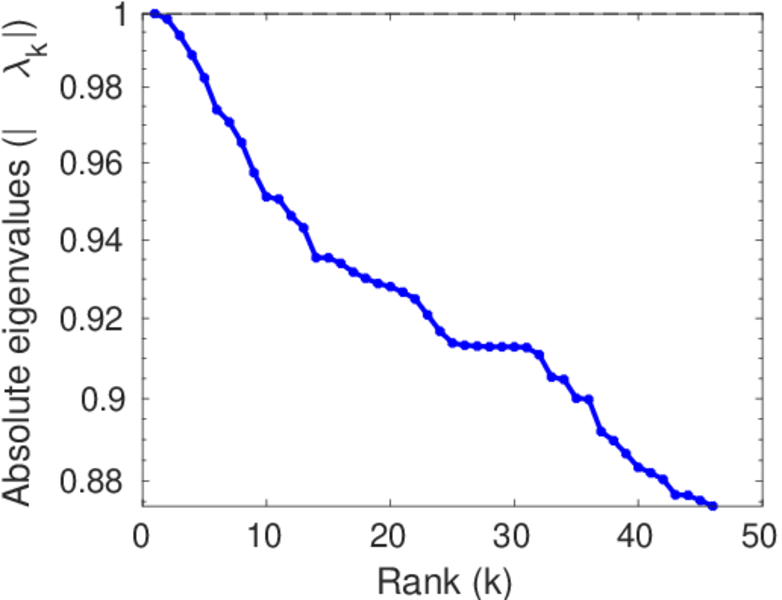
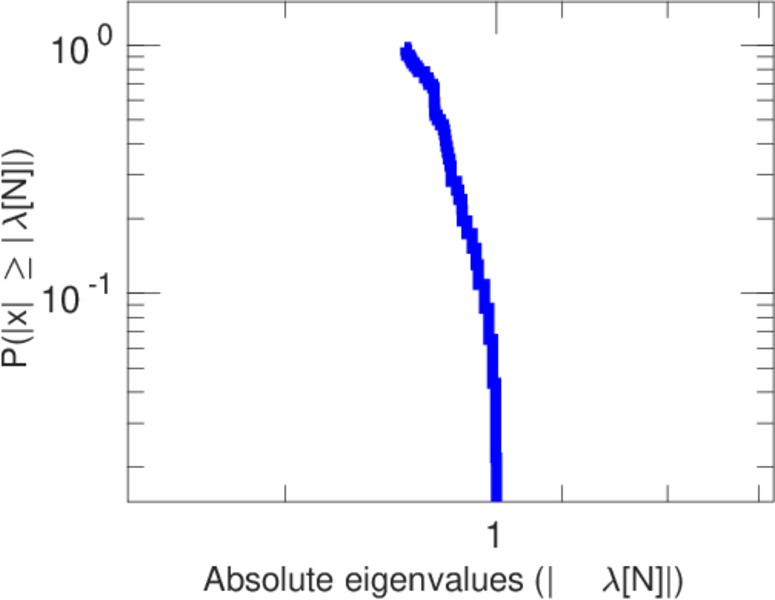
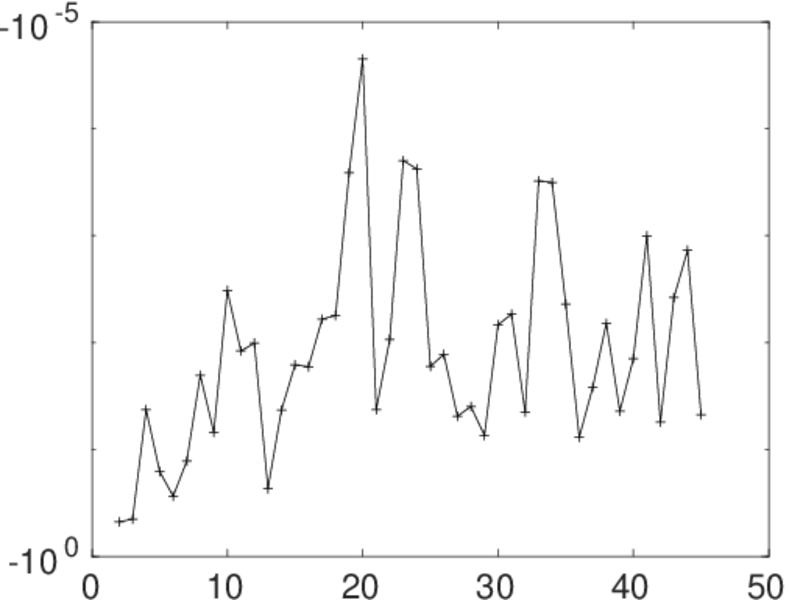
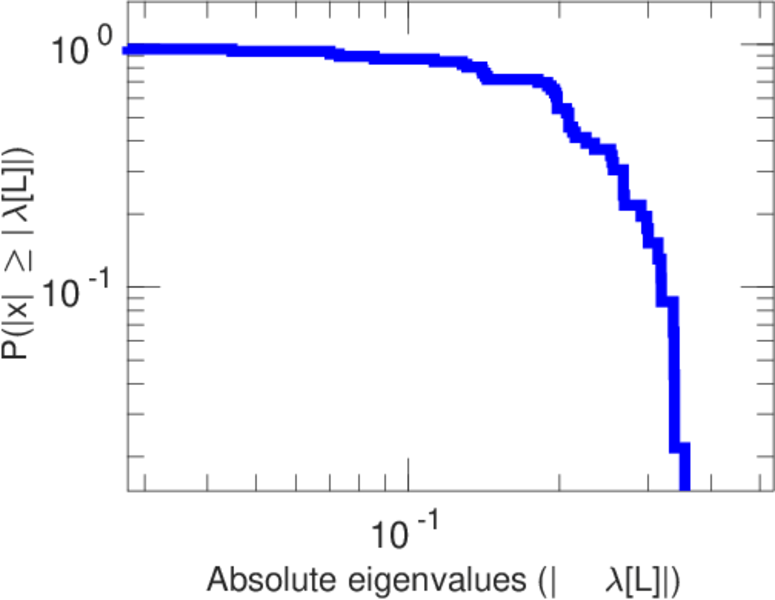
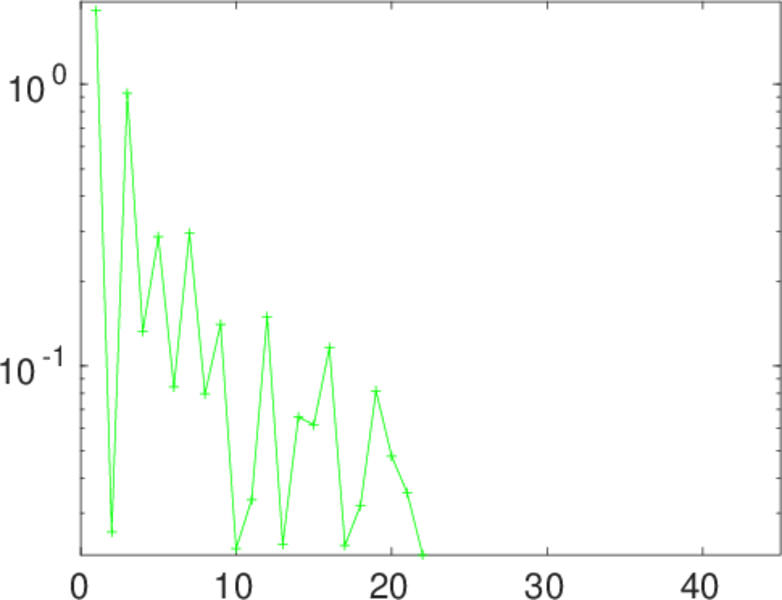
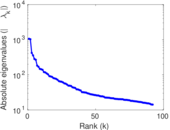
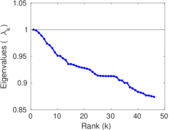
Matrix decompositions plots


Downloads
References
|
[1]
|
Jérôme Kunegis.
KONECT – The Koblenz Network Collection.
In Proc. Int. Conf. on World Wide Web Companion, pages
1343–1350, 2013.
[ http ]
|
|
[2]
|
Wikimedia Foundation.
Wikimedia downloads.
http://dumps.wikimedia.org/, January 2010.
|
 KONECT ‣ Networks ‣
Buy Me a Coffee
KONECT ‣ Networks ‣
Buy Me a Coffee