Wikiversity edits (ja)
This is the bipartite edit network of the Japanese Wikiversity. It contains
users and pages from the Japanese Wikiversity, connected by edit events. Each
edge represents an edit. The dataset includes the timestamp of each edit.
Metadata
Statistics
| Size | n = | 2,888
|
| Left size | n1 = | 492
|
| Right size | n2 = | 2,396
|
| Volume | m = | 8,599
|
| Unique edge count | m̿ = | 4,769
|
| Wedge count | s = | 523,224
|
| Claw count | z = | 67,627,959
|
| Cross count | x = | 7,572,592,760
|
| Square count | q = | 128,525
|
| 4-Tour count | T4 = | 3,130,762
|
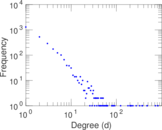
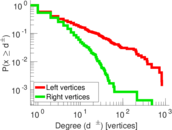
| Maximum degree | dmax = | 824
|
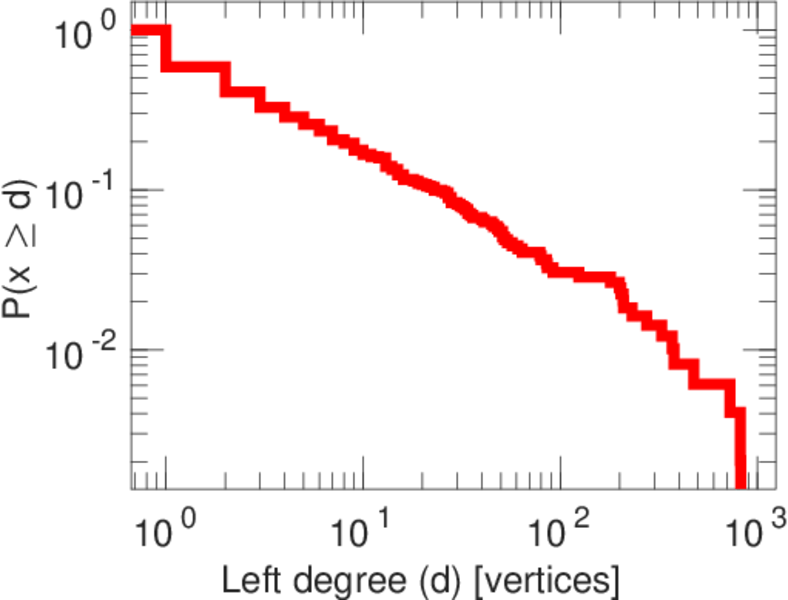
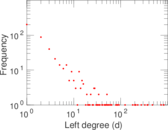
| Maximum left degree | d1max = | 824
|
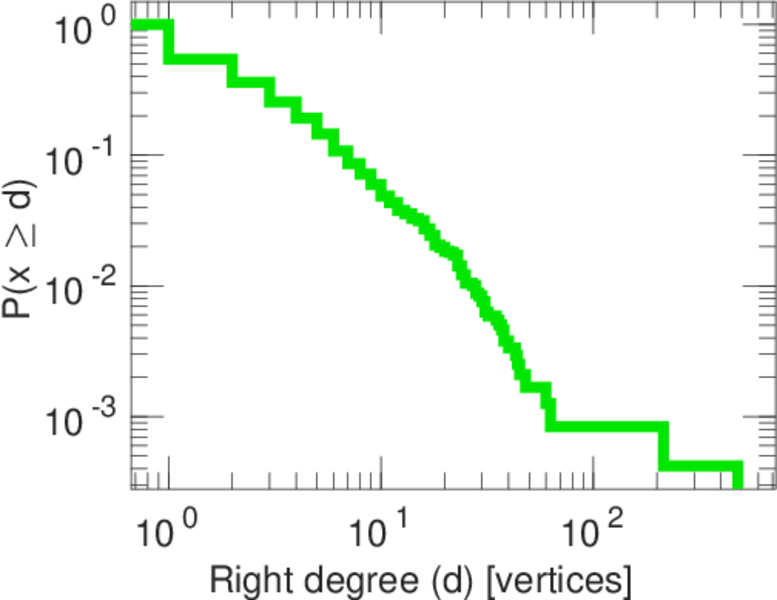
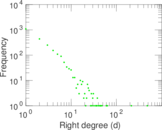
| Maximum right degree | d2max = | 481
|
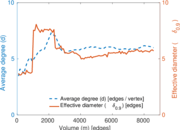
| Average degree | d = | 5.954 99
|
| Average left degree | d1 = | 17.477 6
|
| Average right degree | d2 = | 3.588 90
|
| Fill | p = | 0.004 045 53
|
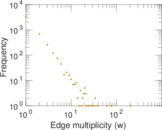
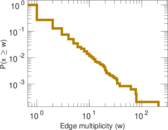
| Average edge multiplicity | m̃ = | 1.803 10
|
| Size of LCC | N = | 2,521
|
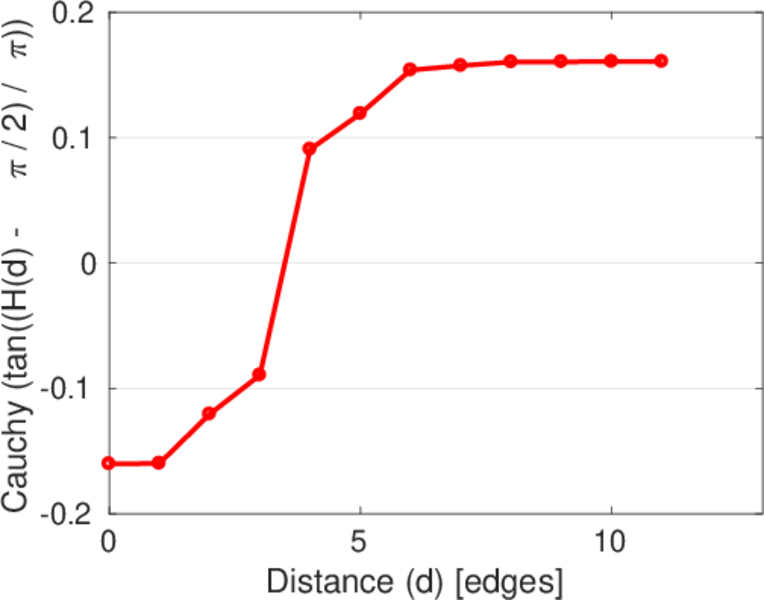
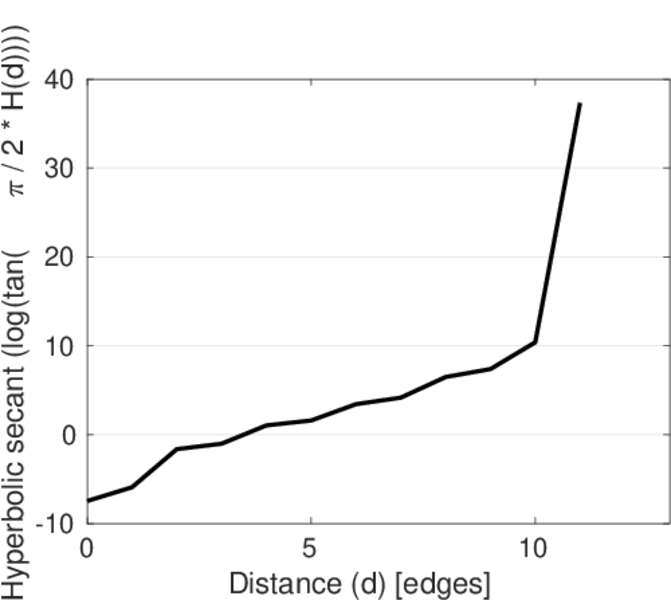
| Diameter | δ = | 12
|
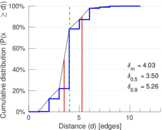
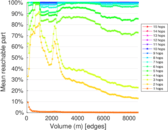
| 50-Percentile effective diameter | δ0.5 = | 3.497 19
|
| 90-Percentile effective diameter | δ0.9 = | 5.260 51
|
| Median distance | δM = | 4
|
| Mean distance | δm = | 4.032 04
|
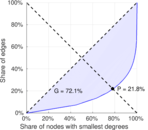
| Gini coefficient | G = | 0.740 542
|
| Balanced inequality ratio | P = | 0.207 001
|
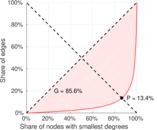
| Left balanced inequality ratio | P1 = | 0.133 736
|
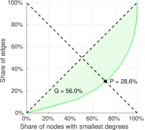
| Right balanced inequality ratio | P2 = | 0.286 080
|
| Relative edge distribution entropy | Her = | 0.814 715
|
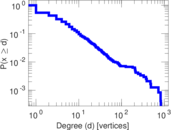
| Power law exponent | γ = | 2.932 07
|
| Tail power law exponent | γt = | 2.491 00
|
| Tail power law exponent with p | γ3 = | 2.491 00
|
| p-value | p = | 0.001 000 00
|
| Left tail power law exponent with p | γ3,1 = | 1.821 00
|
| Left p-value | p1 = | 0.249 000
|
| Right tail power law exponent with p | γ3,2 = | 3.291 00
|
| Right p-value | p2 = | 0.619 000
|
| Degree assortativity | ρ = | −0.151 704
|
| Degree assortativity p-value | pρ = | 5.980 47 × 10−26
|
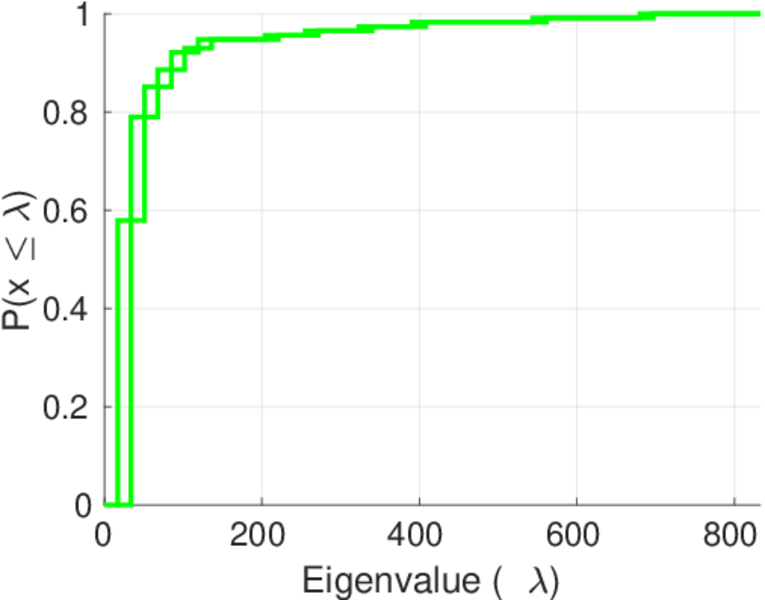
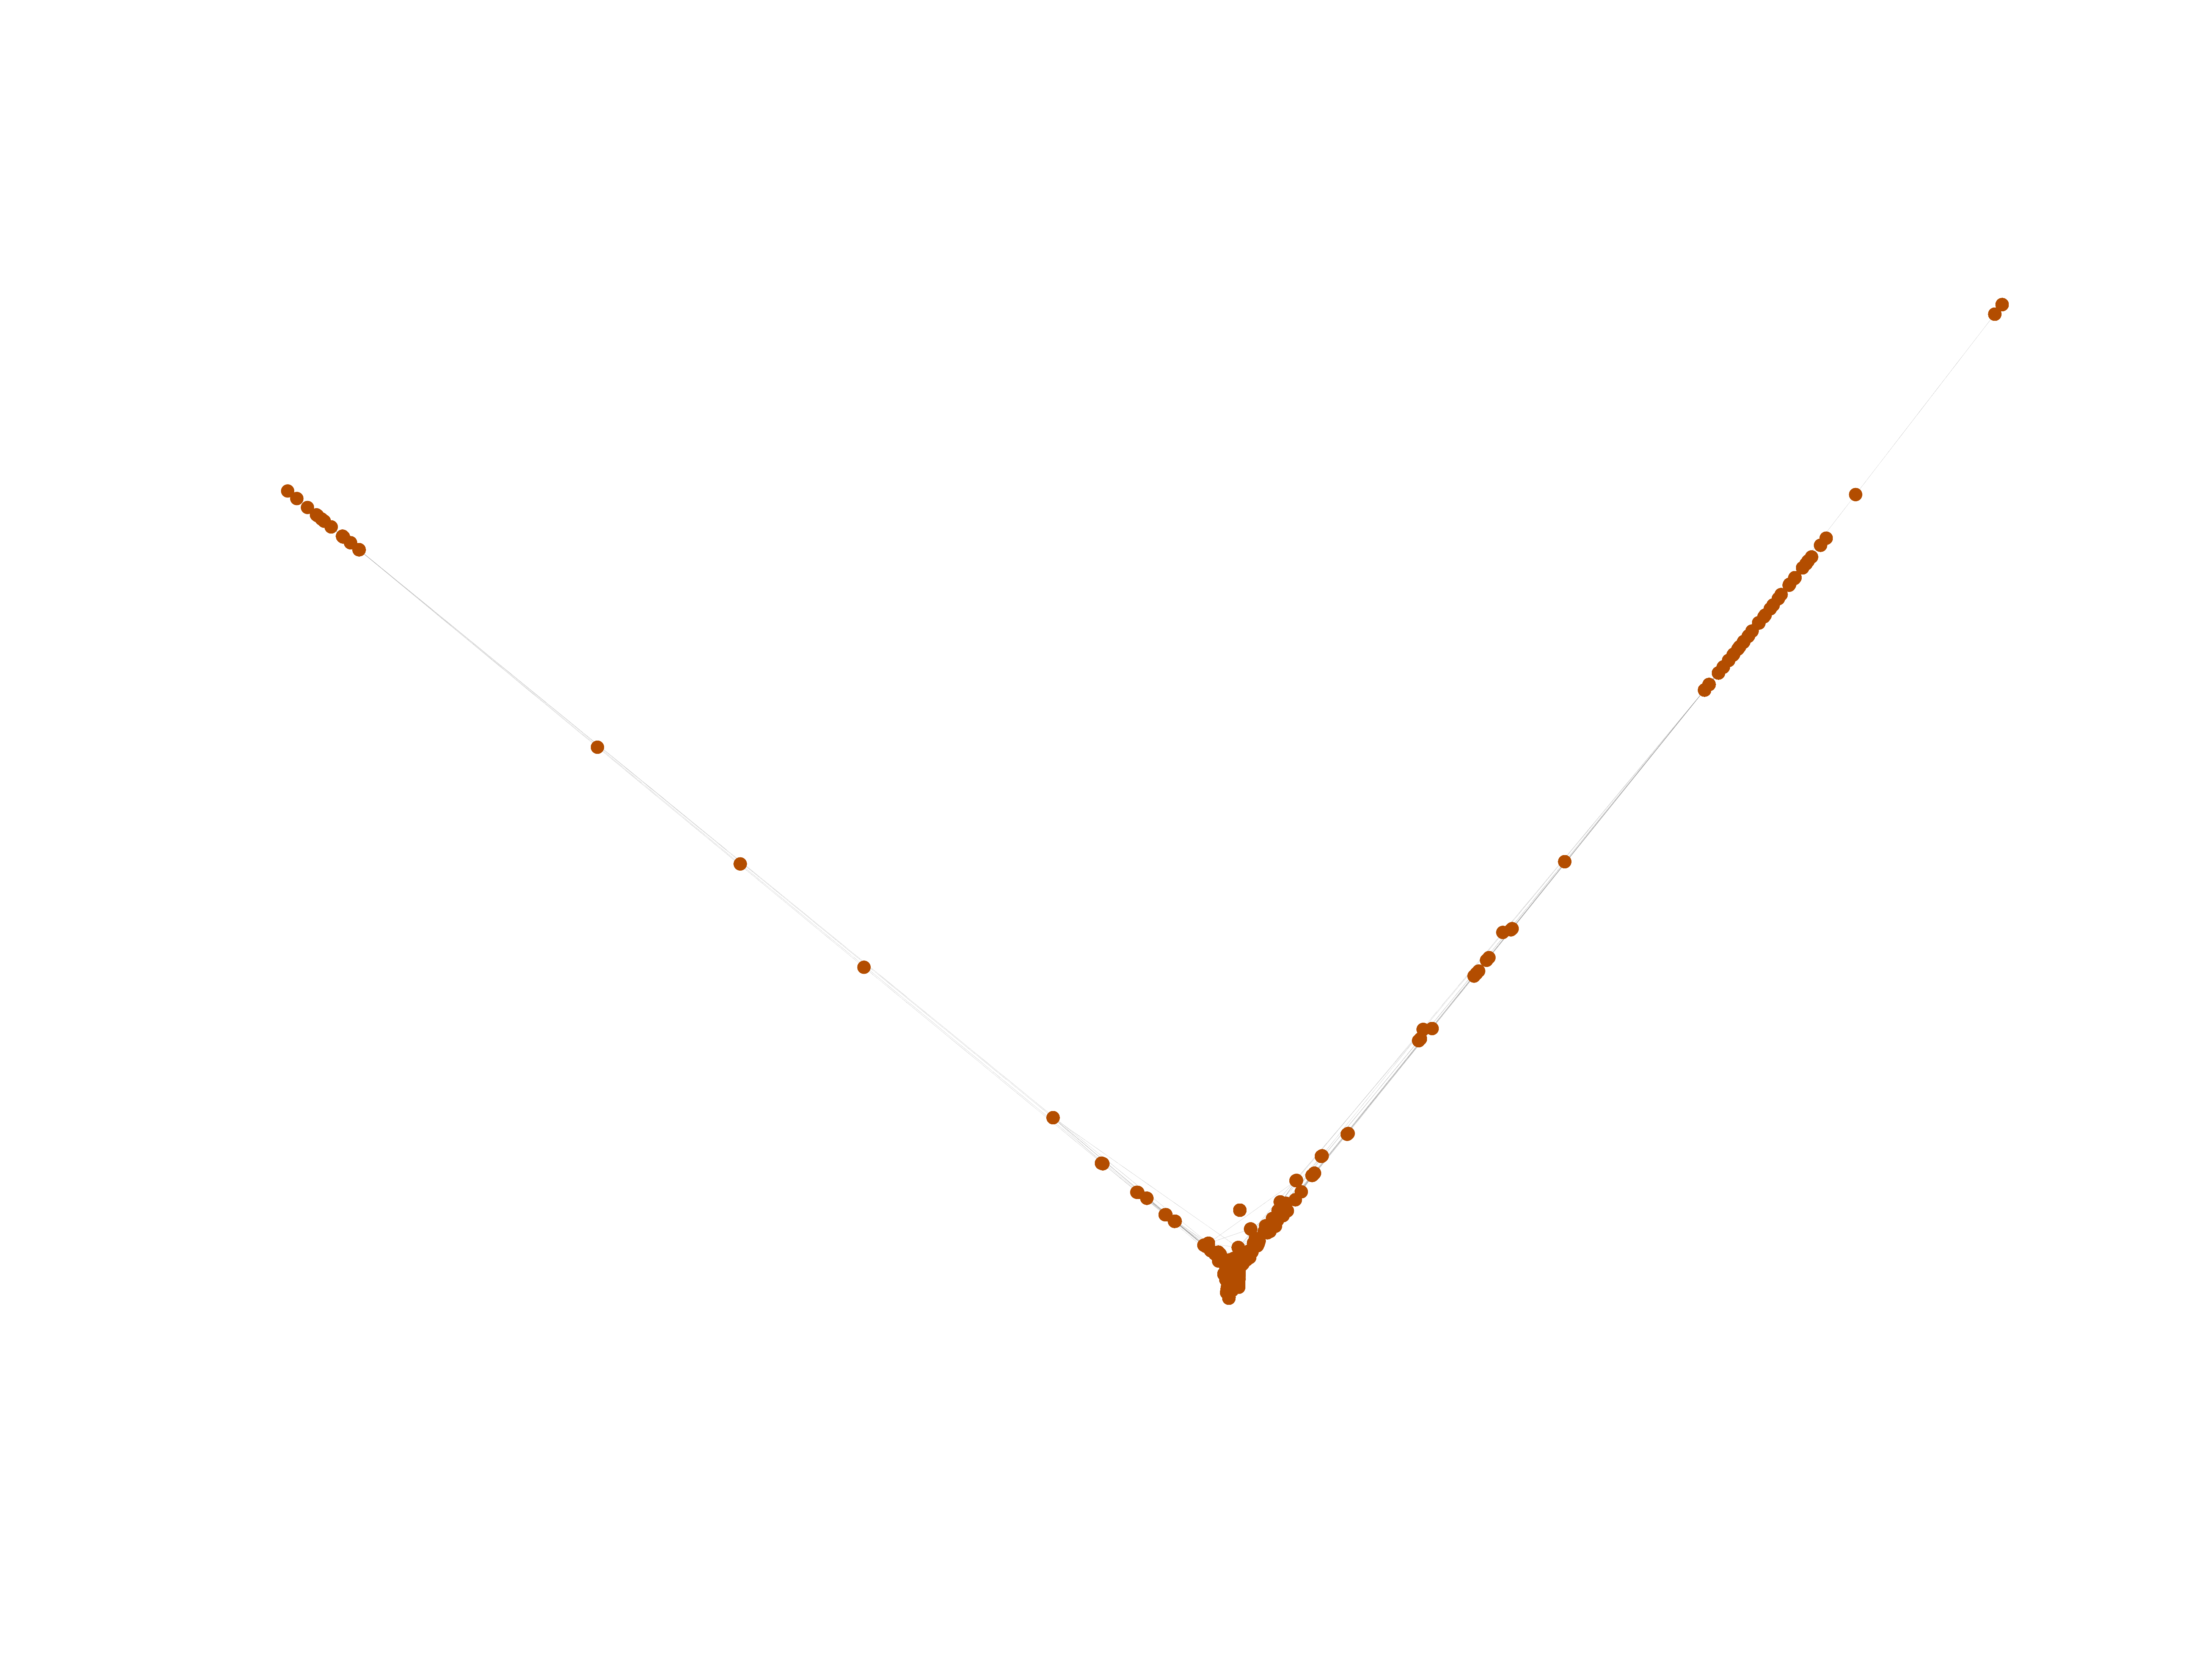
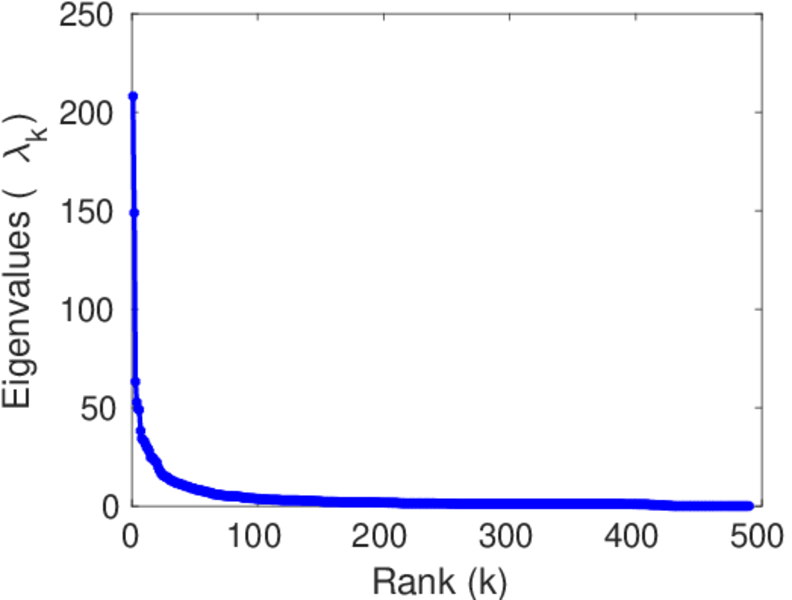
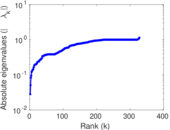
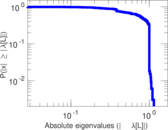
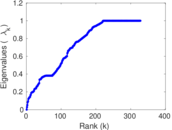
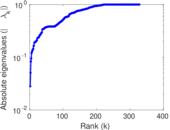
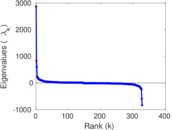
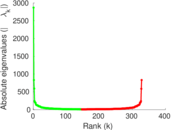
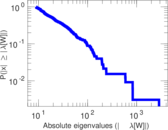
| Spectral norm | α = | 208.036
|
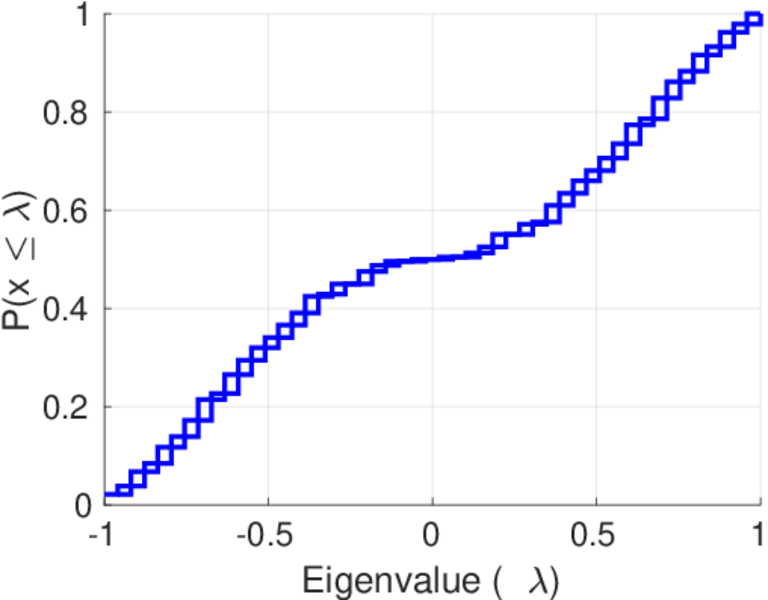
| Algebraic connectivity | a = | 0.028 020 1
|
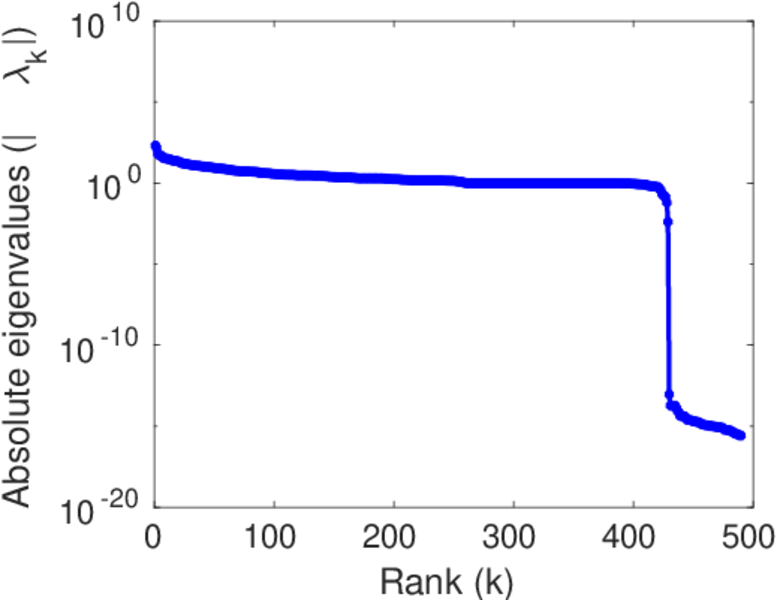
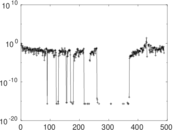
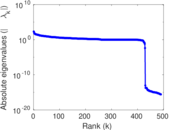
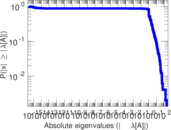
| Spectral separation | |λ1[A] / λ2[A]| = | 1.397 43
|
| Controllability | C = | 2,016
|
| Relative controllability | Cr = | 0.701 950
|
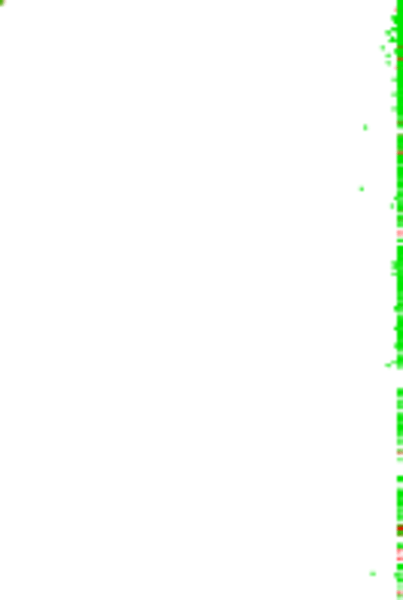
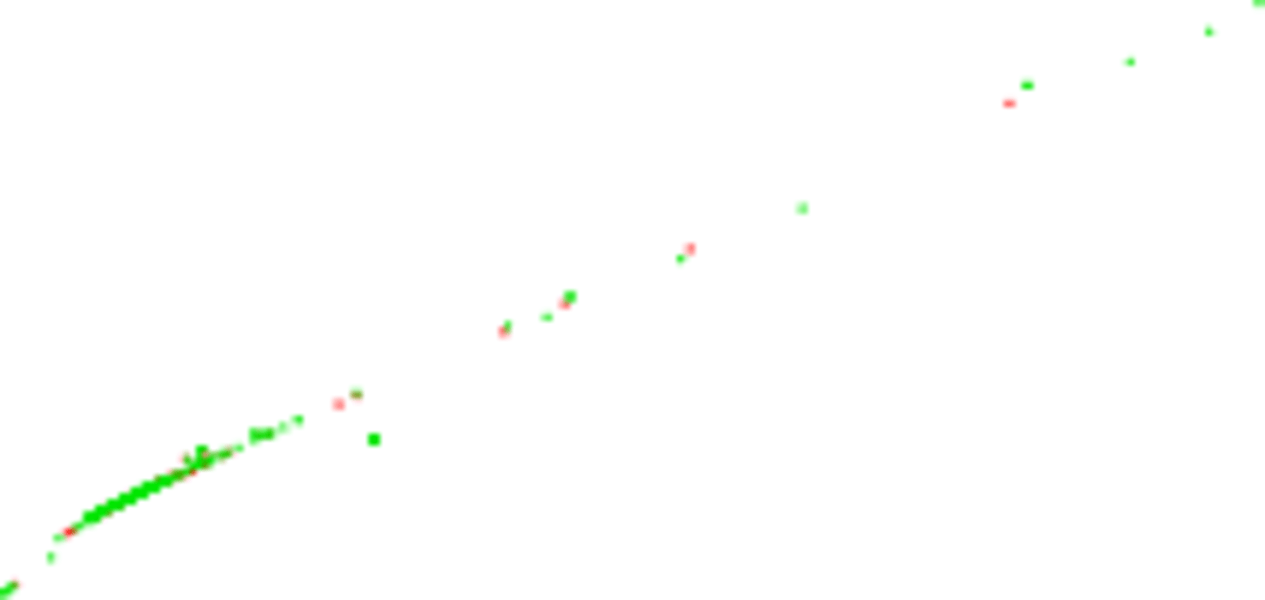
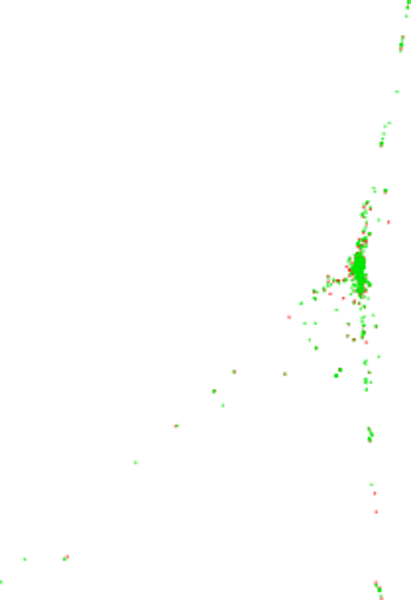
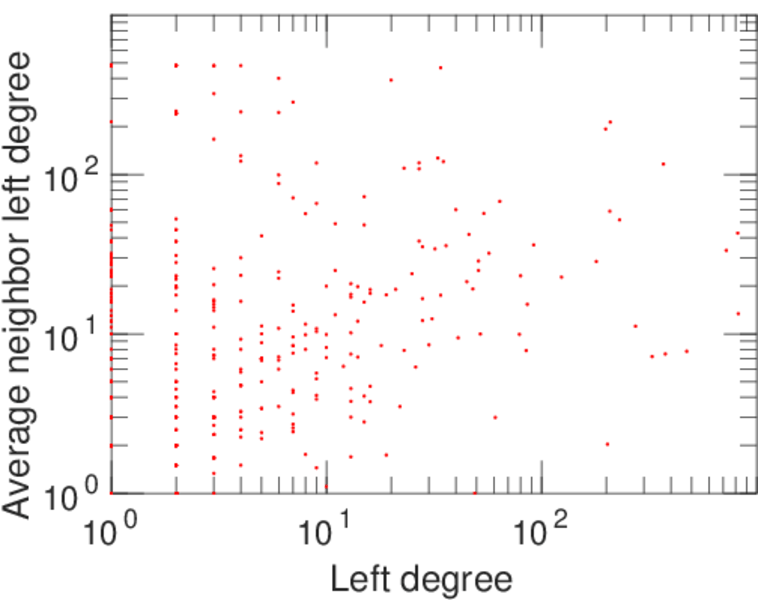
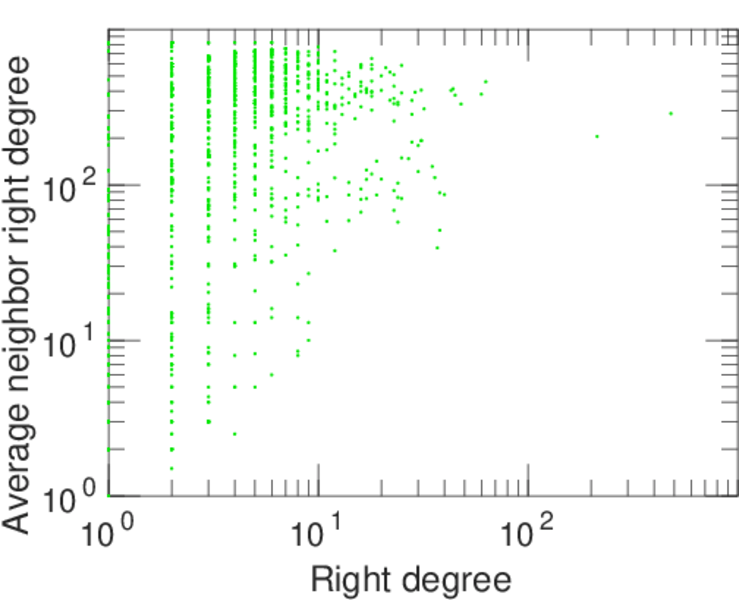
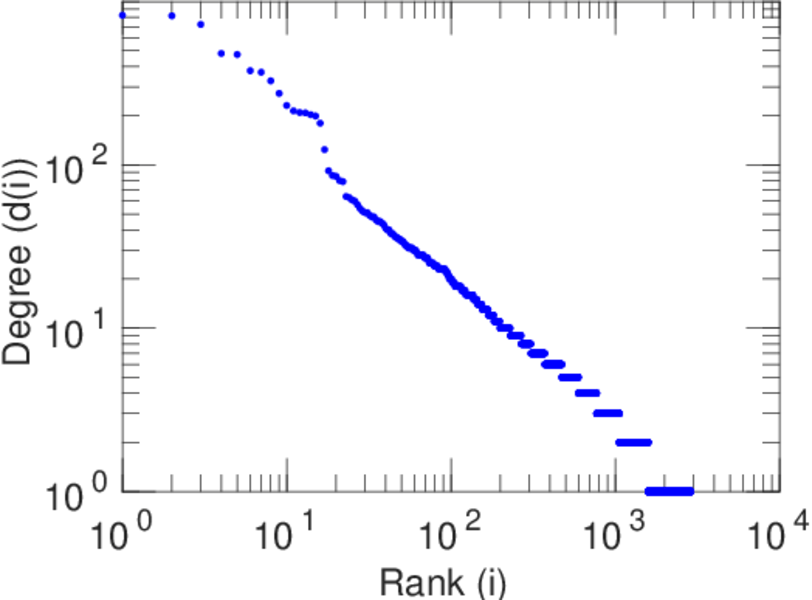
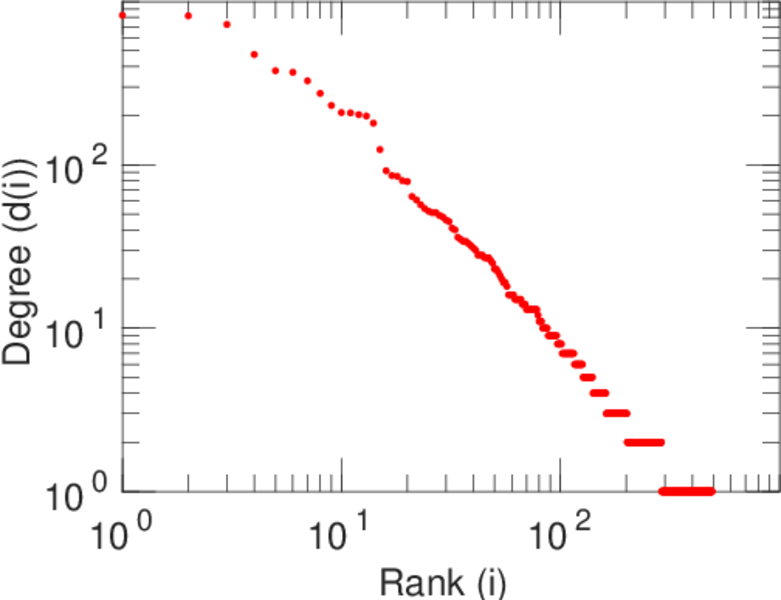
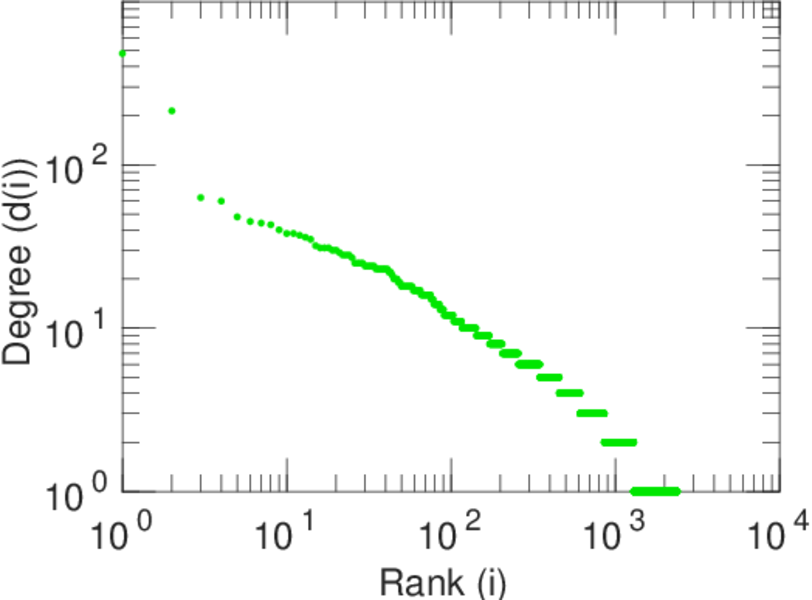
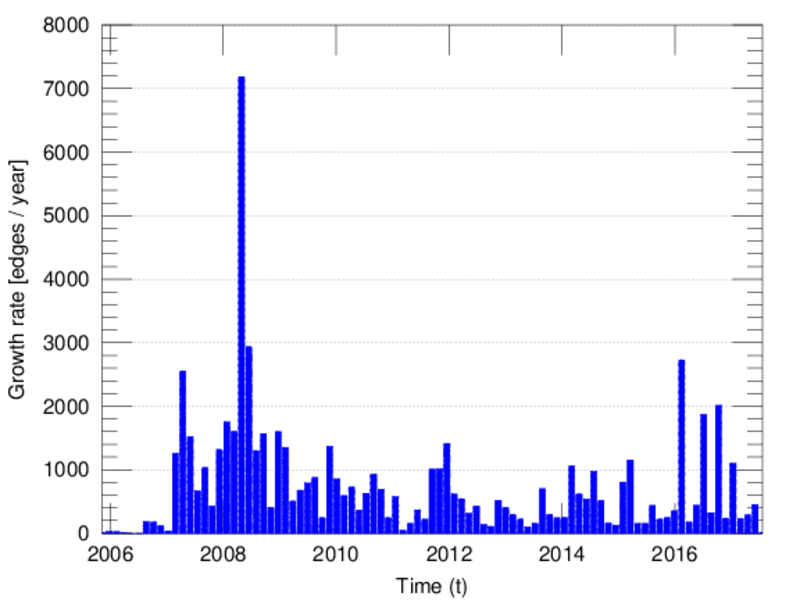
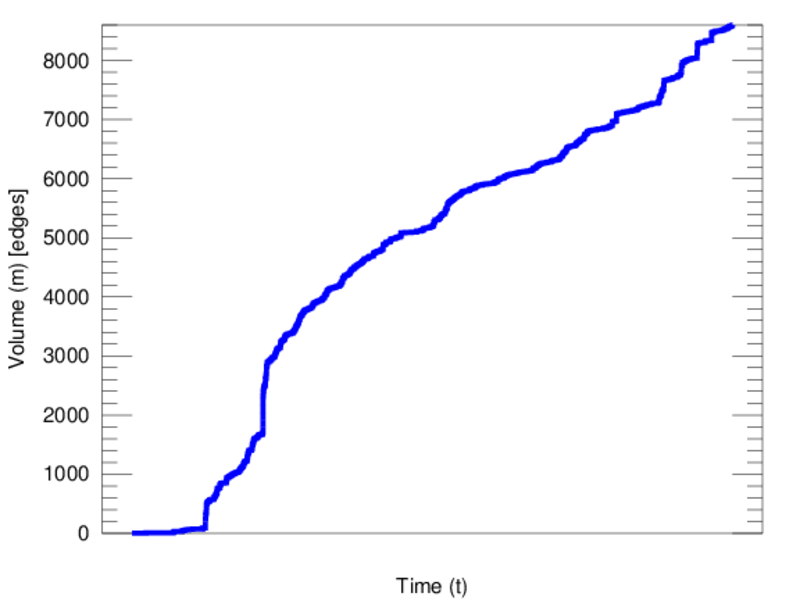
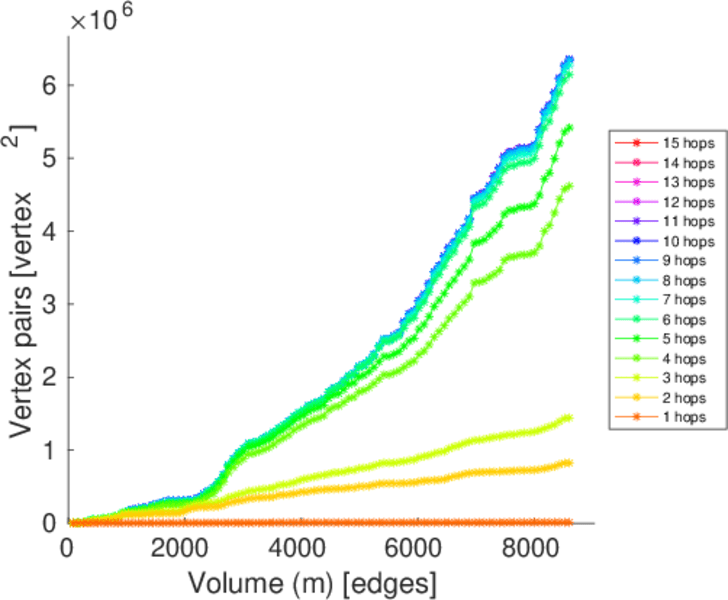
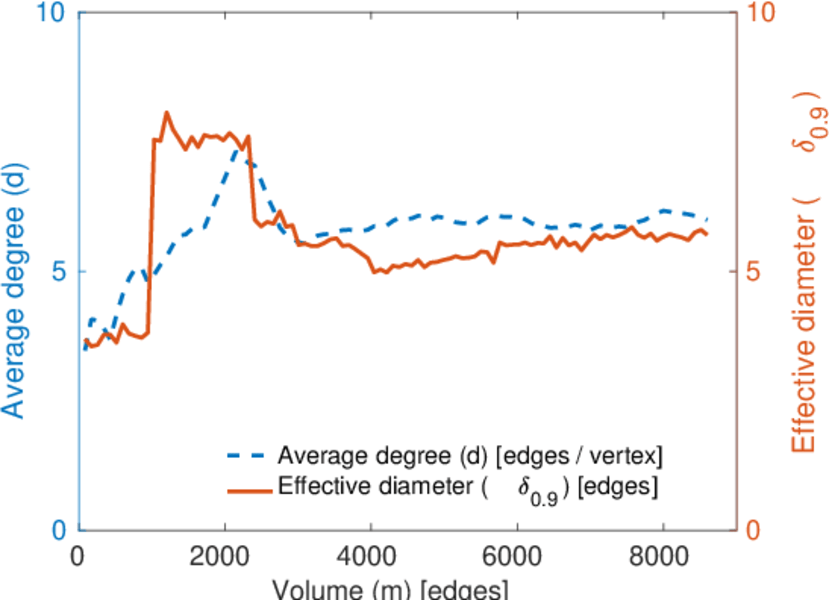
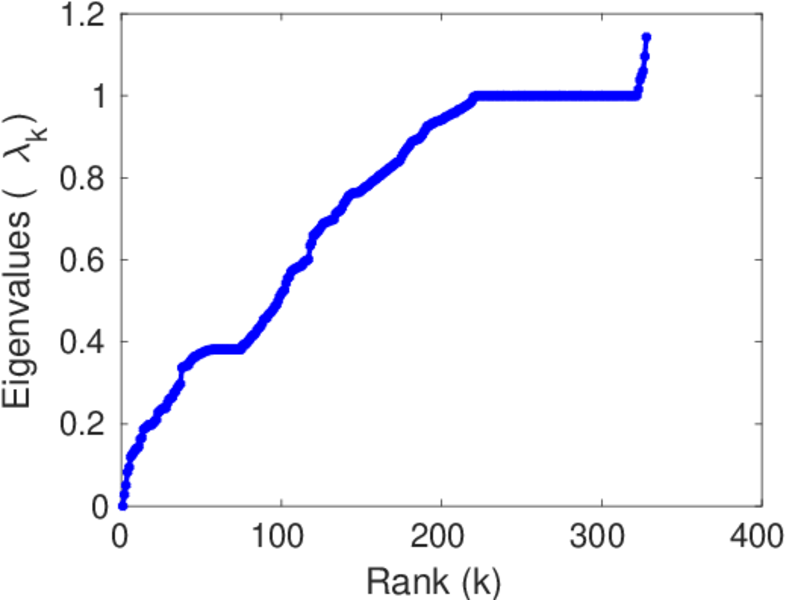
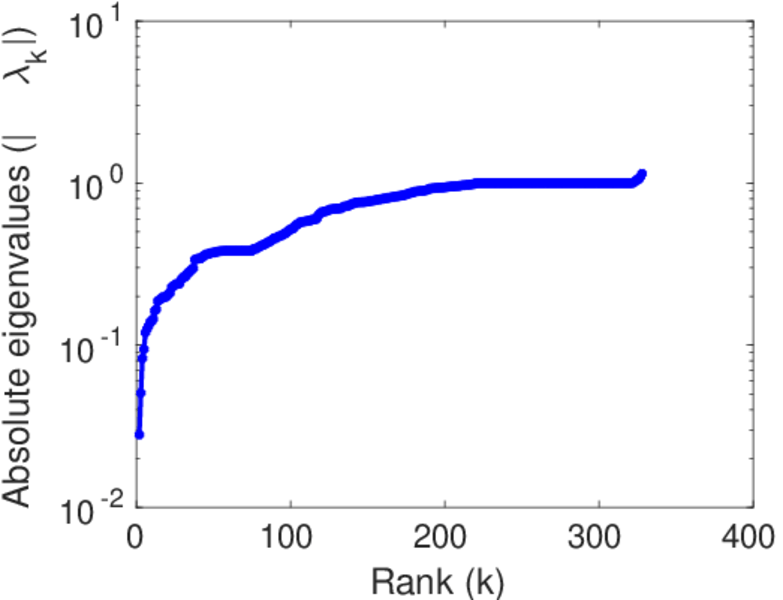
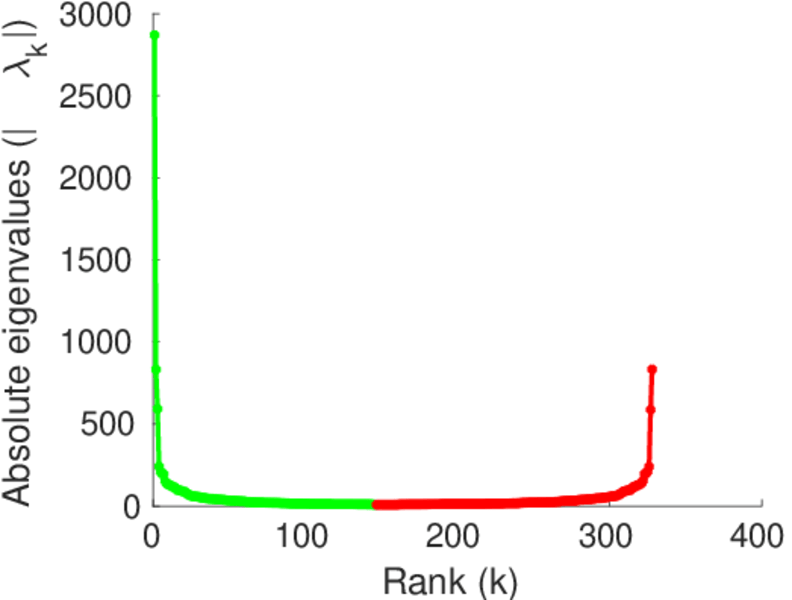
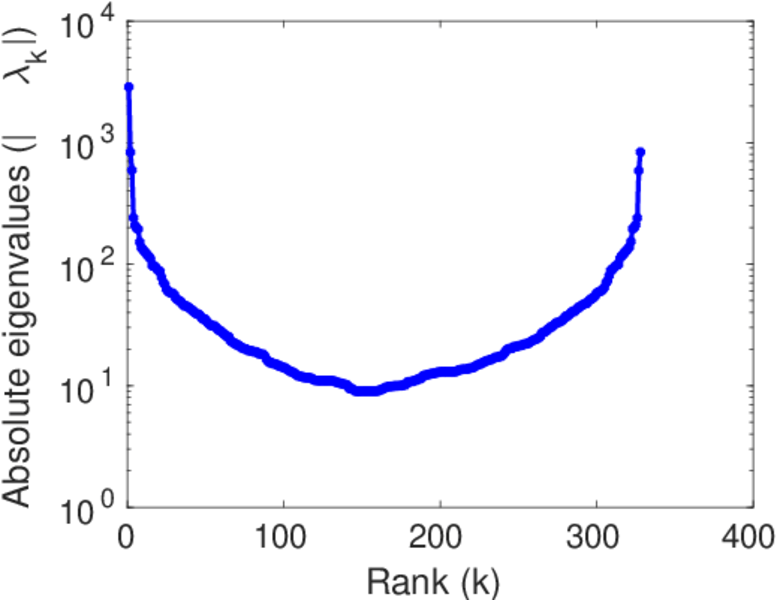
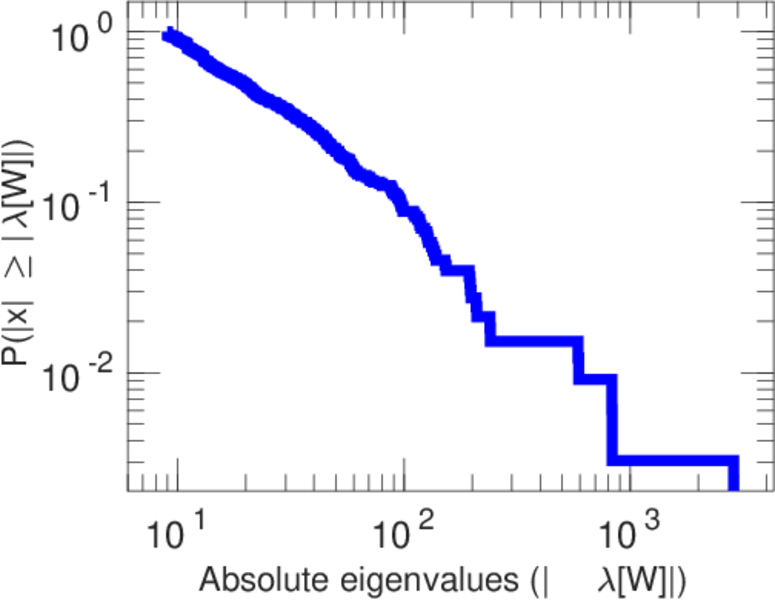
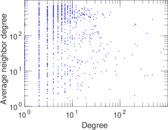
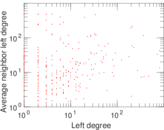
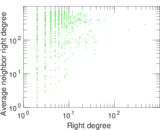
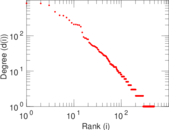
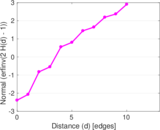
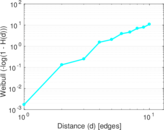
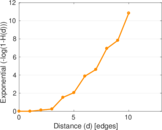
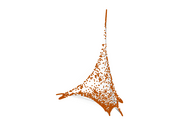
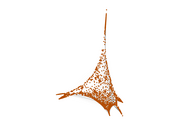
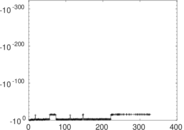
Plots


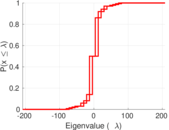
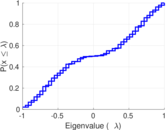
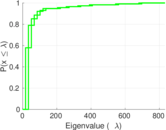


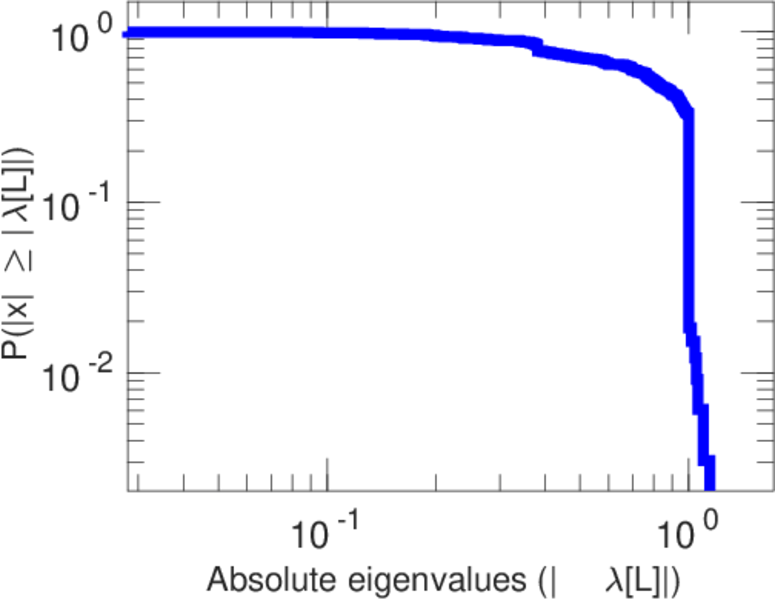
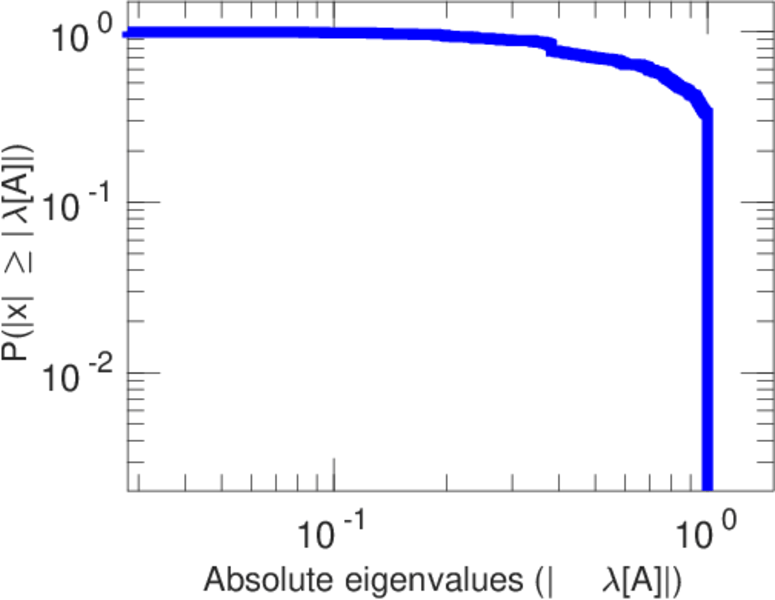
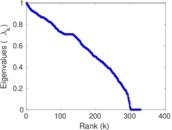
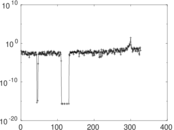
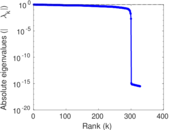
Matrix decompositions plots


Downloads
References
|
[1]
|
Jérôme Kunegis.
KONECT – The Koblenz Network Collection.
In Proc. Int. Conf. on World Wide Web Companion, pages
1343–1350, 2013.
[ http ]
|
|
[2]
|
Wikimedia Foundation.
Wikimedia downloads.
http://dumps.wikimedia.org/, January 2010.
|
 KONECT ‣ Networks ‣
Buy Me a Coffee
KONECT ‣ Networks ‣
Buy Me a Coffee