Wikipedia edits (jbo)
This is the bipartite edit network of the Lojban Wikipedia. It contains users
and pages from the Lojban Wikipedia, connected by edit events. Each edge
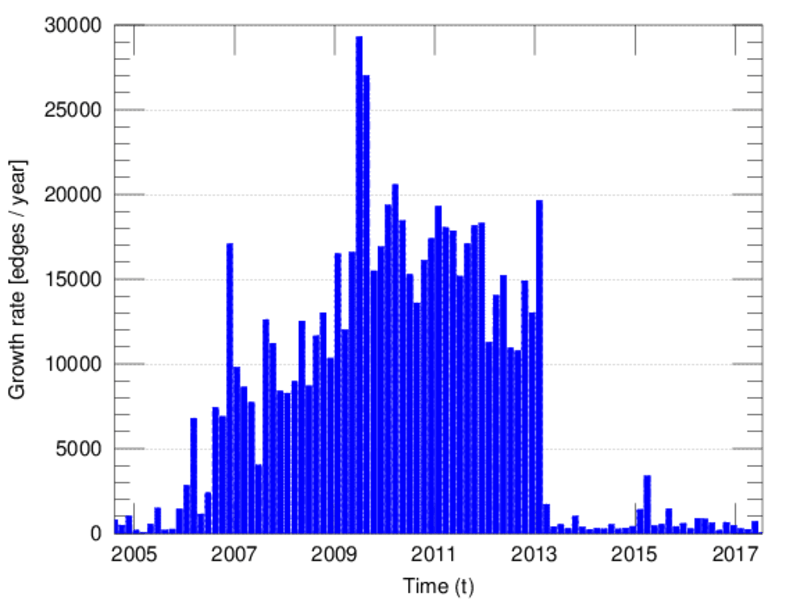
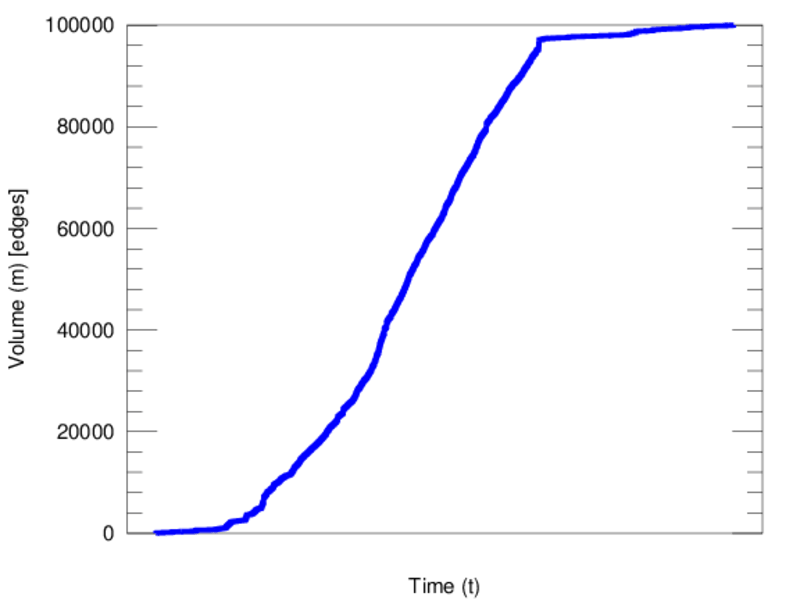
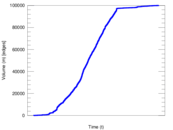
represents an edit. The dataset includes the timestamp of each edit.
Metadata
Statistics
| Size | n = | 6,365
|
| Left size | n1 = | 908
|
| Right size | n2 = | 5,457
|
| Volume | m = | 100,039
|
| Unique edge count | m̿ = | 44,485
|
| Wedge count | s = | 15,562,394
|
| Claw count | z = | 4,897,746,065
|
| Cross count | x = | 1,376,477,438,949
|
| Square count | q = | 77,287,790
|
| 4-Tour count | T4 = | 680,663,374
|
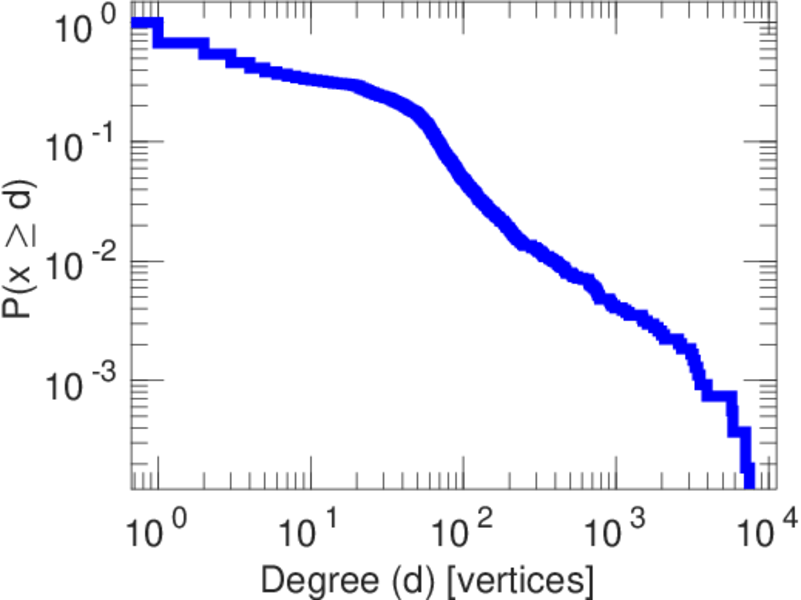
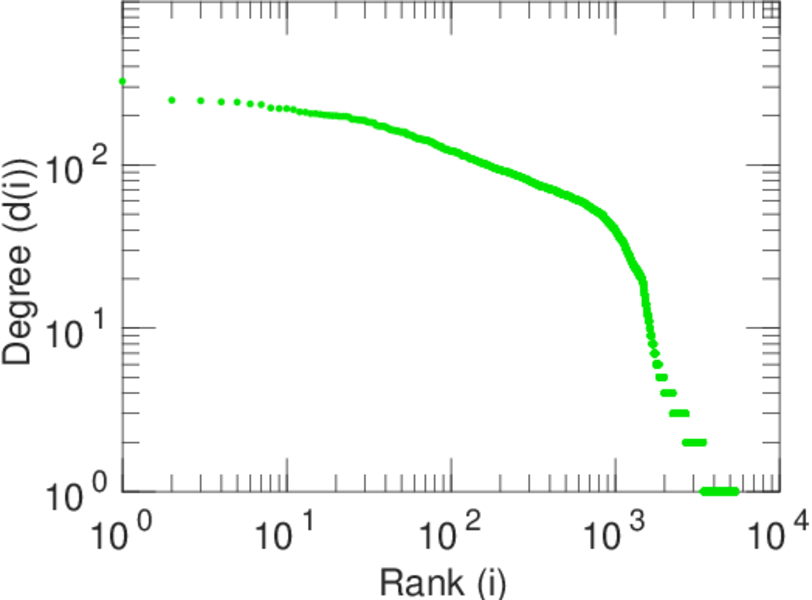
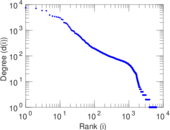
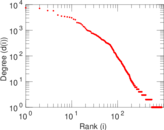
| Maximum degree | dmax = | 7,477
|
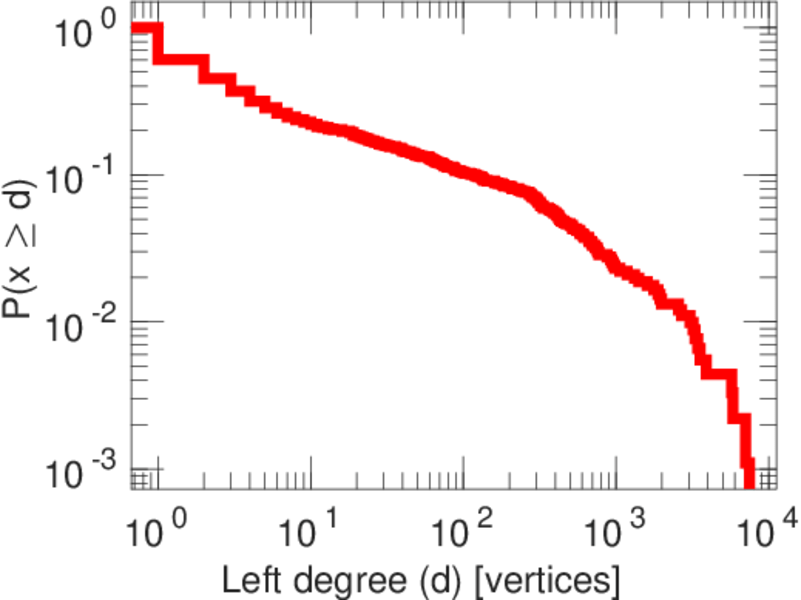
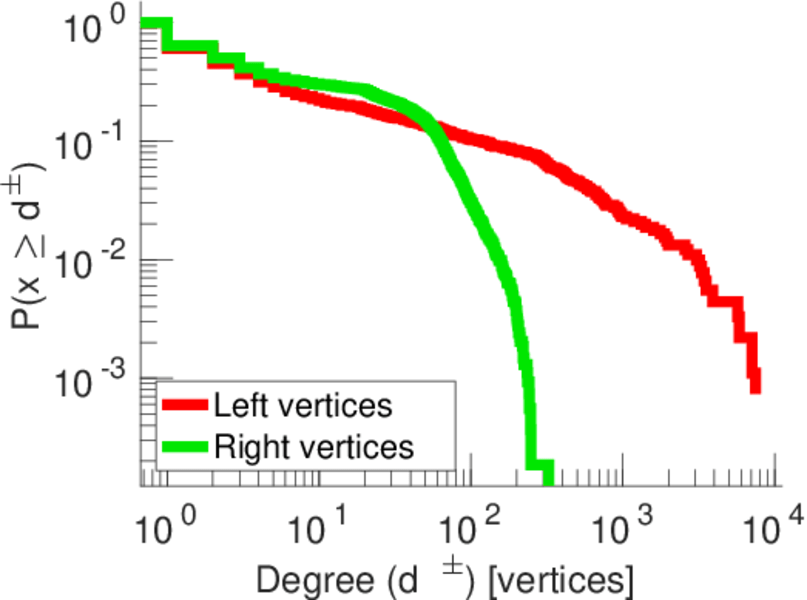
| Maximum left degree | d1max = | 7,477
|
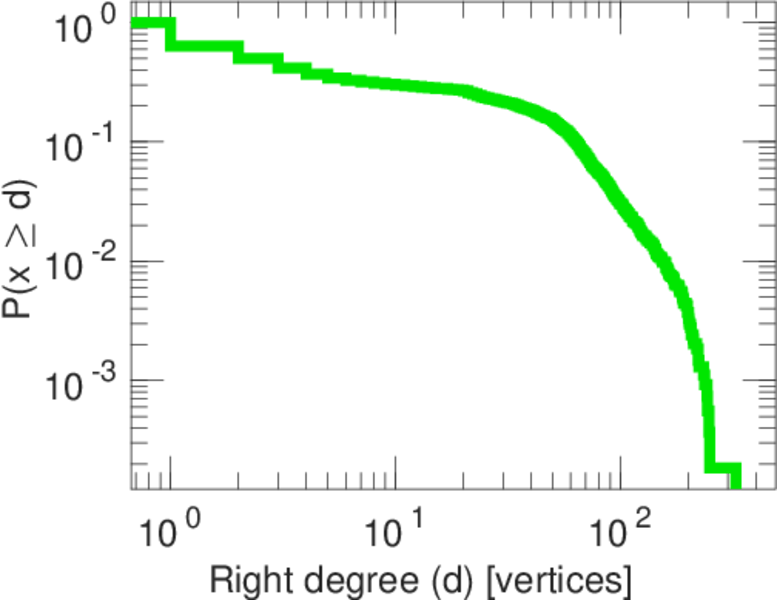
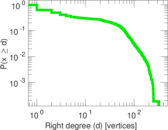
| Maximum right degree | d2max = | 325
|
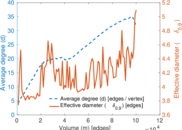
| Average degree | d = | 31.434 1
|
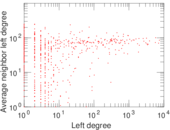
| Average left degree | d1 = | 110.175
|
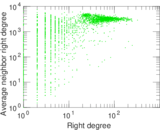
| Average right degree | d2 = | 18.332 2
|
| Fill | p = | 0.008 977 88
|
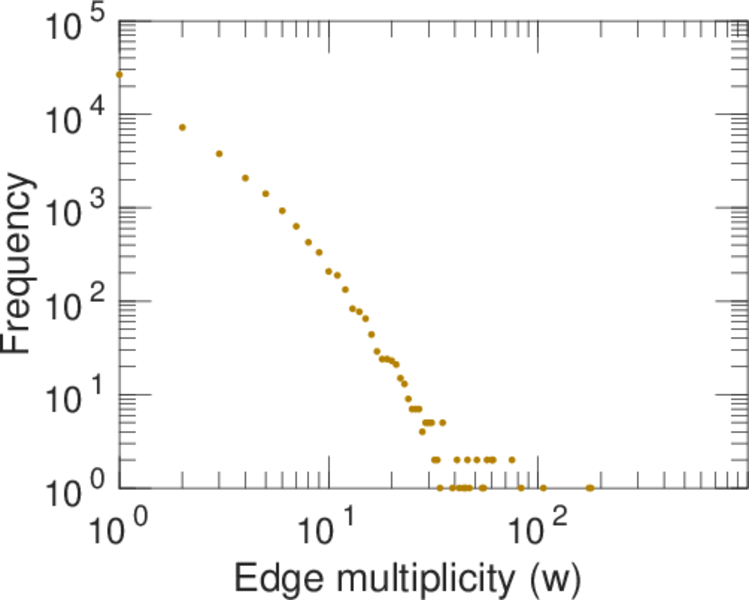
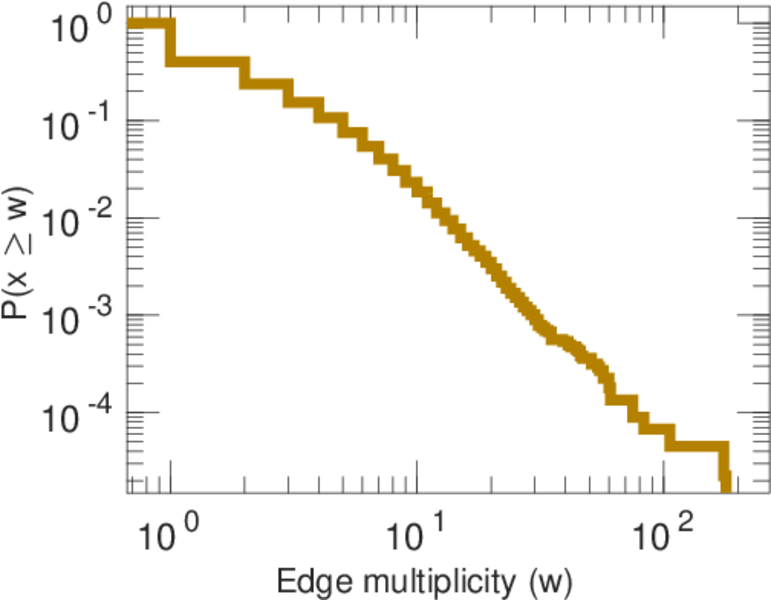
| Average edge multiplicity | m̃ = | 2.248 83
|
| Size of LCC | N = | 5,678
|
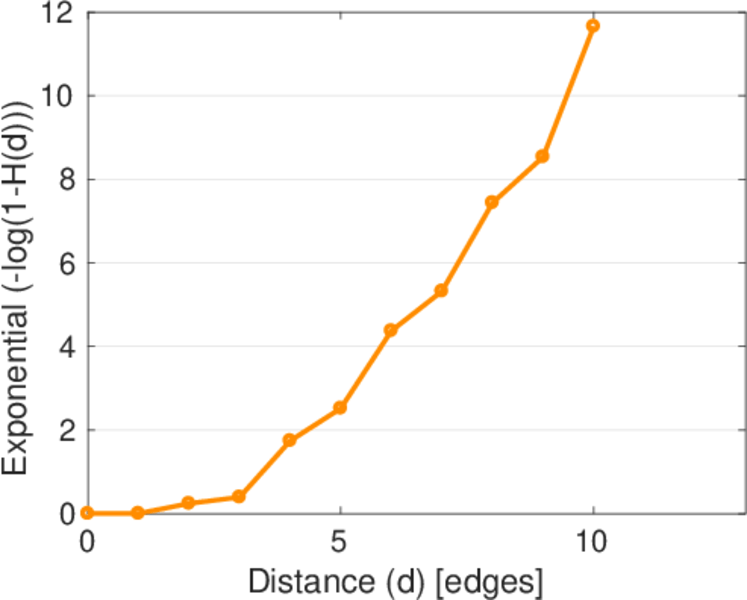
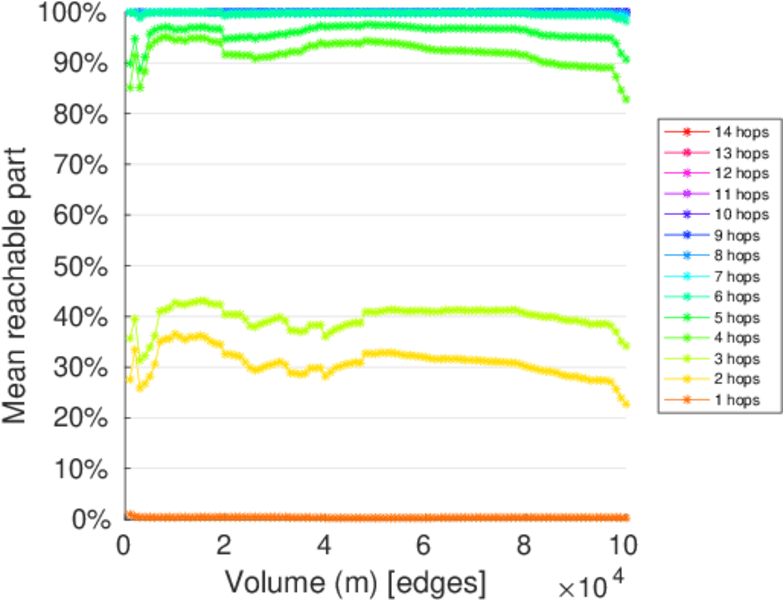
| Diameter | δ = | 13
|
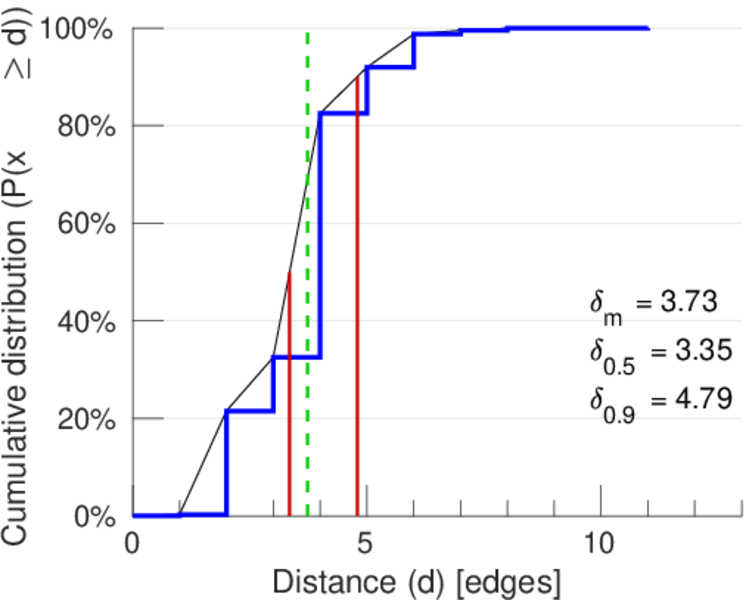
| 50-Percentile effective diameter | δ0.5 = | 3.350 18
|
| 90-Percentile effective diameter | δ0.9 = | 4.794 51
|
| Median distance | δM = | 4
|
| Mean distance | δm = | 3.731 01
|
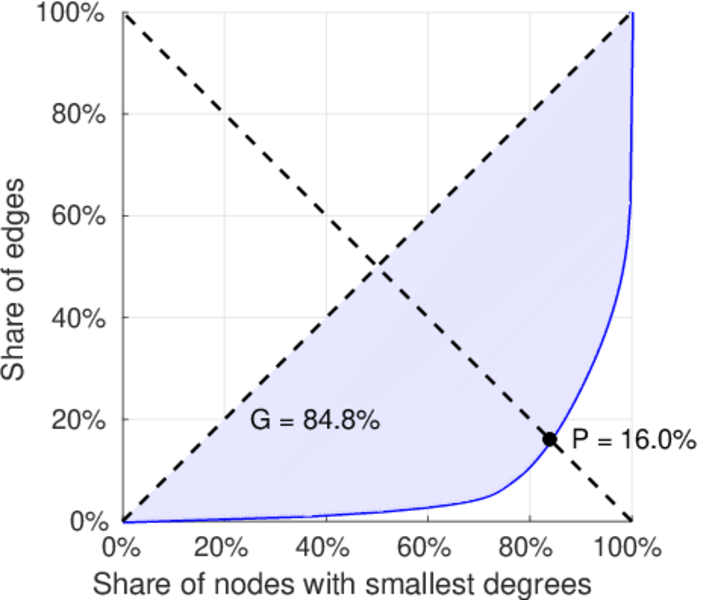
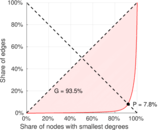
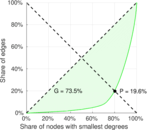
| Gini coefficient | G = | 0.839 313
|
| Balanced inequality ratio | P = | 0.167 870
|
| Left balanced inequality ratio | P1 = | 0.078 279 5
|
| Right balanced inequality ratio | P2 = | 0.195 744
|
| Relative edge distribution entropy | Her = | 0.789 222
|
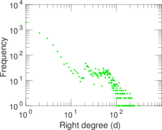
| Power law exponent | γ = | 1.866 34
|
| Tail power law exponent | γt = | 1.611 00
|
| Tail power law exponent with p | γ3 = | 1.611 00
|
| p-value | p = | 0.000 00
|
| Left tail power law exponent with p | γ3,1 = | 1.581 00
|
| Left p-value | p1 = | 0.000 00
|
| Right tail power law exponent with p | γ3,2 = | 6.001 00
|
| Right p-value | p2 = | 0.072 000 0
|
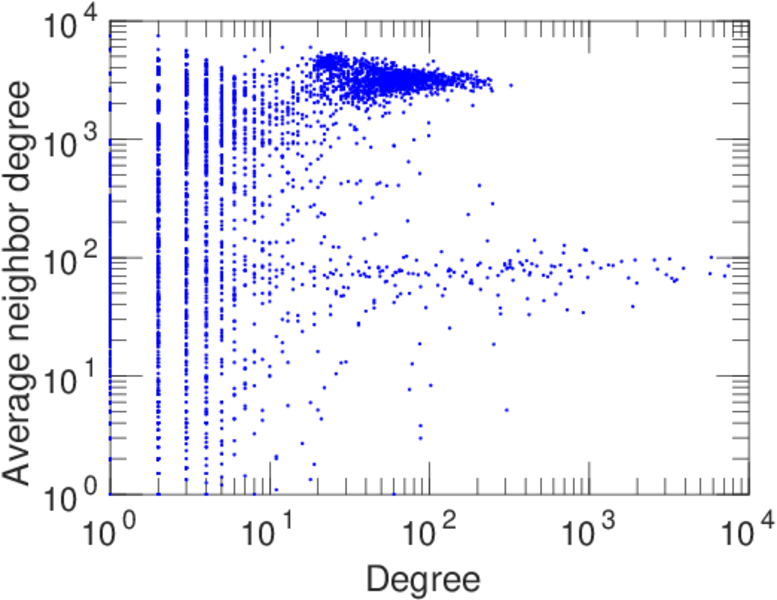
| Degree assortativity | ρ = | −0.051 786 4
|
| Degree assortativity p-value | pρ = | 8.326 36 × 10−28
|
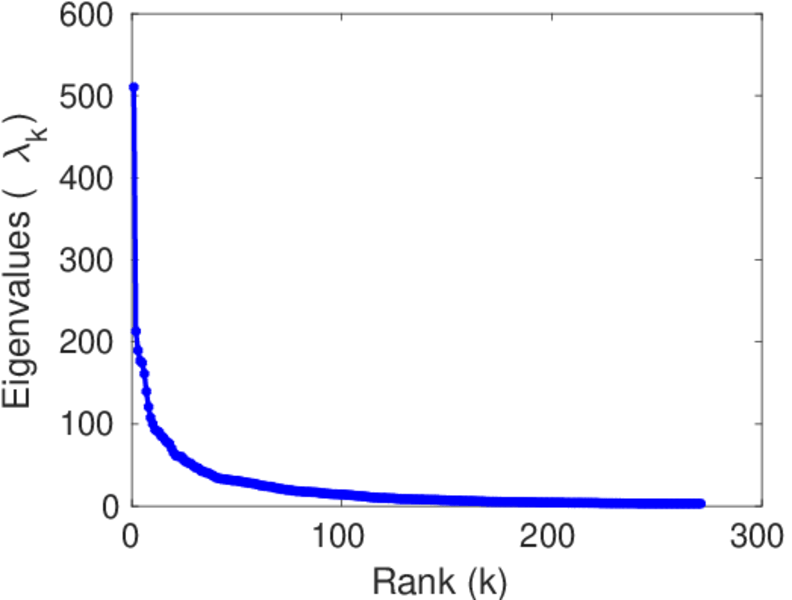
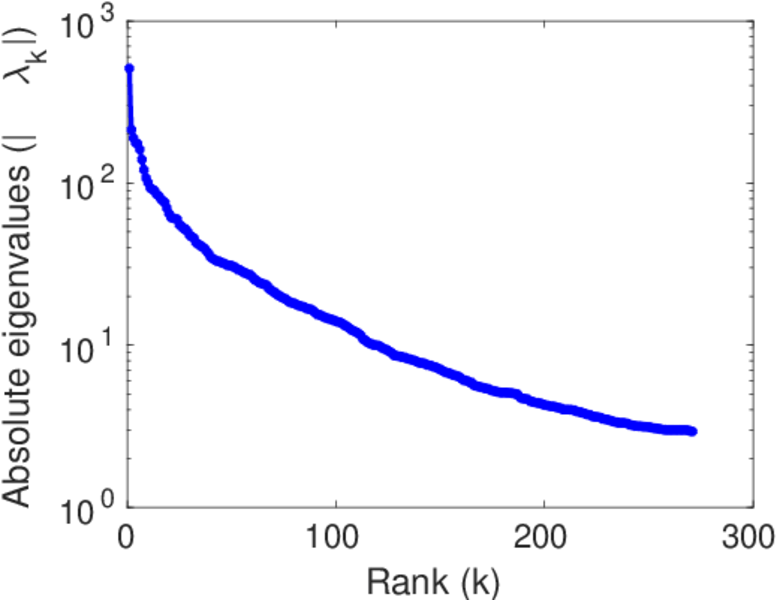
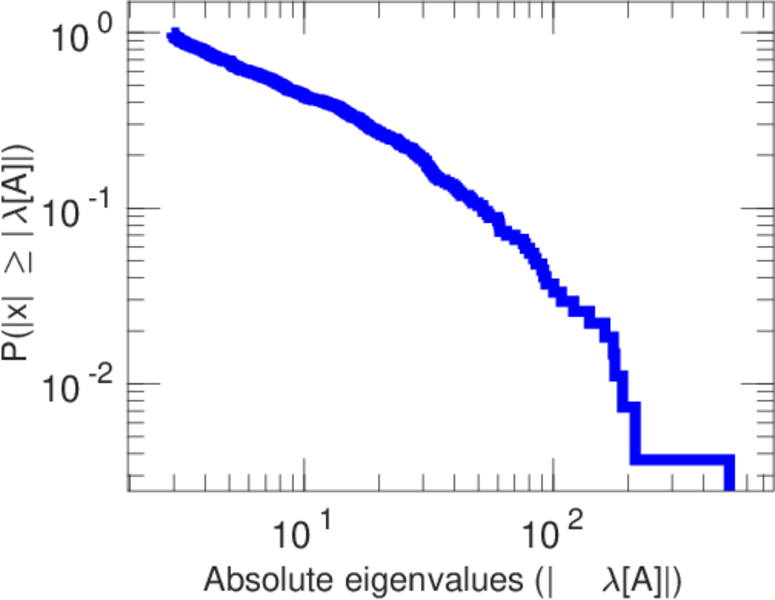
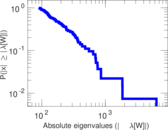
| Spectral norm | α = | 510.363
|
| Algebraic connectivity | a = | 0.042 258 8
|
| Spectral separation | |λ1[A] / λ2[A]| = | 2.394 81
|
| Controllability | C = | 4,574
|
| Relative controllability | Cr = | 0.725 571
|
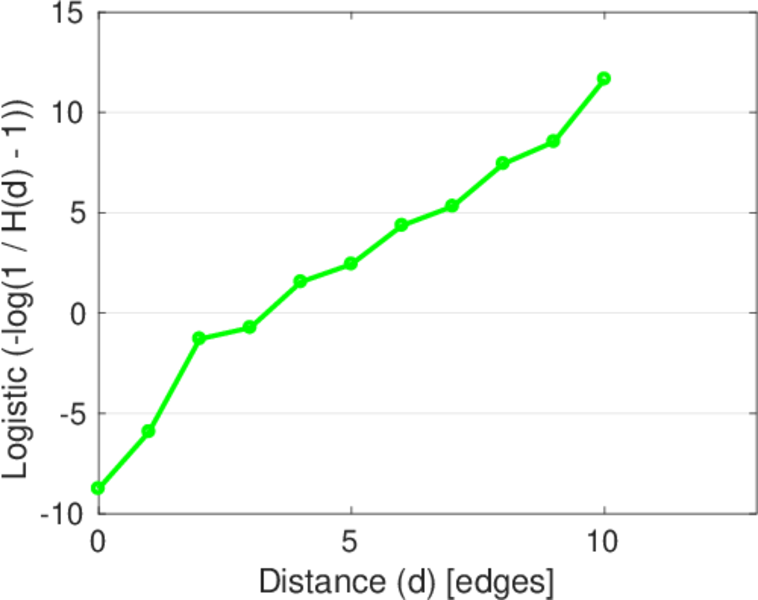
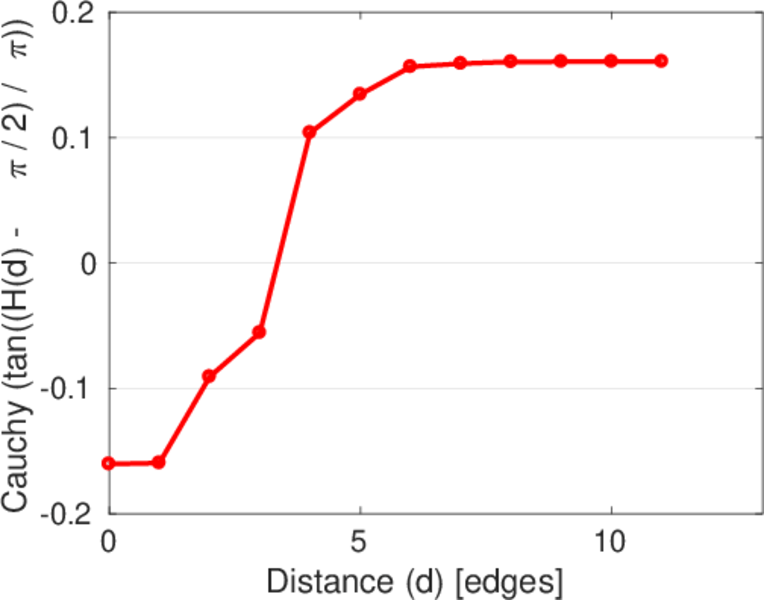
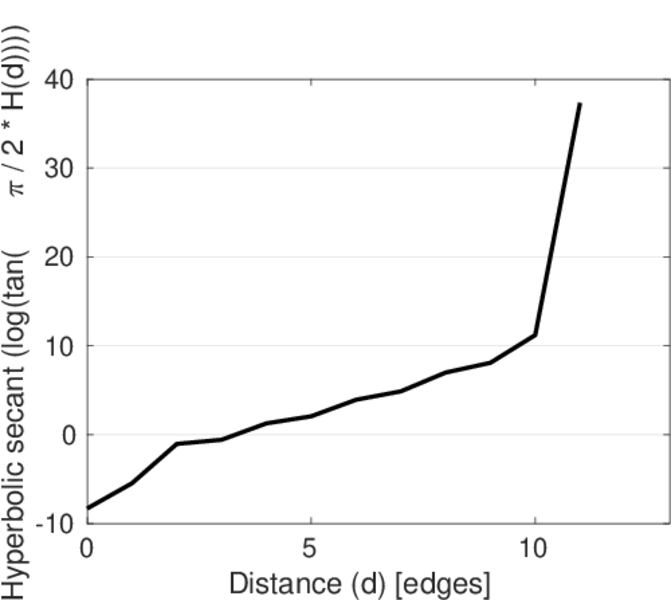
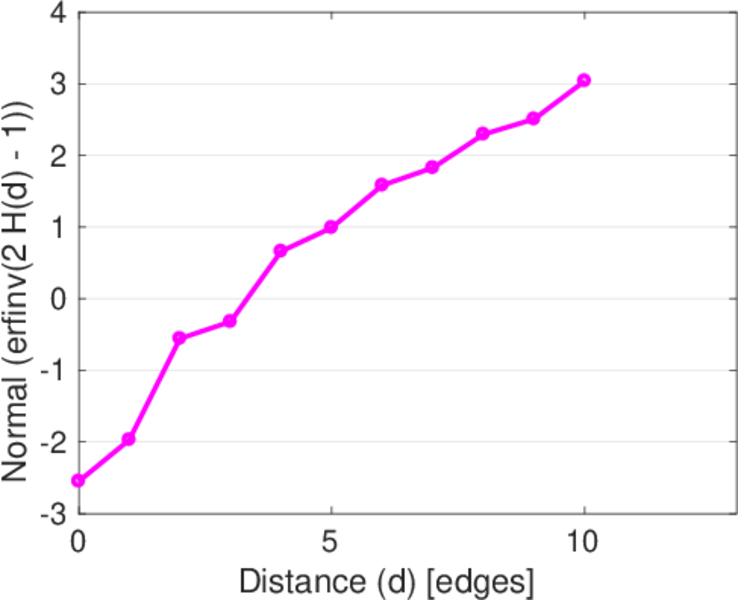
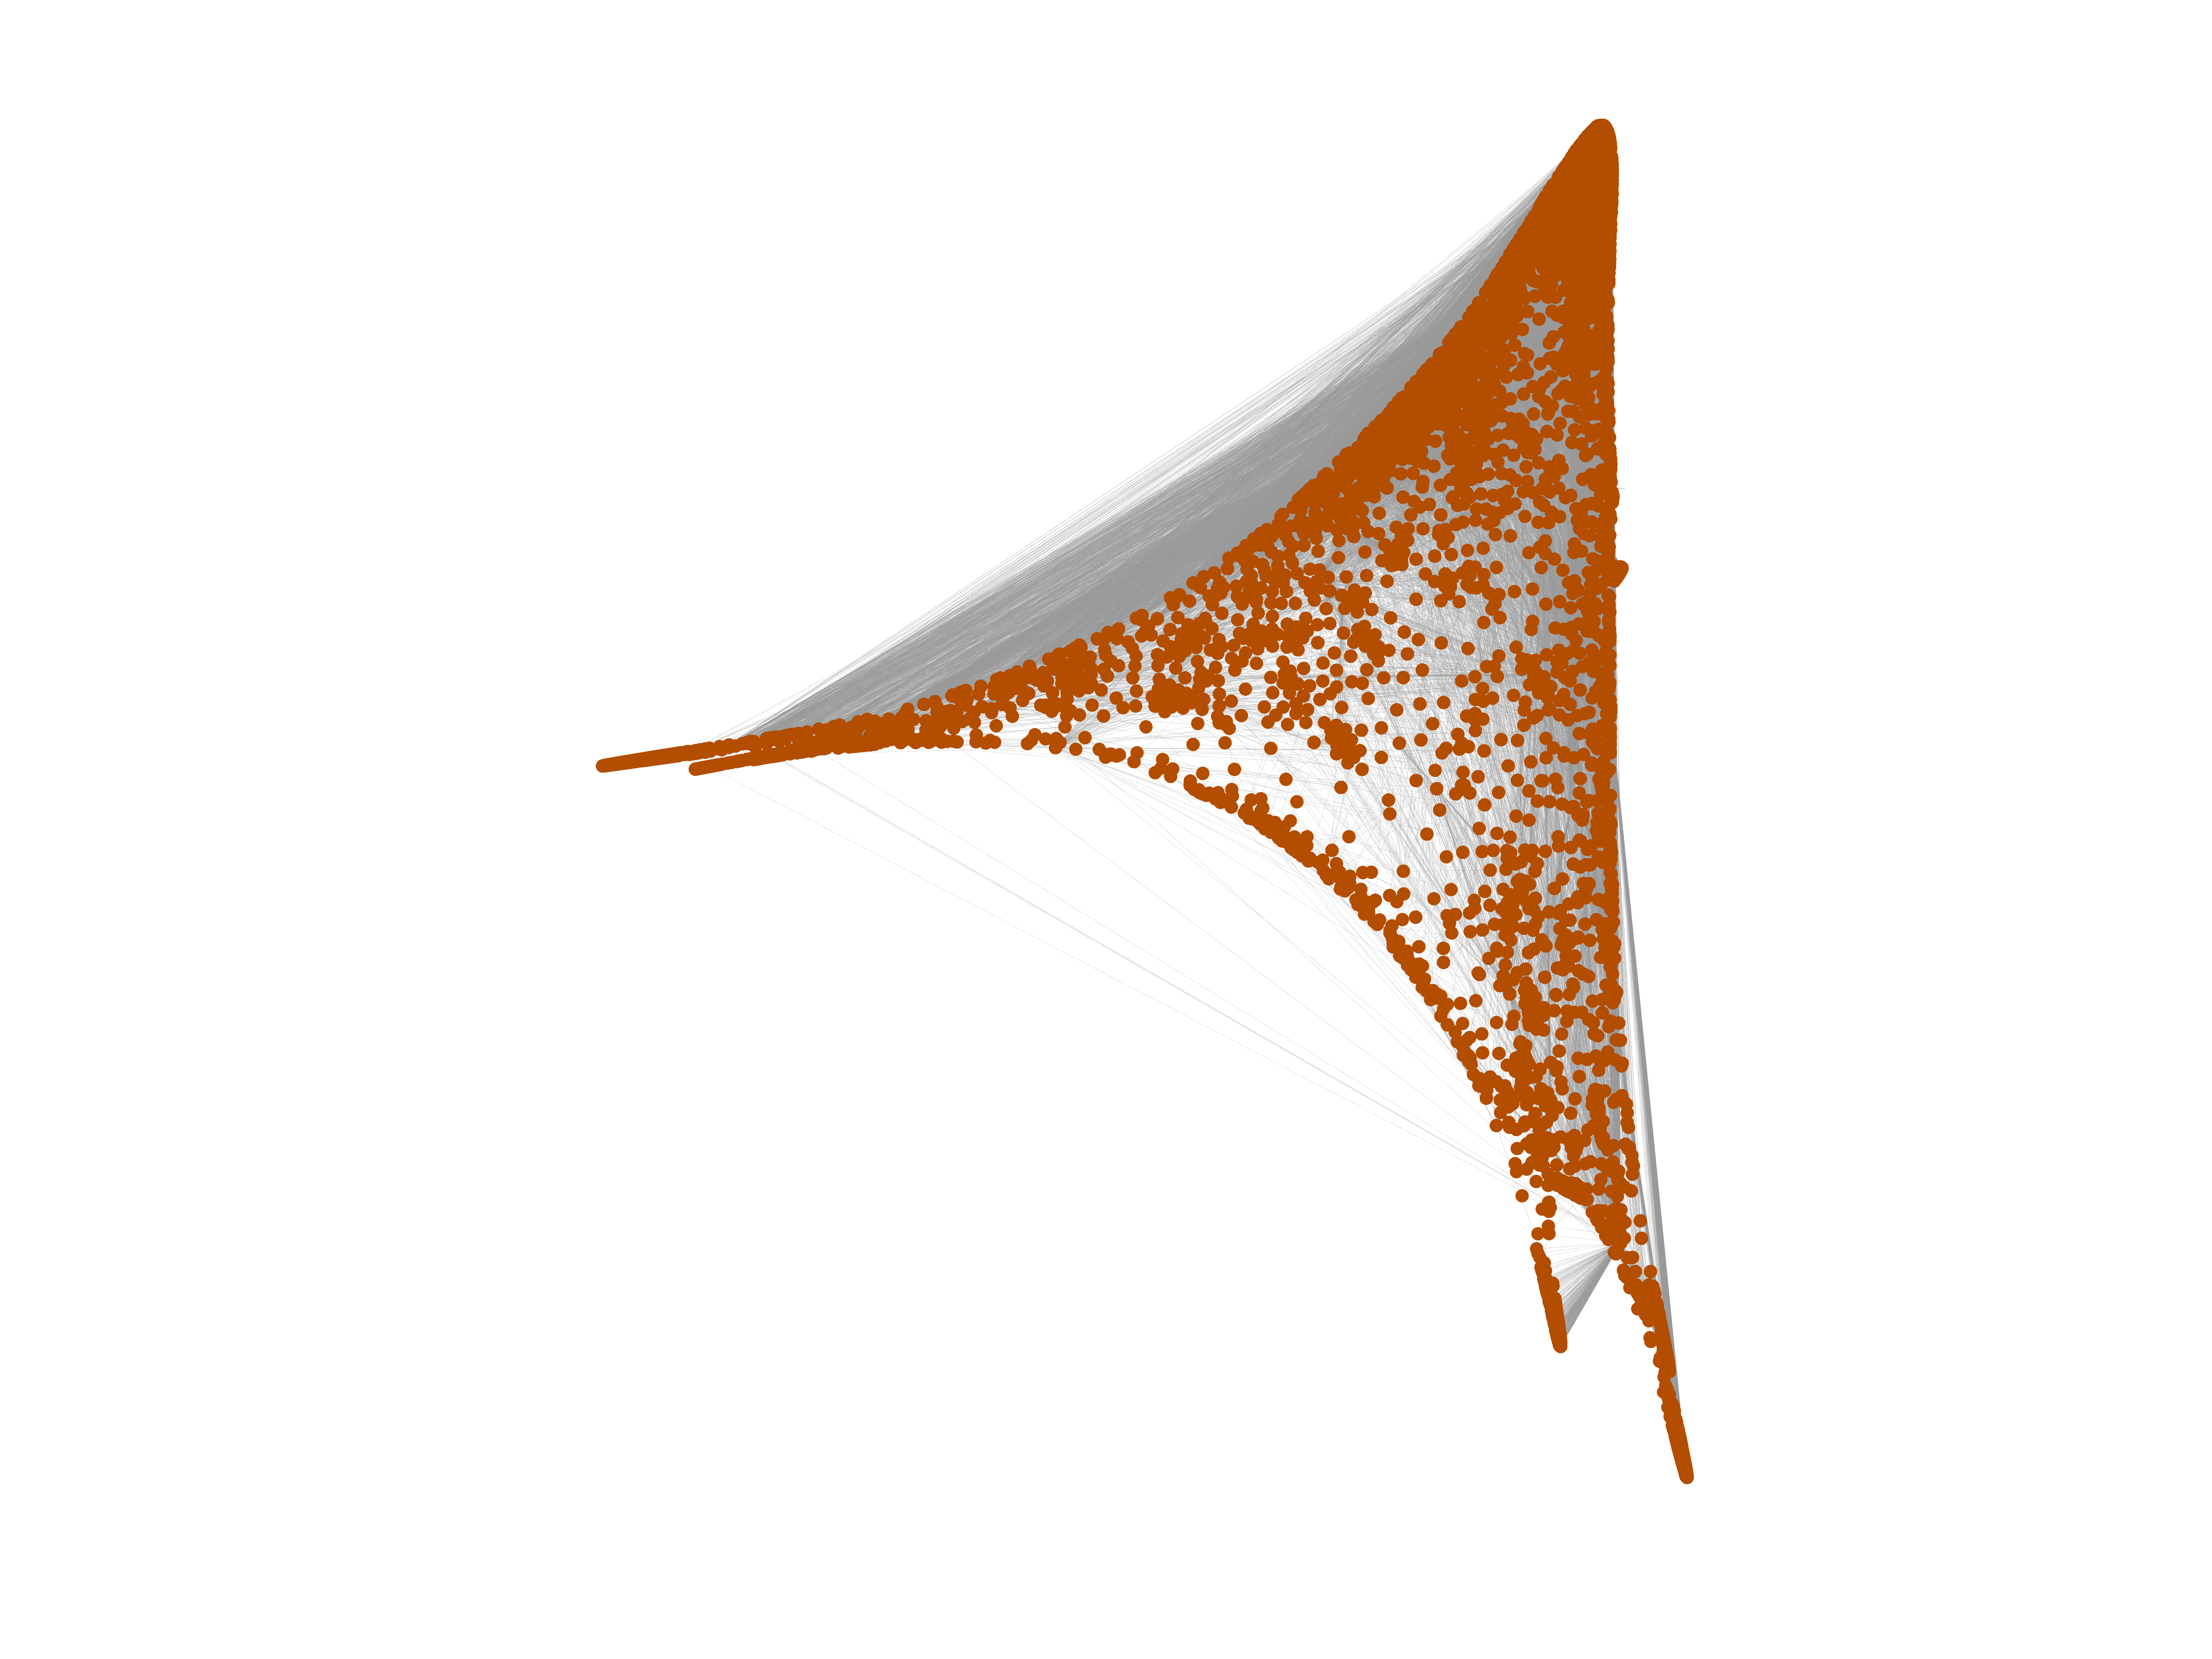
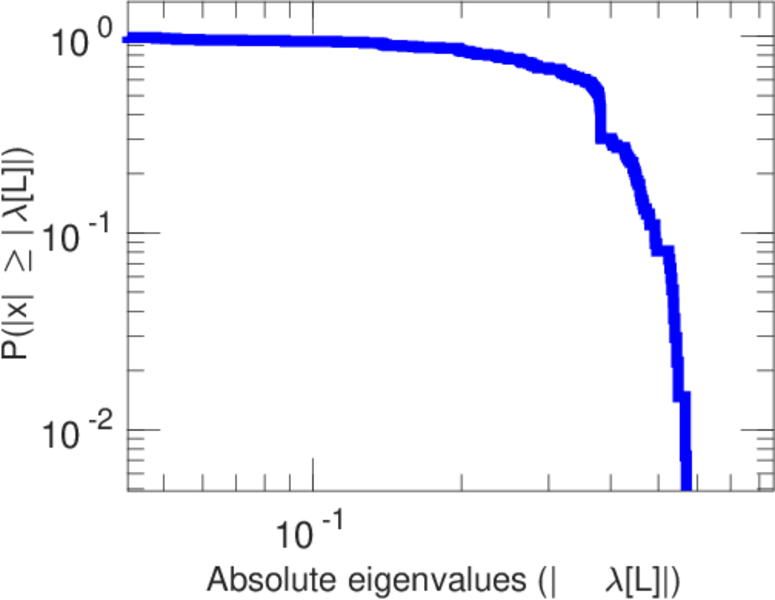
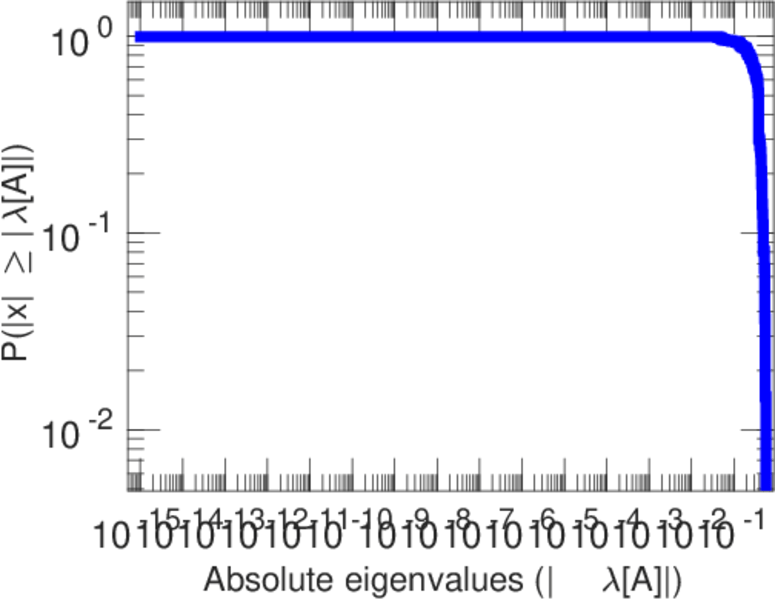
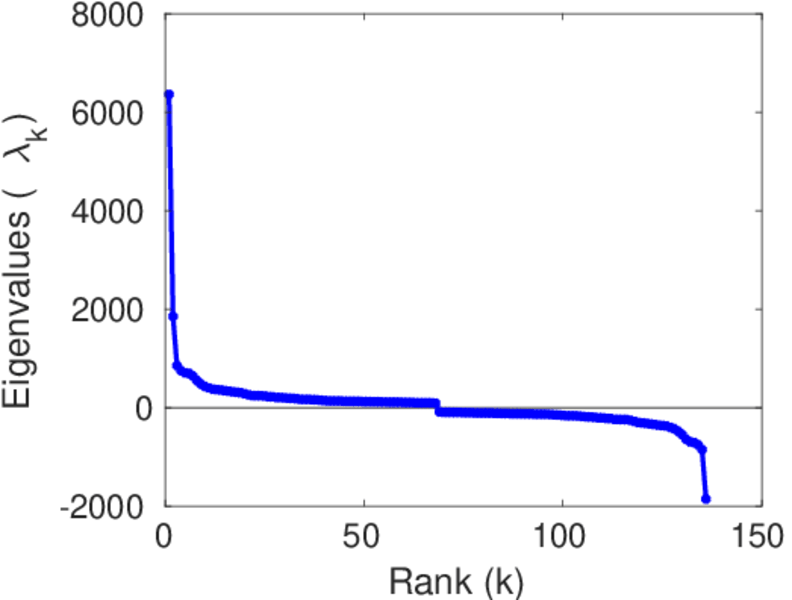
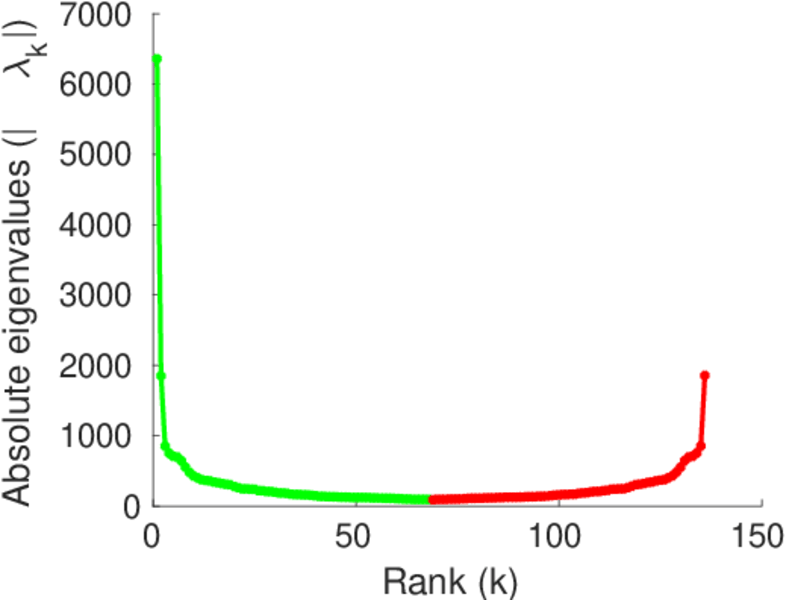
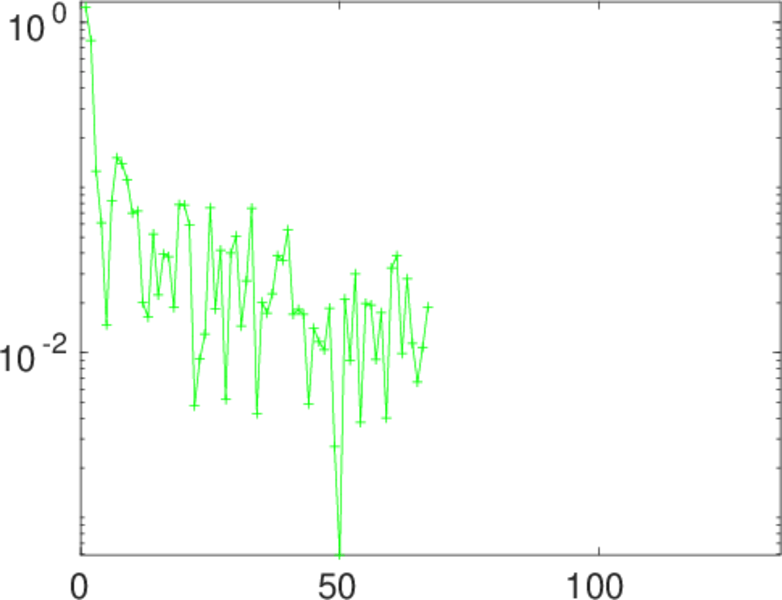
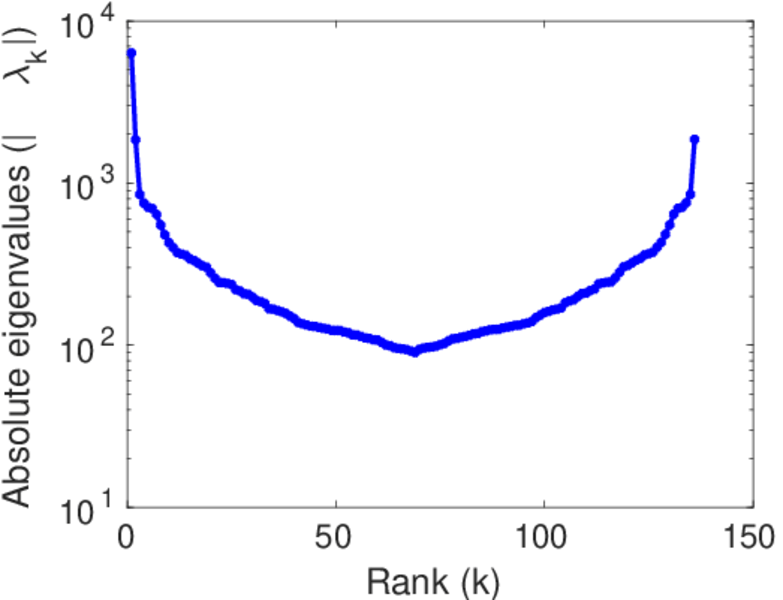
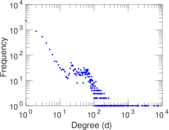
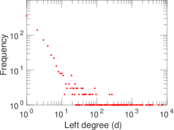
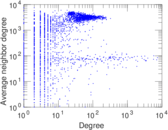
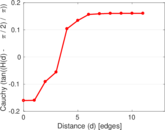
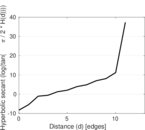
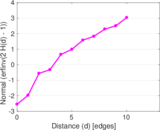
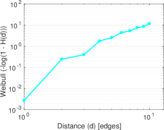
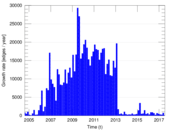
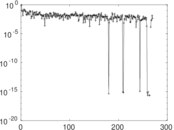
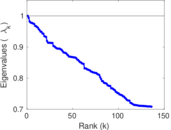
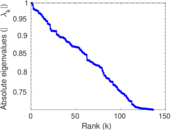
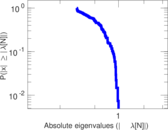
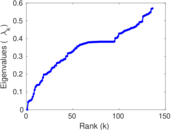
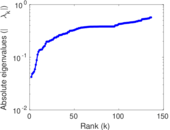
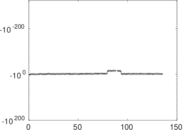
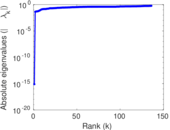
Plots


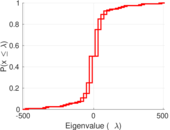
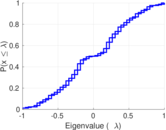
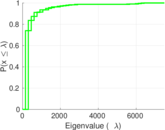


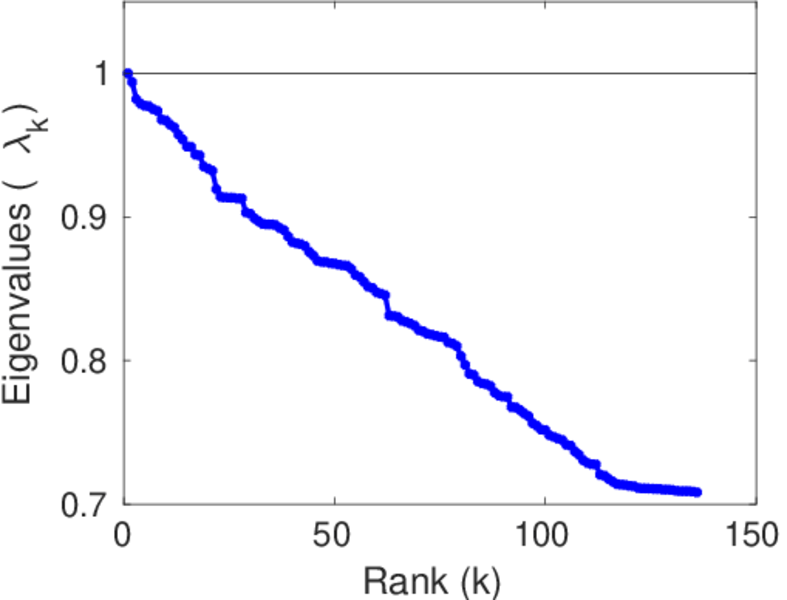
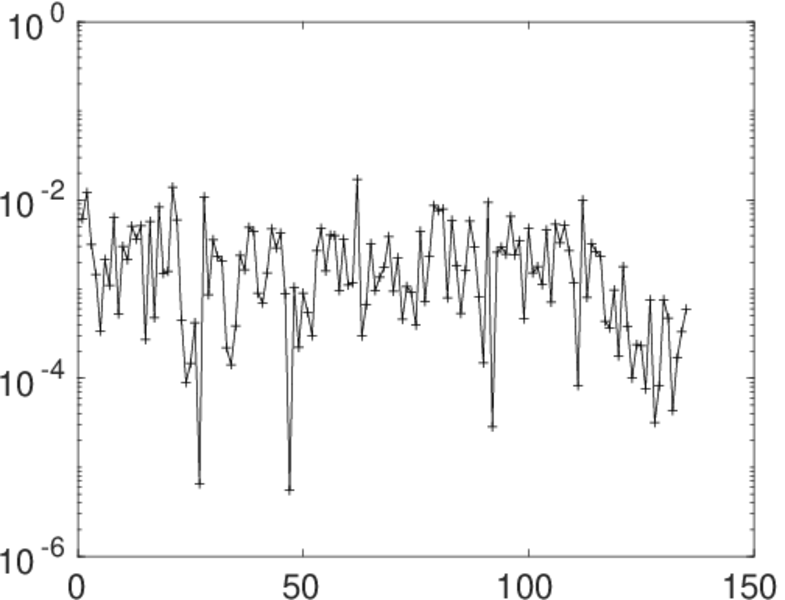
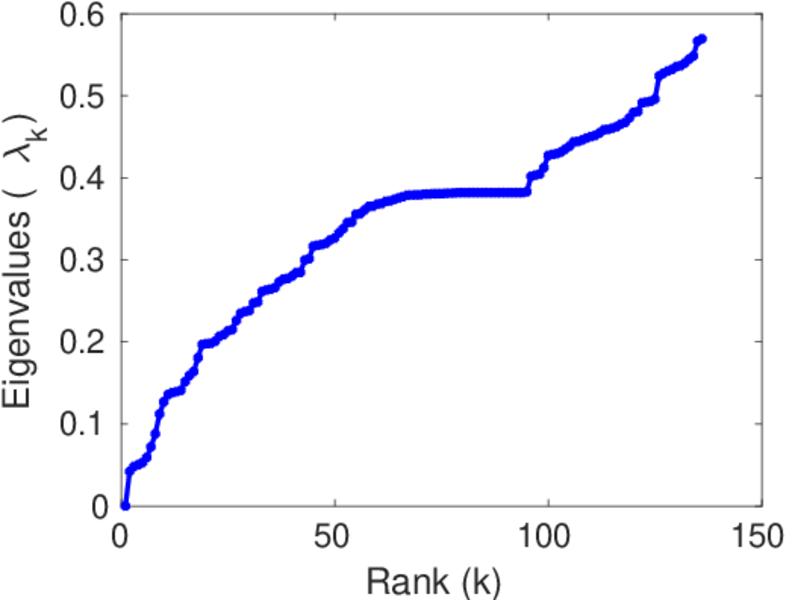
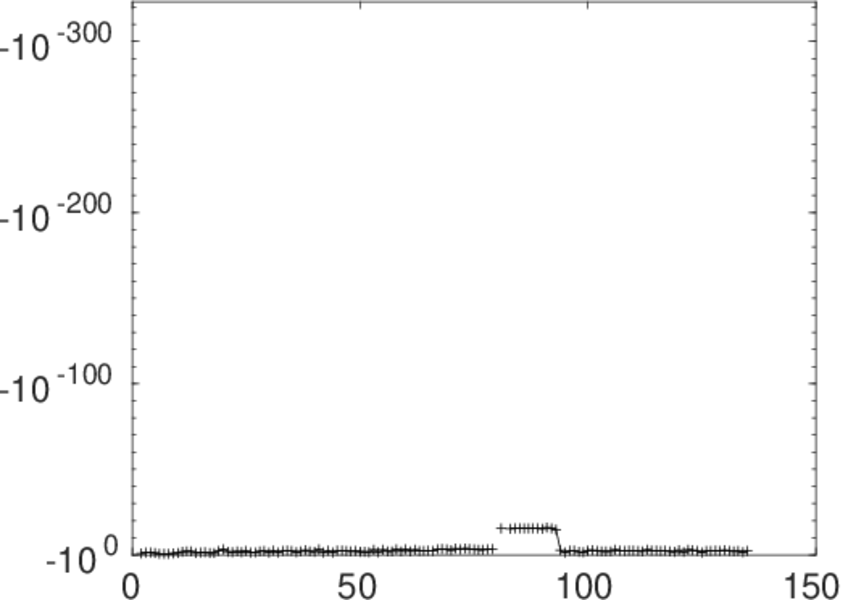
Matrix decompositions plots


Downloads
References
|
[1]
|
Jérôme Kunegis.
KONECT – The Koblenz Network Collection.
In Proc. Int. Conf. on World Wide Web Companion, pages
1343–1350, 2013.
[ http ]
|
|
[2]
|
Wikimedia Foundation.
Wikimedia downloads.
http://dumps.wikimedia.org/, January 2010.
|
 KONECT ‣ Networks ‣
Buy Me a Coffee
KONECT ‣ Networks ‣
Buy Me a Coffee