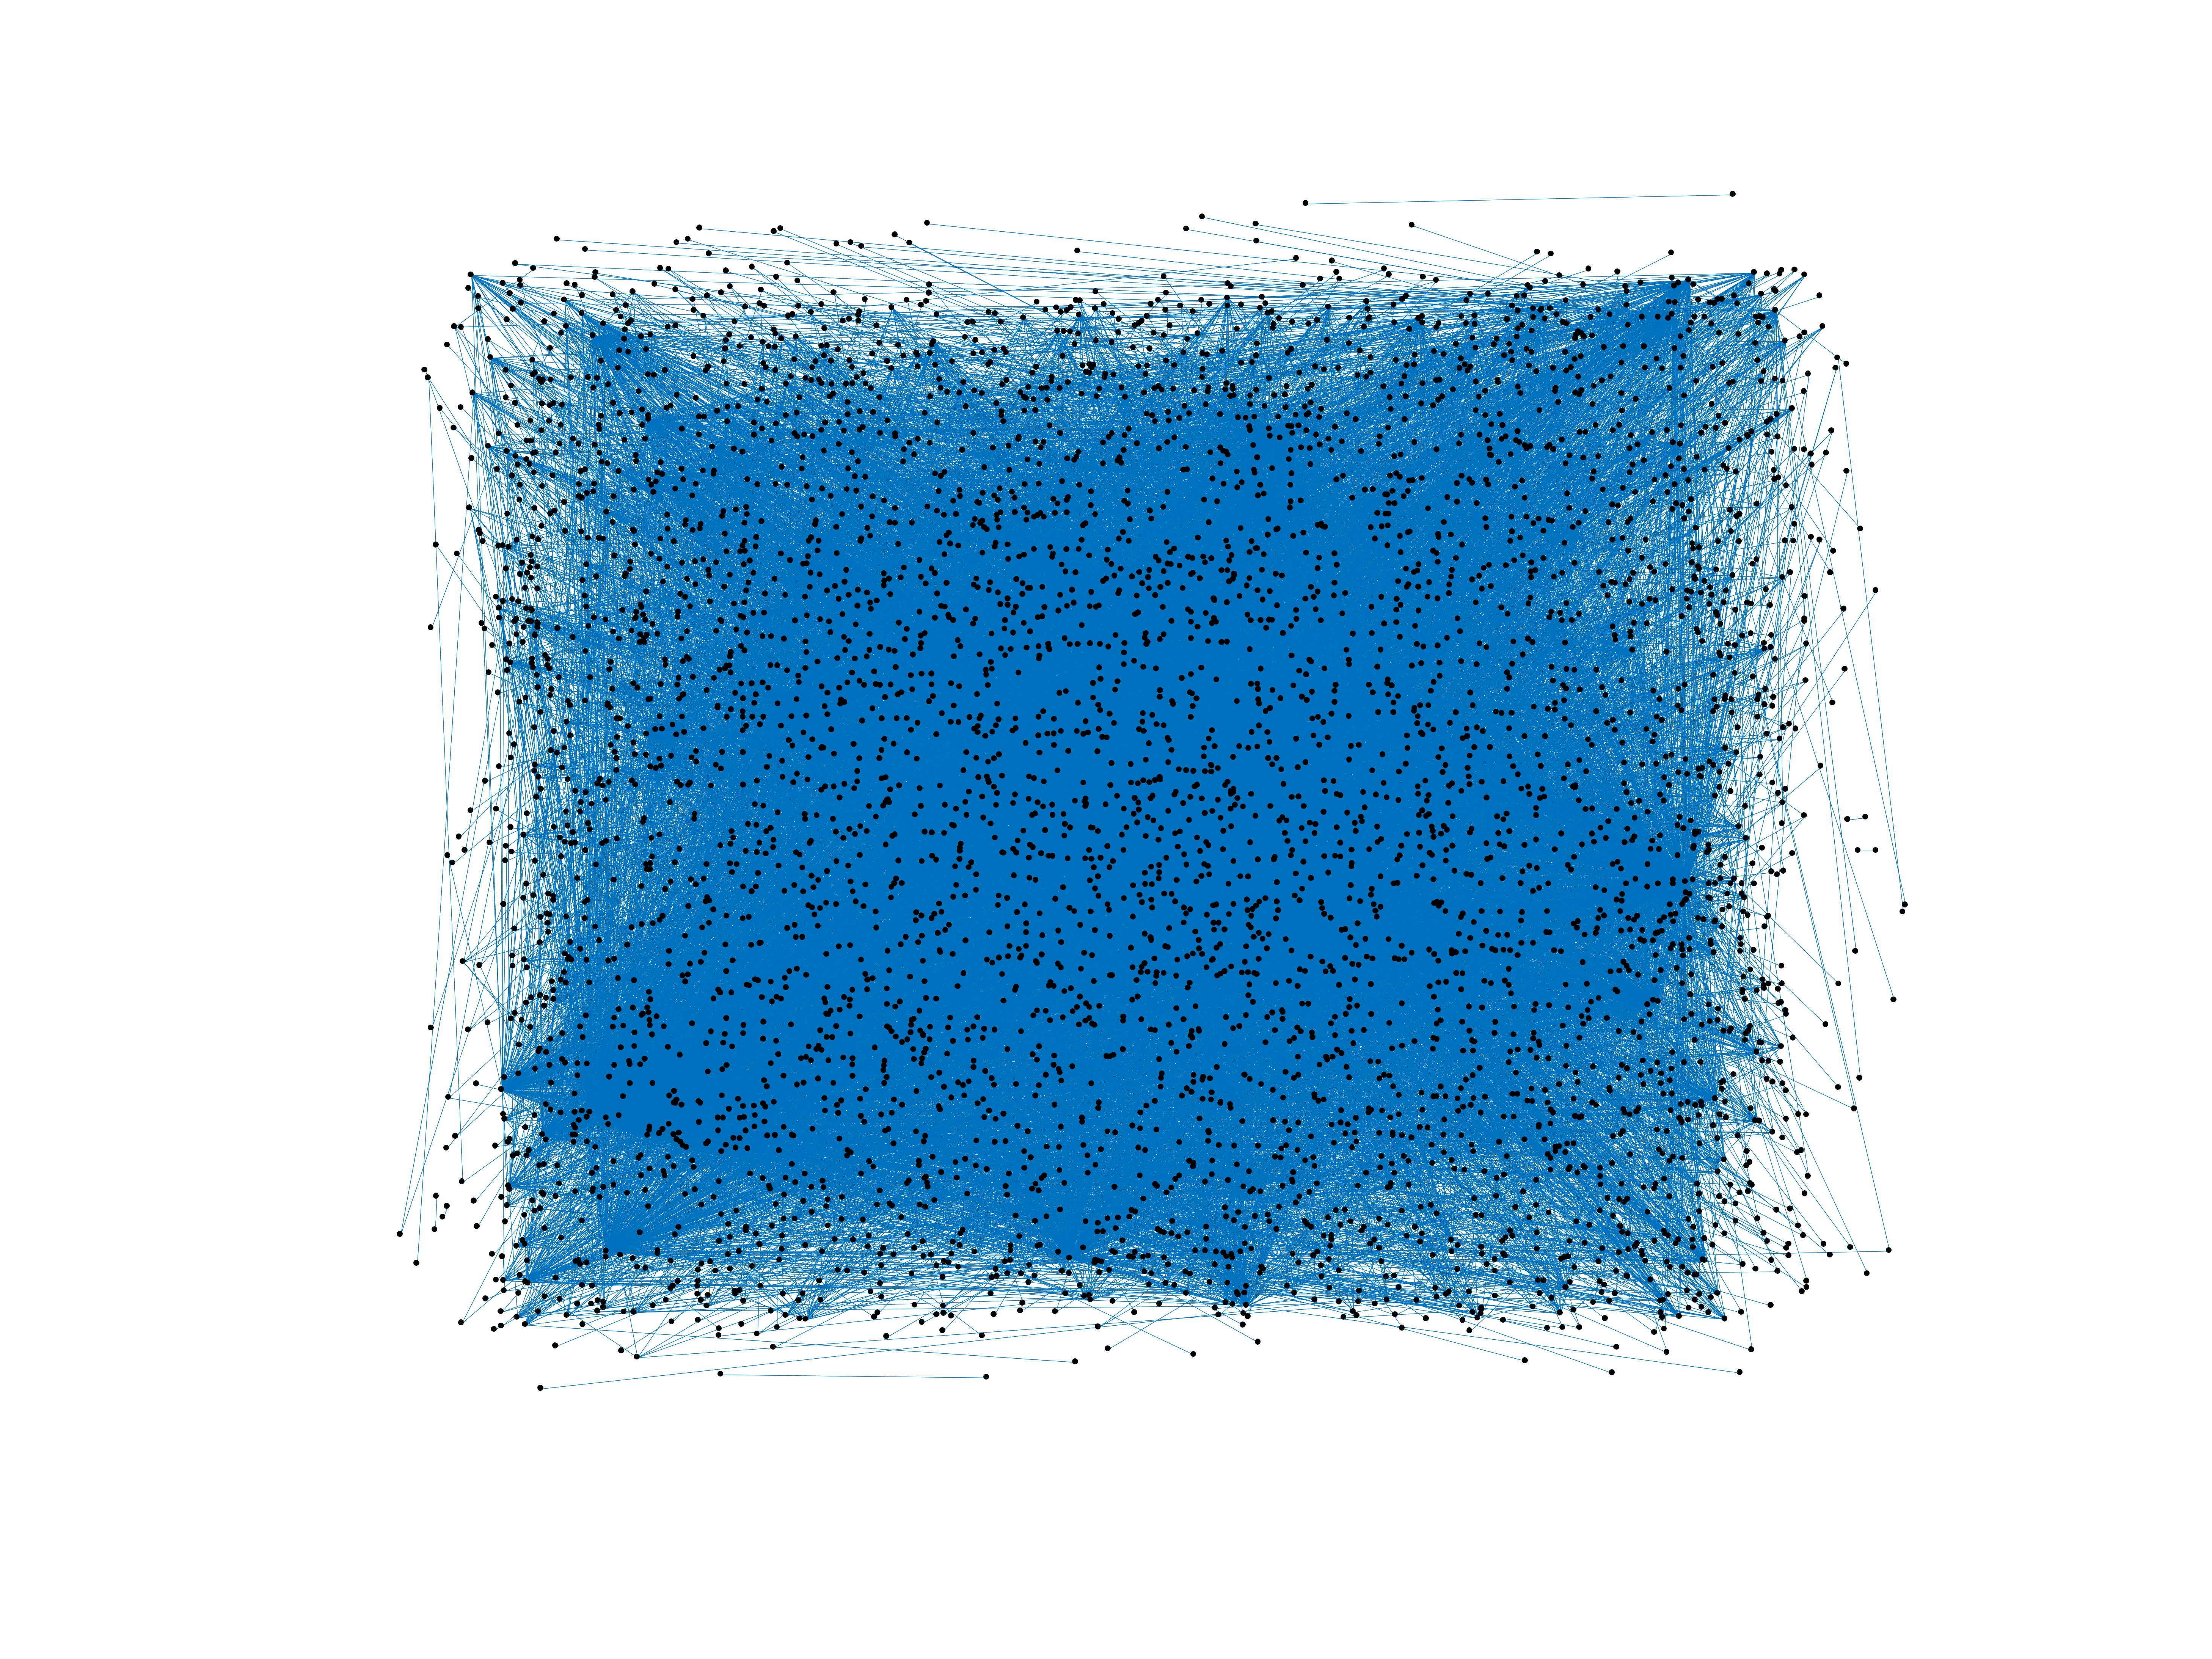
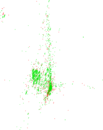
Wikipedia edits (kaa)
This is the bipartite edit network of the Kara-Kalpak Wikipedia. It contains
users and pages from the Kara-Kalpak Wikipedia, connected by edit events. Each
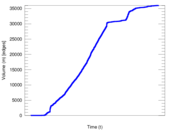
edge represents an edit. The dataset includes the timestamp of each edit.
Metadata
Statistics
| Size | n = | 5,469
|
| Left size | n1 = | 769
|
| Right size | n2 = | 4,700
|
| Volume | m = | 36,012
|
| Unique edge count | m̿ = | 17,390
|
| Wedge count | s = | 3,099,863
|
| Claw count | z = | 613,995,116
|
| Cross count | x = | 117,959,051,645
|
| Square count | q = | 6,947,409
|
| 4-Tour count | T4 = | 68,032,336
|
| Maximum degree | dmax = | 3,039
|
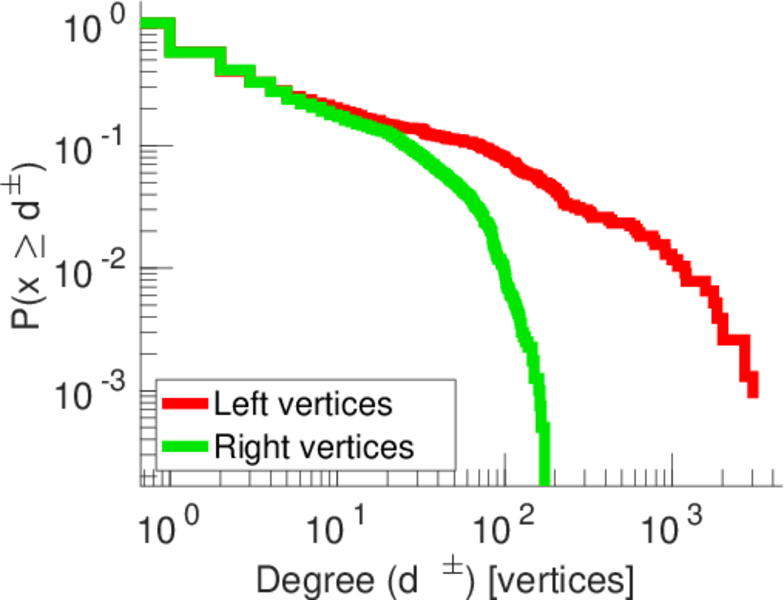
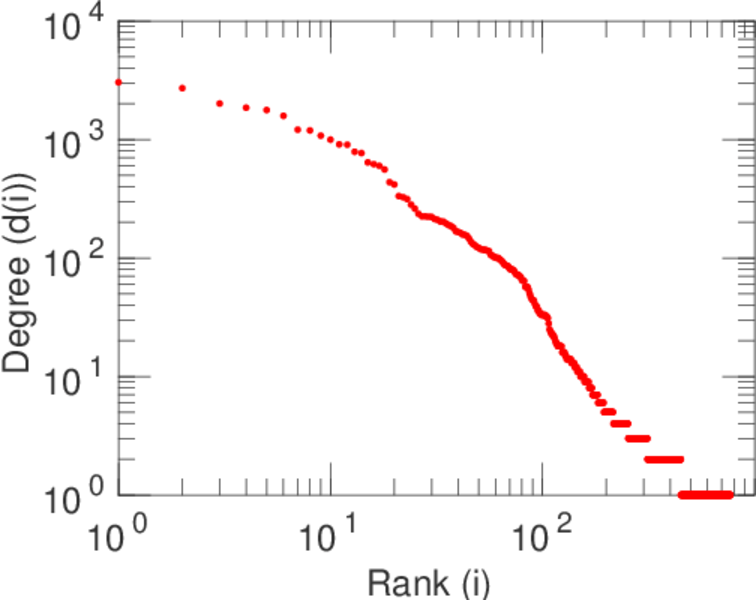
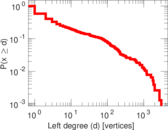
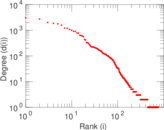
| Maximum left degree | d1max = | 3,039
|
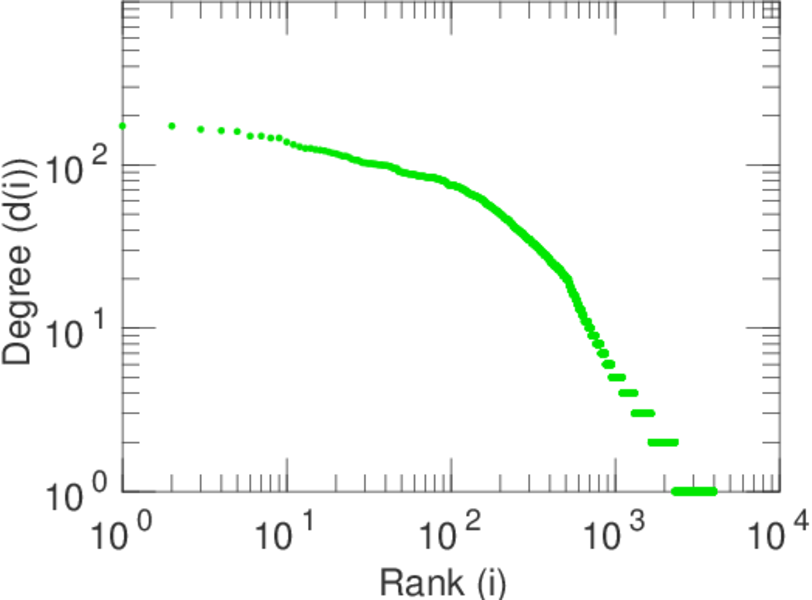
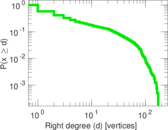
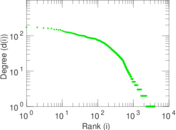
| Maximum right degree | d2max = | 173
|
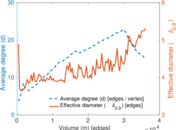
| Average degree | d = | 13.169 5
|
| Average left degree | d1 = | 46.829 6
|
| Average right degree | d2 = | 7.662 13
|
| Fill | p = | 0.004 811 44
|
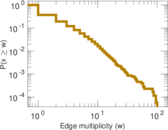
| Average edge multiplicity | m̃ = | 2.070 85
|
| Size of LCC | N = | 4,253
|
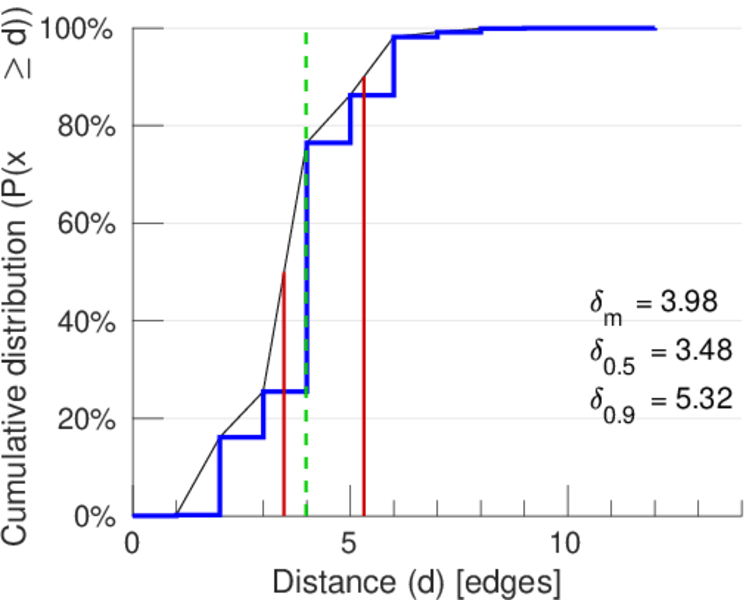
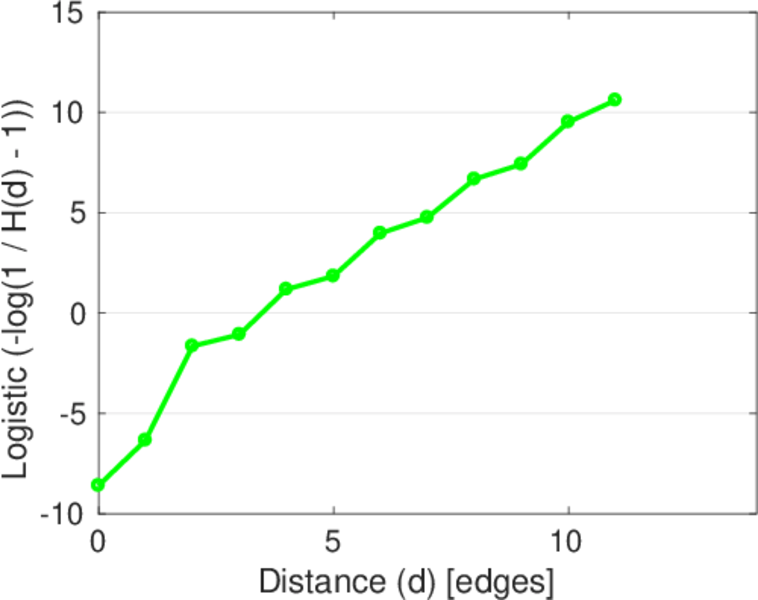
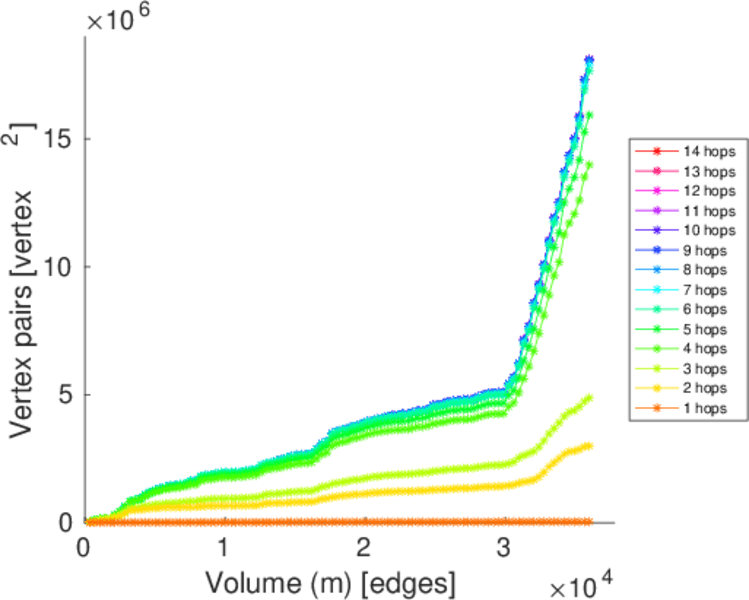
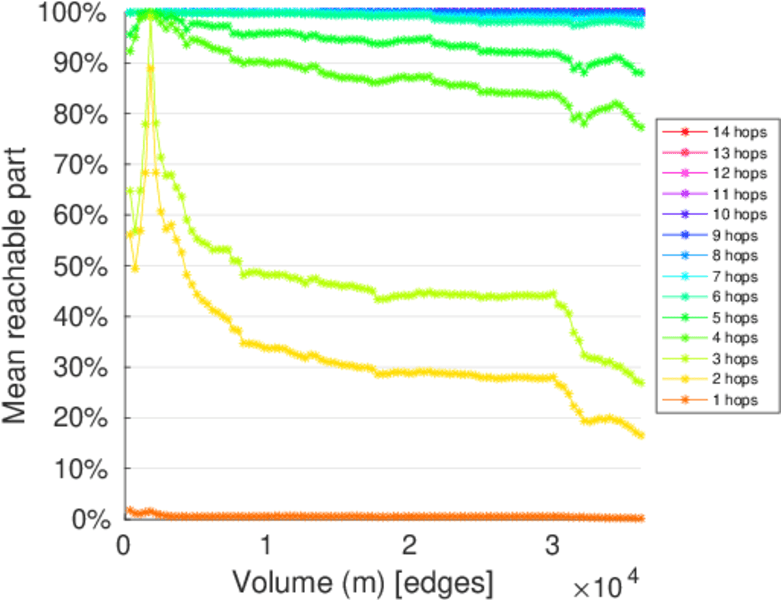
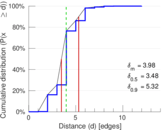
| Diameter | δ = | 14
|
| 50-Percentile effective diameter | δ0.5 = | 3.480 86
|
| 90-Percentile effective diameter | δ0.9 = | 5.315 18
|
| Median distance | δM = | 4
|
| Mean distance | δm = | 3.983 94
|
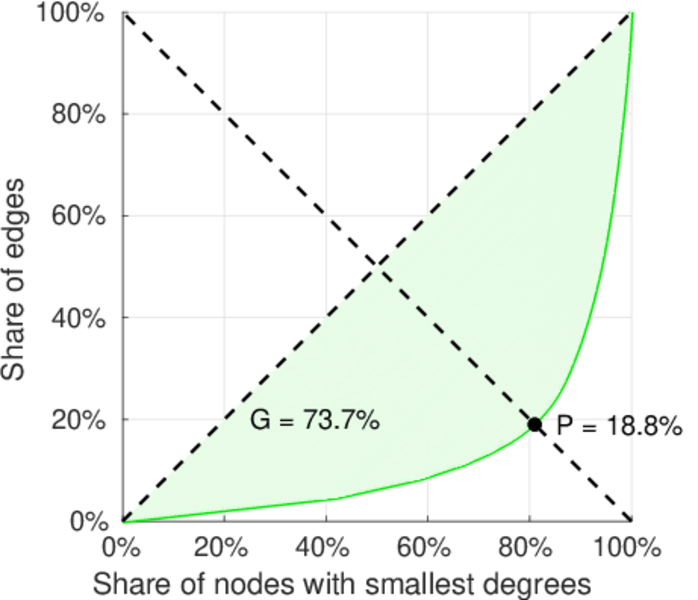
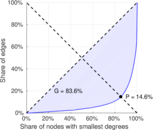
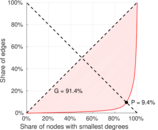
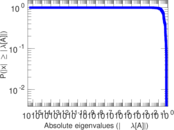
| Gini coefficient | G = | 0.839 194
|
| Balanced inequality ratio | P = | 0.147 520
|
| Left balanced inequality ratio | P1 = | 0.094 052 0
|
| Right balanced inequality ratio | P2 = | 0.188 493
|
| Relative edge distribution entropy | Her = | 0.795 011
|
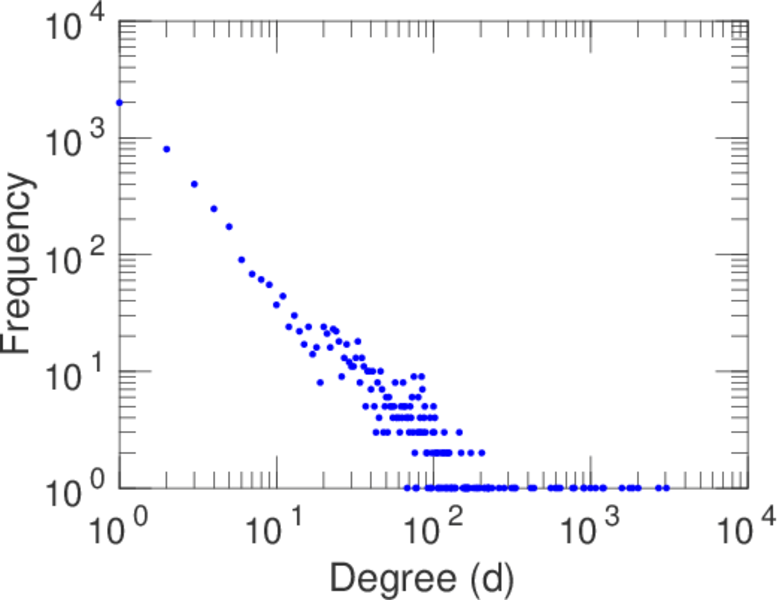
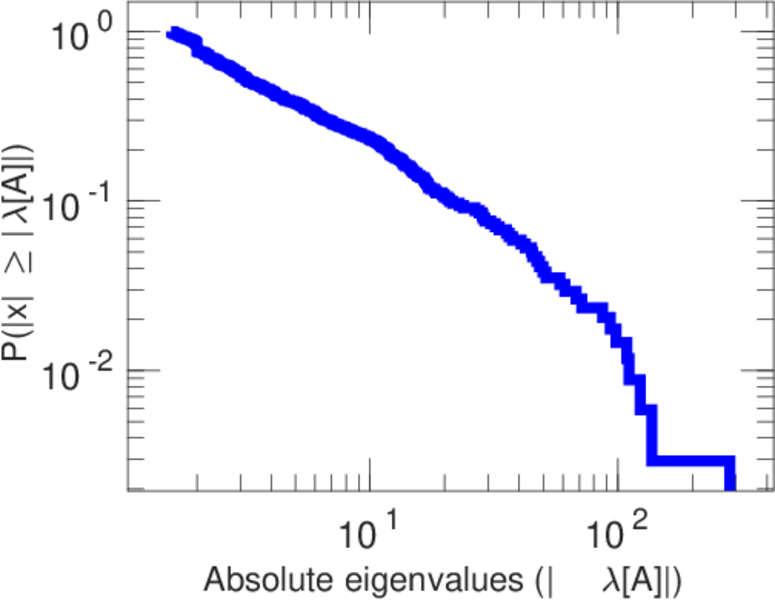
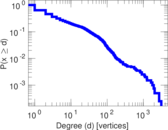
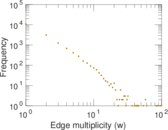
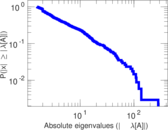
| Power law exponent | γ = | 2.290 51
|
| Tail power law exponent | γt = | 1.811 00
|
| Tail power law exponent with p | γ3 = | 1.811 00
|
| p-value | p = | 0.000 00
|
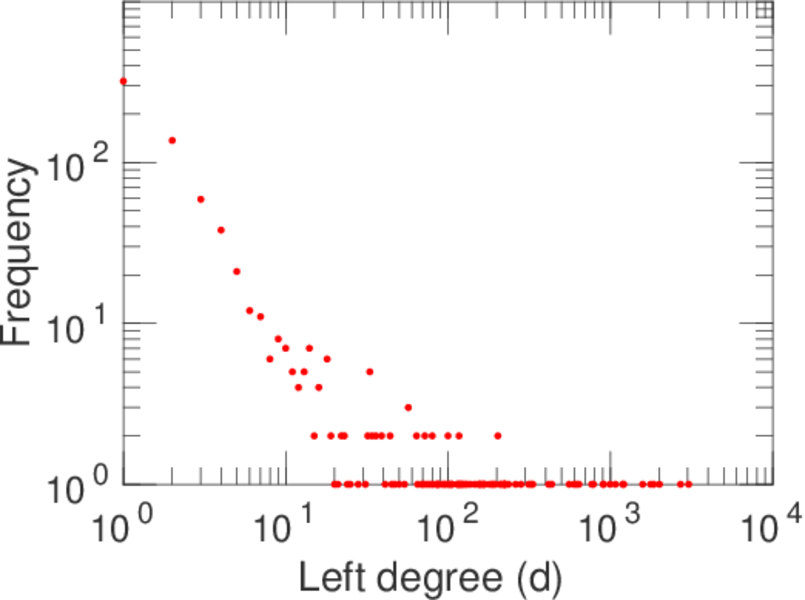
| Left tail power law exponent with p | γ3,1 = | 1.661 00
|
| Left p-value | p1 = | 0.000 00
|
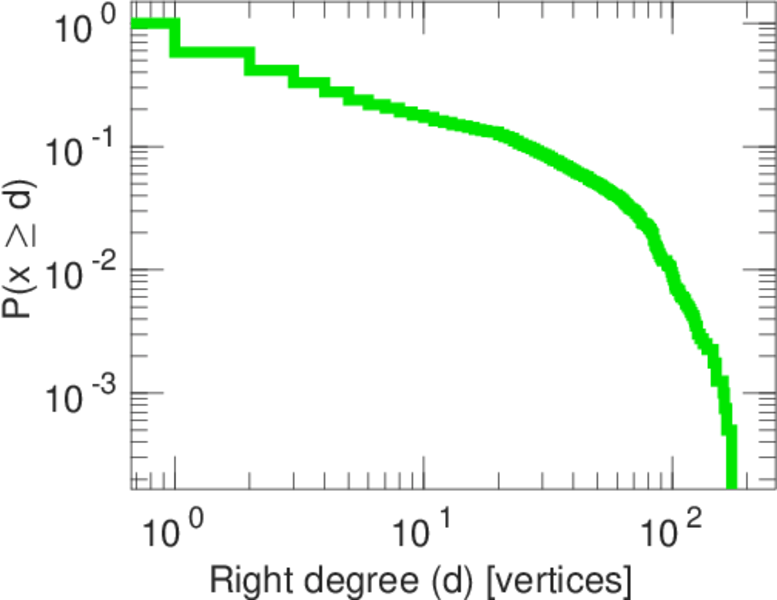
| Right tail power law exponent with p | γ3,2 = | 8.911 00
|
| Right p-value | p2 = | 0.798 000
|
| Degree assortativity | ρ = | −0.216 436
|
| Degree assortativity p-value | pρ = | 1.970 91 × 10−183
|
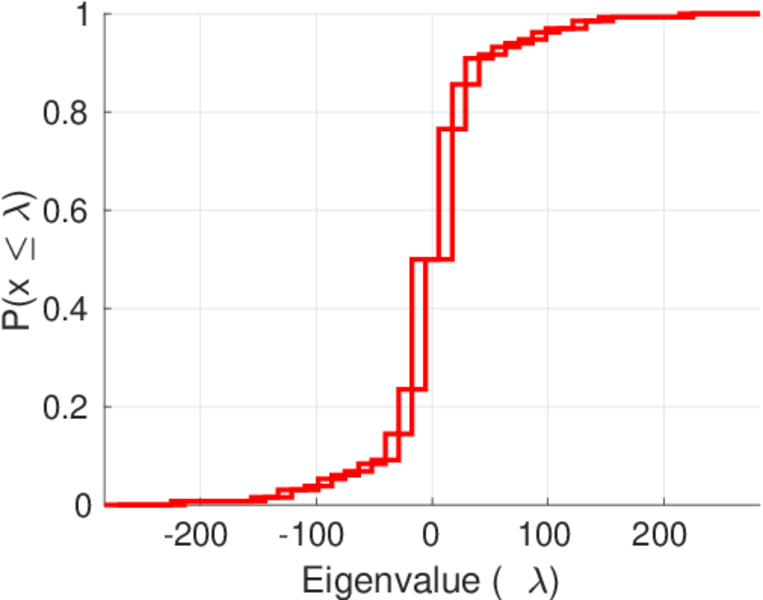
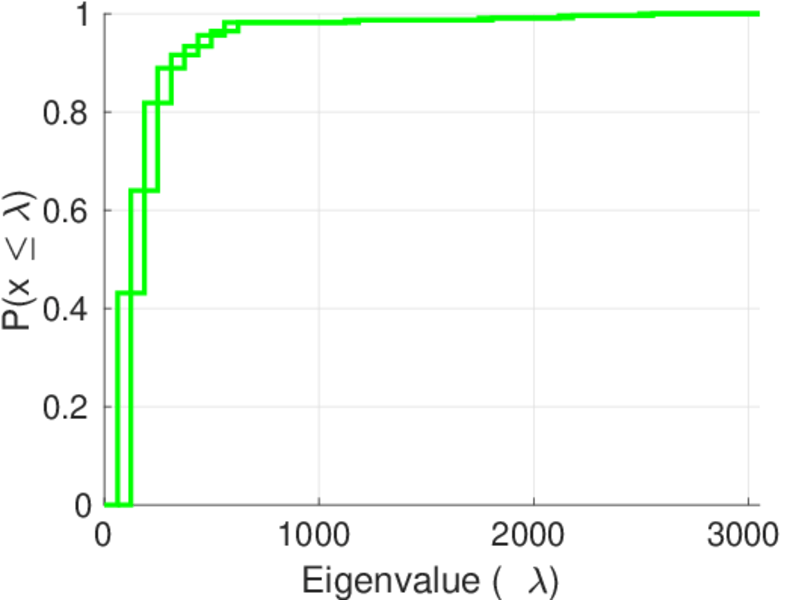
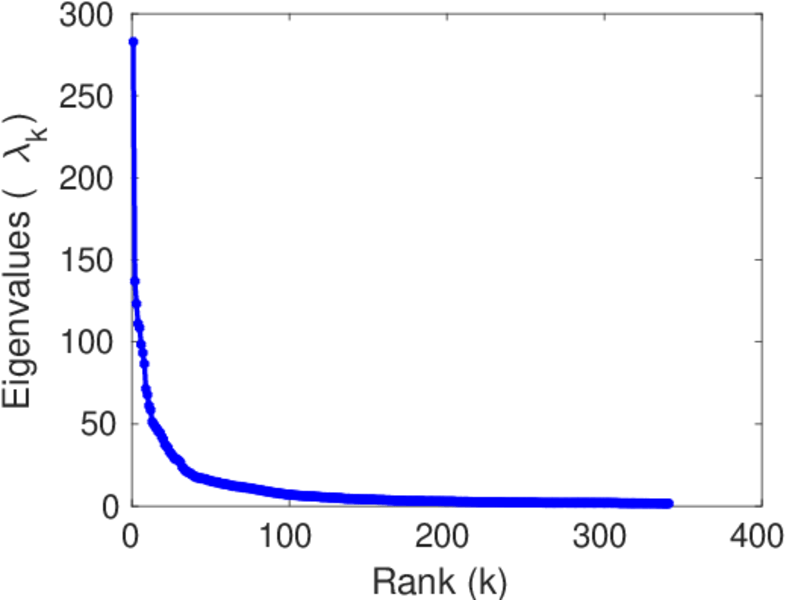
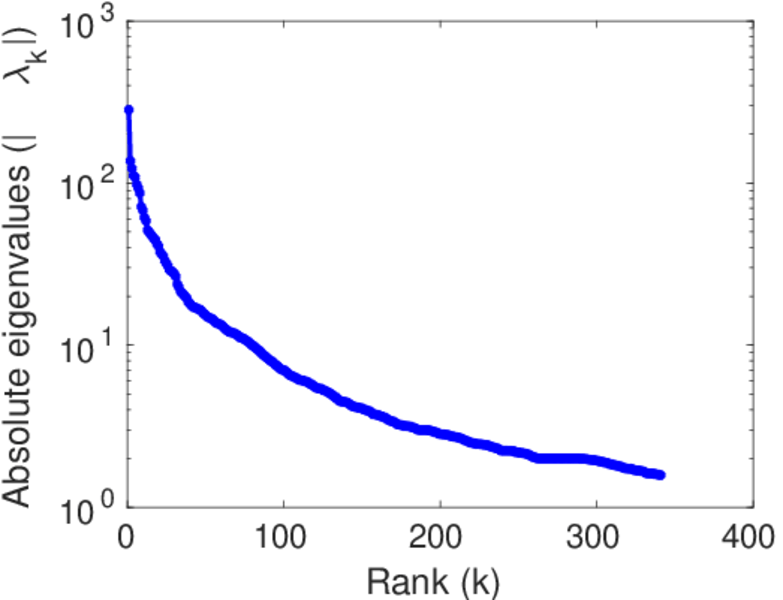
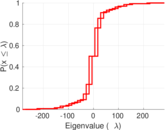
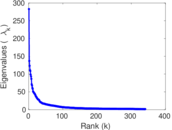
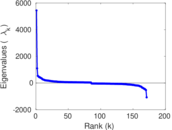
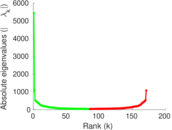
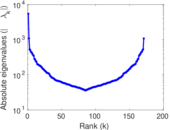
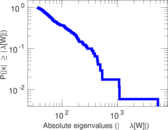
| Spectral norm | α = | 282.889
|
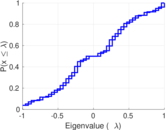
| Algebraic connectivity | a = | 0.025 688 1
|
| Spectral separation | |λ1[A] / λ2[A]| = | 2.065 02
|
| Controllability | C = | 3,317
|
| Relative controllability | Cr = | 0.697 581
|
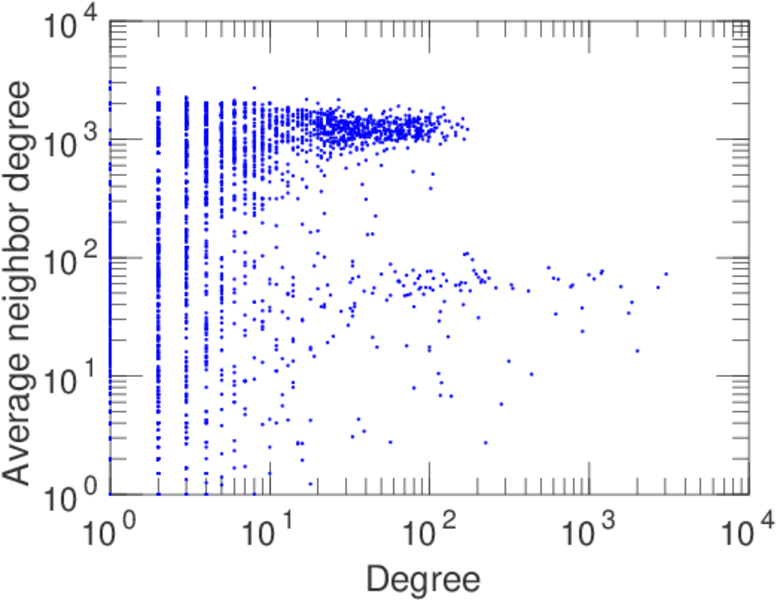
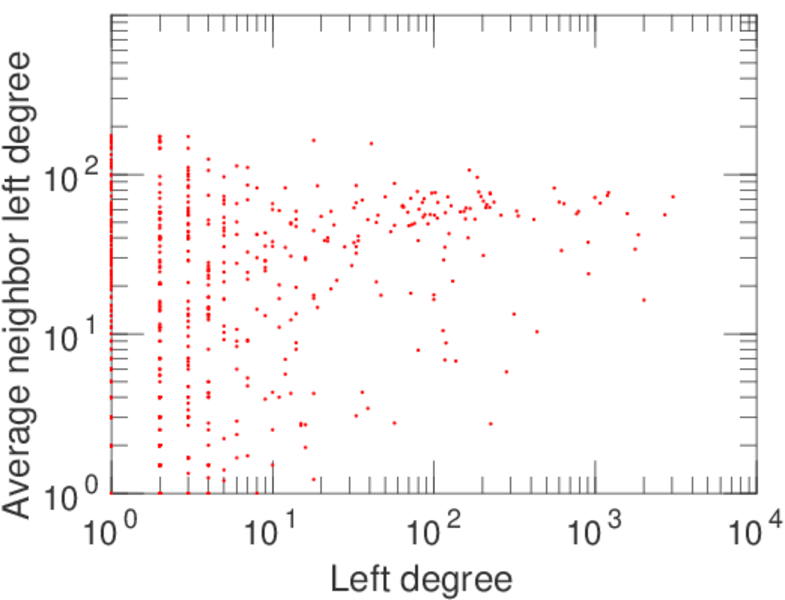
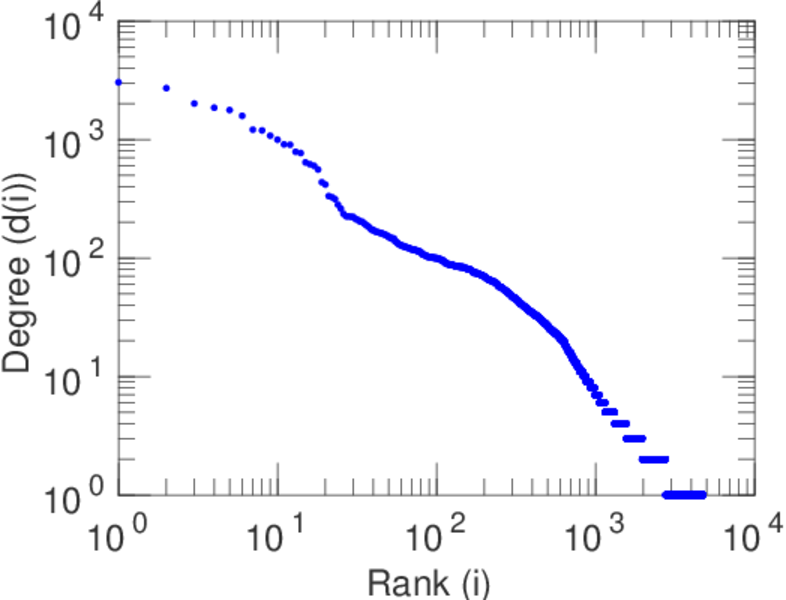
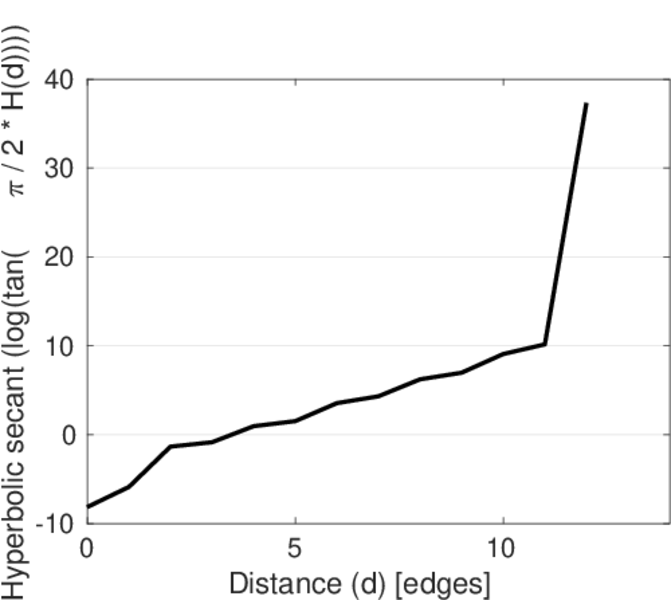
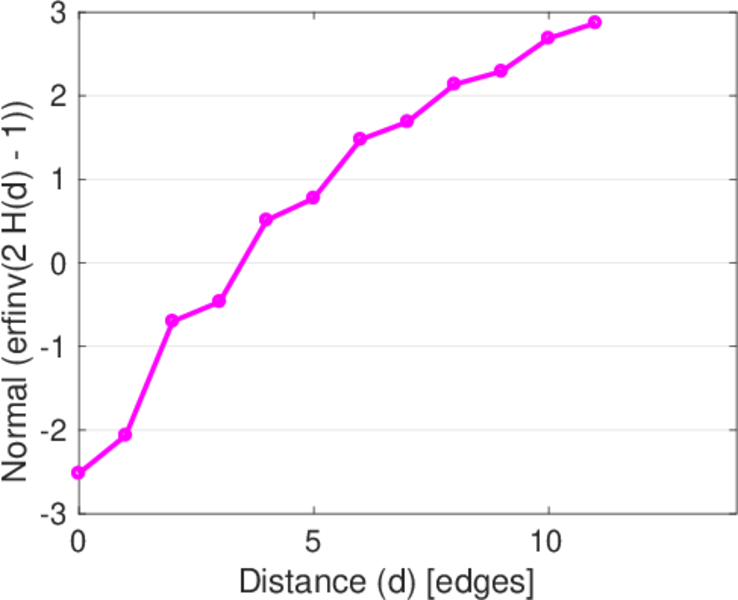
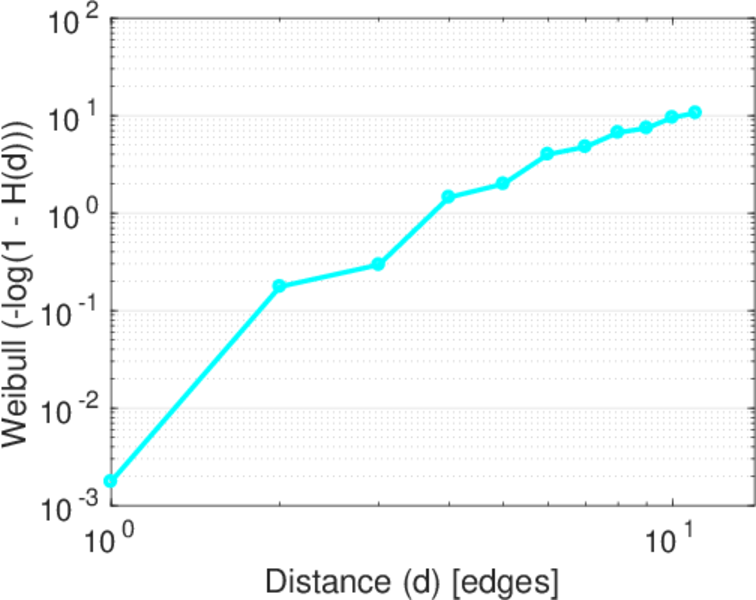
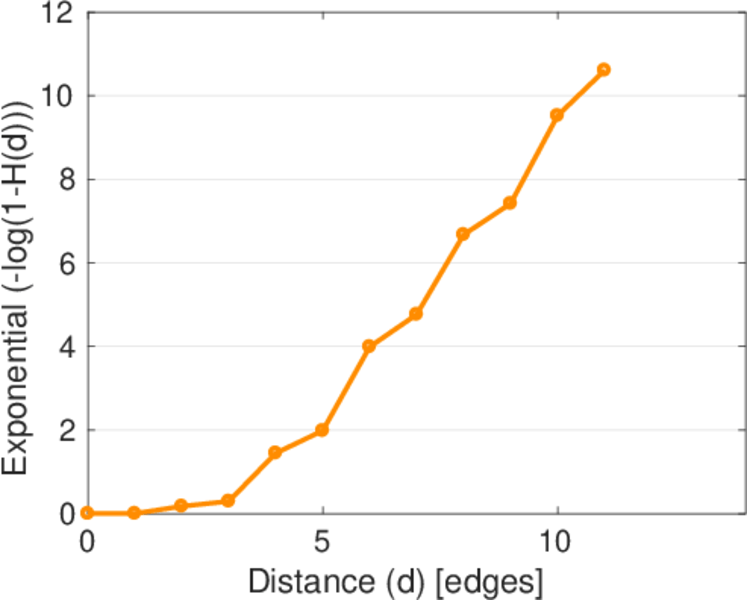
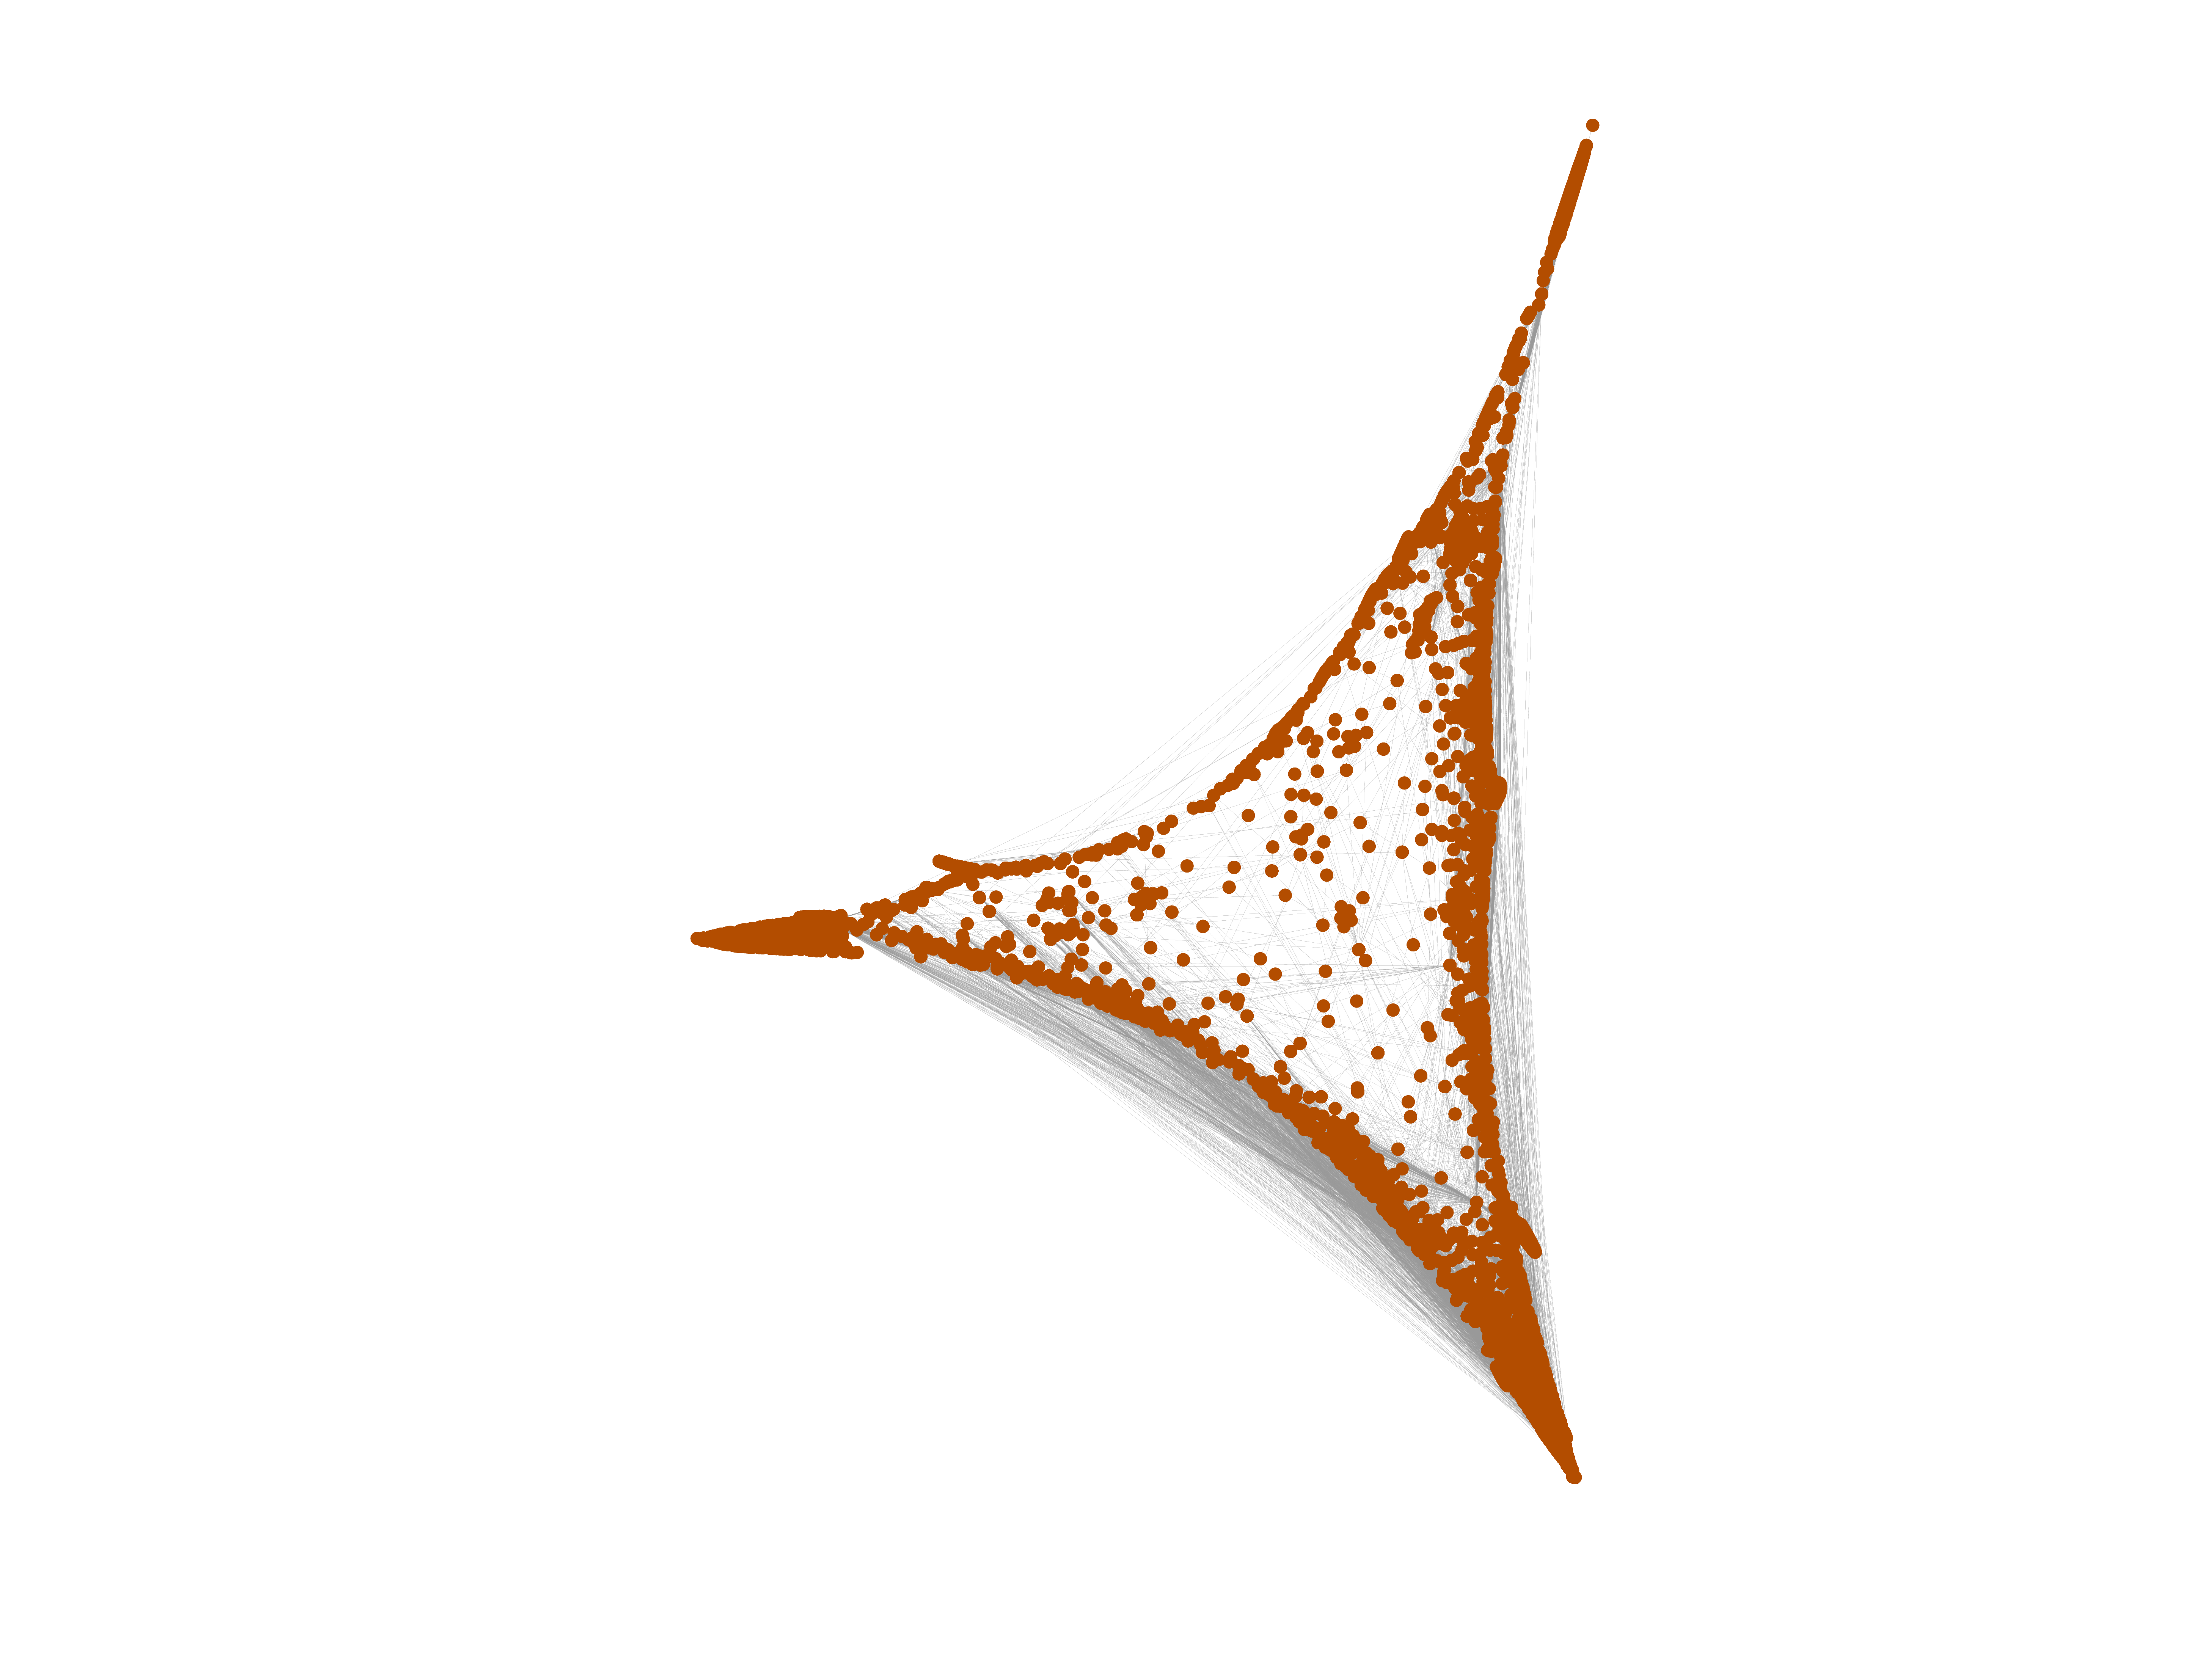
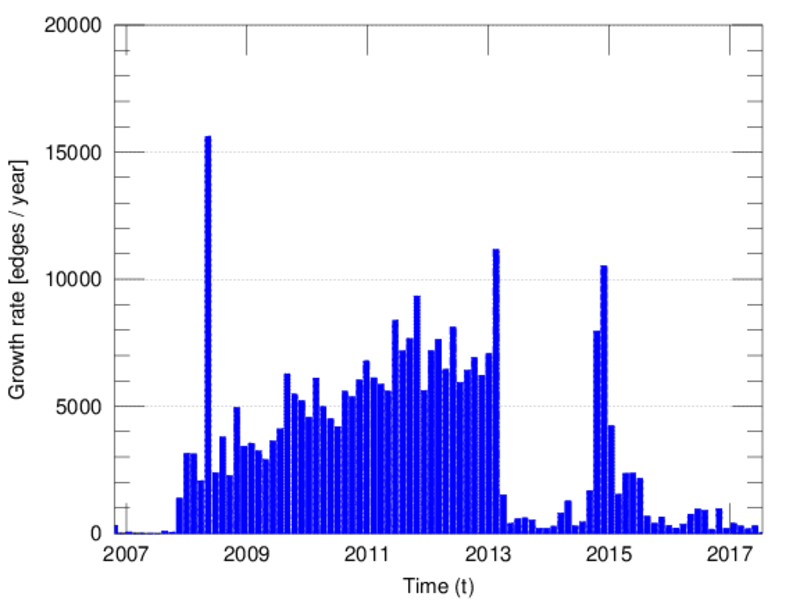
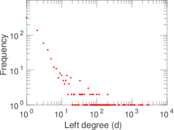
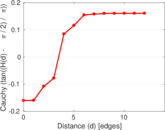
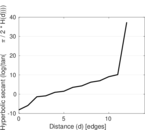
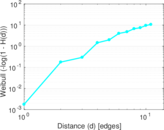
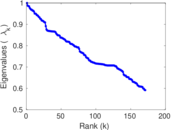
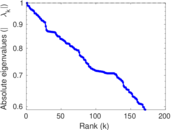
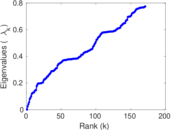
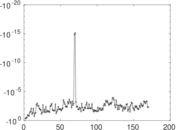
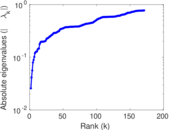
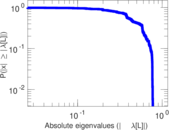
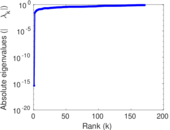
Plots


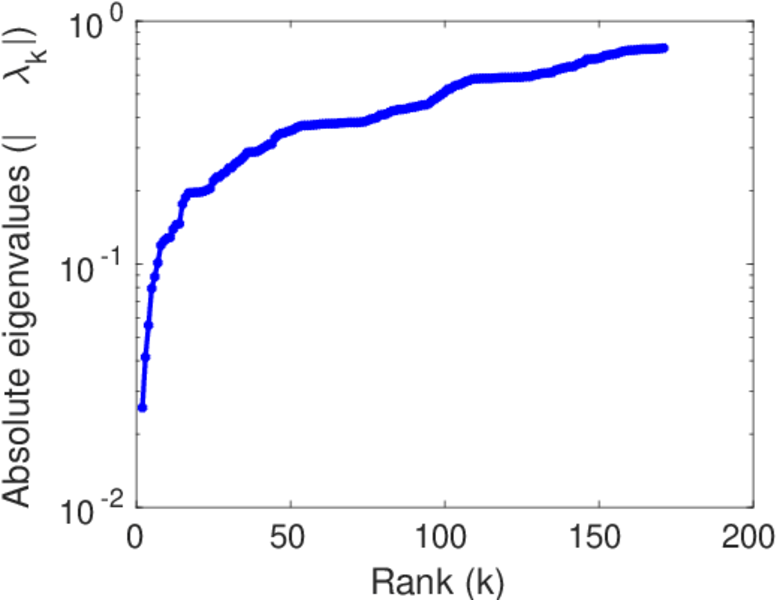
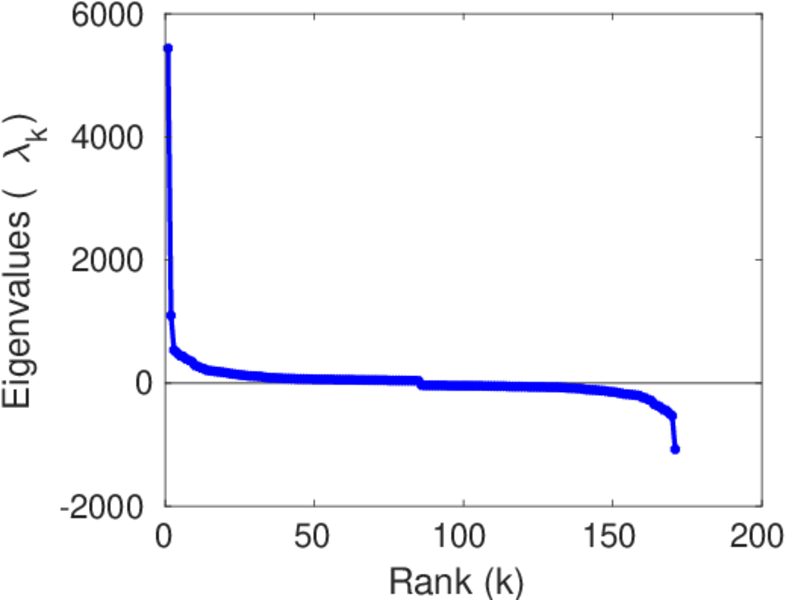
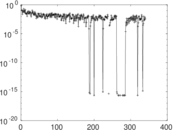
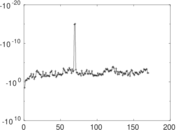
Matrix decompositions plots


Downloads
References
|
[1]
|
Jérôme Kunegis.
KONECT – The Koblenz Network Collection.
In Proc. Int. Conf. on World Wide Web Companion, pages
1343–1350, 2013.
[ http ]
|
|
[2]
|
Wikimedia Foundation.
Wikimedia downloads.
http://dumps.wikimedia.org/, January 2010.
|
 KONECT ‣ Networks ‣
Buy Me a Coffee
KONECT ‣ Networks ‣
Buy Me a Coffee