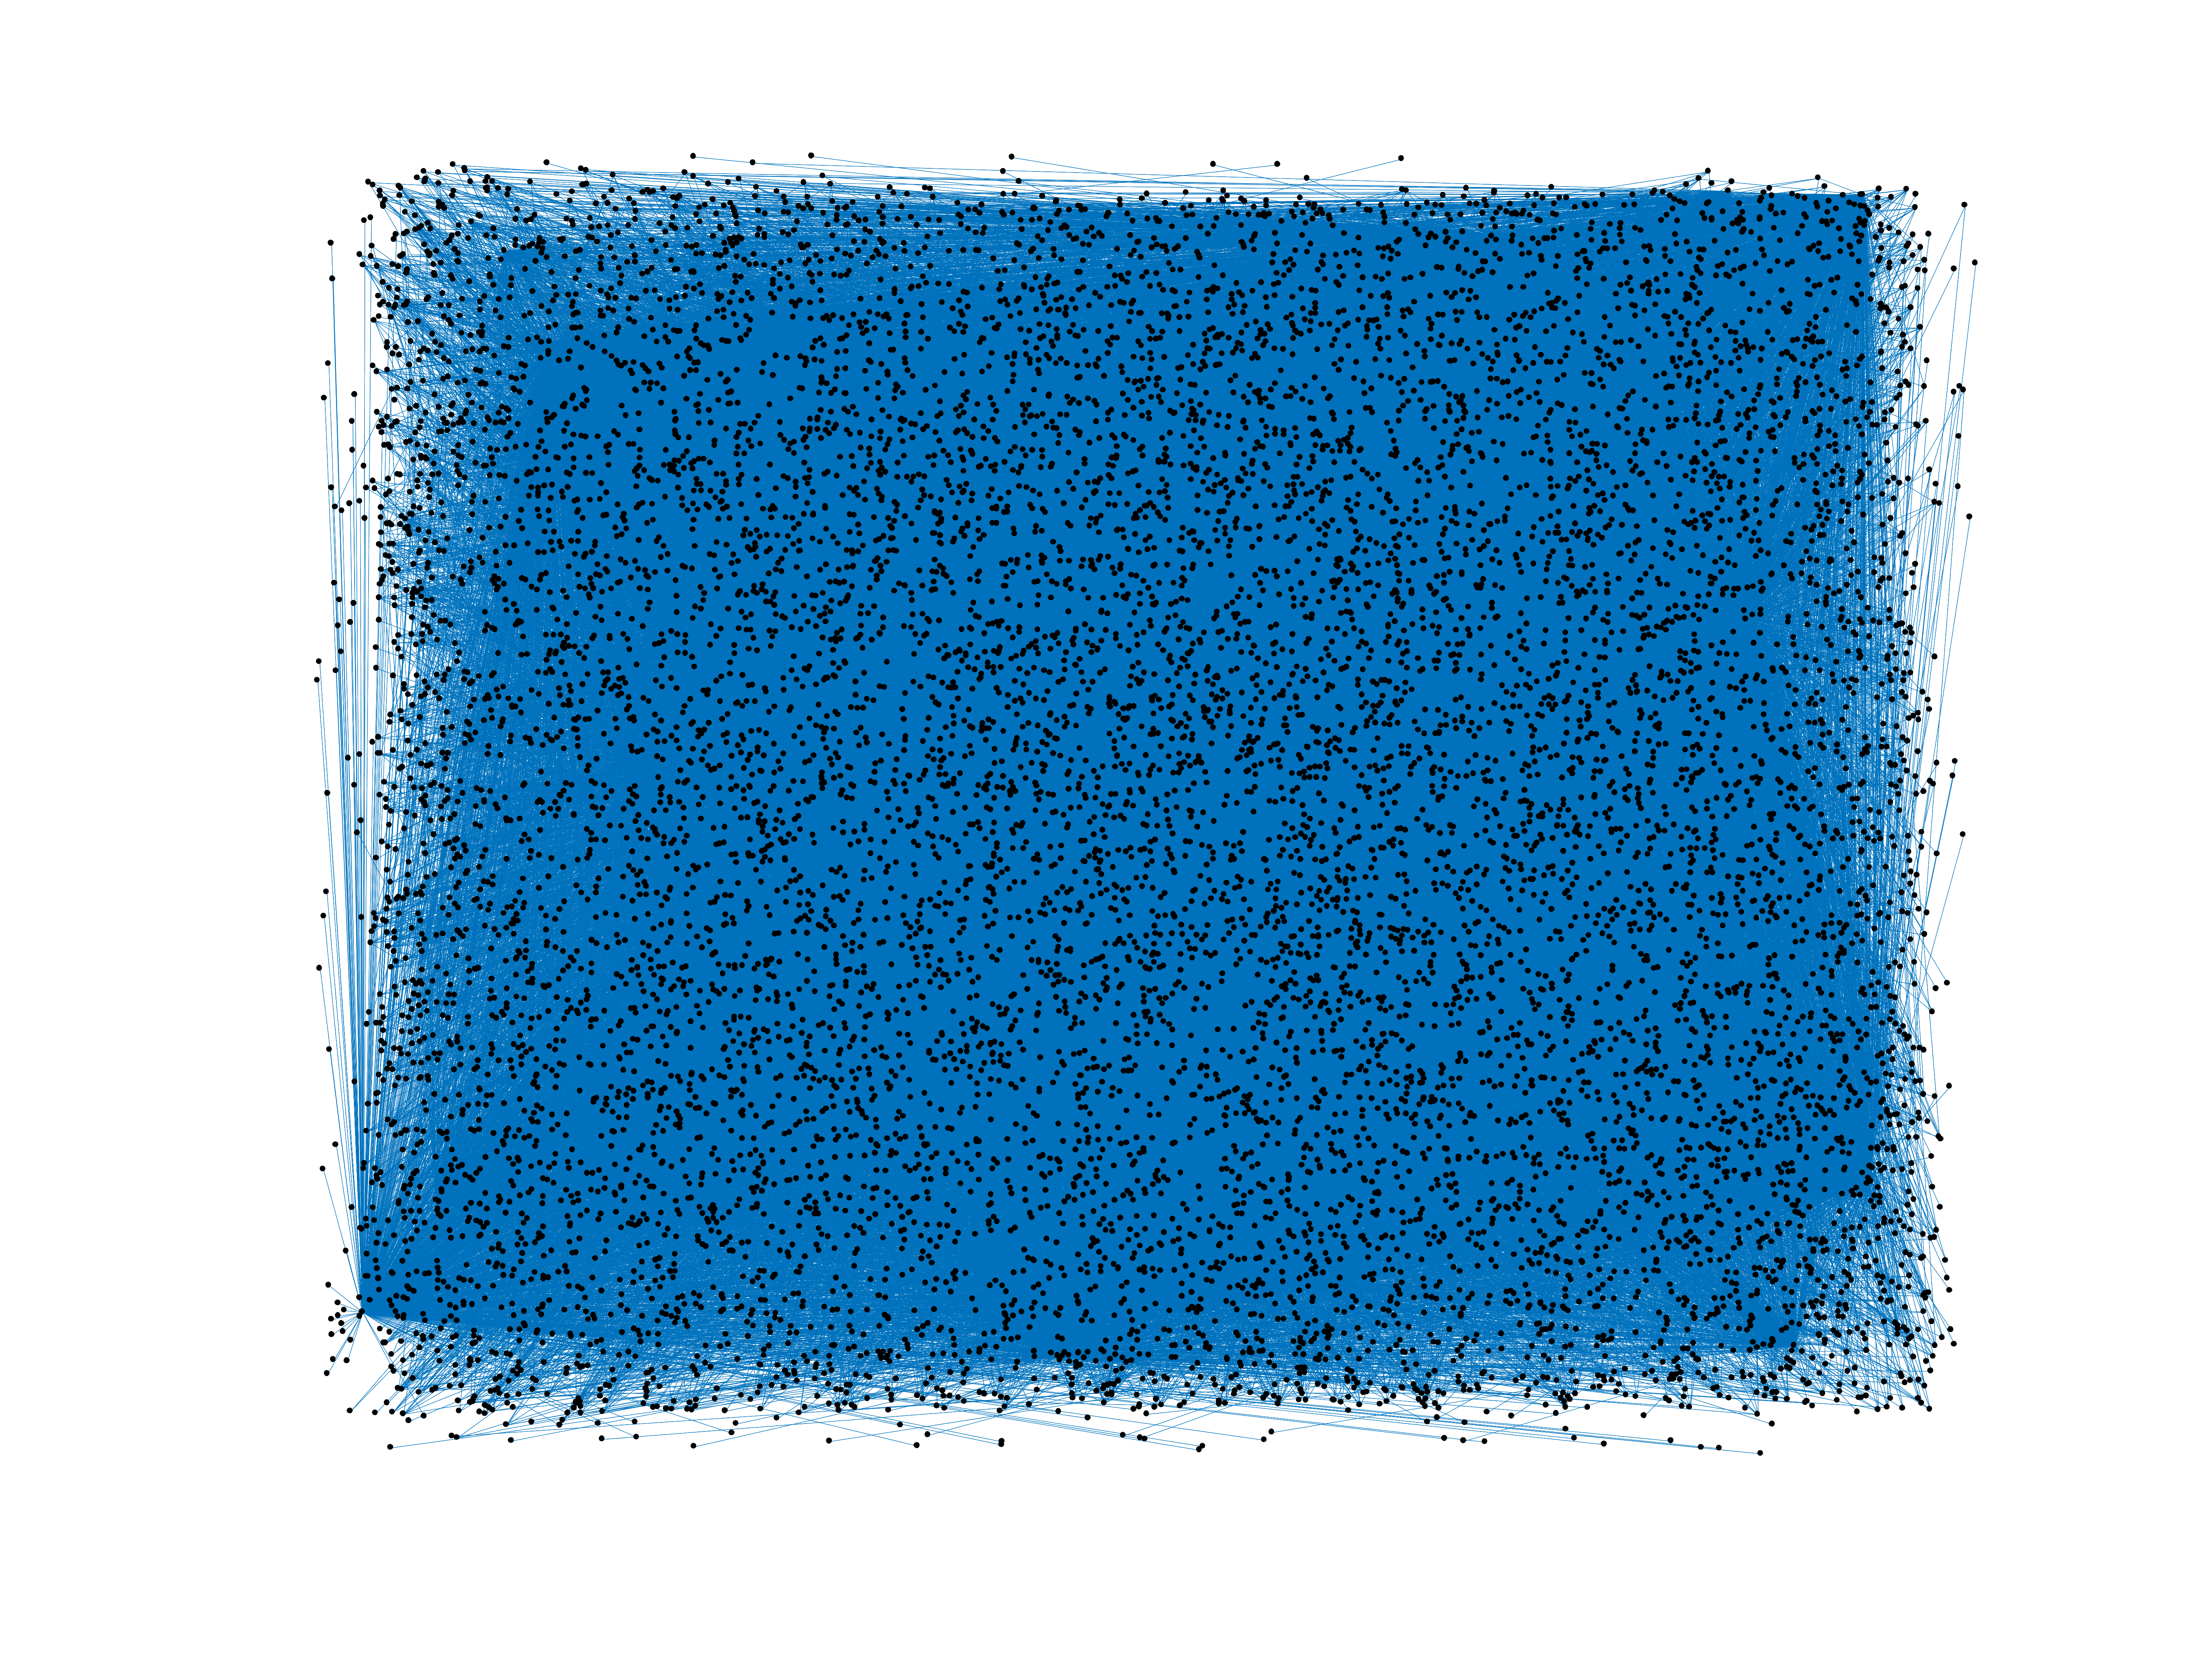
Wiktionary edits (ka)
This is the bipartite edit network of the Georgian Wiktionary. It contains
users and pages from the Georgian Wiktionary, connected by edit events. Each
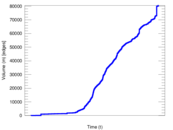
edge represents an edit. The dataset includes the timestamp of each edit.
Metadata
Statistics
| Size | n = | 11,715
|
| Left size | n1 = | 338
|
| Right size | n2 = | 11,377
|
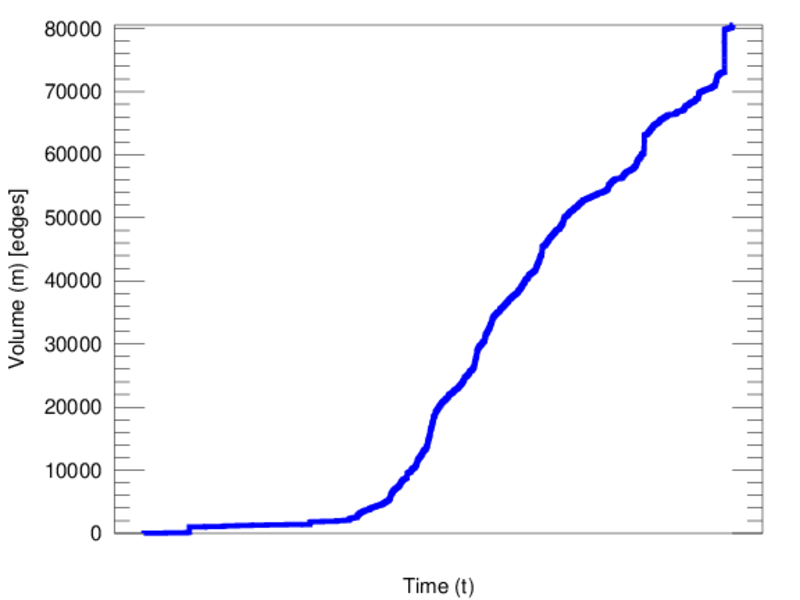
| Volume | m = | 80,547
|
| Unique edge count | m̿ = | 44,211
|
| Wedge count | s = | 77,174,175
|
| Claw count | z = | 127,377,280,280
|
| Cross count | x = | 178,068,963,796,024
|
| Square count | q = | 85,482,531
|
| 4-Tour count | T4 = | 992,649,382
|
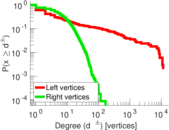
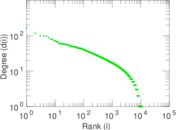
| Maximum degree | dmax = | 11,380
|
| Maximum left degree | d1max = | 11,380
|
| Maximum right degree | d2max = | 166
|
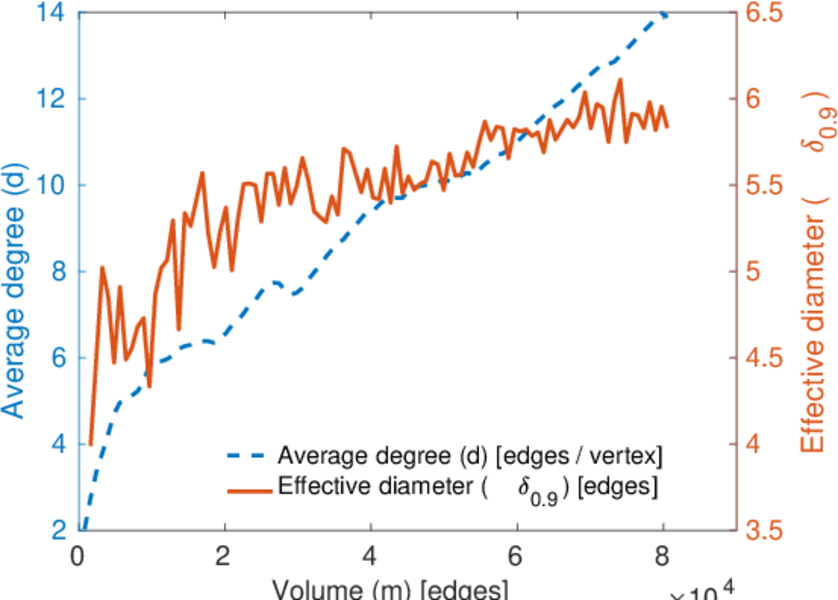
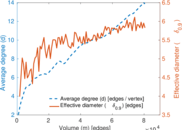
| Average degree | d = | 13.751 1
|
| Average left degree | d1 = | 238.305
|
| Average right degree | d2 = | 7.079 81
|
| Fill | p = | 0.011 497 0
|
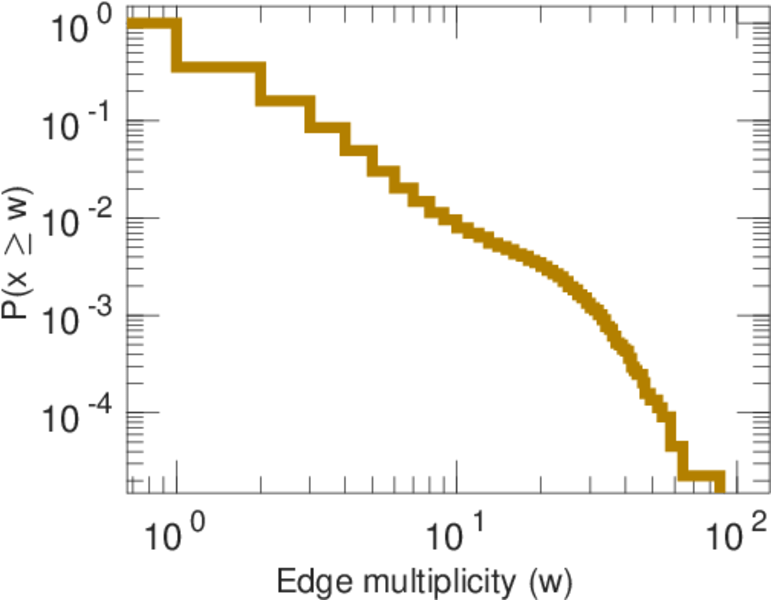
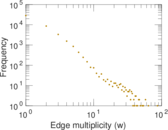
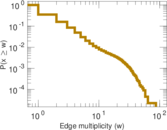
| Average edge multiplicity | m̃ = | 1.821 88
|
| Size of LCC | N = | 11,329
|
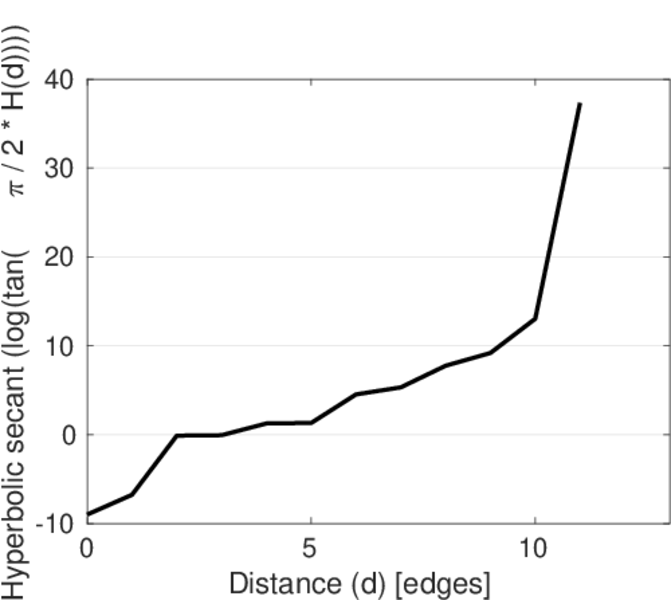
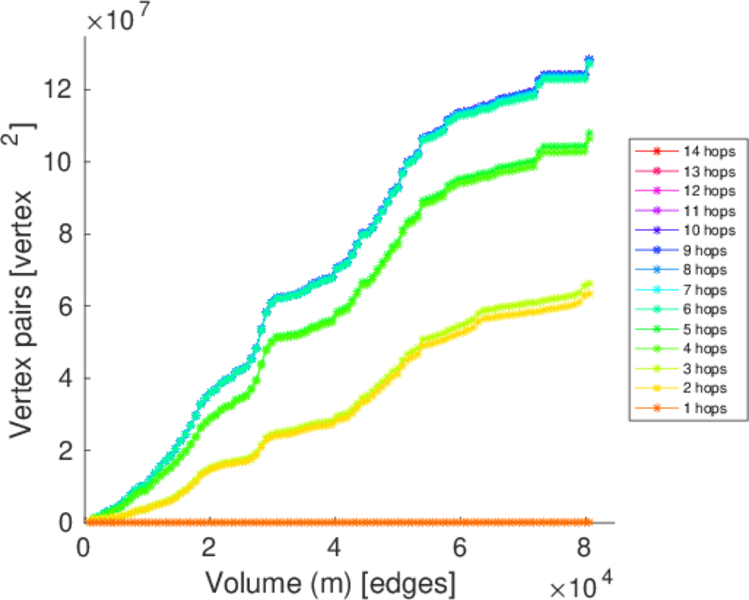
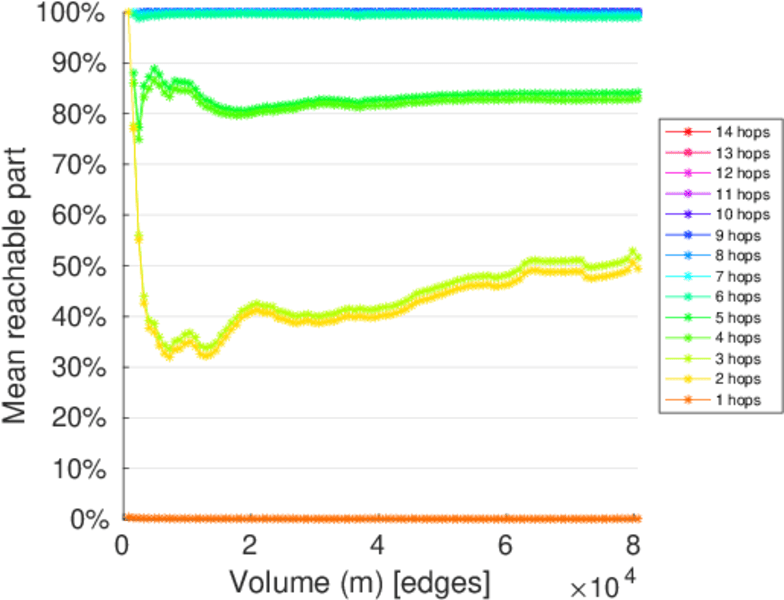
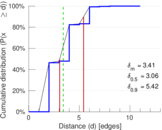
| Diameter | δ = | 13
|
| 50-Percentile effective diameter | δ0.5 = | 3.060 55
|
| 90-Percentile effective diameter | δ0.9 = | 5.420 09
|
| Median distance | δM = | 4
|
| Mean distance | δm = | 3.410 52
|
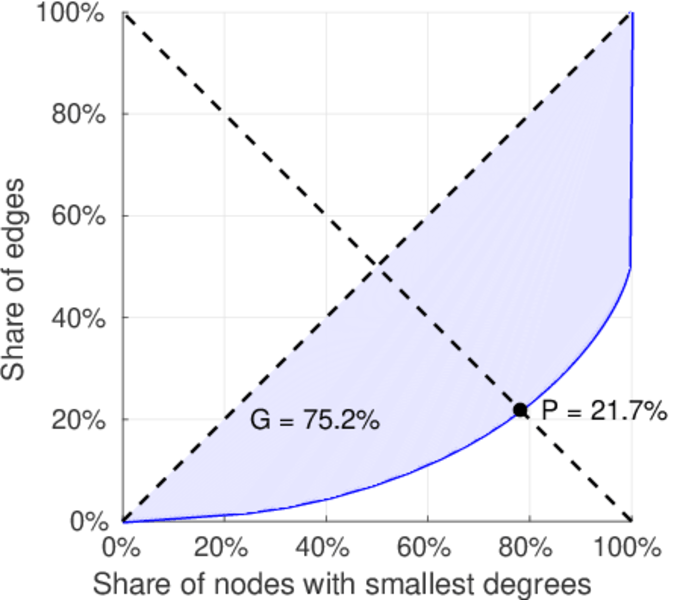
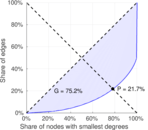
| Gini coefficient | G = | 0.746 697
|
| Balanced inequality ratio | P = | 0.217 773
|
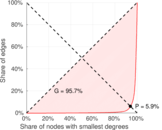
| Left balanced inequality ratio | P1 = | 0.059 033 9
|
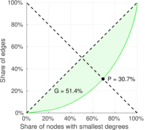
| Right balanced inequality ratio | P2 = | 0.306 691
|
| Relative edge distribution entropy | Her = | 0.719 547
|
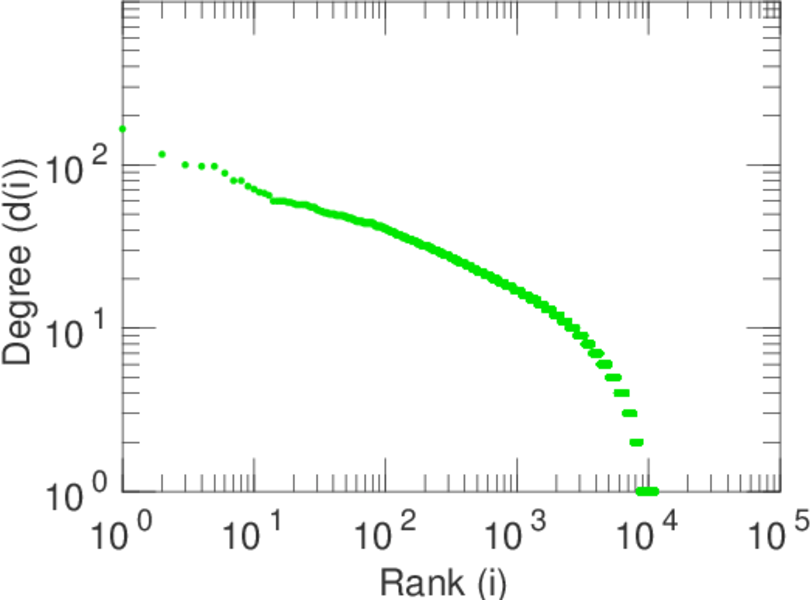
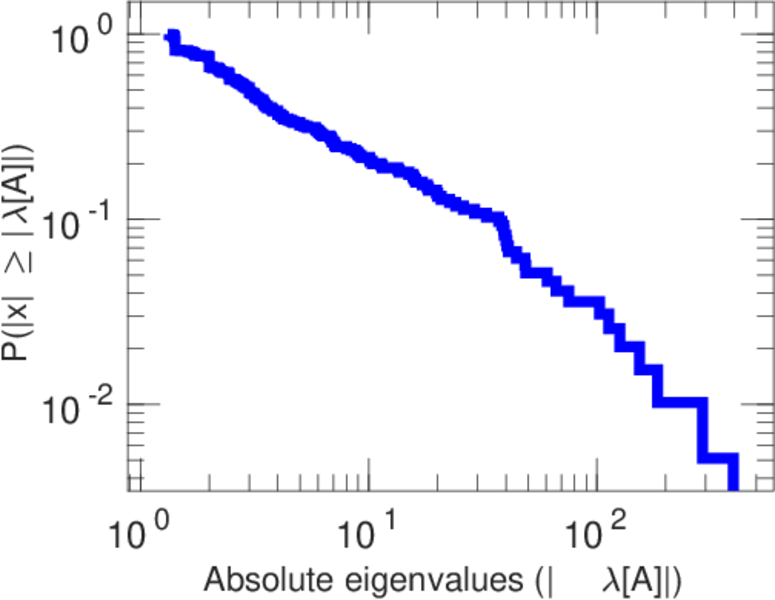
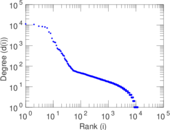
| Power law exponent | γ = | 1.929 60
|
| Tail power law exponent | γt = | 3.731 00
|
| Tail power law exponent with p | γ3 = | 3.731 00
|
| p-value | p = | 0.000 00
|
| Left tail power law exponent with p | γ3,1 = | 1.431 00
|
| Left p-value | p1 = | 0.100 000
|
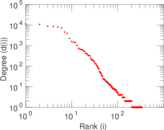
| Right tail power law exponent with p | γ3,2 = | 8.131 00
|
| Right p-value | p2 = | 0.002 000 00
|
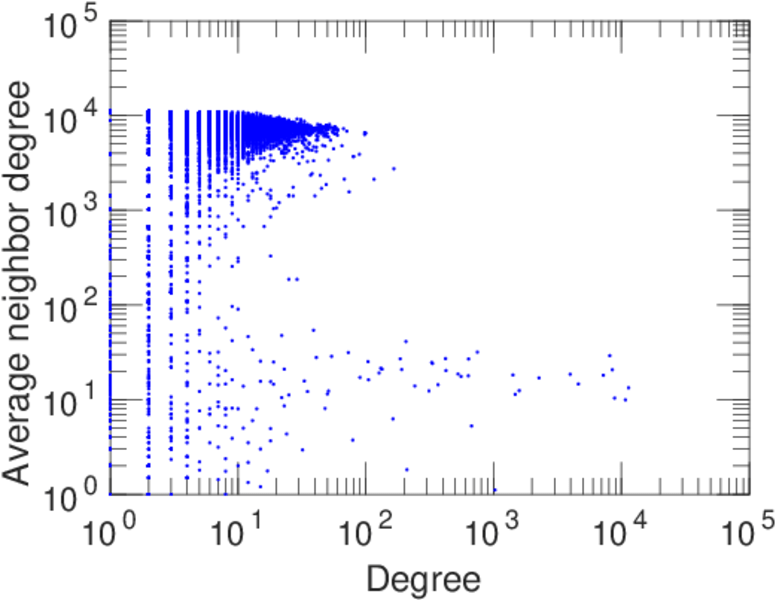
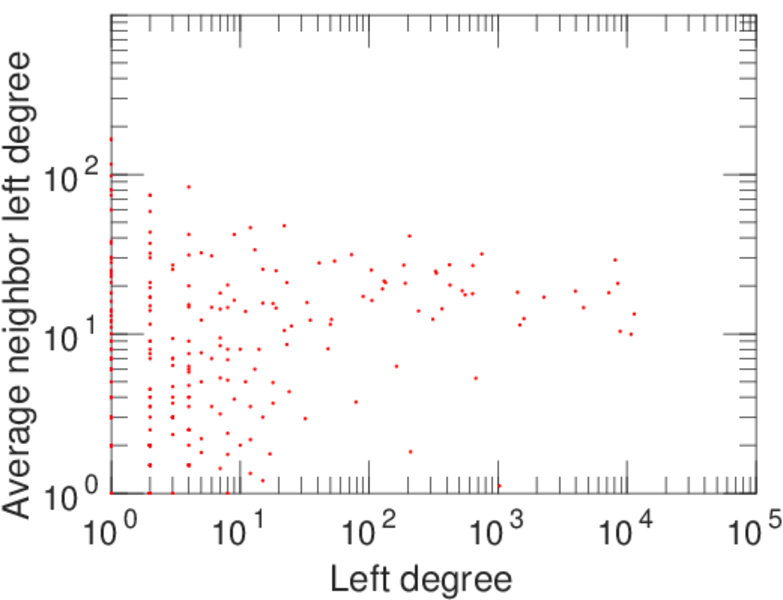
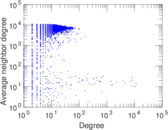
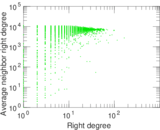
| Degree assortativity | ρ = | −0.113 352
|
| Degree assortativity p-value | pρ = | 2.394 93 × 10−126
|
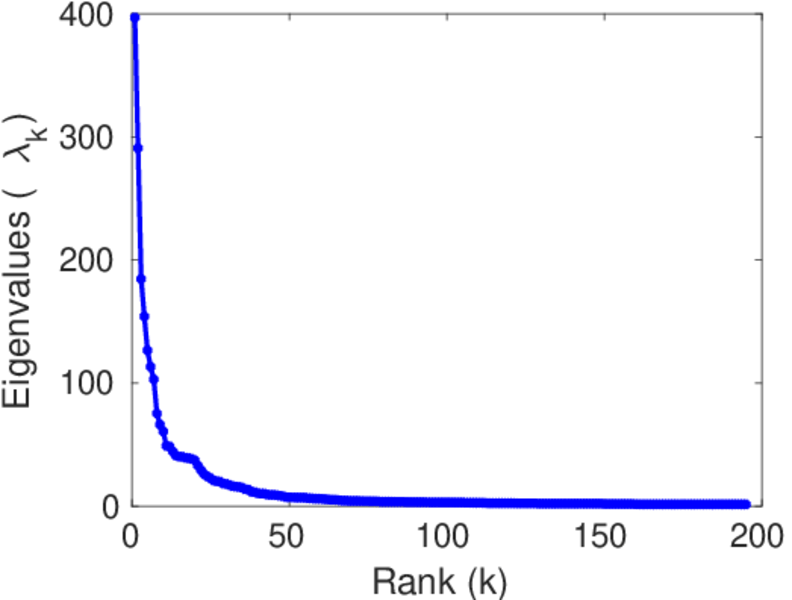
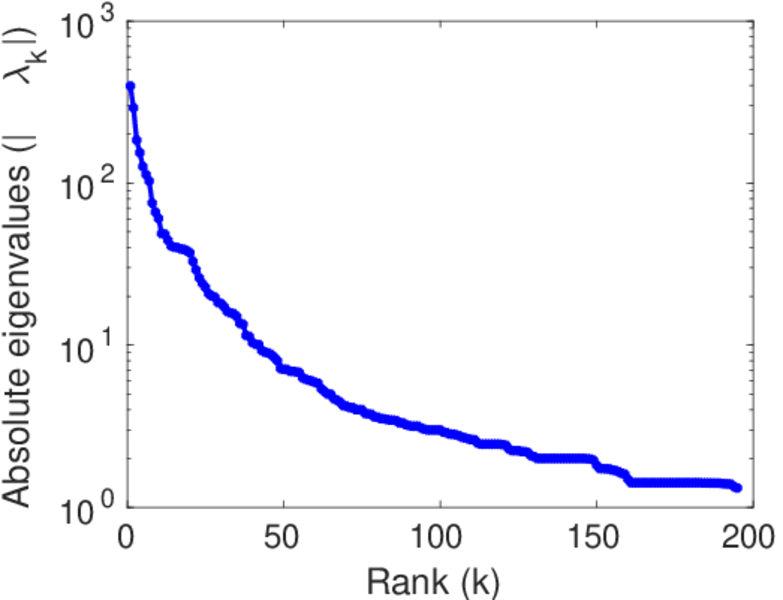
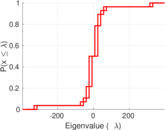
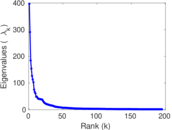
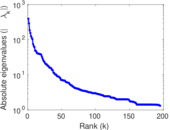
| Spectral norm | α = | 396.754
|
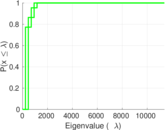
| Algebraic connectivity | a = | 0.009 172 01
|
| Spectral separation | |λ1[A] / λ2[A]| = | 1.364 69
|
| Controllability | C = | 10,940
|
| Relative controllability | Cr = | 0.942 941
|
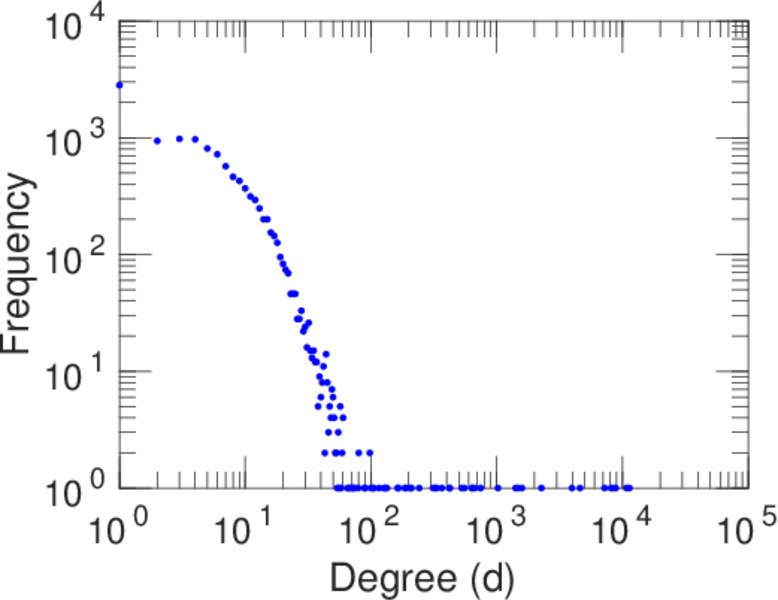
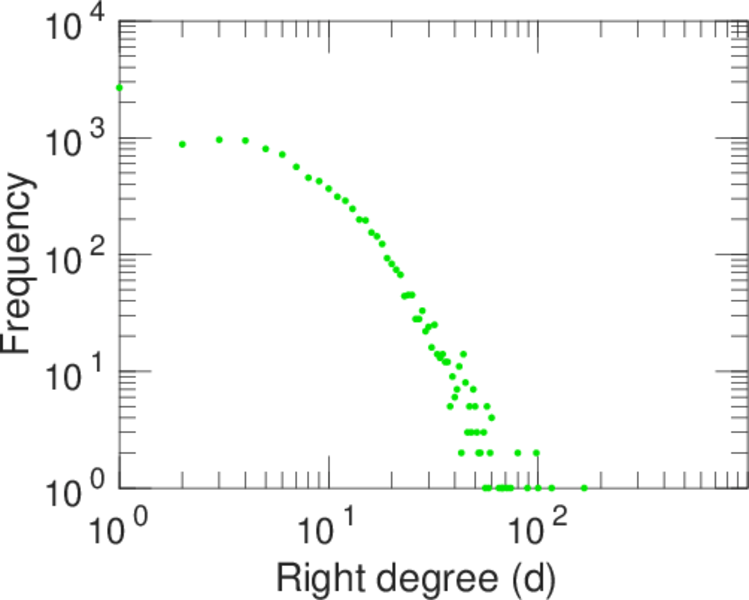
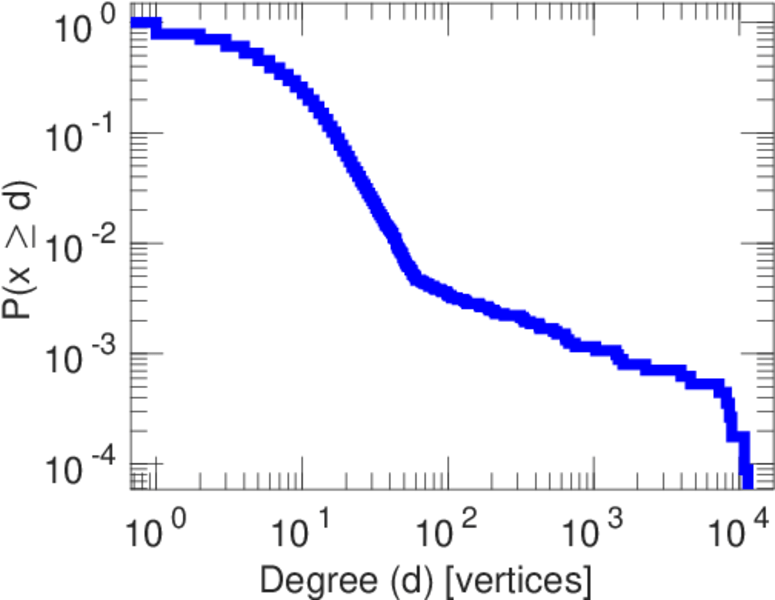
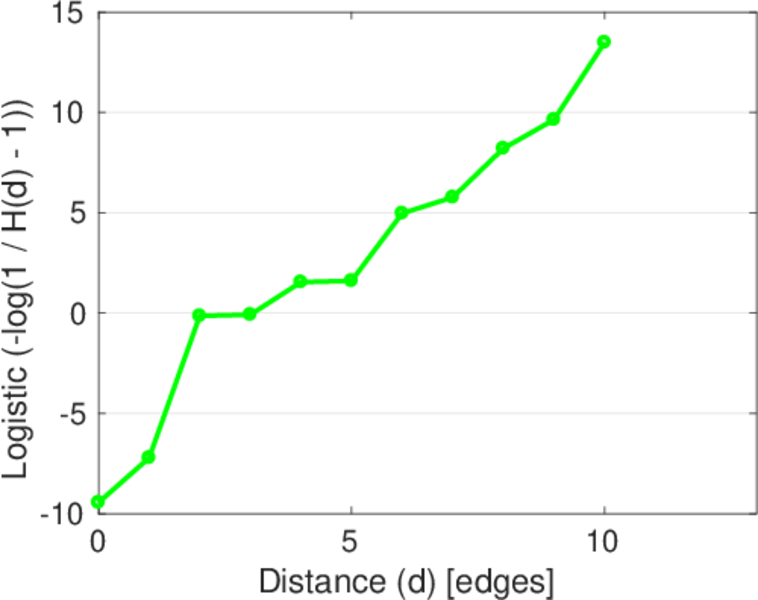
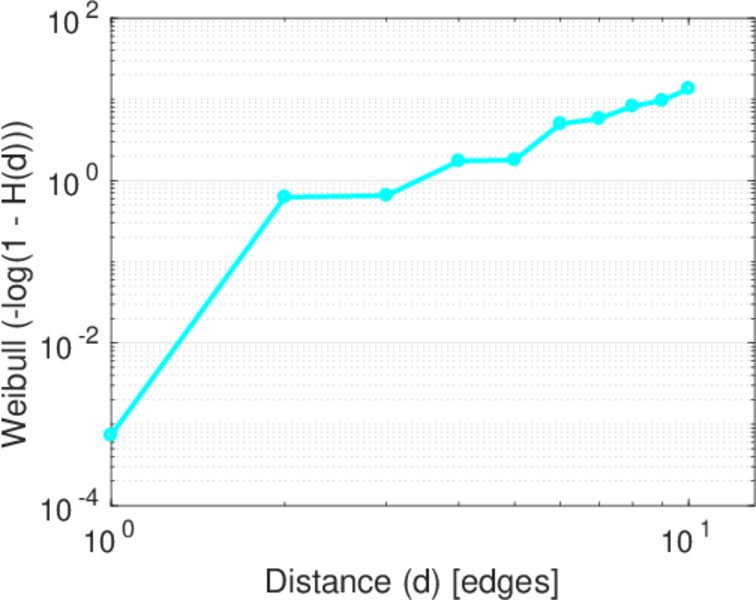
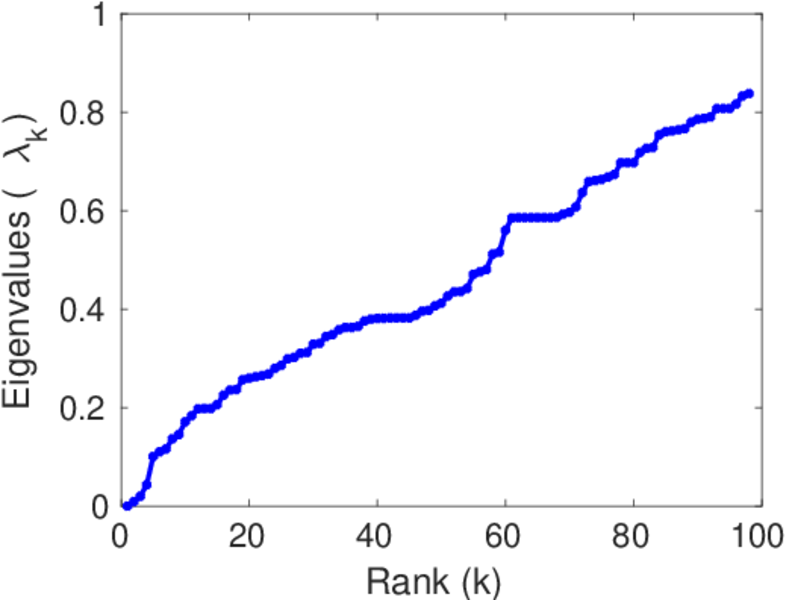
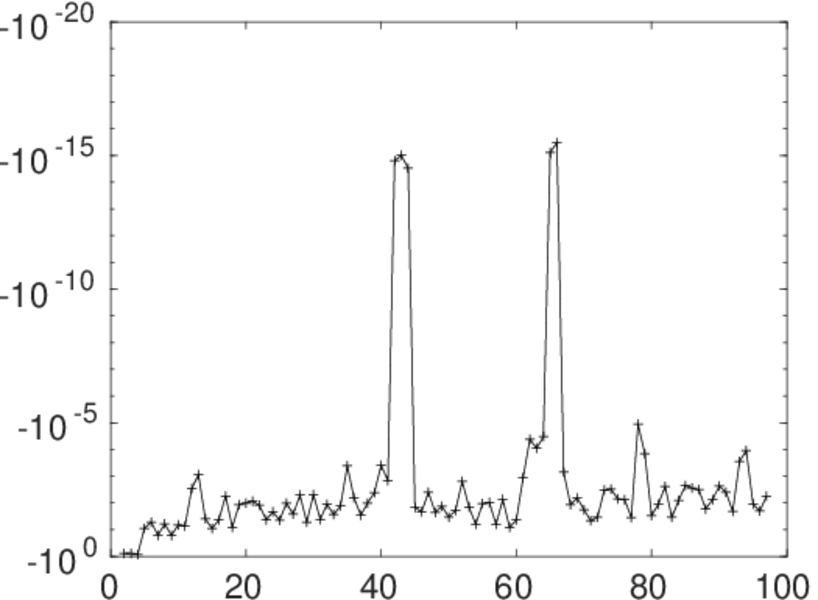
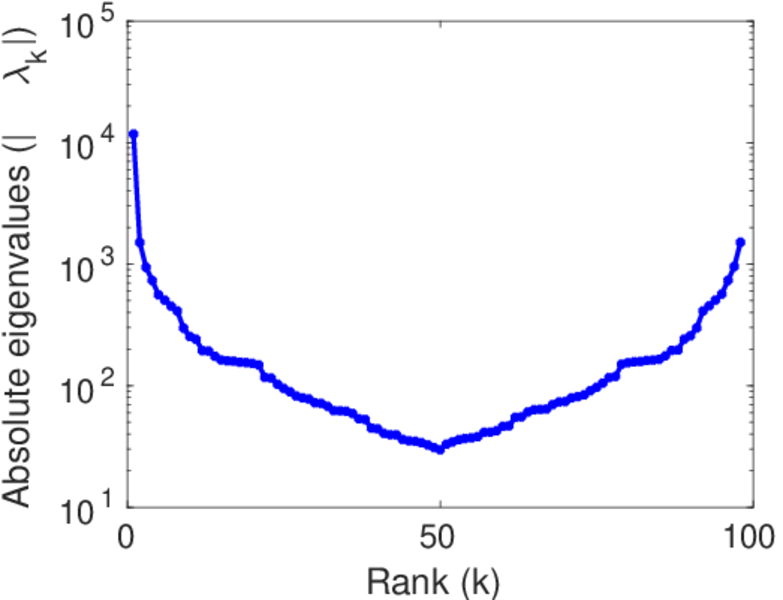
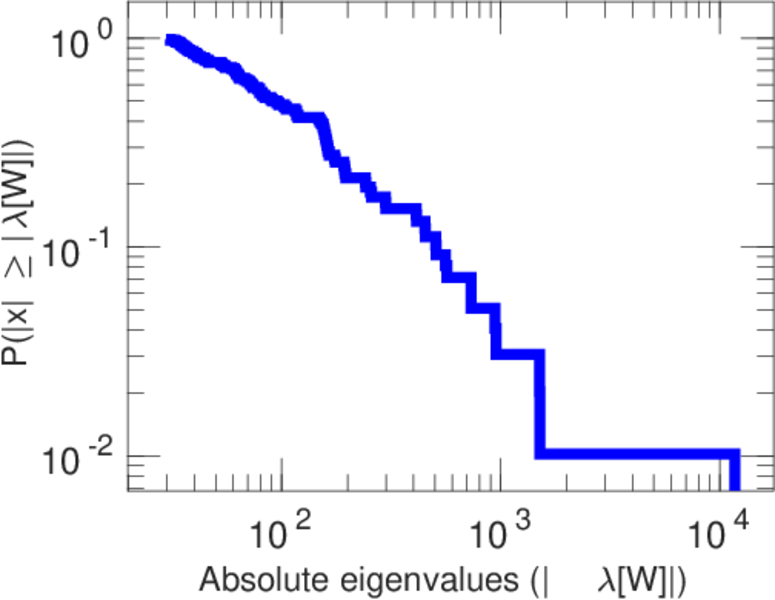
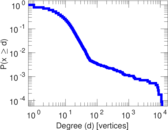
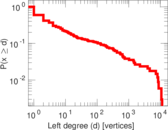
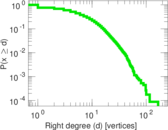
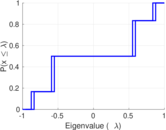
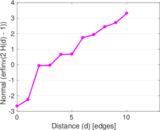
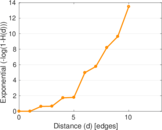
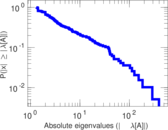
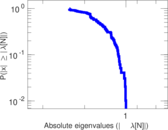
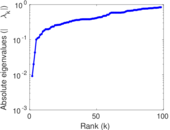
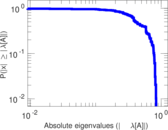
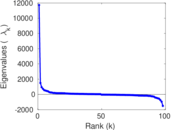
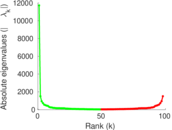
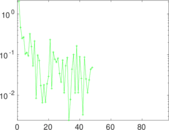
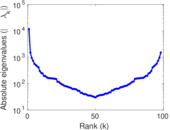
Plots


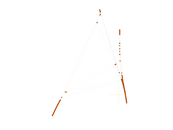
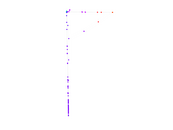
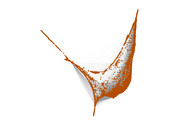
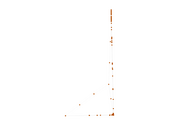
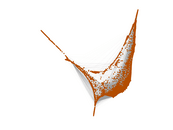


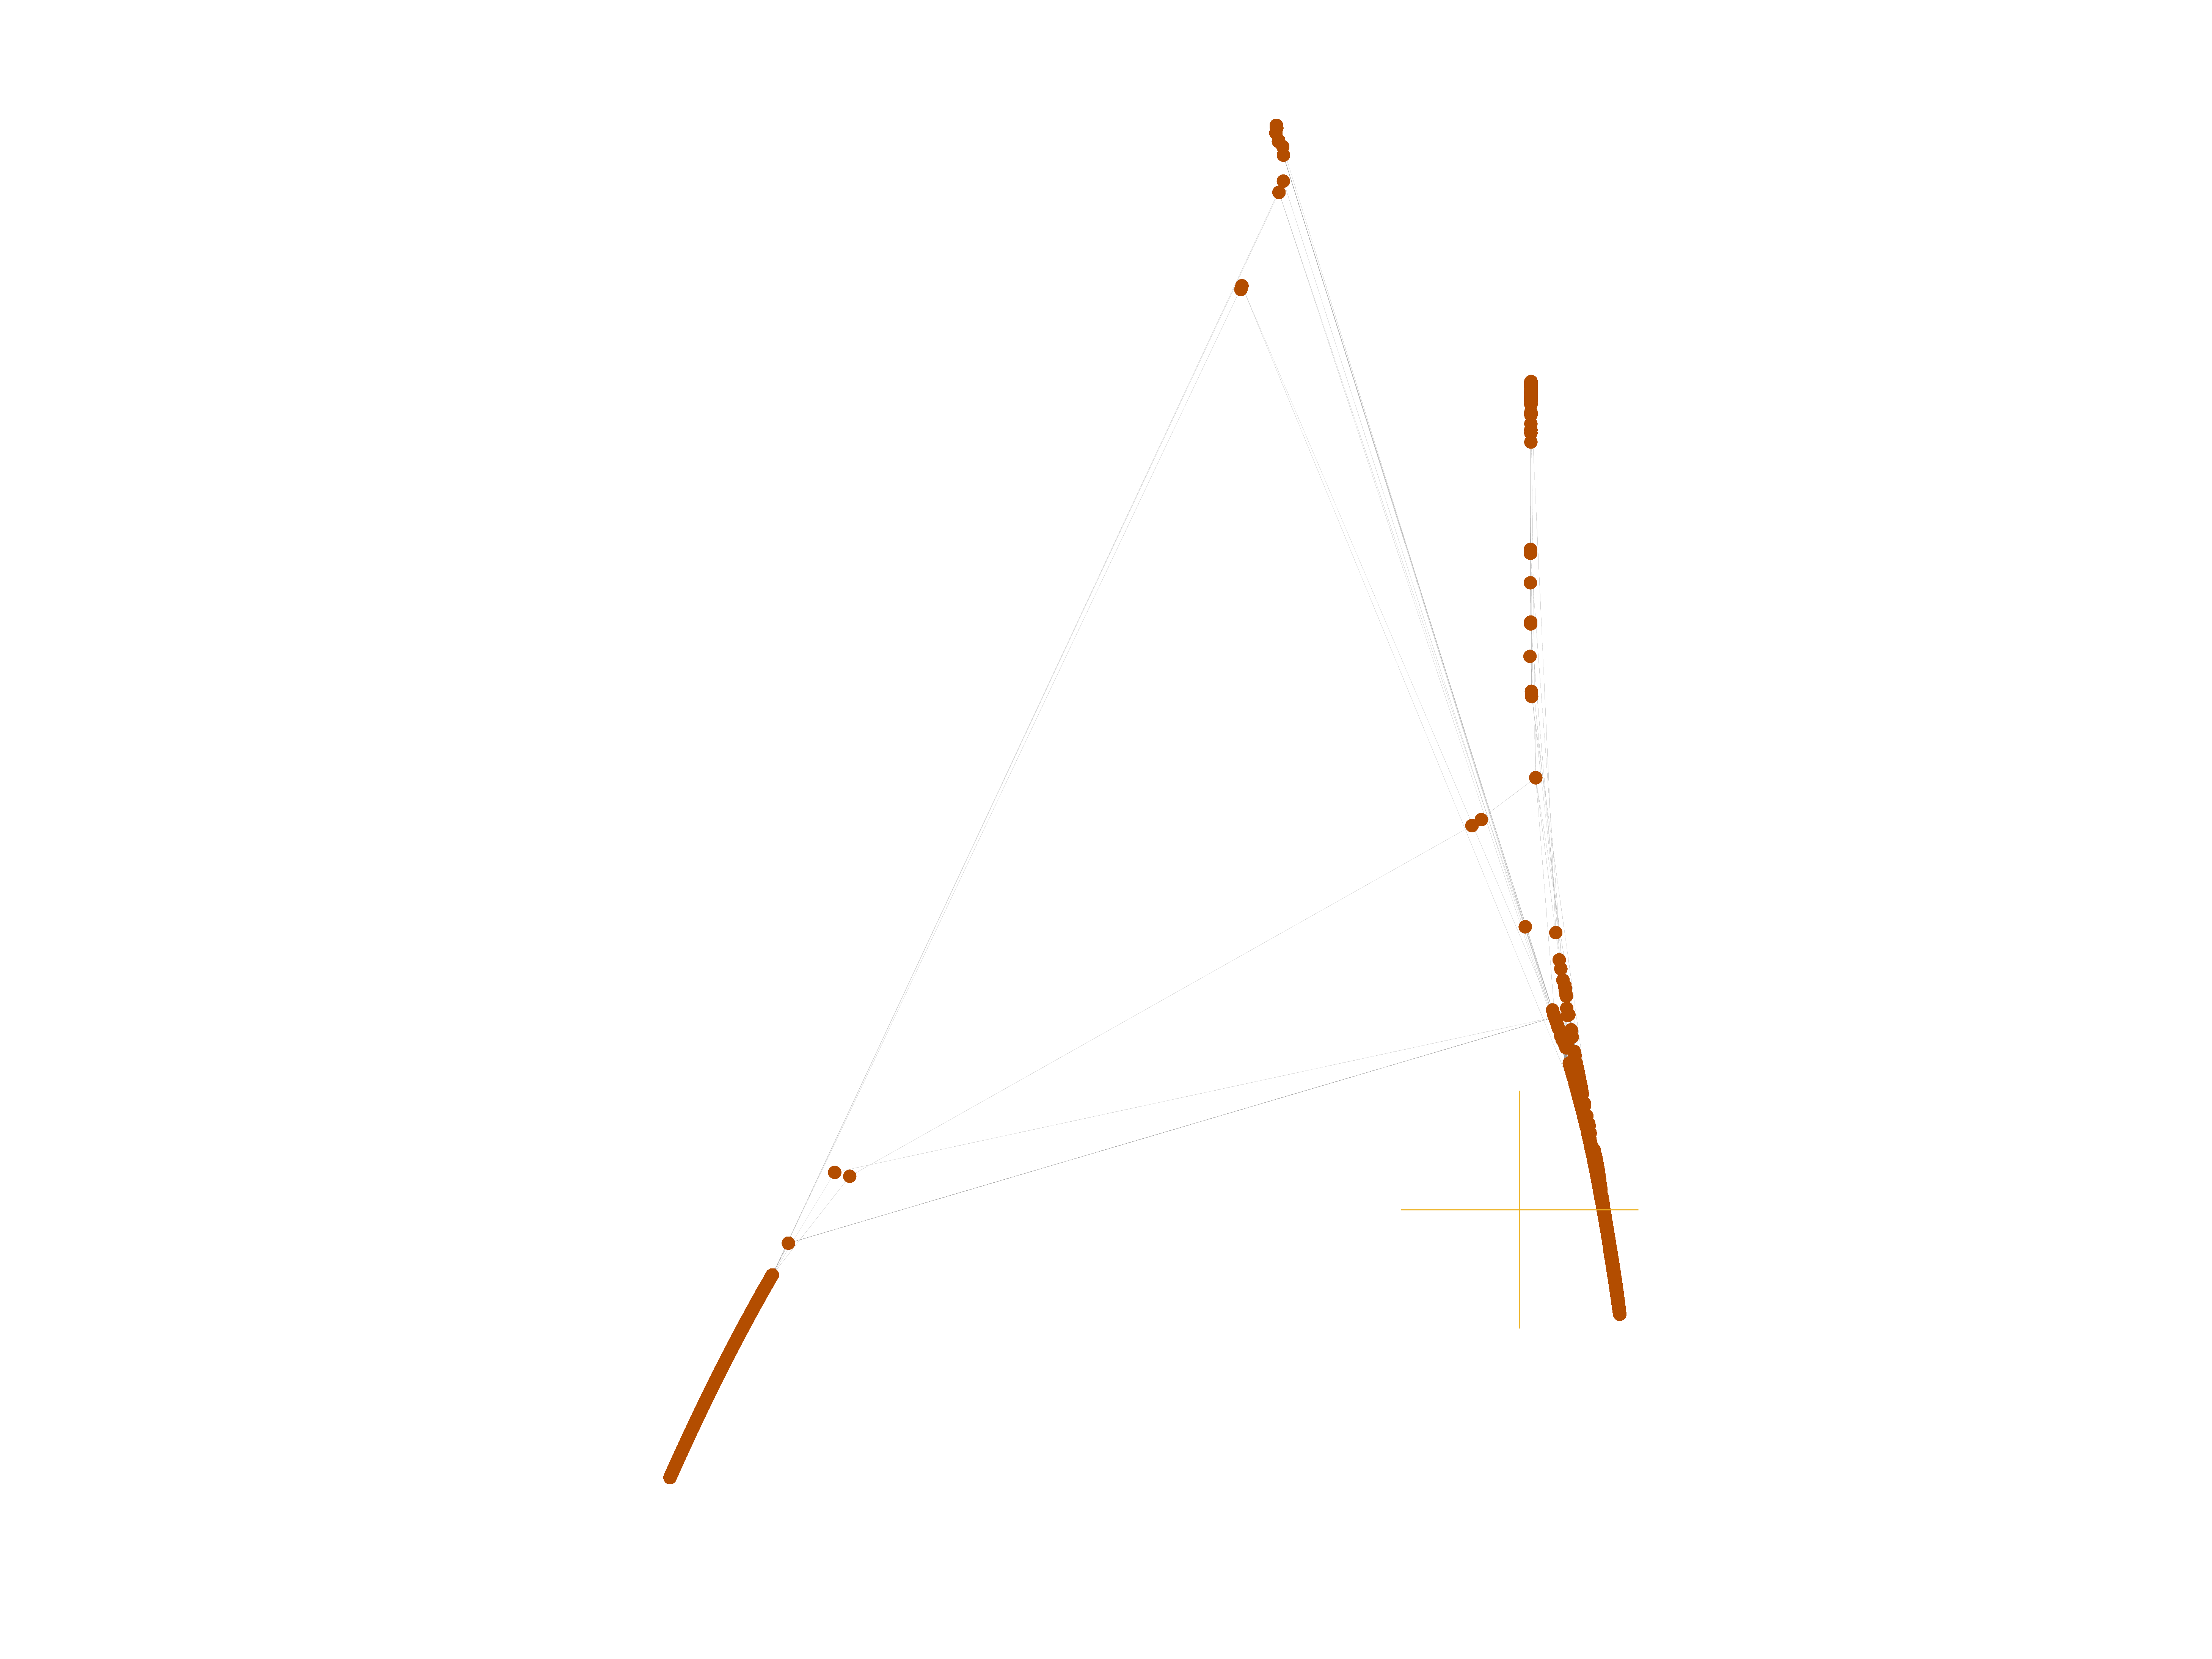
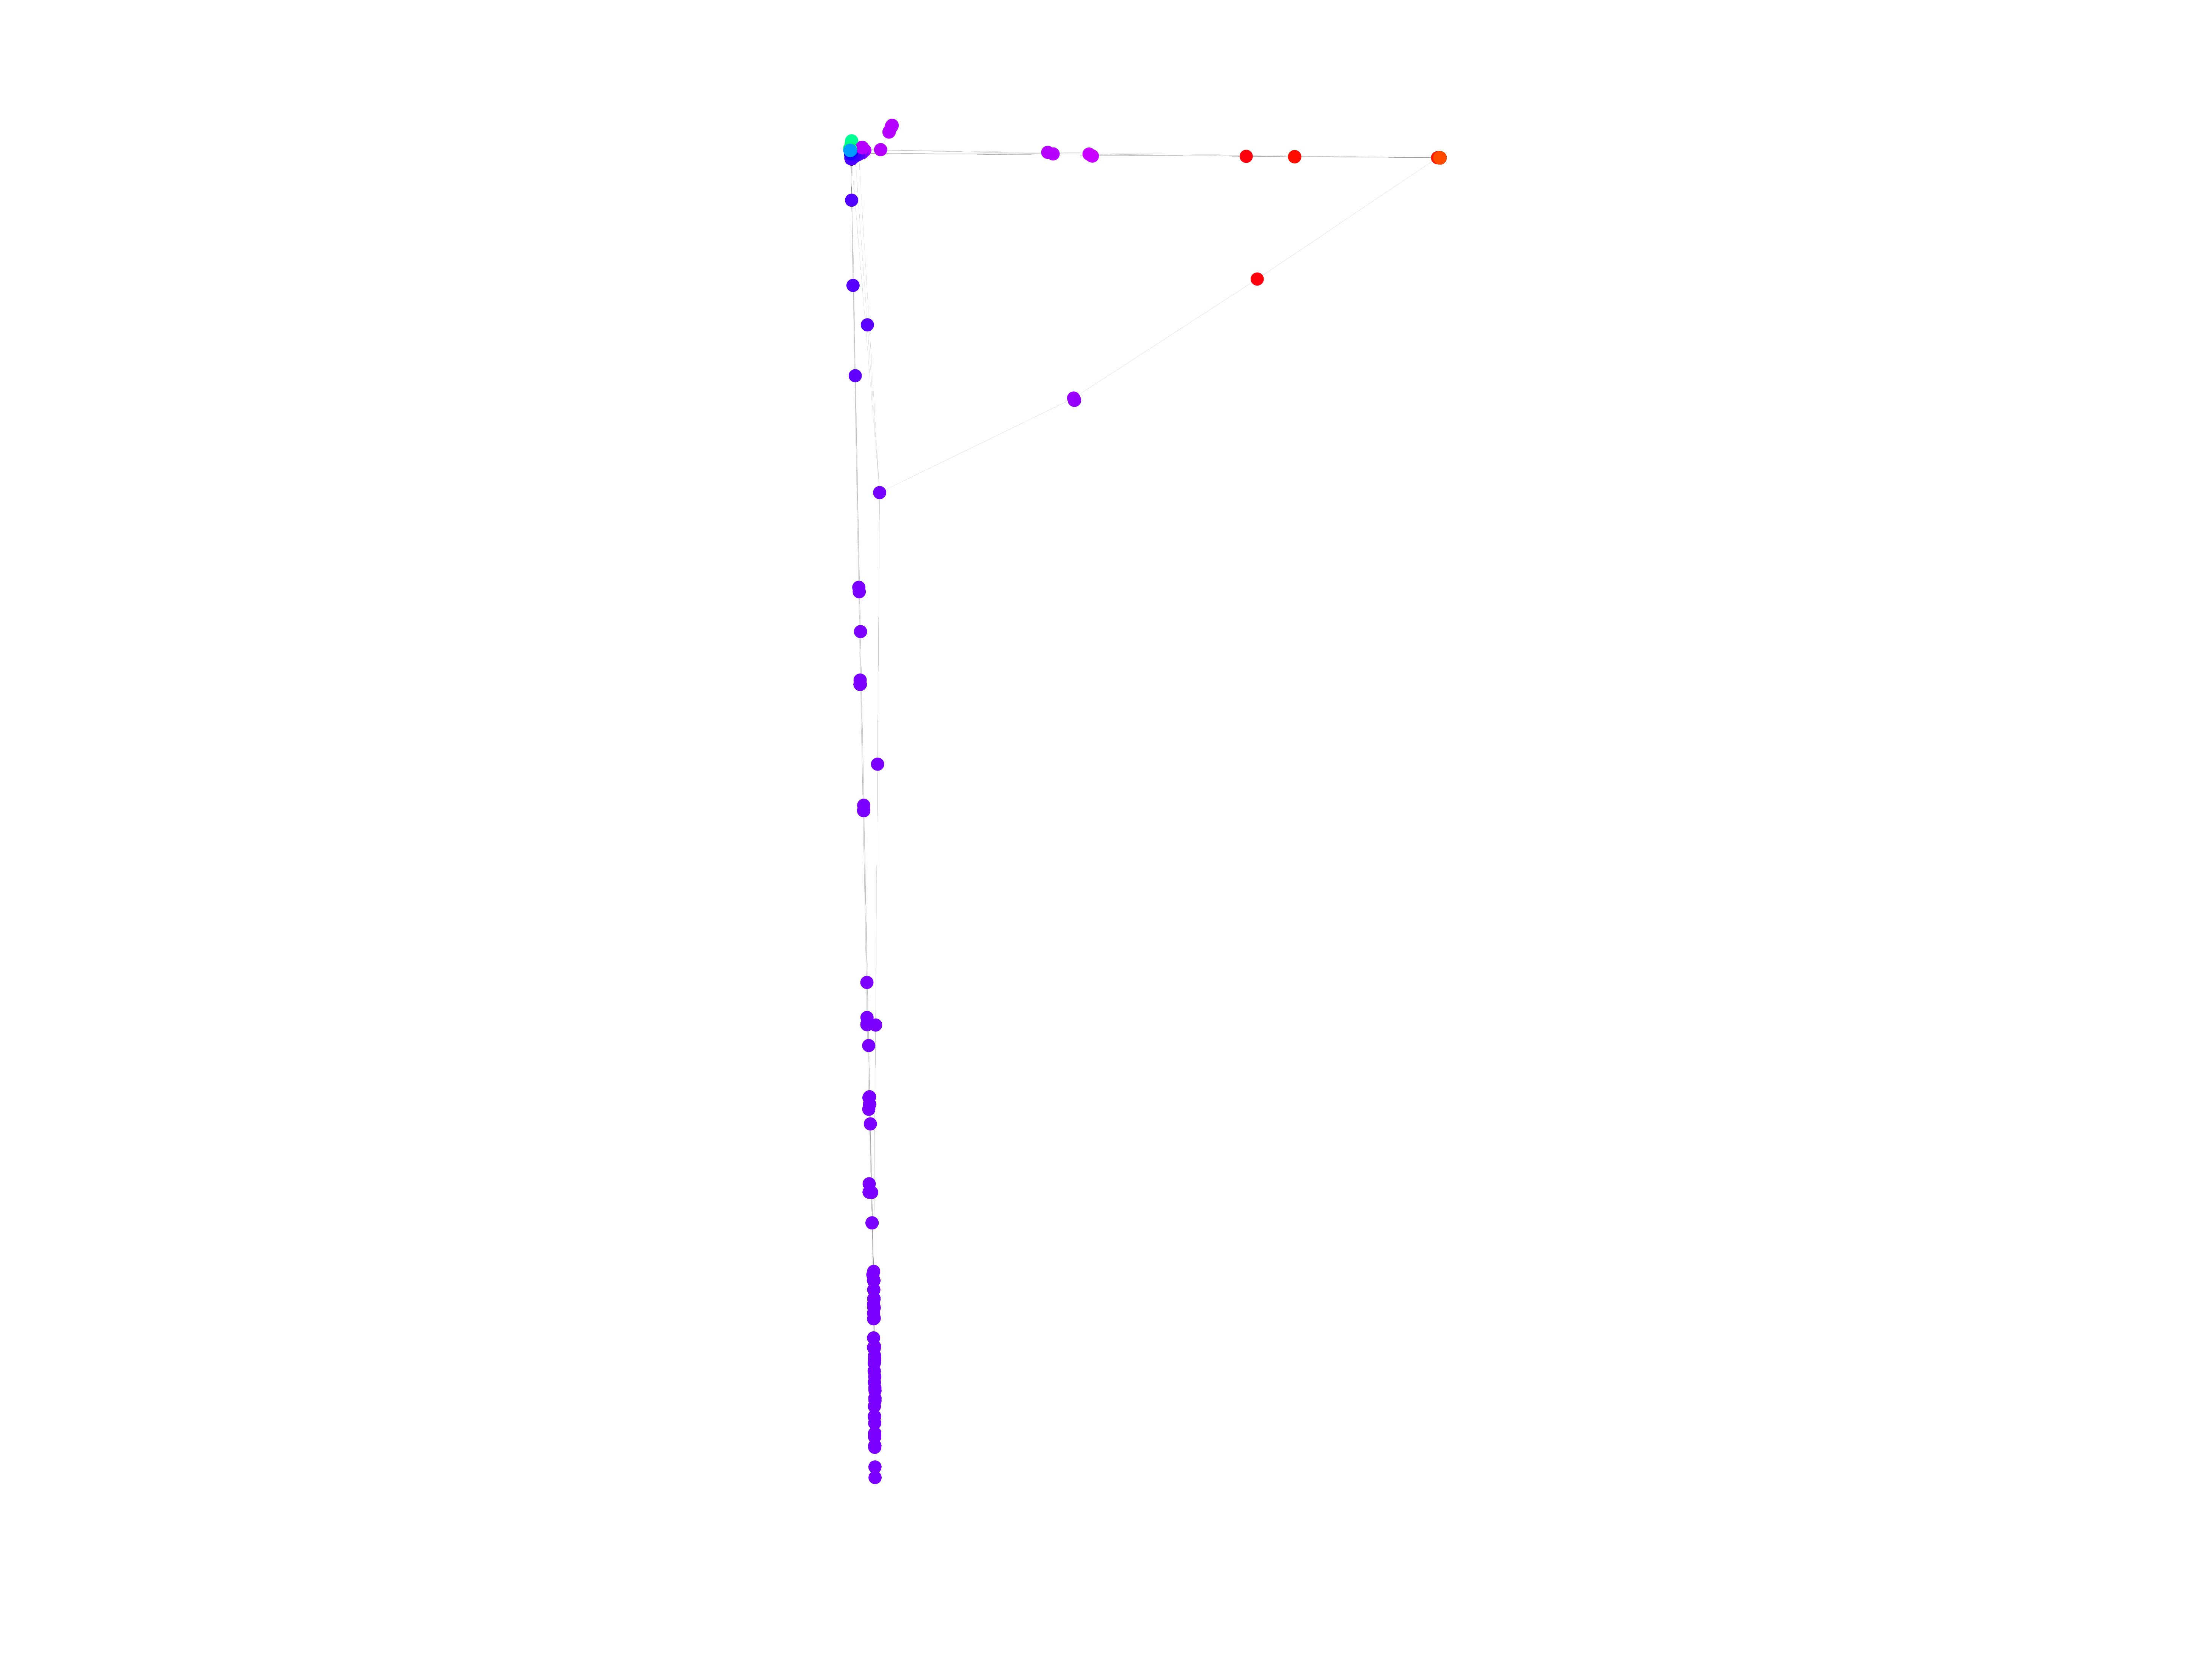
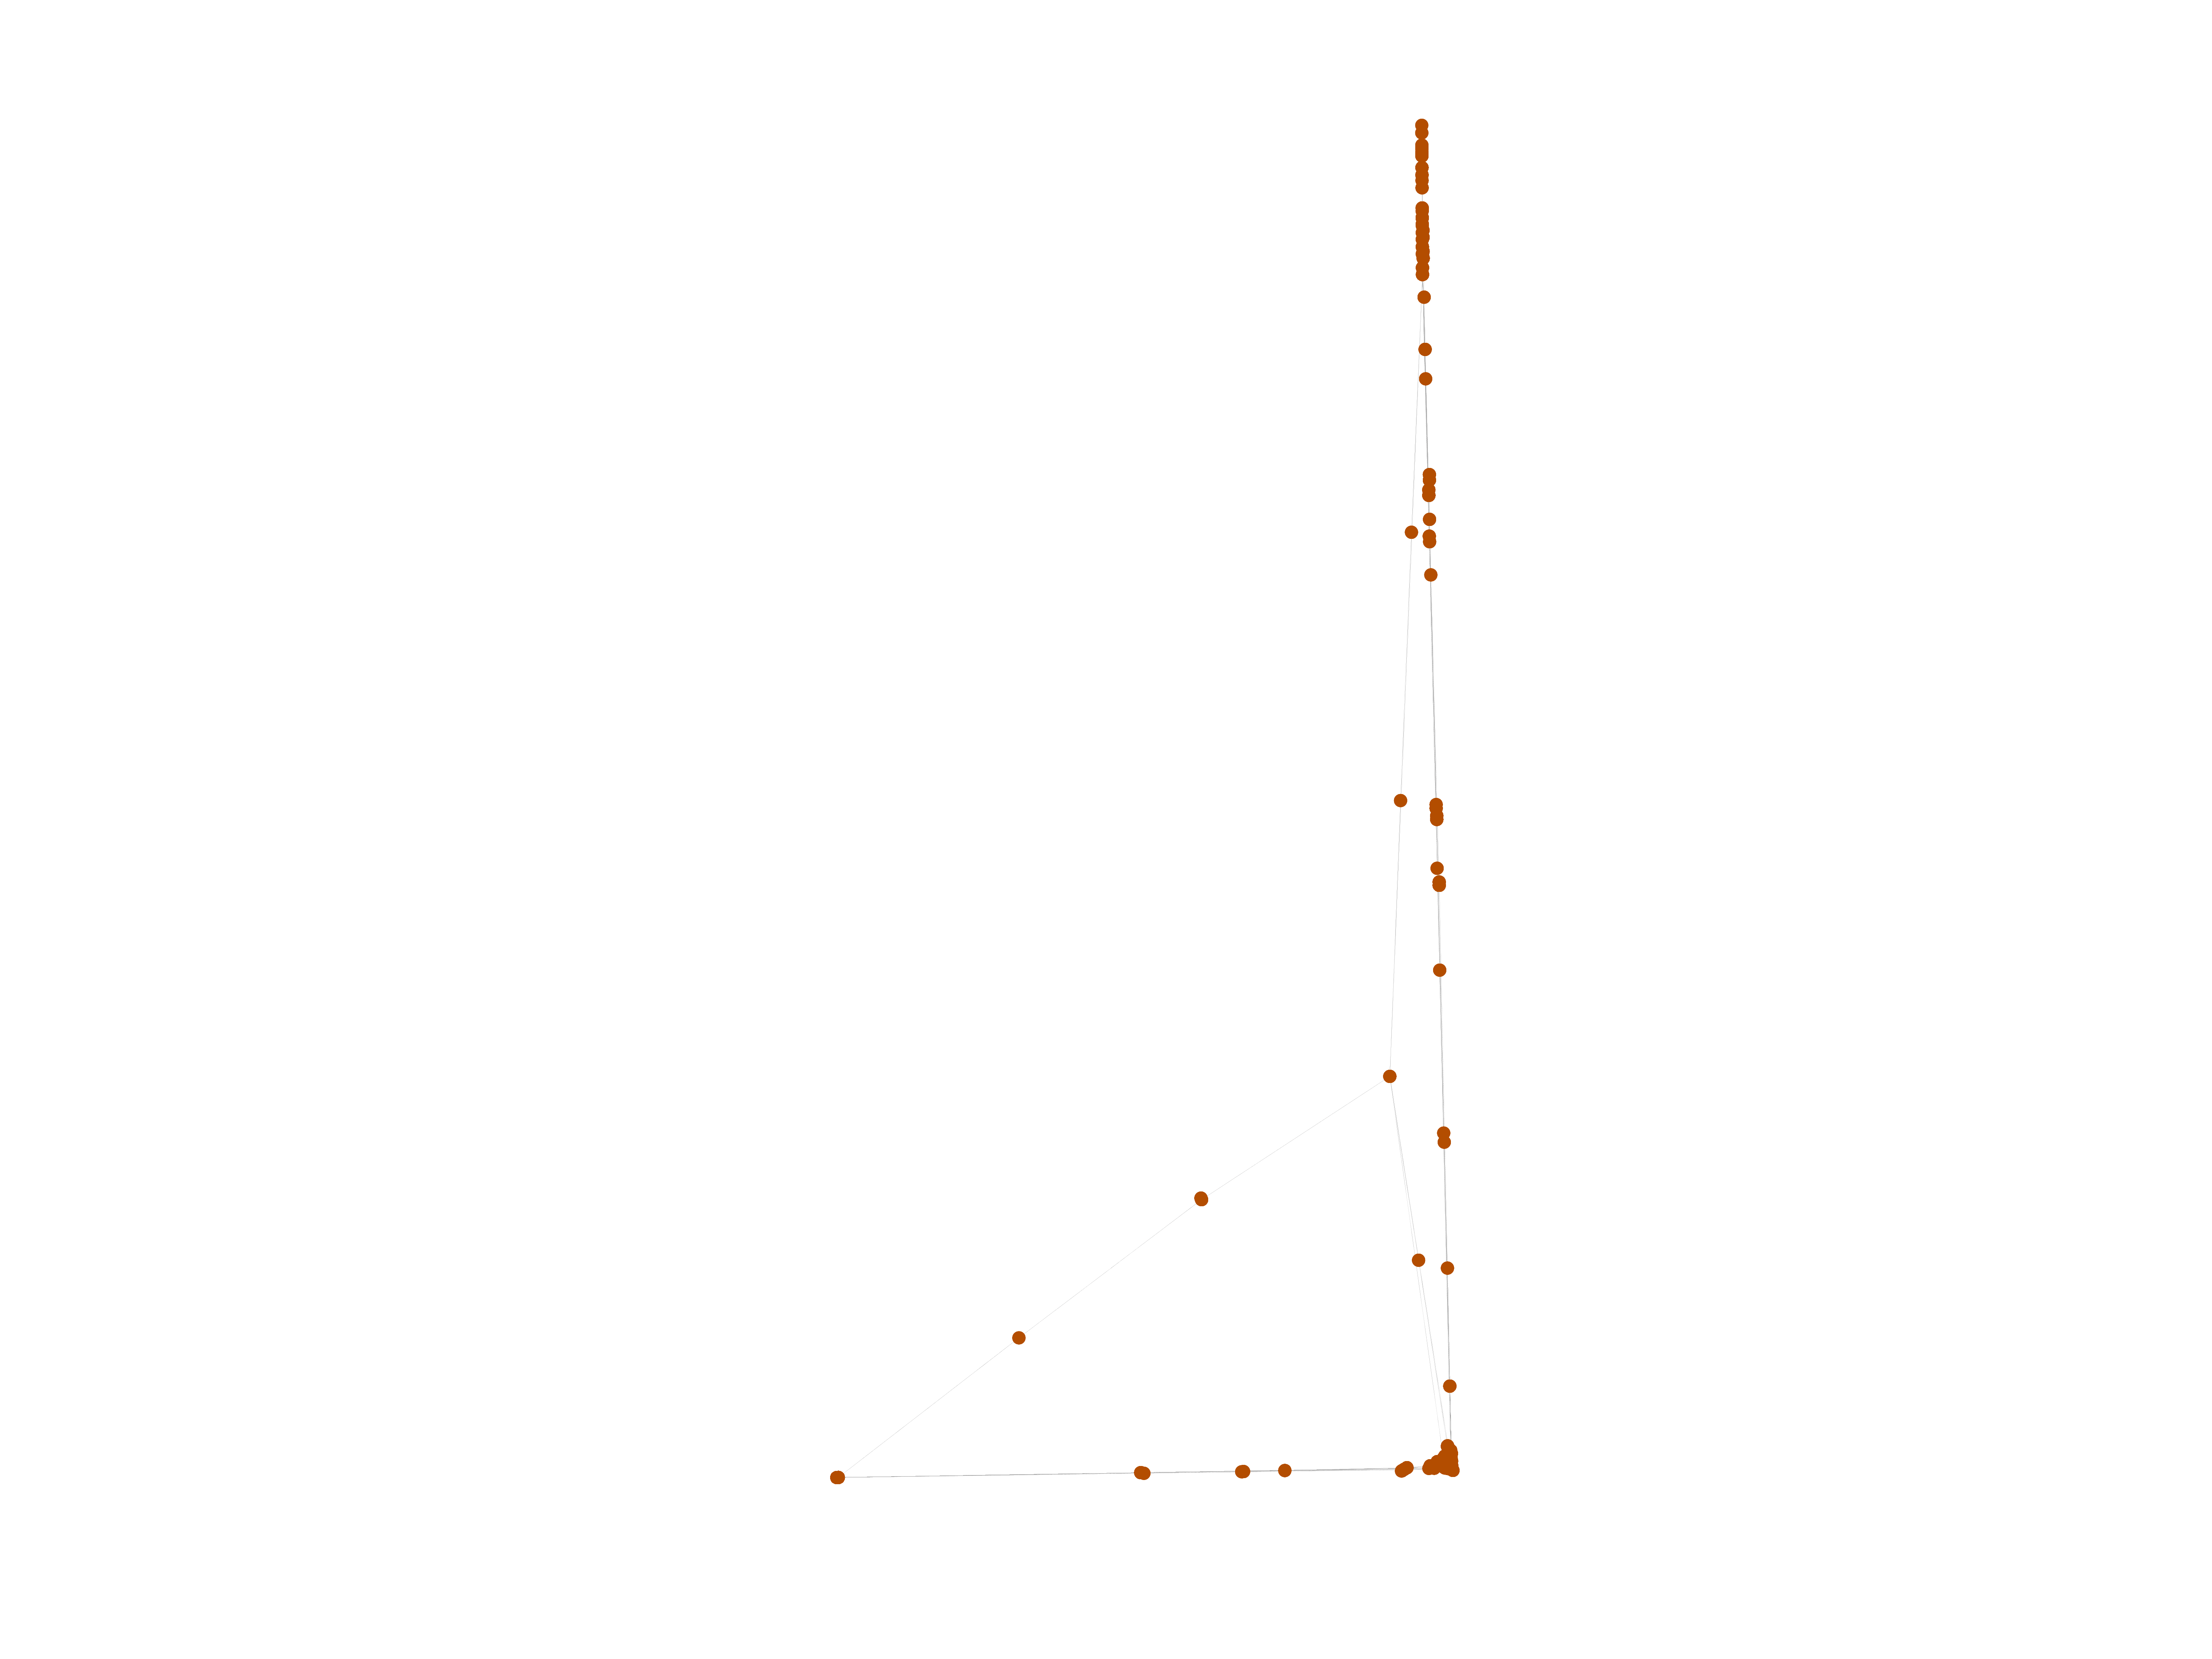
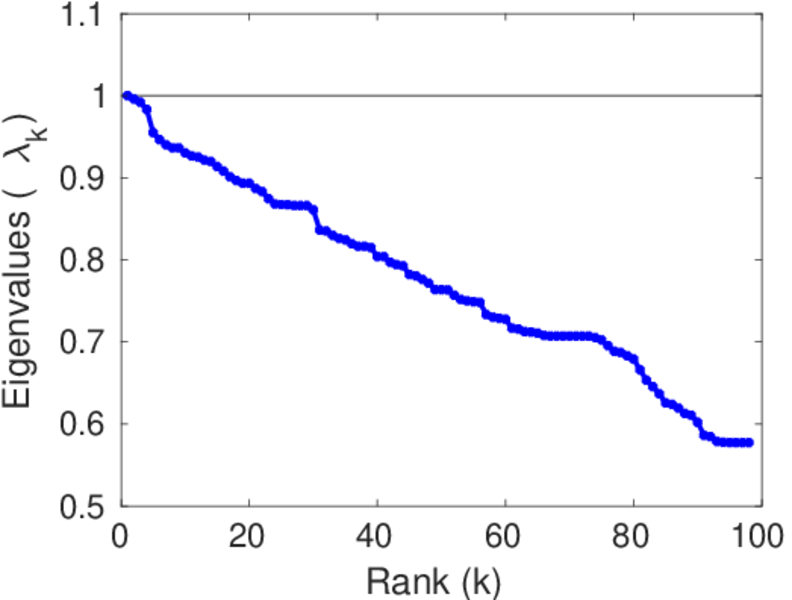
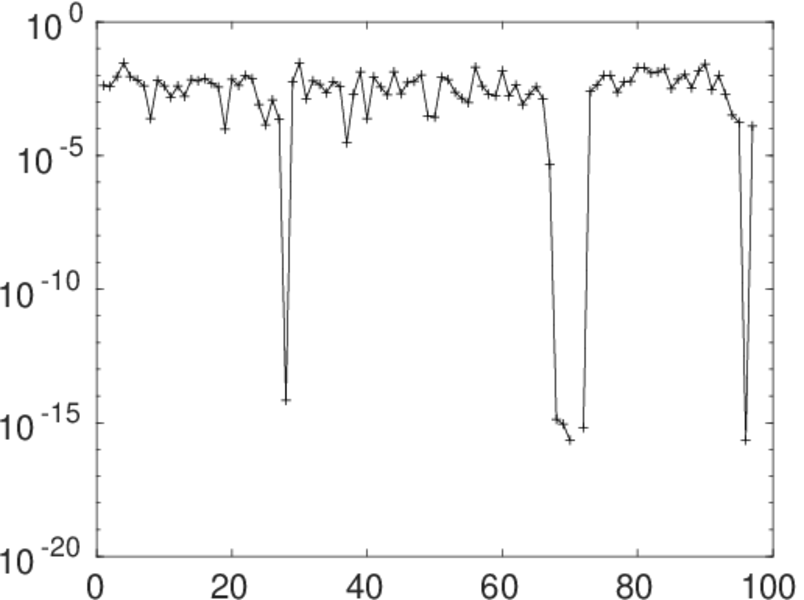
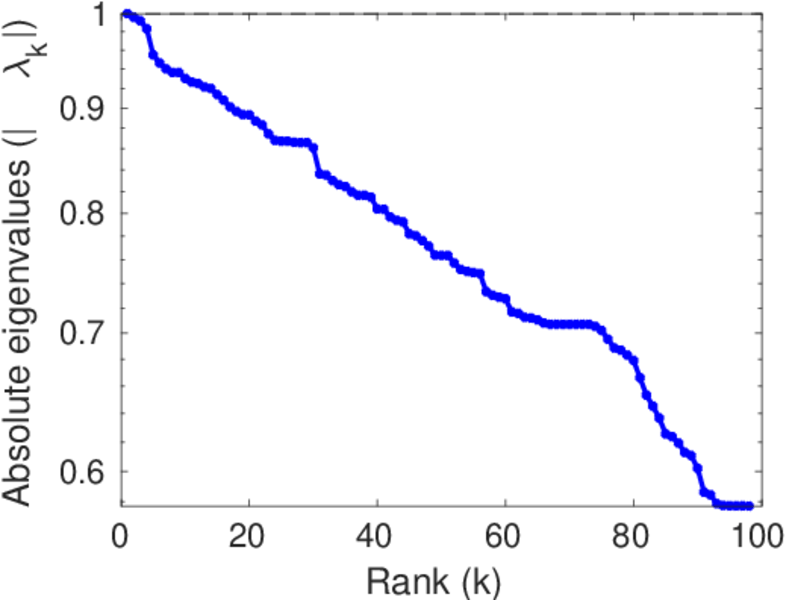
Matrix decompositions plots


Downloads
References
|
[1]
|
Jérôme Kunegis.
KONECT – The Koblenz Network Collection.
In Proc. Int. Conf. on World Wide Web Companion, pages
1343–1350, 2013.
[ http ]
|
|
[2]
|
Wikimedia Foundation.
Wikimedia downloads.
http://dumps.wikimedia.org/, January 2010.
|
 KONECT ‣ Networks ‣
Buy Me a Coffee
KONECT ‣ Networks ‣
Buy Me a Coffee