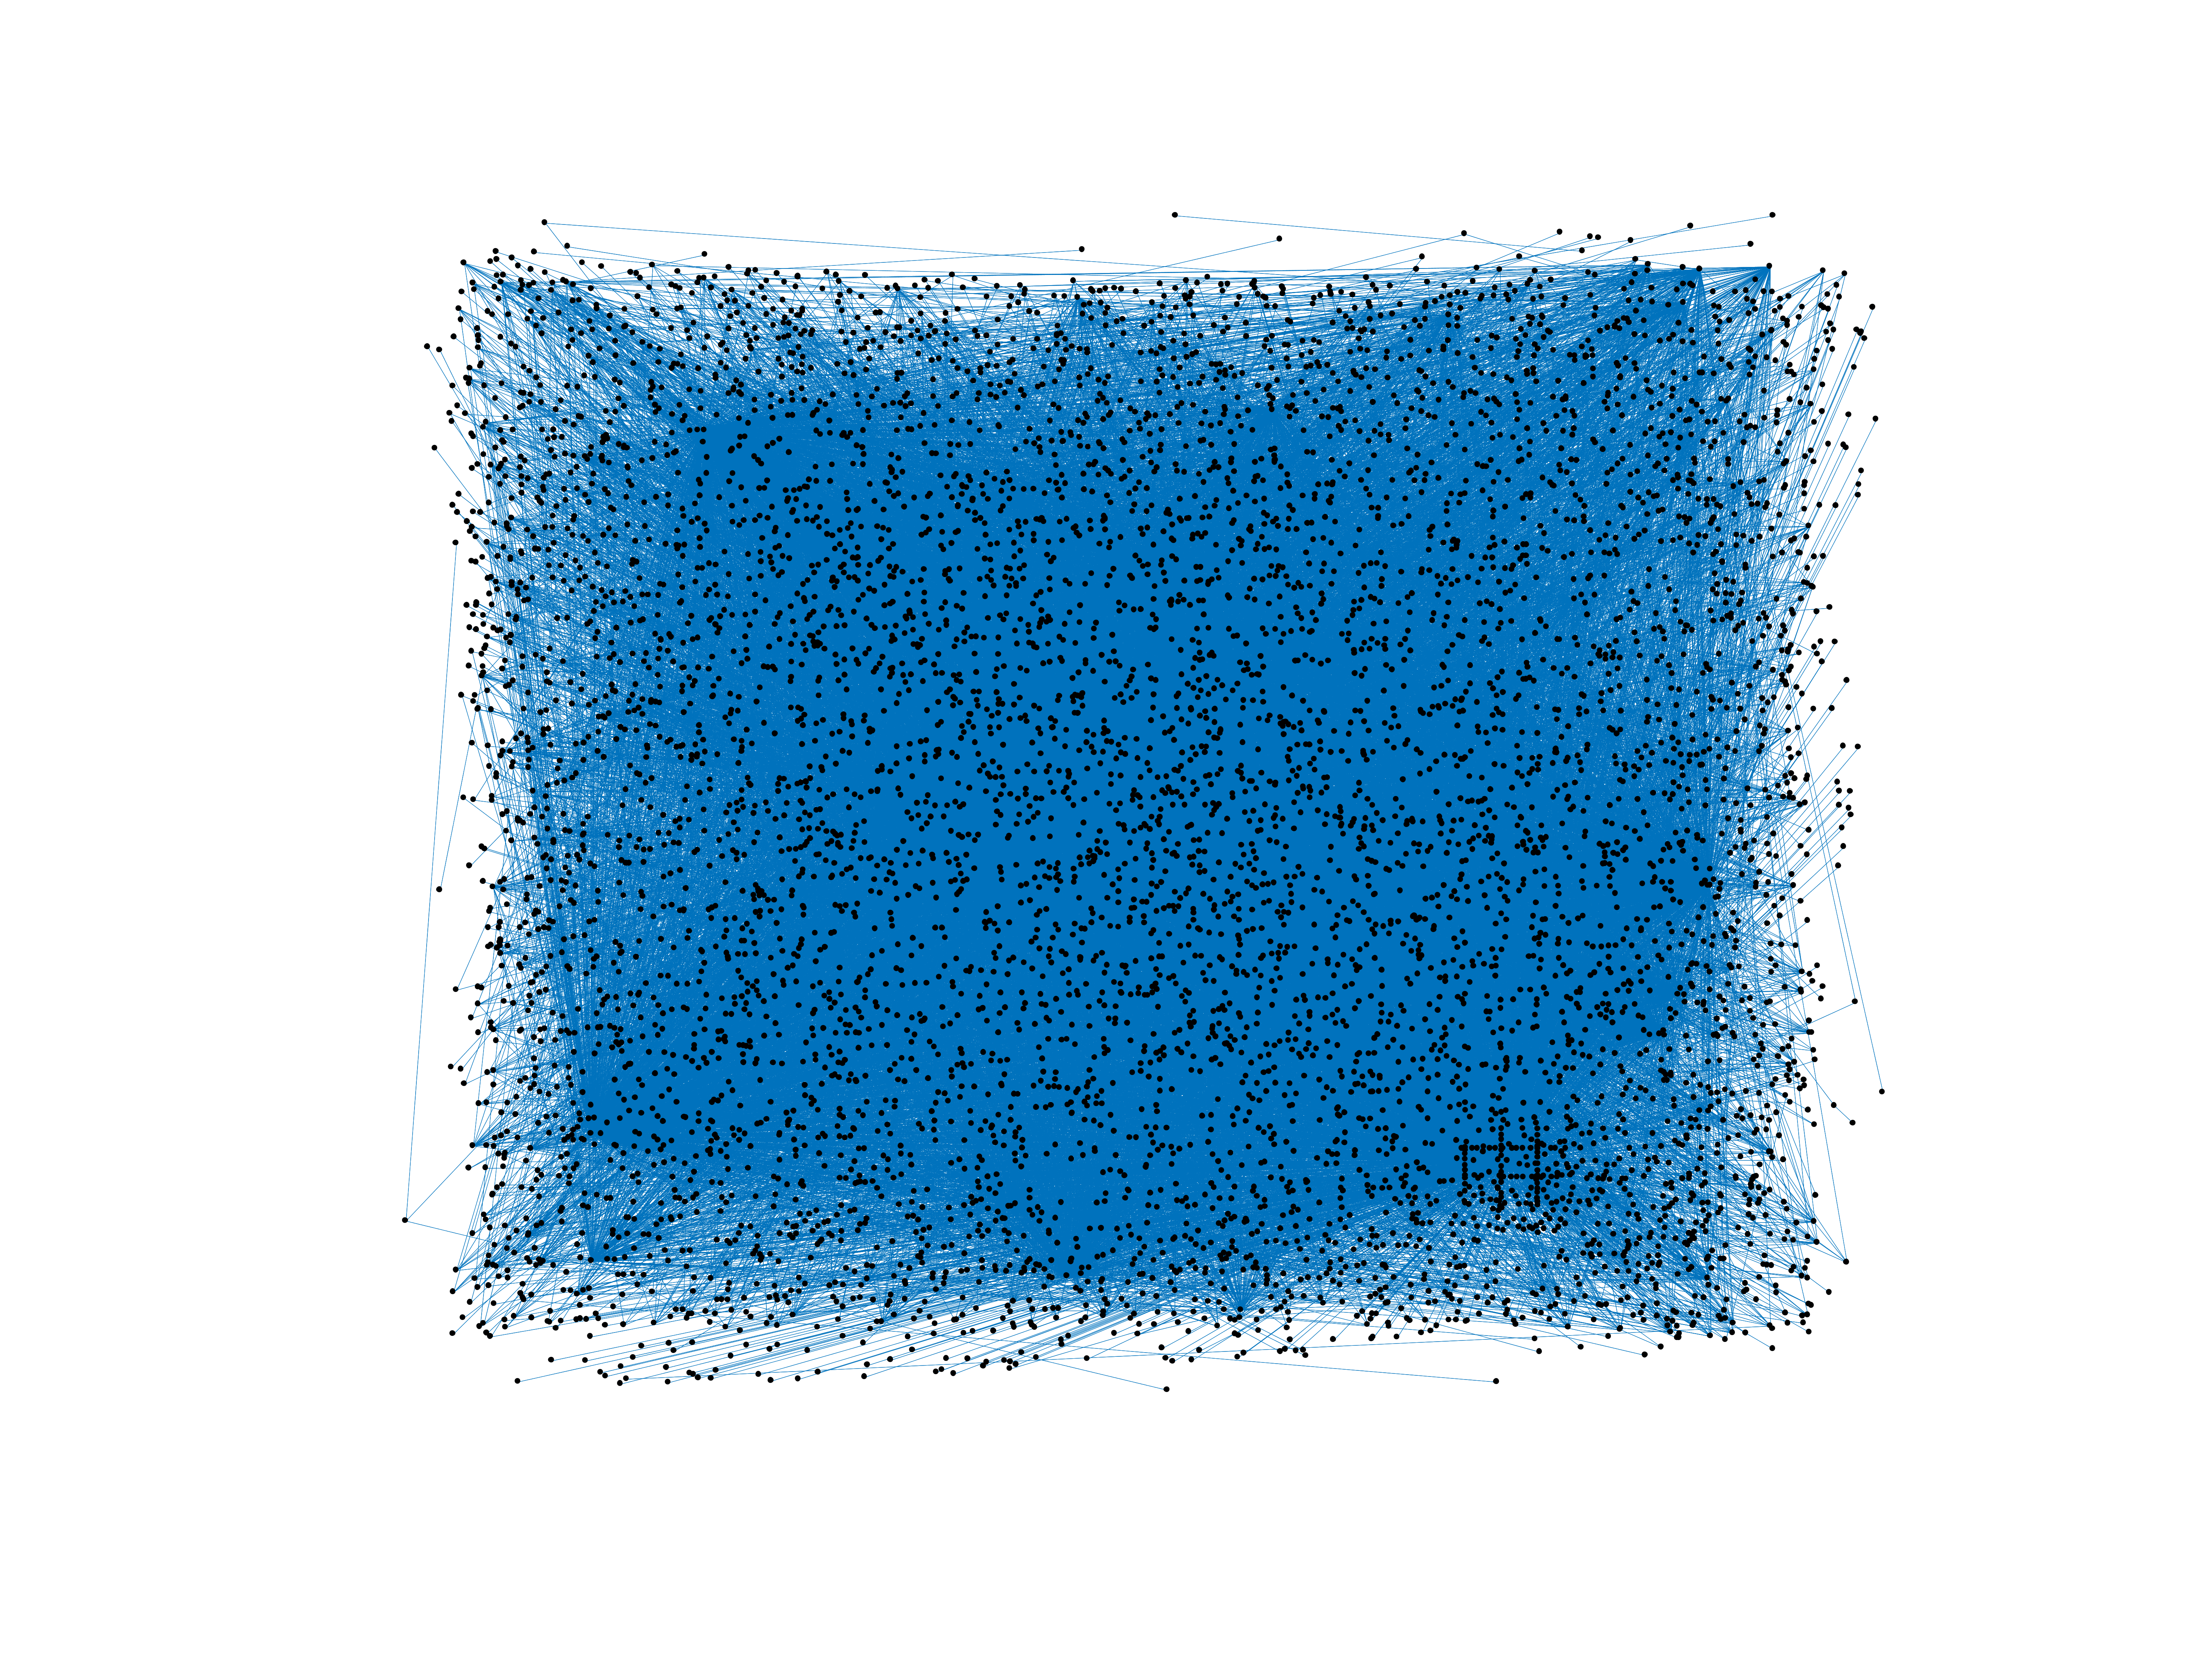
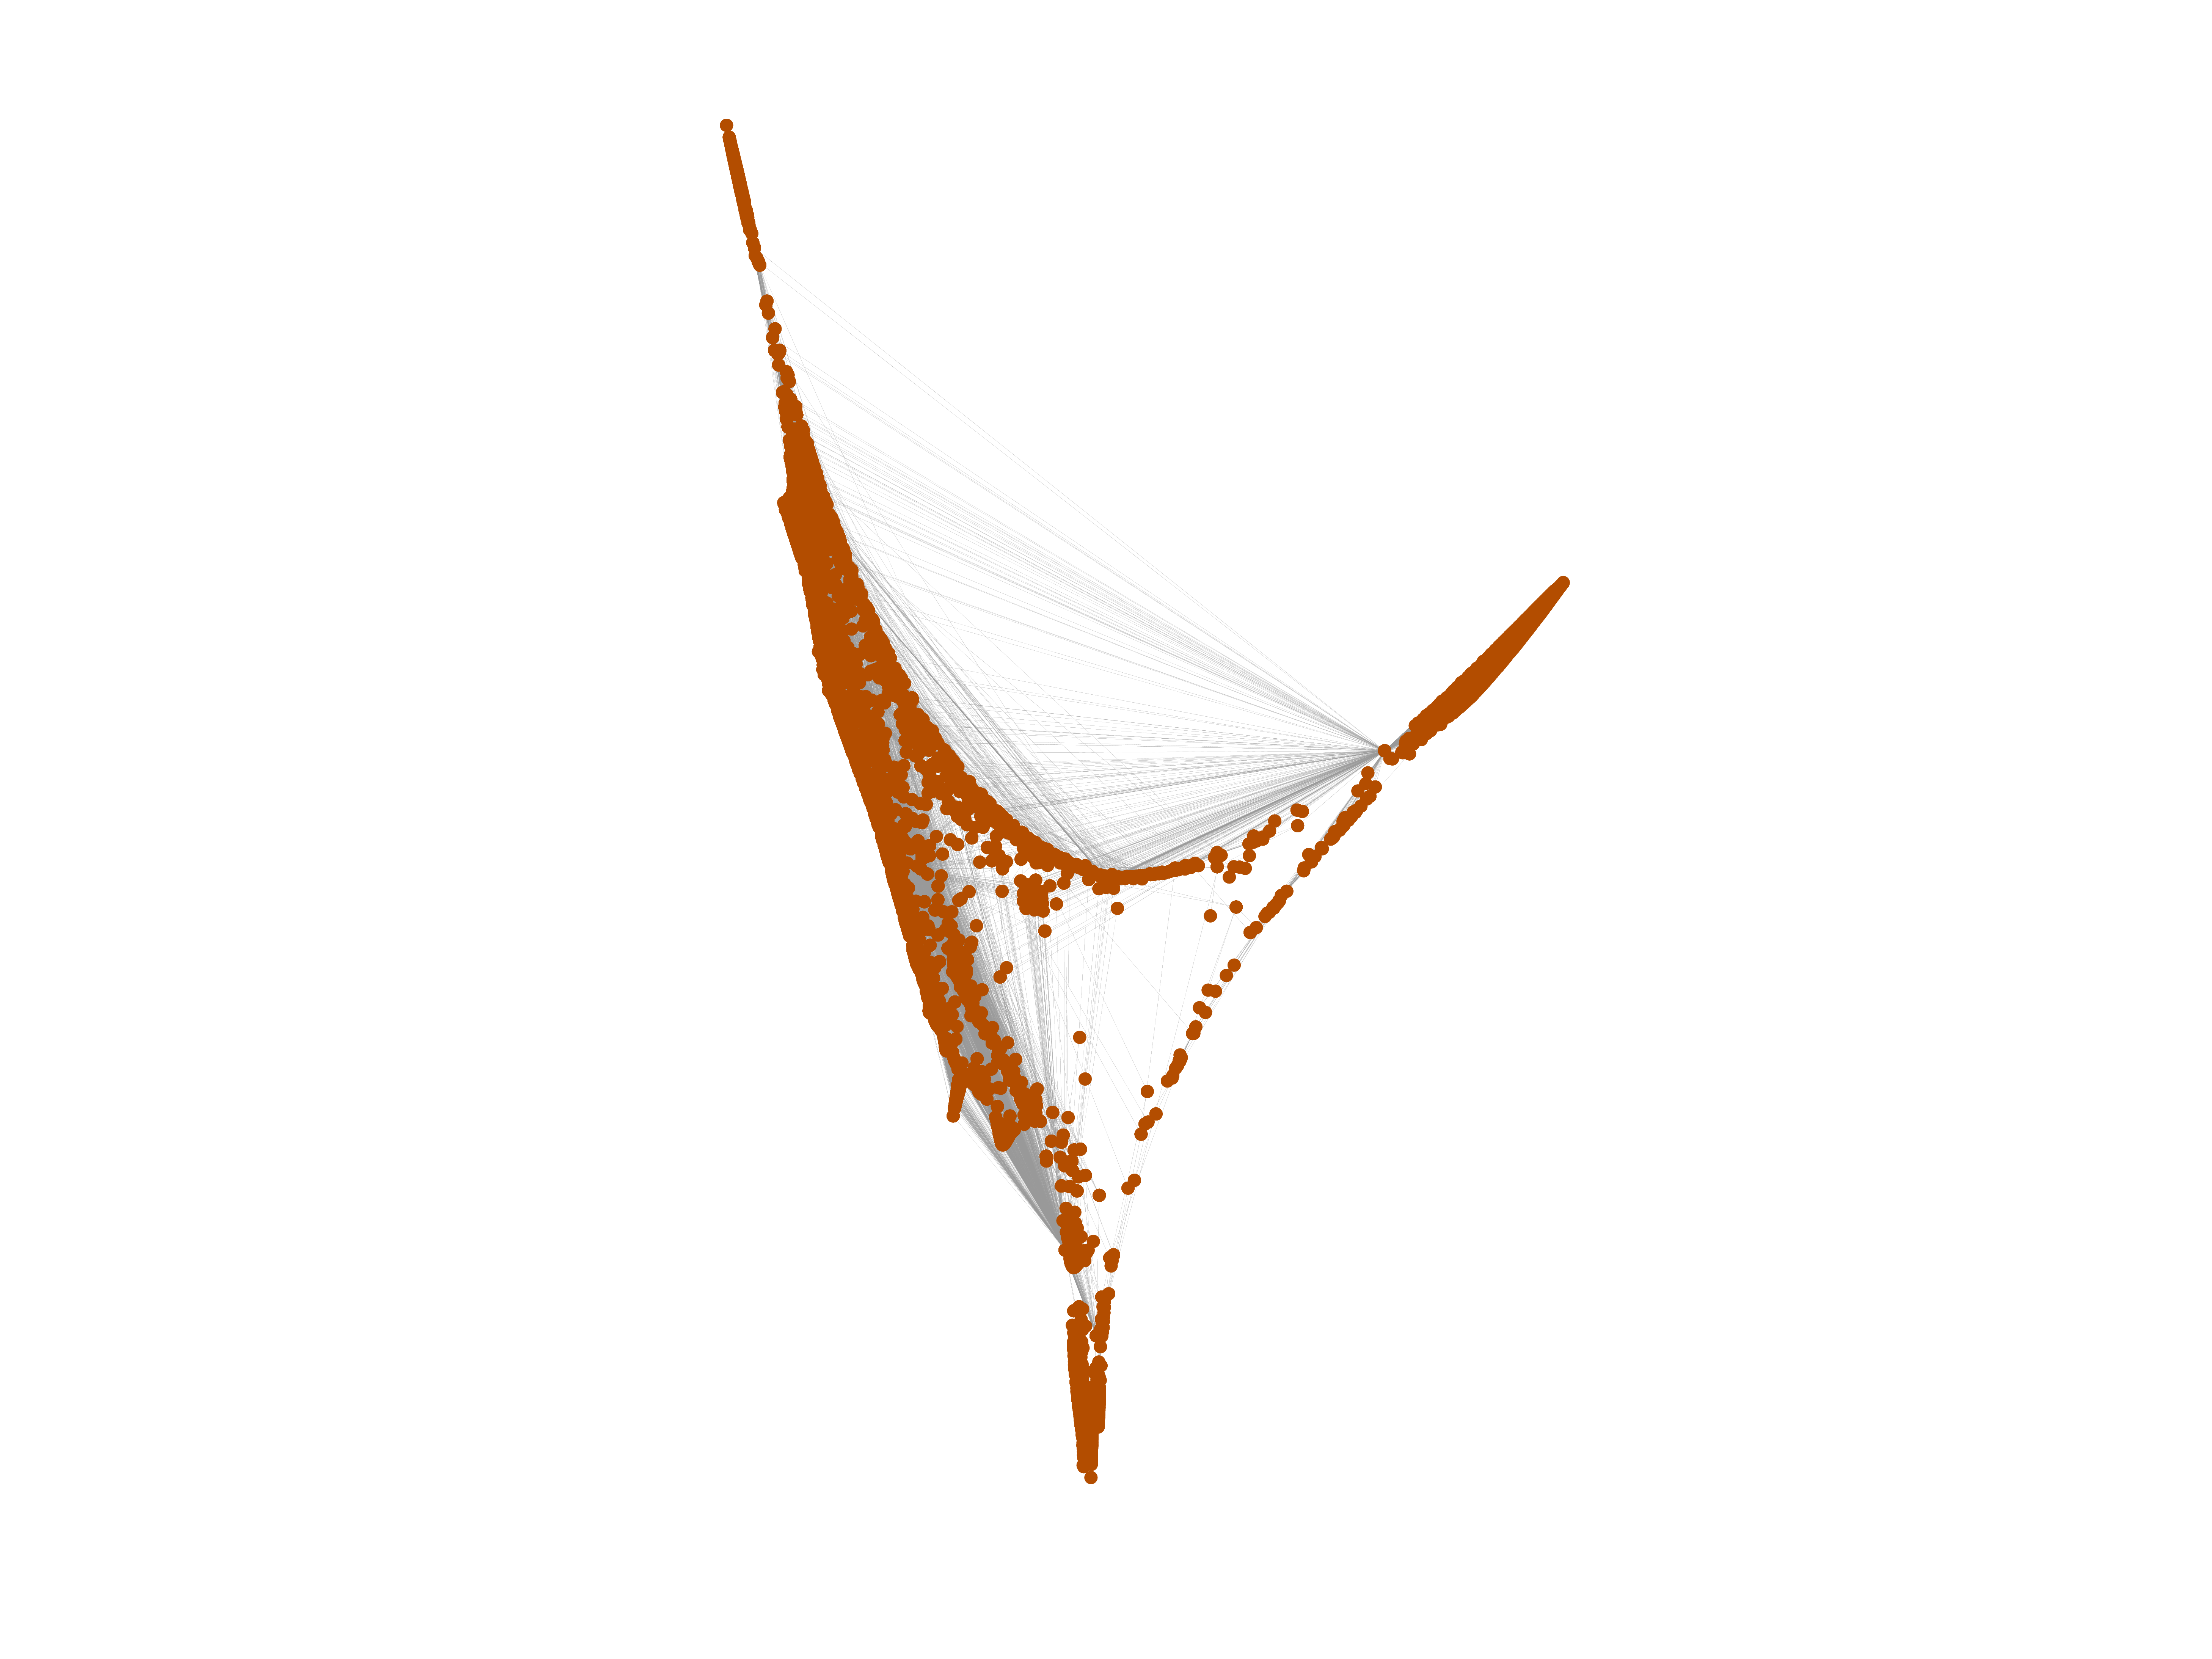
Wikipedia edits (kbd)
This is the bipartite edit network of the Kabardian Wikipedia. It contains
users and pages from the Kabardian Wikipedia, connected by edit events. Each
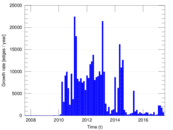
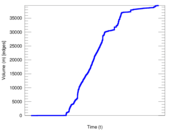
edge represents an edit. The dataset includes the timestamp of each edit.
Metadata
Statistics
| Size | n = | 7,157
|
| Left size | n1 = | 566
|
| Right size | n2 = | 6,591
|
| Volume | m = | 39,586
|
| Unique edge count | m̿ = | 20,251
|
| Wedge count | s = | 10,847,988
|
| Claw count | z = | 7,024,099,413
|
| Cross count | x = | 4,227,267,194,018
|
| Square count | q = | 8,750,833
|
| 4-Tour count | T4 = | 113,468,886
|
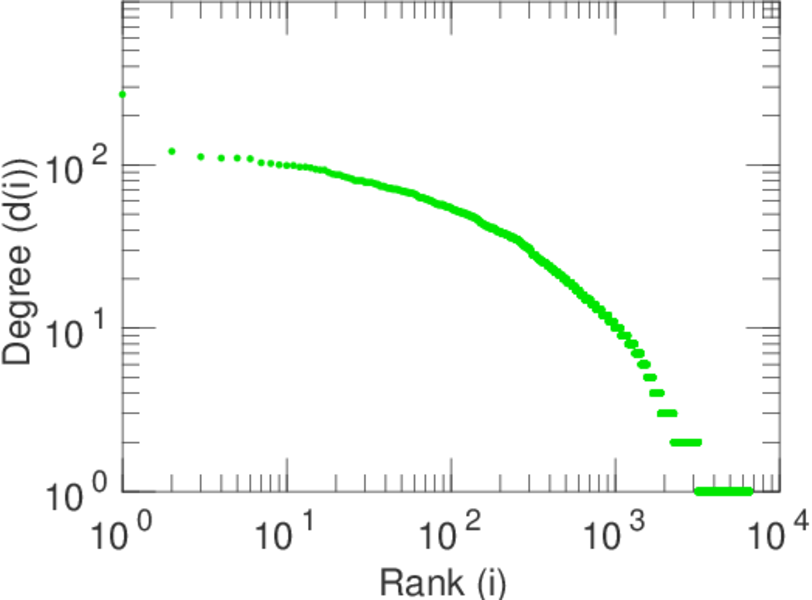
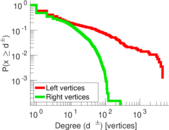
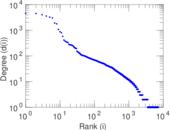
| Maximum degree | dmax = | 4,517
|
| Maximum left degree | d1max = | 4,517
|
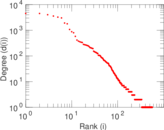
| Maximum right degree | d2max = | 270
|
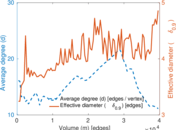
| Average degree | d = | 11.062 2
|
| Average left degree | d1 = | 69.939 9
|
| Average right degree | d2 = | 6.006 07
|
| Fill | p = | 0.005 428 49
|
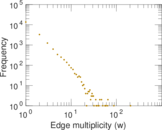
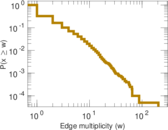
| Average edge multiplicity | m̃ = | 1.954 77
|
| Size of LCC | N = | 6,793
|
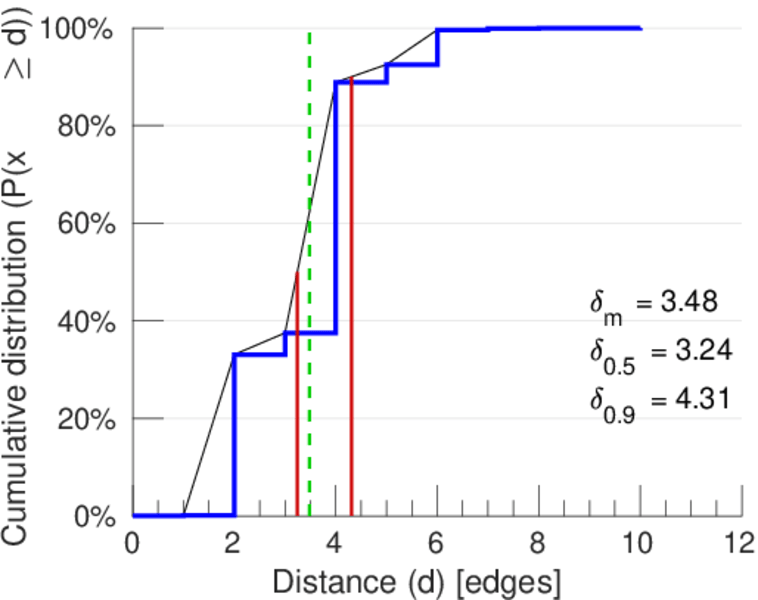
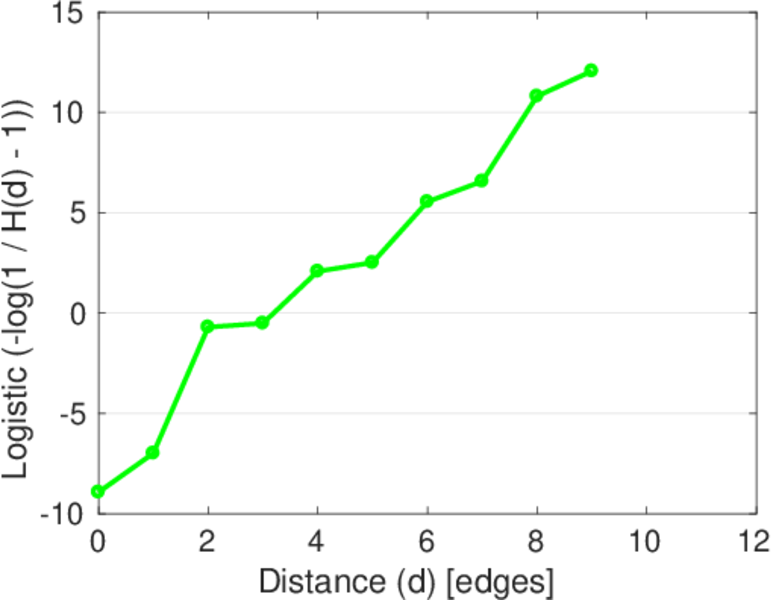
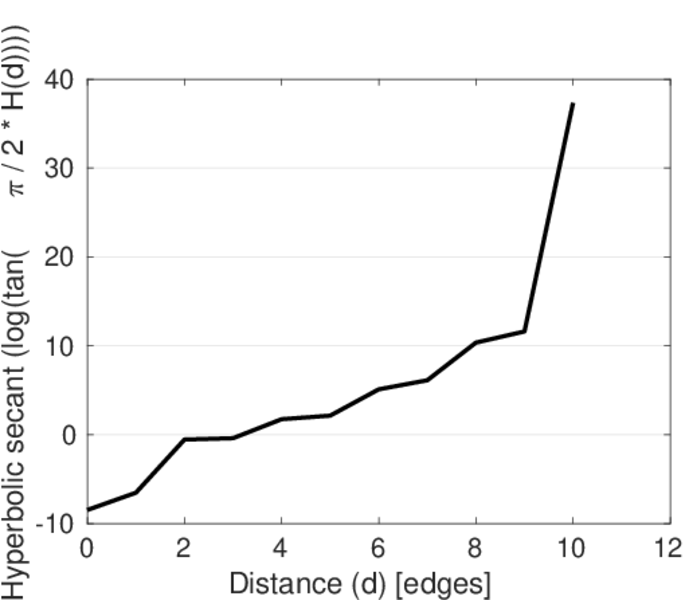
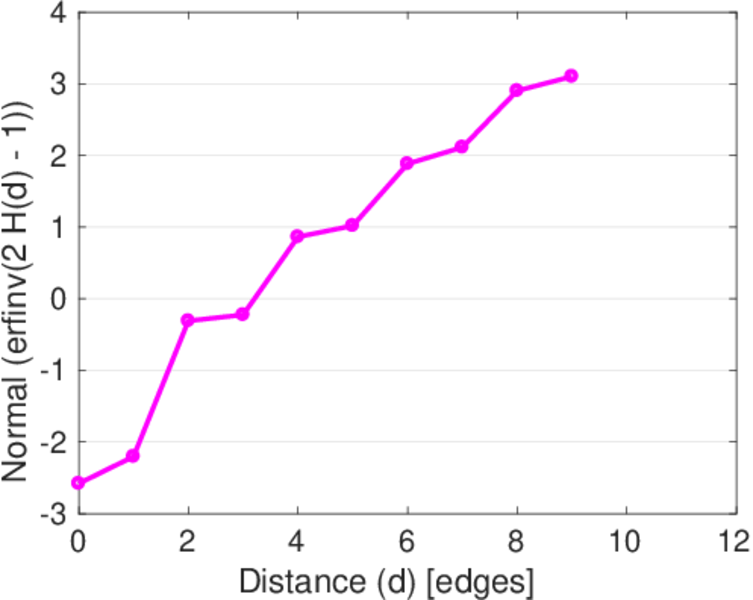
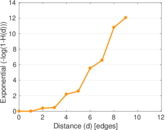
| Diameter | δ = | 12
|
| 50-Percentile effective diameter | δ0.5 = | 3.243 24
|
| 90-Percentile effective diameter | δ0.9 = | 4.309 72
|
| Median distance | δM = | 4
|
| Mean distance | δm = | 3.484 67
|
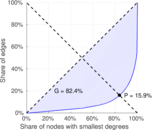
| Gini coefficient | G = | 0.836 051
|
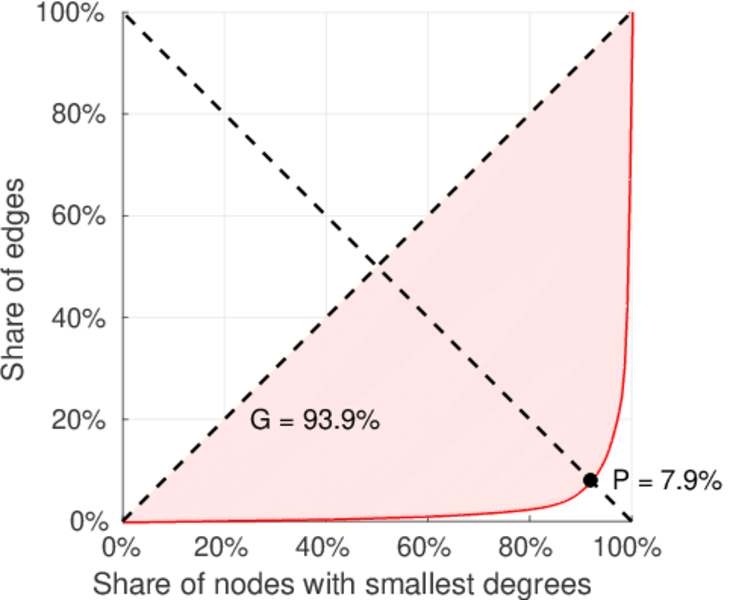
| Balanced inequality ratio | P = | 0.151 922
|
| Left balanced inequality ratio | P1 = | 0.079 194 7
|
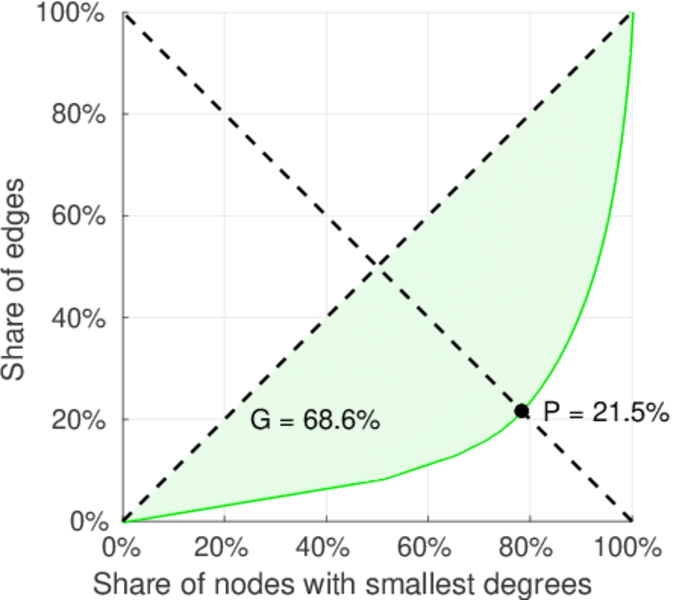
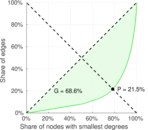
| Right balanced inequality ratio | P2 = | 0.215 101
|
| Relative edge distribution entropy | Her = | 0.750 560
|
| Power law exponent | γ = | 2.595 80
|
| Tail power law exponent | γt = | 1.941 00
|
| Tail power law exponent with p | γ3 = | 1.941 00
|
| p-value | p = | 0.000 00
|
| Left tail power law exponent with p | γ3,1 = | 1.641 00
|
| Left p-value | p1 = | 0.000 00
|
| Right tail power law exponent with p | γ3,2 = | 1.981 00
|
| Right p-value | p2 = | 0.000 00
|
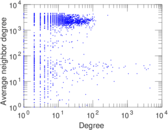
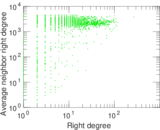
| Degree assortativity | ρ = | −0.474 314
|
| Degree assortativity p-value | pρ = | 0.000 00
|
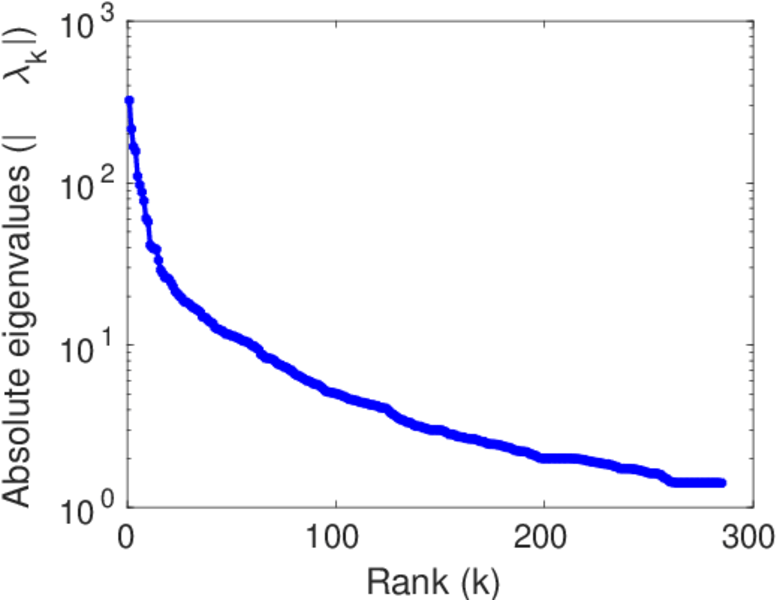
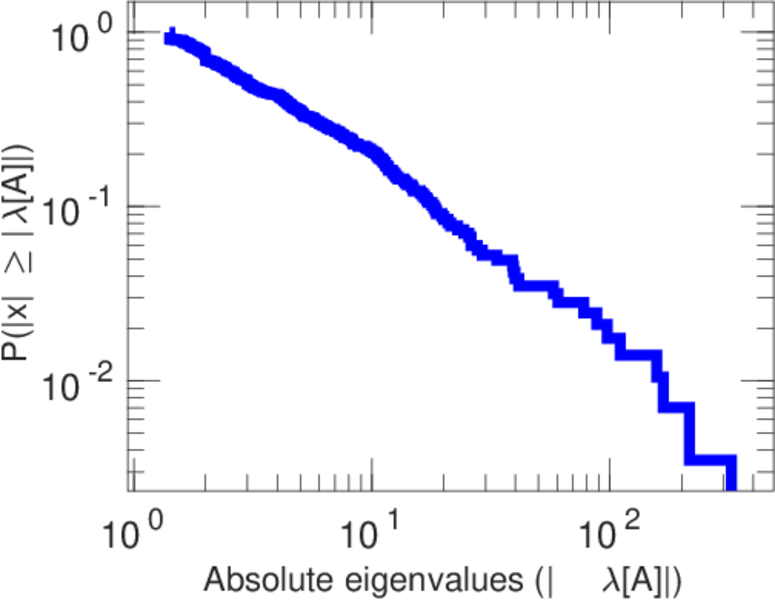
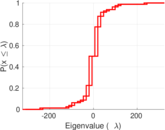
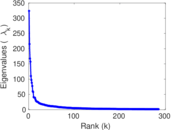
| Spectral norm | α = | 323.924
|
| Algebraic connectivity | a = | 0.016 147 5
|
| Spectral separation | |λ1[A] / λ2[A]| = | 1.504 33
|
| Controllability | C = | 6,083
|
| Relative controllability | Cr = | 0.852 797
|
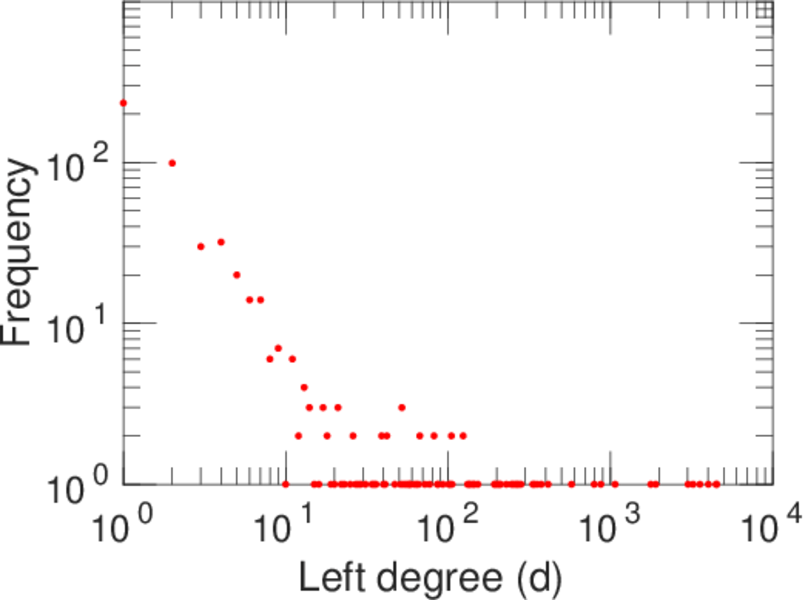
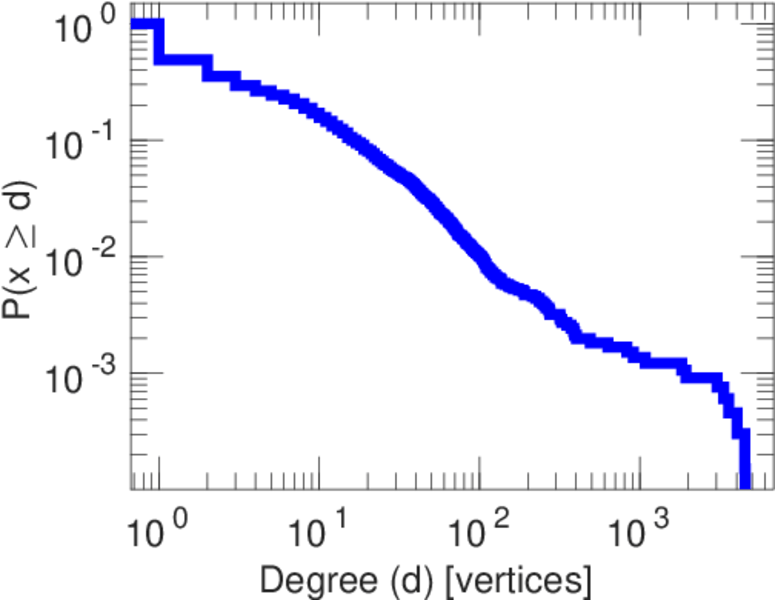
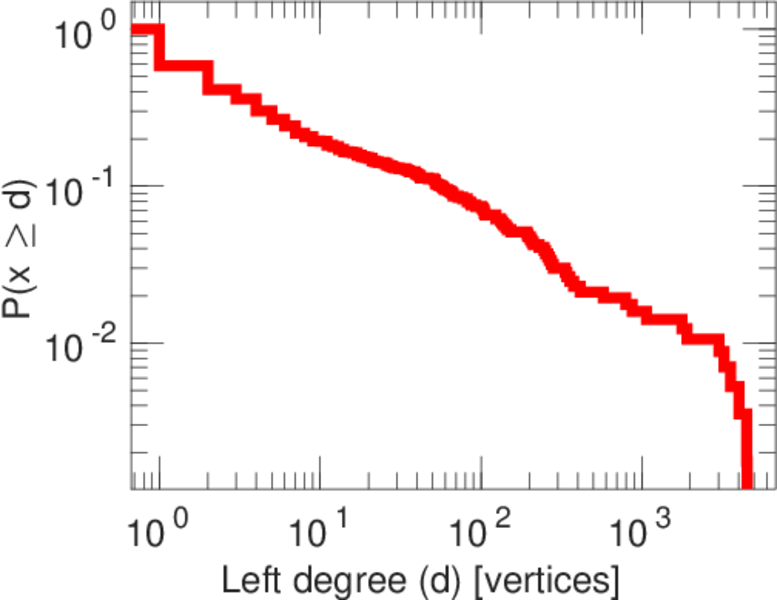
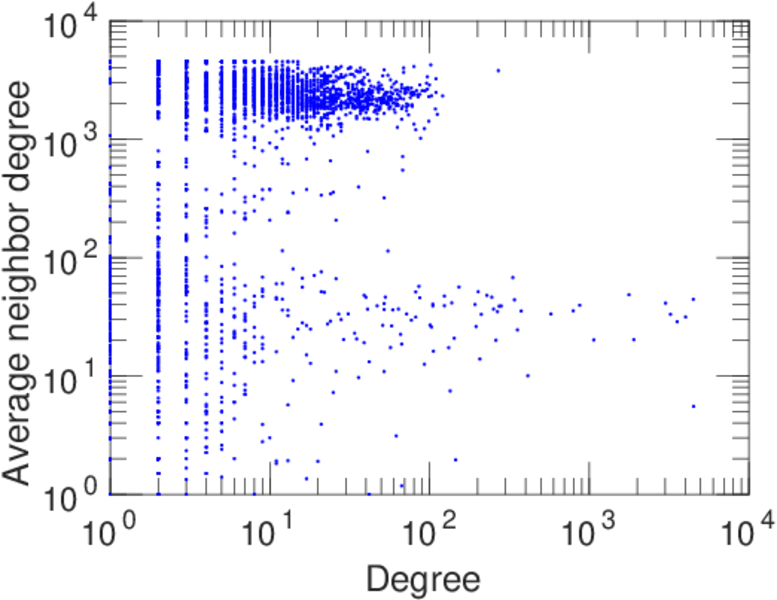
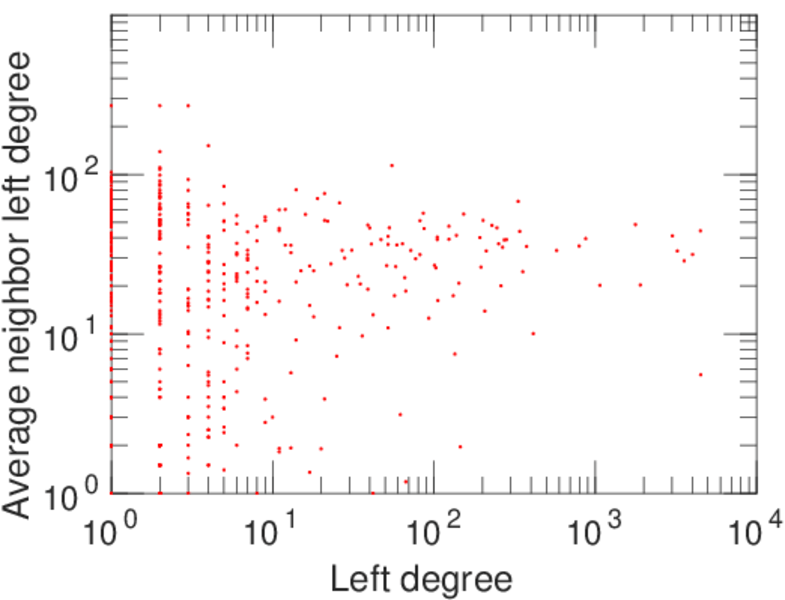
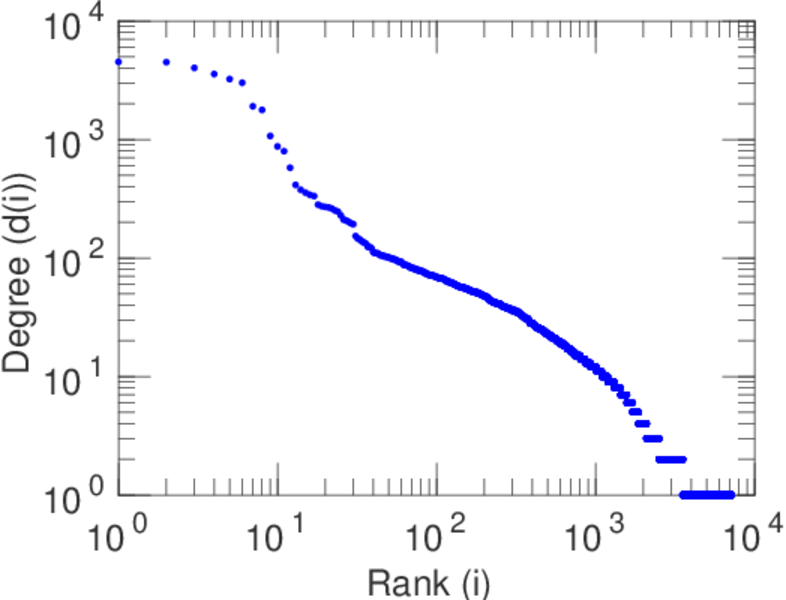
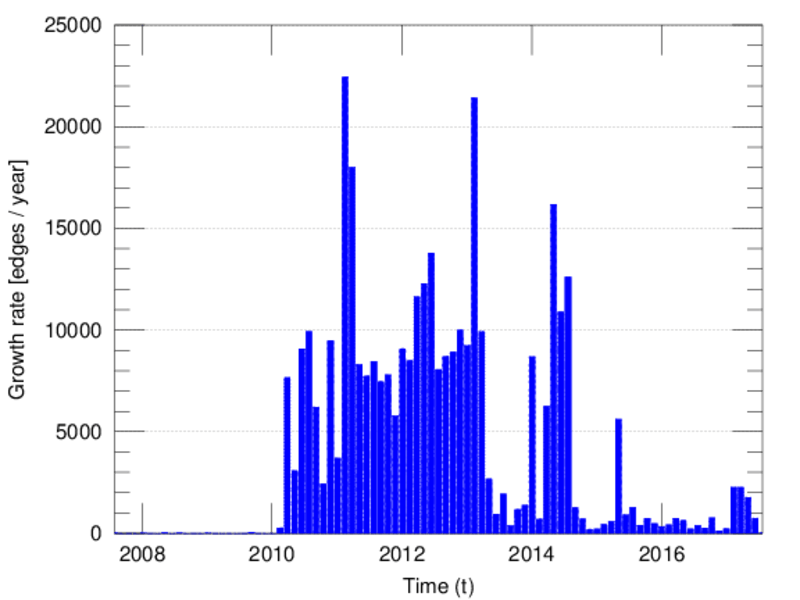
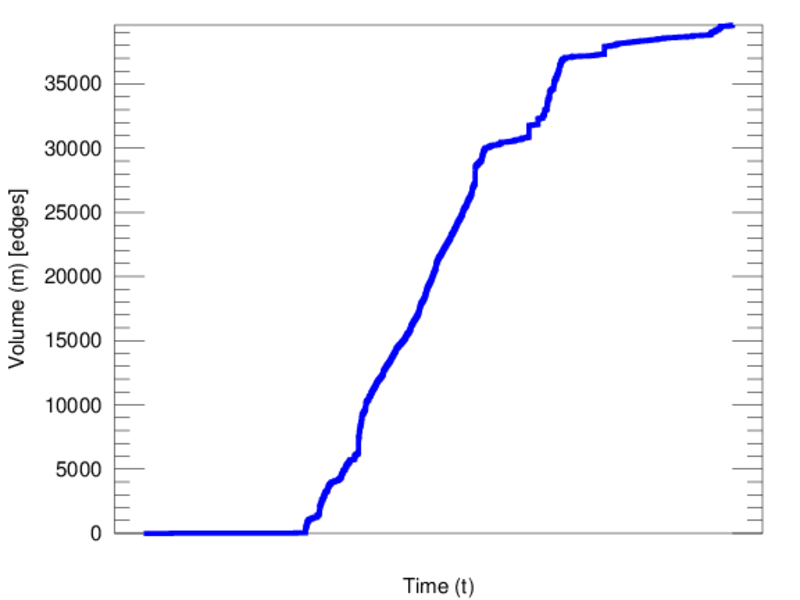
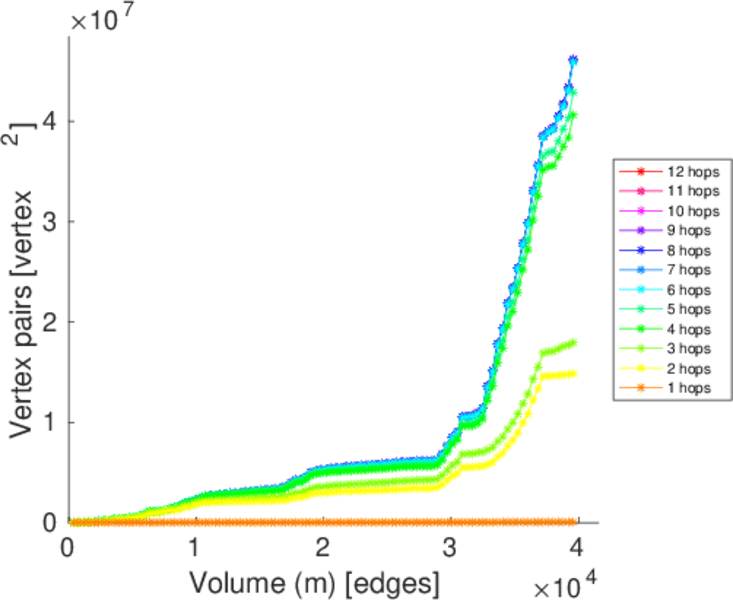
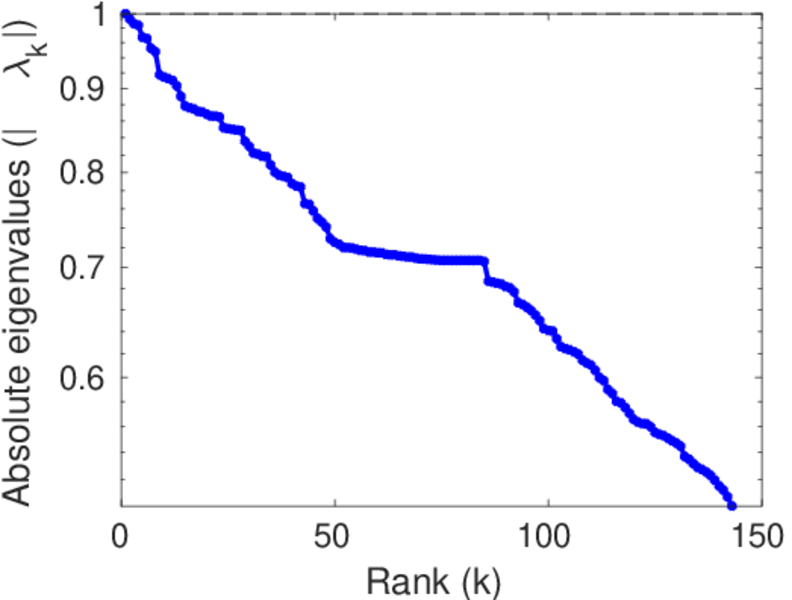
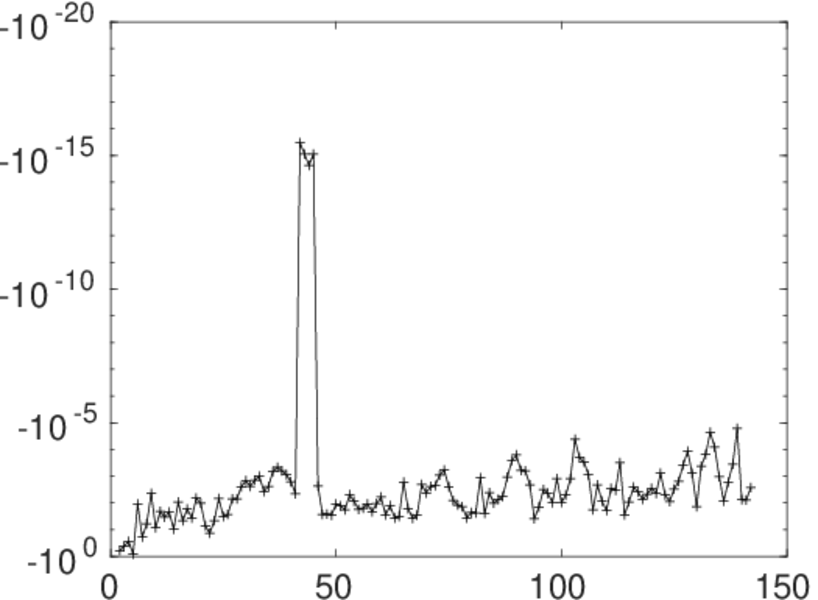
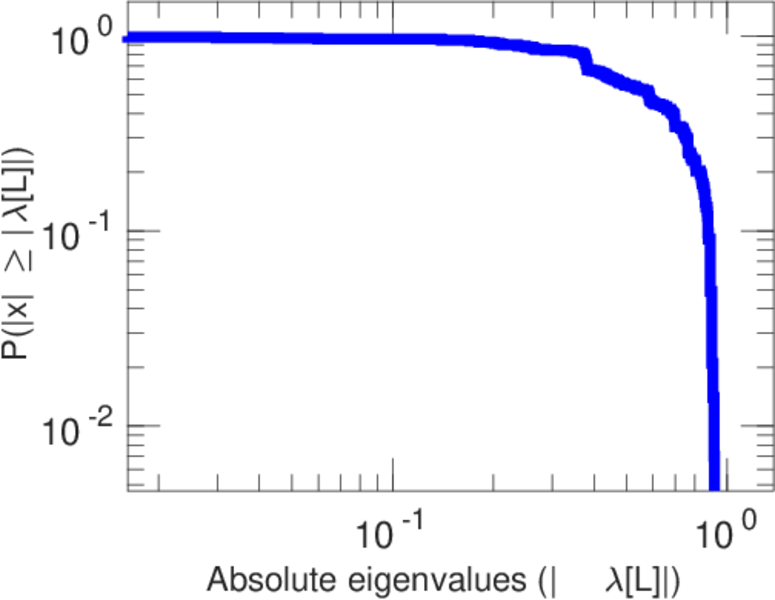
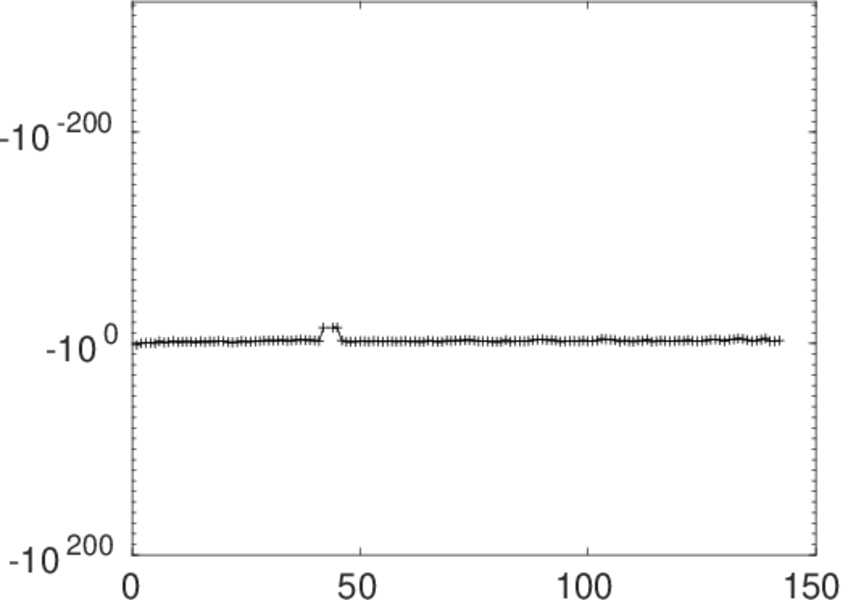
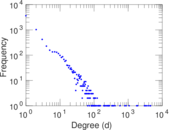
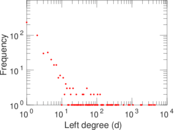
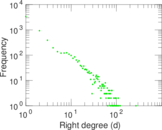
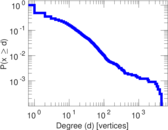
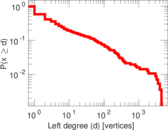
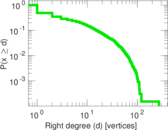
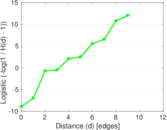
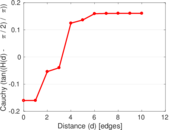
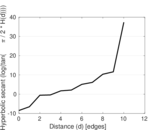
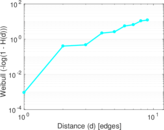
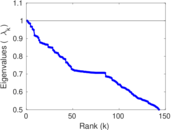
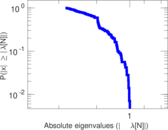
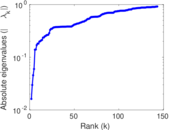
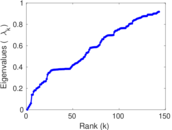
Plots


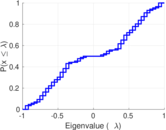


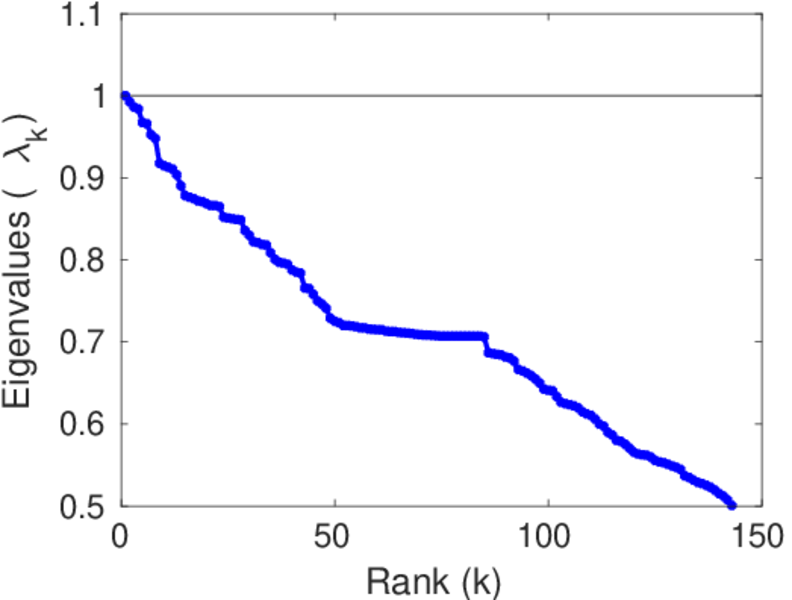
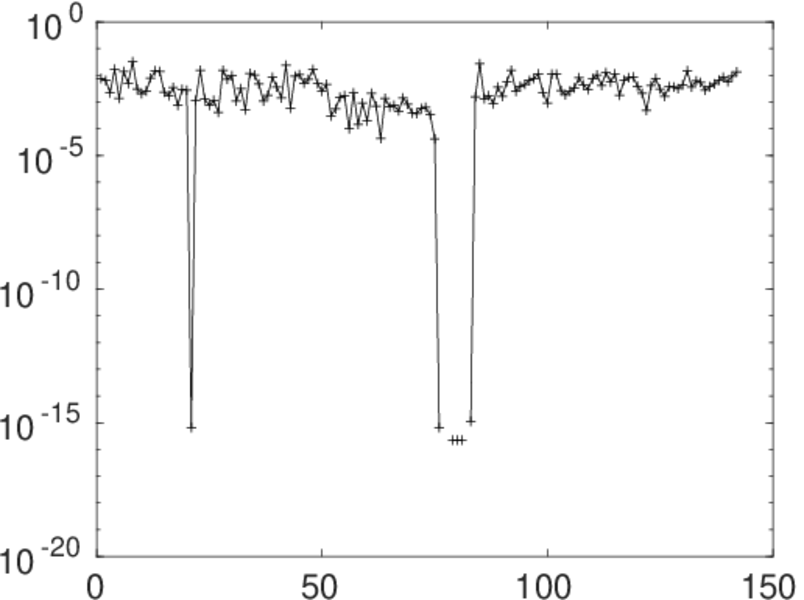
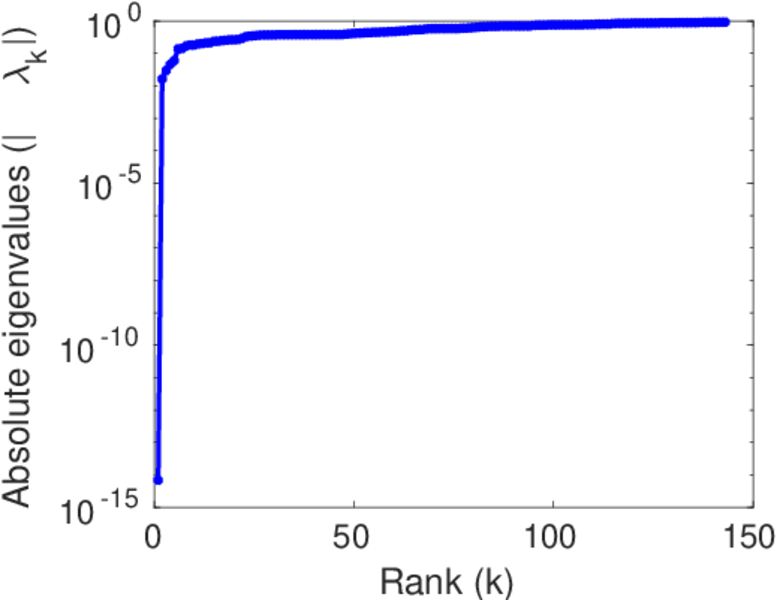
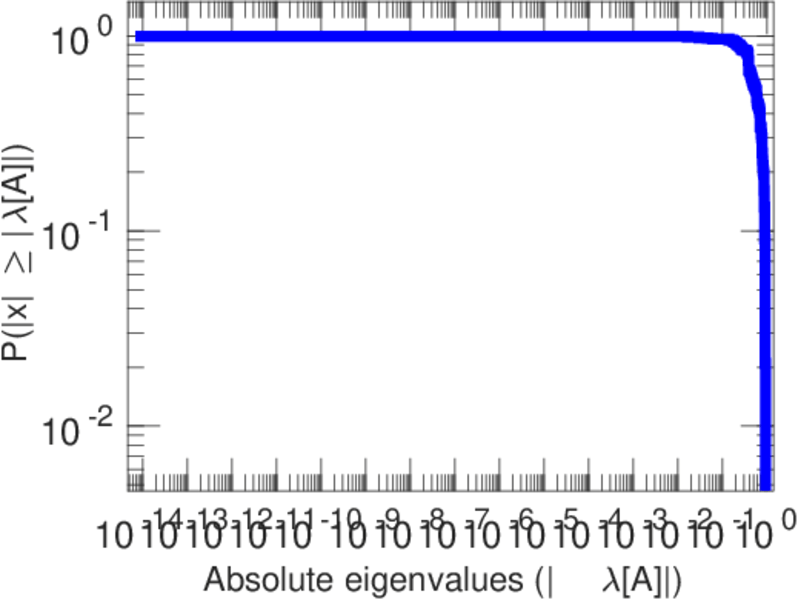
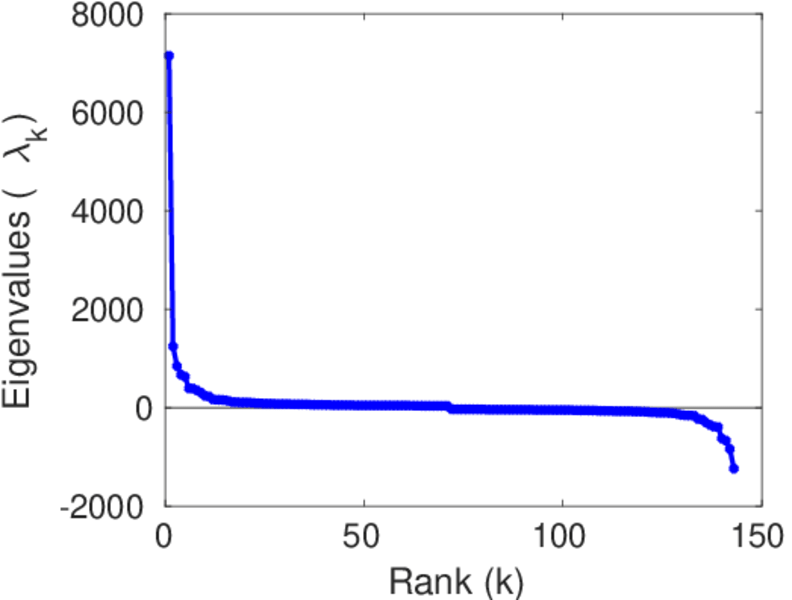
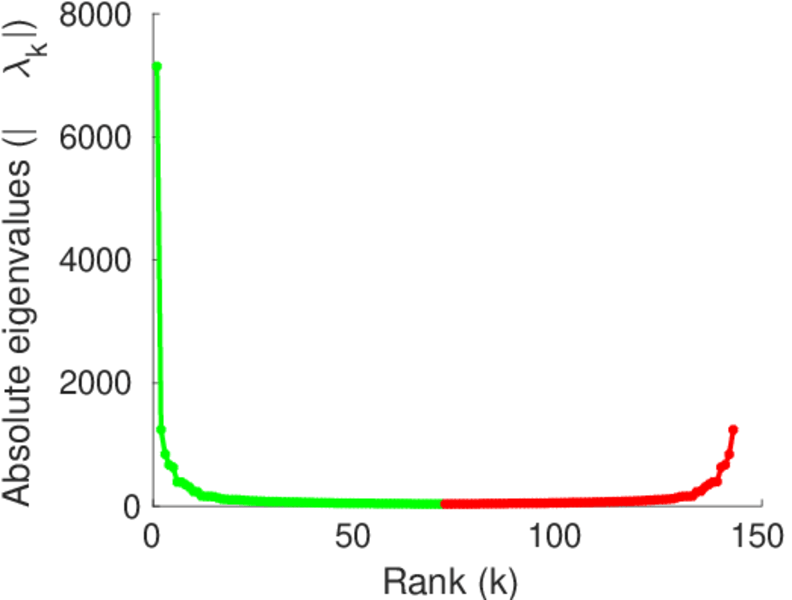
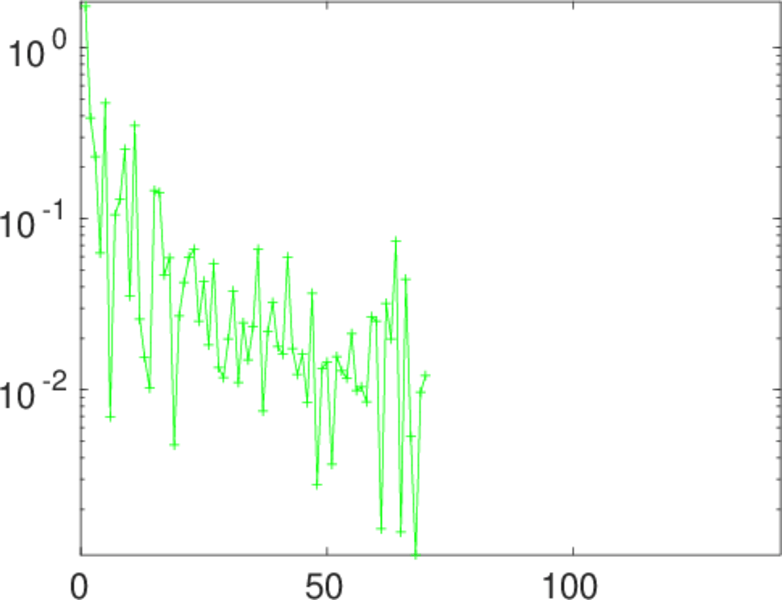
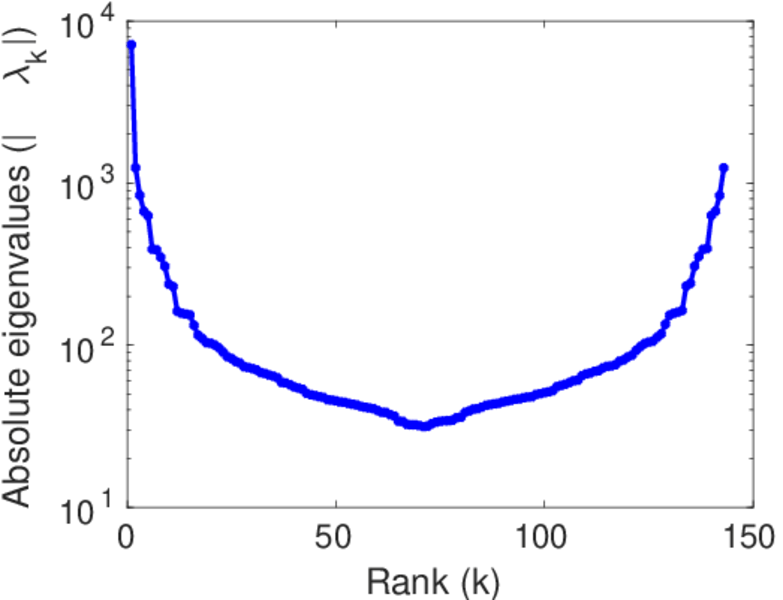
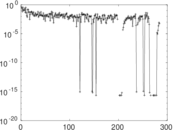
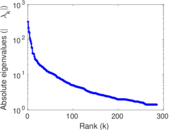
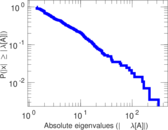
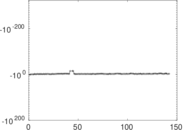
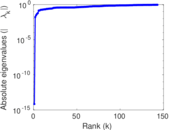
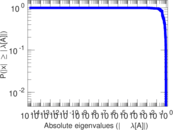
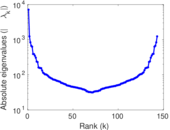
Matrix decompositions plots


Downloads
References
|
[1]
|
Jérôme Kunegis.
KONECT – The Koblenz Network Collection.
In Proc. Int. Conf. on World Wide Web Companion, pages
1343–1350, 2013.
[ http ]
|
|
[2]
|
Wikimedia Foundation.
Wikimedia downloads.
http://dumps.wikimedia.org/, January 2010.
|
 KONECT ‣ Networks ‣
Buy Me a Coffee
KONECT ‣ Networks ‣
Buy Me a Coffee