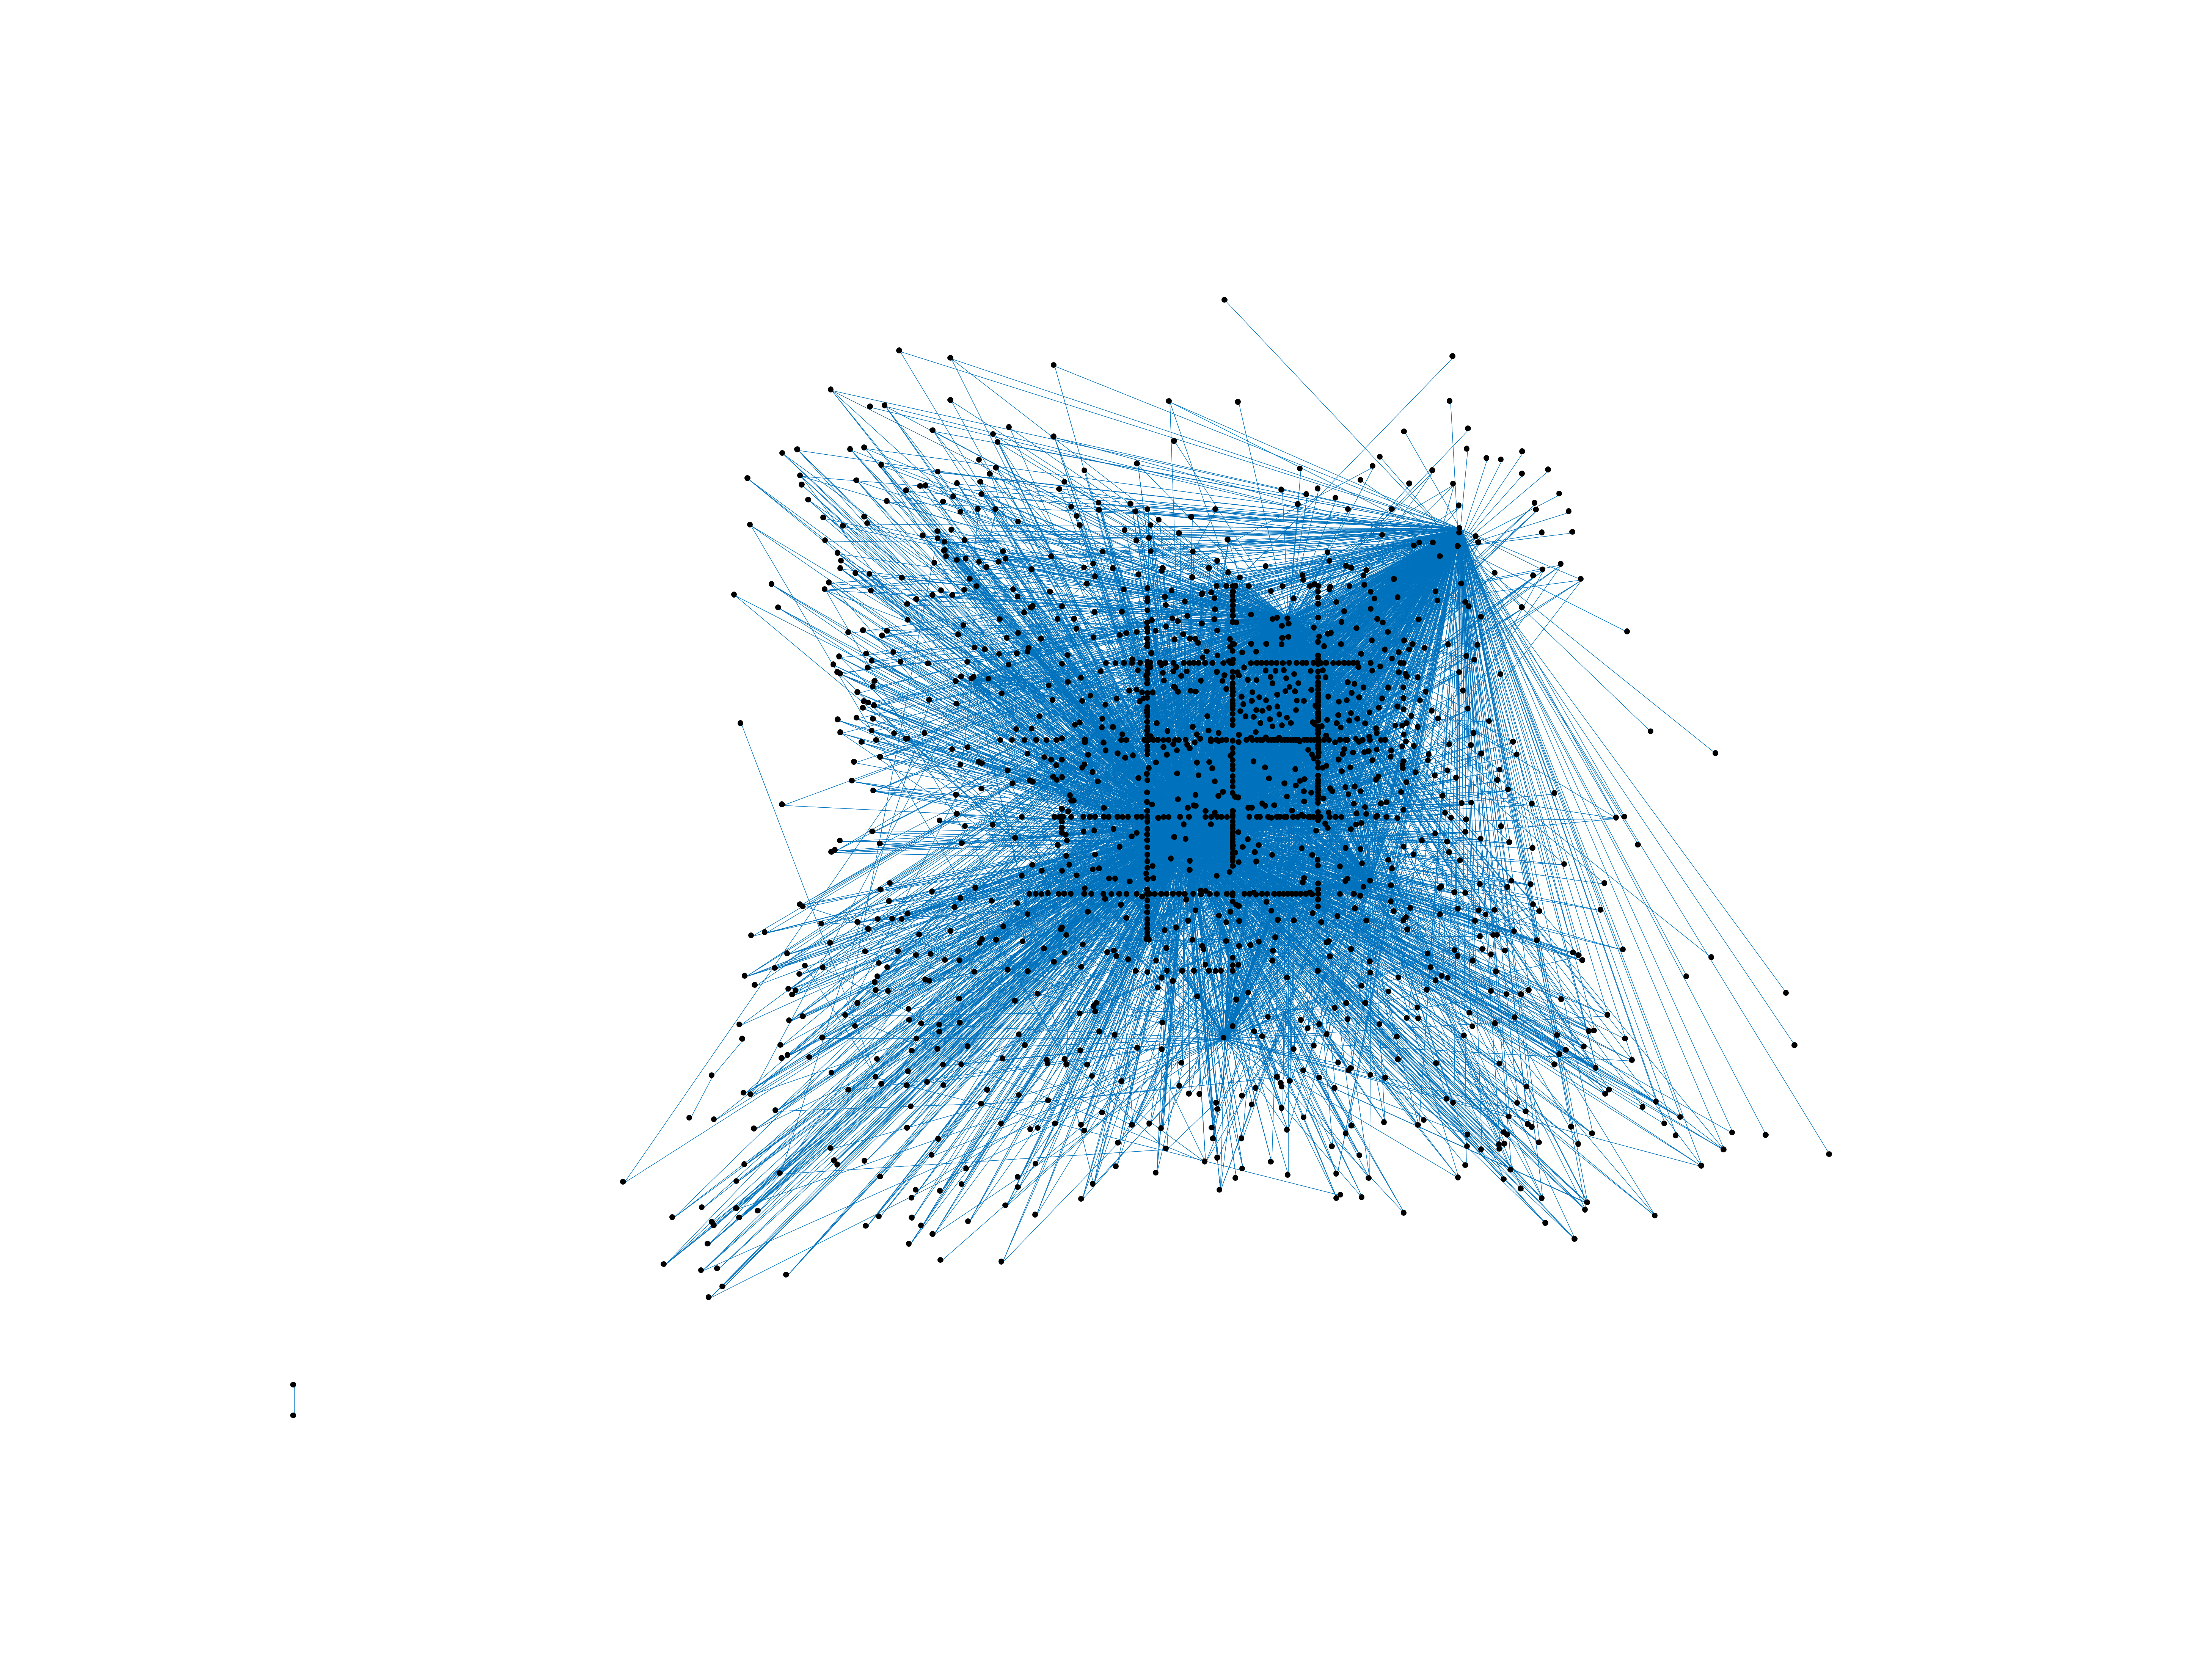
Wikipedia edits (kbp)
This is the bipartite edit network of the Kabɩyɛ Wikipedia. It contains users
and pages from the Kabɩyɛ Wikipedia, connected by edit events. Each edge
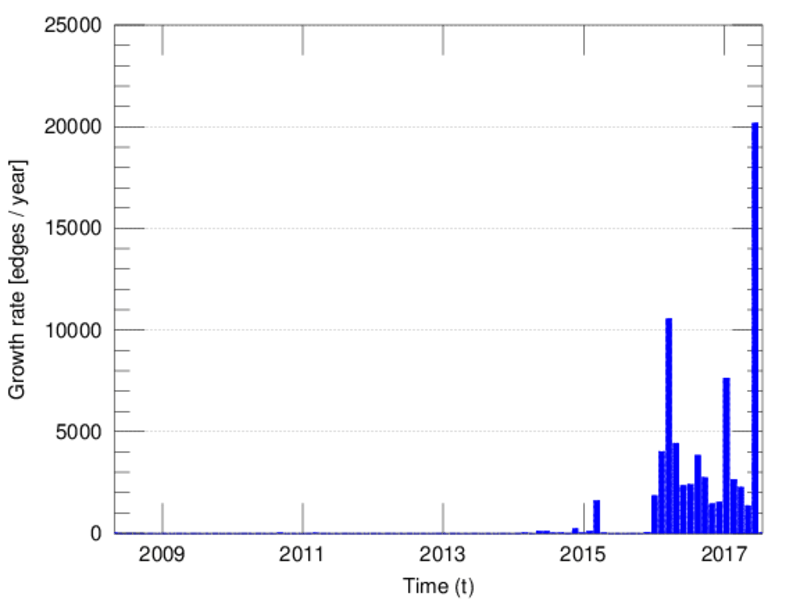
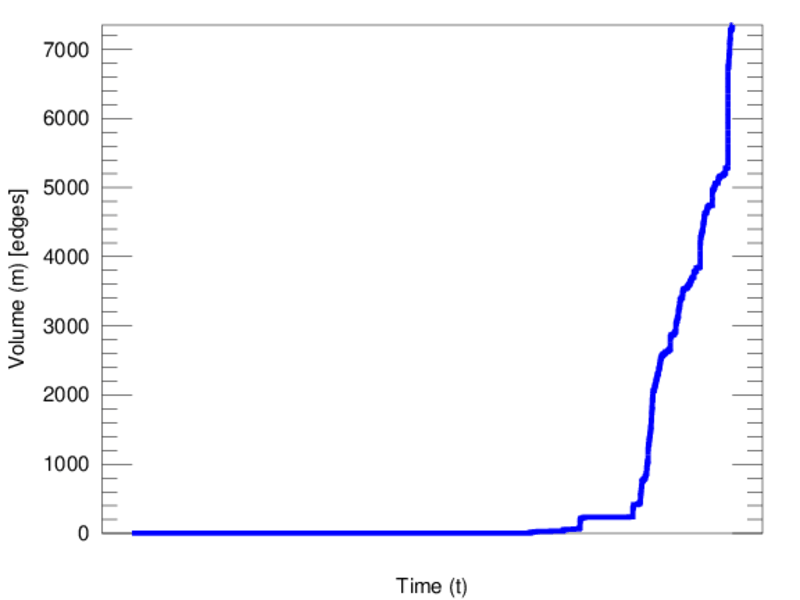
represents an edit. The dataset includes the timestamp of each edit.
Metadata
Statistics
| Size | n = | 1,587
|
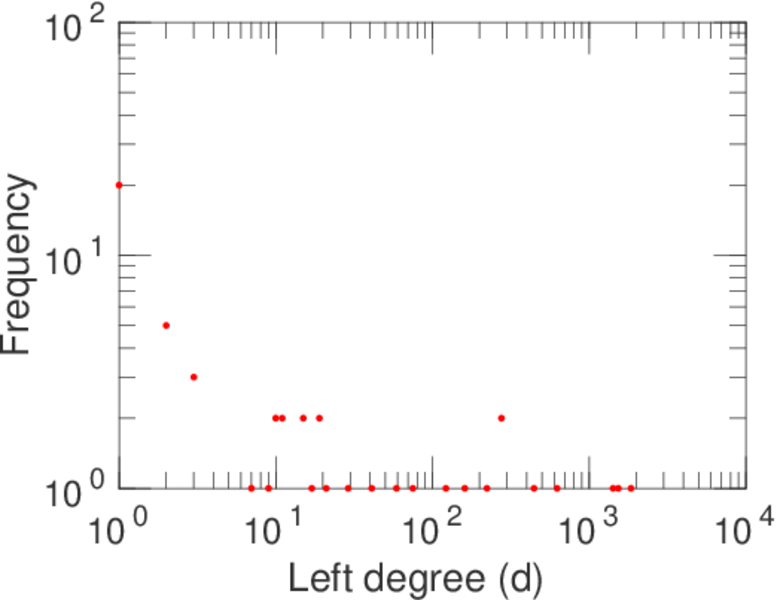
| Left size | n1 = | 54
|
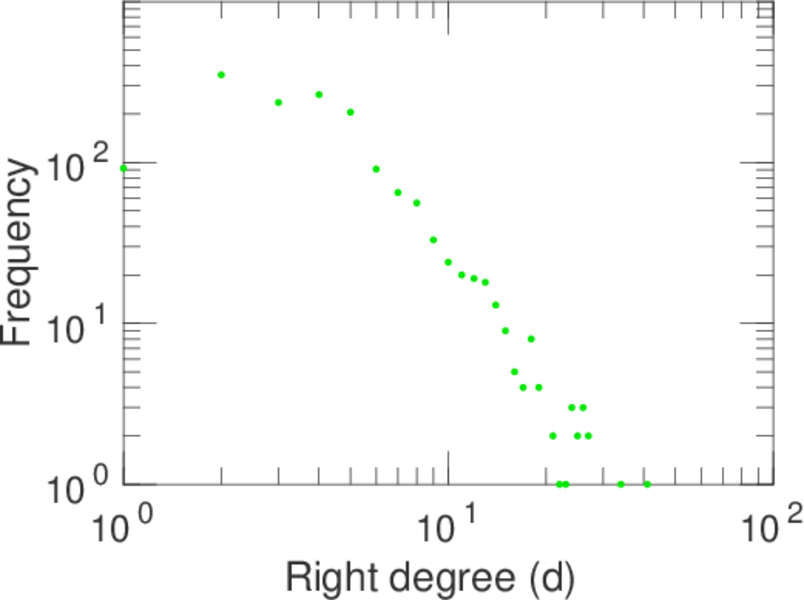
| Right size | n2 = | 1,533
|
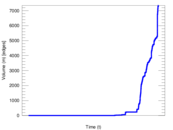
| Volume | m = | 7,350
|
| Unique edge count | m̿ = | 5,343
|
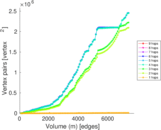
| Wedge count | s = | 2,150,867
|
| Claw count | z = | 776,058,374
|
| Cross count | x = | 233,561,497,749
|
| Square count | q = | 1,552,566
|
| 4-Tour count | T4 = | 21,034,682
|
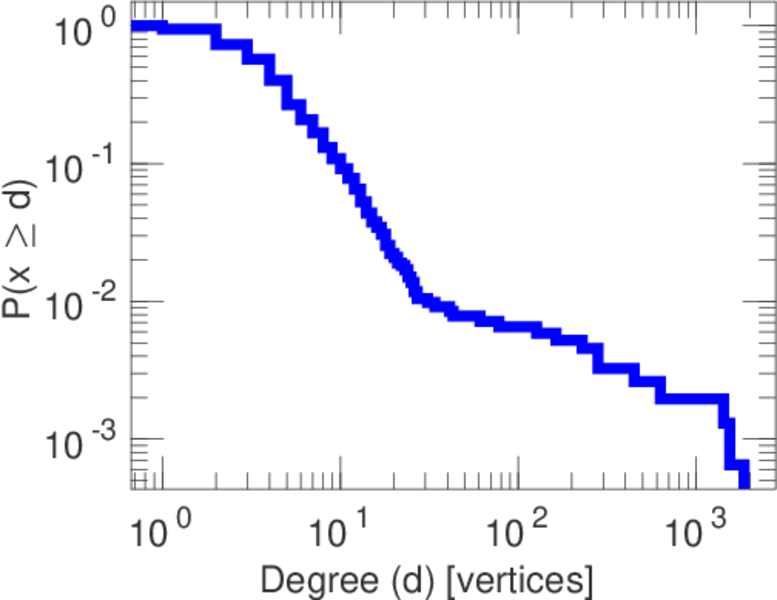
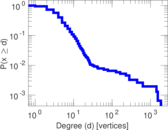
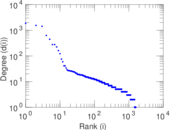
| Maximum degree | dmax = | 1,853
|
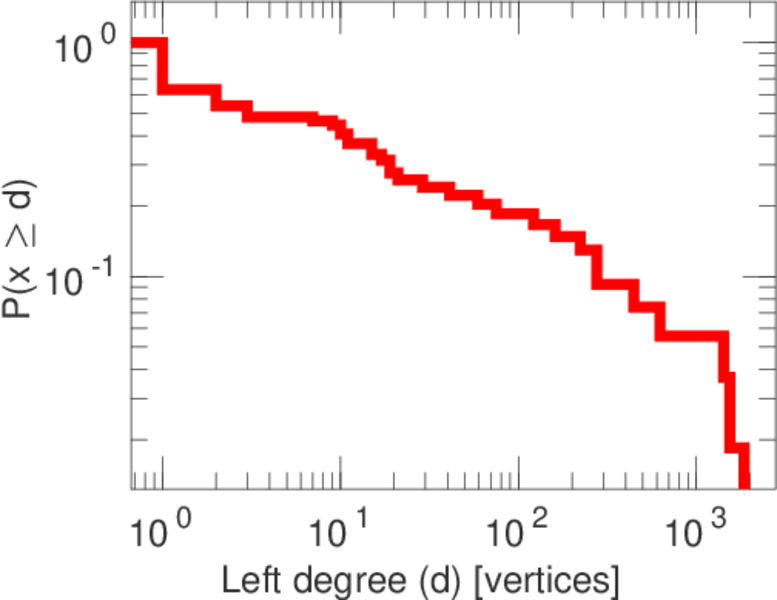
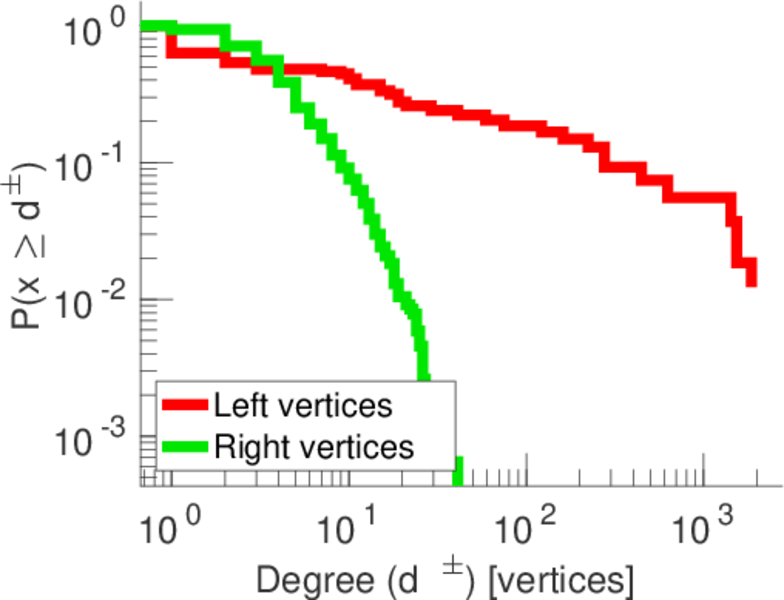
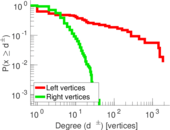
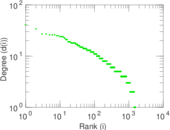
| Maximum left degree | d1max = | 1,853
|
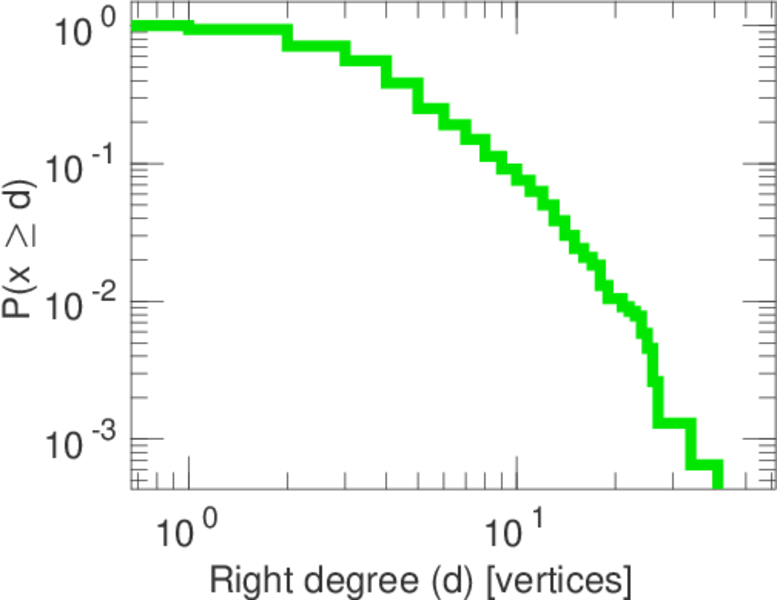
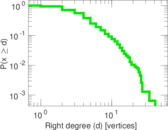
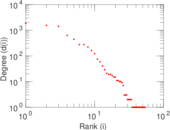
| Maximum right degree | d2max = | 41
|
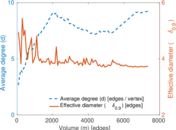
| Average degree | d = | 9.262 76
|
| Average left degree | d1 = | 136.111
|
| Average right degree | d2 = | 4.794 52
|
| Fill | p = | 0.064 543 0
|
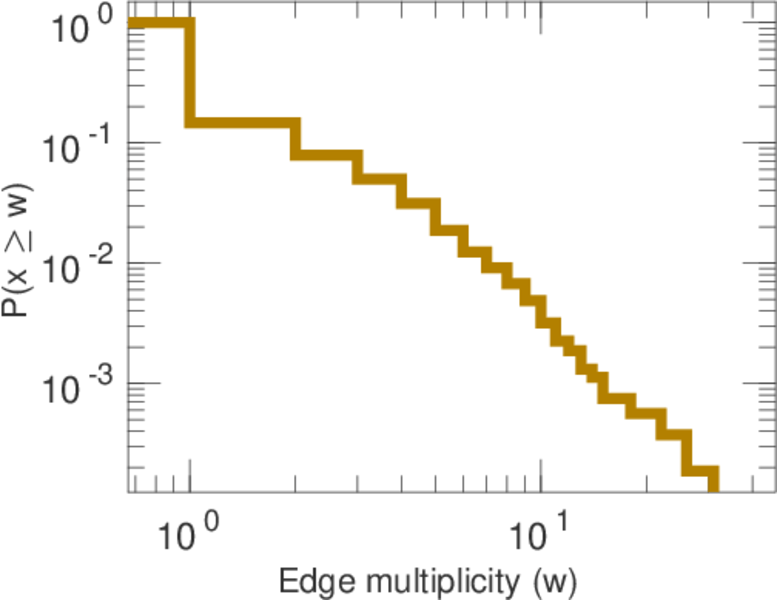
| Average edge multiplicity | m̃ = | 1.375 63
|
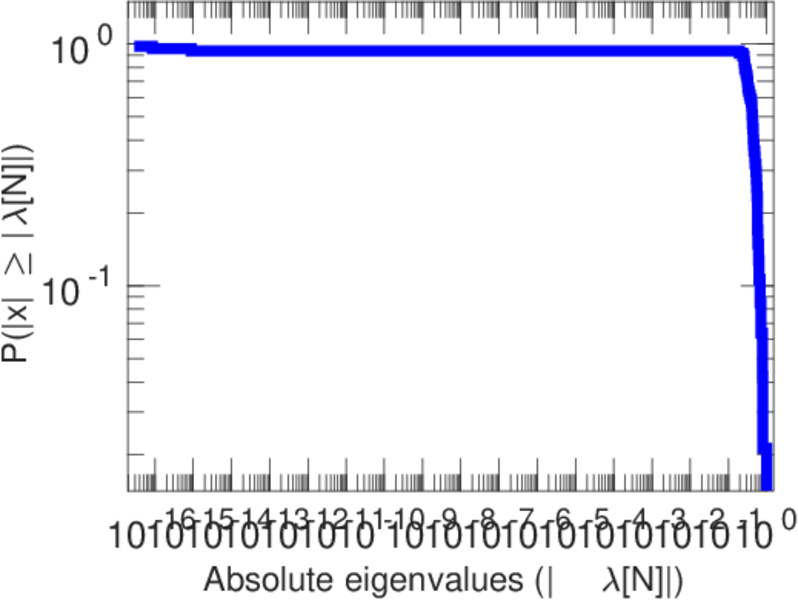
| Size of LCC | N = | 1,568
|
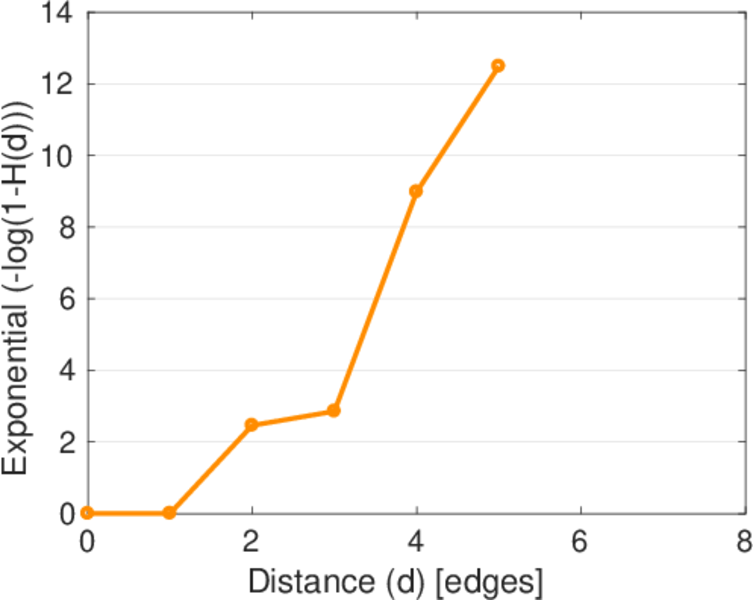
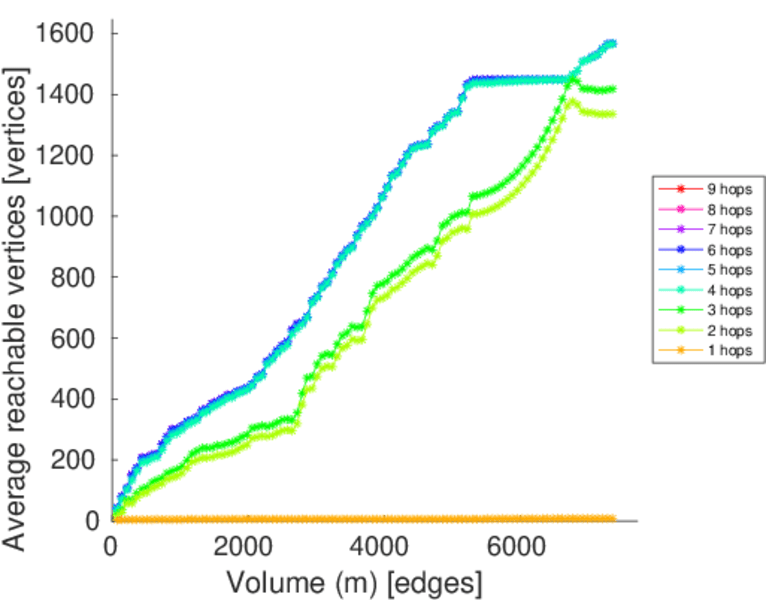
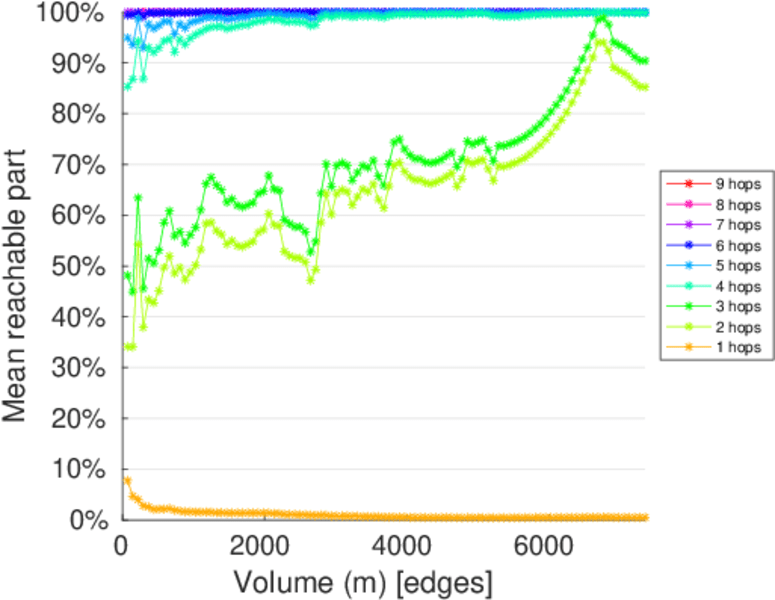
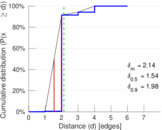
| Diameter | δ = | 6
|
| 50-Percentile effective diameter | δ0.5 = | 1.543 95
|
| 90-Percentile effective diameter | δ0.9 = | 1.983 76
|
| Median distance | δM = | 2
|
| Mean distance | δm = | 2.136 90
|
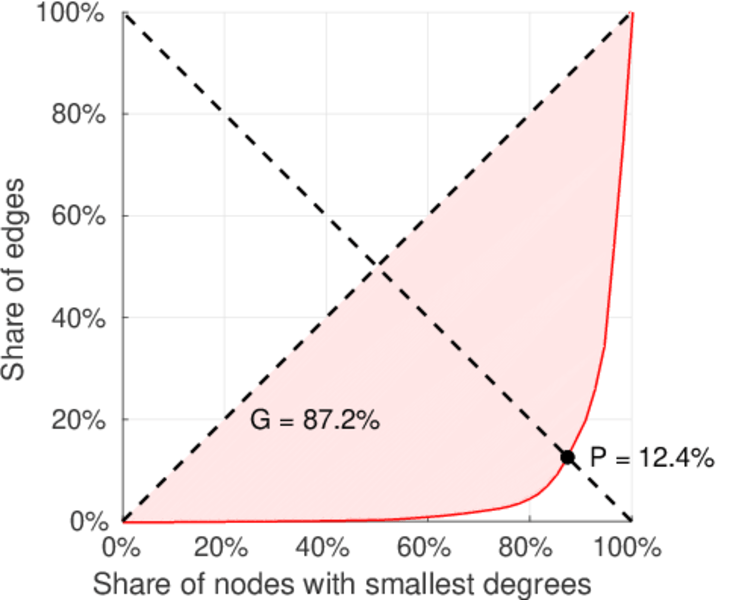
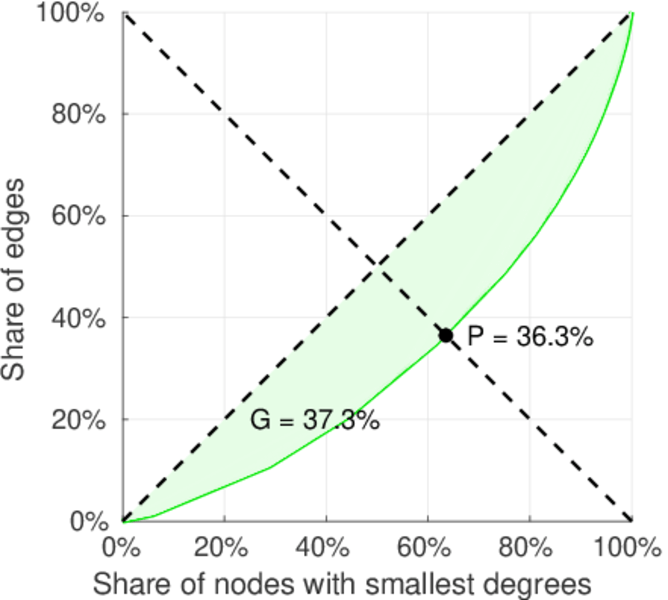
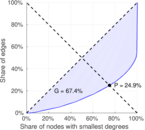
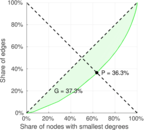
| Gini coefficient | G = | 0.673 005
|
| Balanced inequality ratio | P = | 0.249 116
|
| Left balanced inequality ratio | P1 = | 0.124 218
|
| Right balanced inequality ratio | P2 = | 0.363 401
|
| Relative edge distribution entropy | Her = | 0.739 946
|
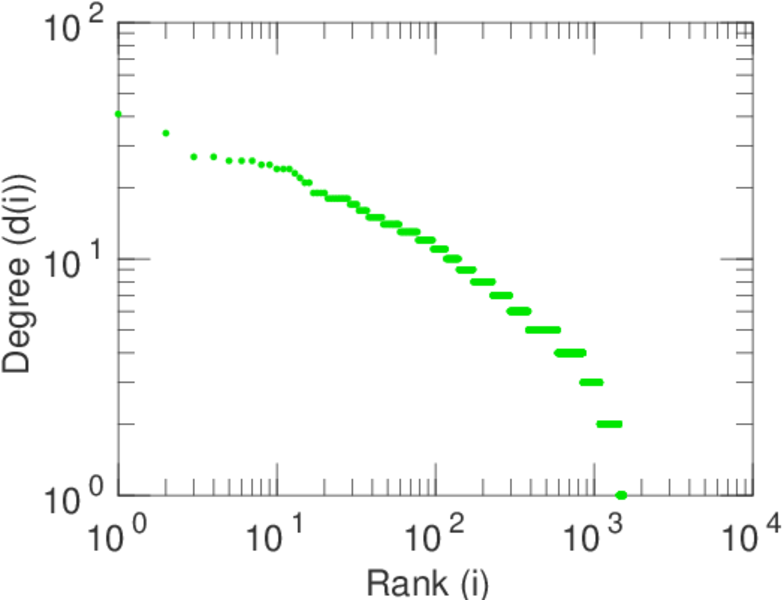
| Power law exponent | γ = | 1.853 97
|
| Tail power law exponent | γt = | 3.931 00
|
| Tail power law exponent with p | γ3 = | 3.931 00
|
| p-value | p = | 0.000 00
|
| Left tail power law exponent with p | γ3,1 = | 1.401 00
|
| Left p-value | p1 = | 0.060 000 0
|
| Right tail power law exponent with p | γ3,2 = | 6.651 00
|
| Right p-value | p2 = | 0.170 000
|
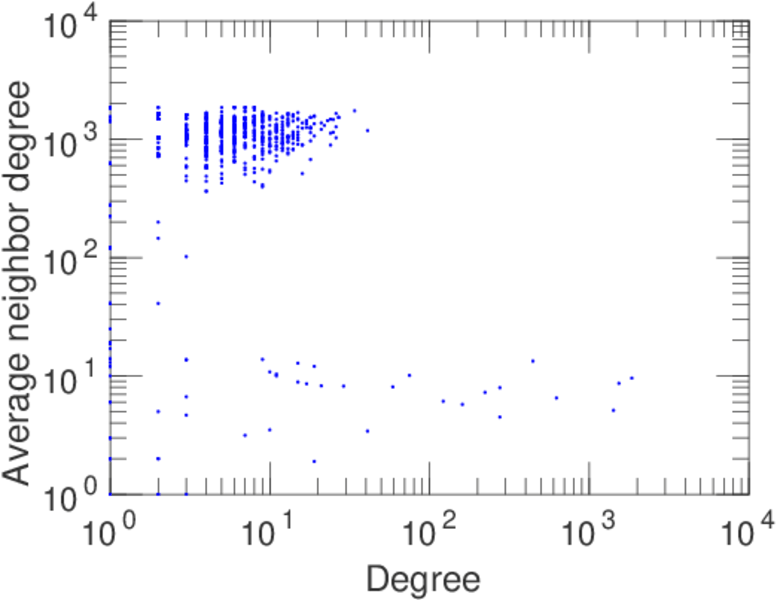
| Degree assortativity | ρ = | −0.226 496
|
| Degree assortativity p-value | pρ = | 4.015 96 × 10−63
|
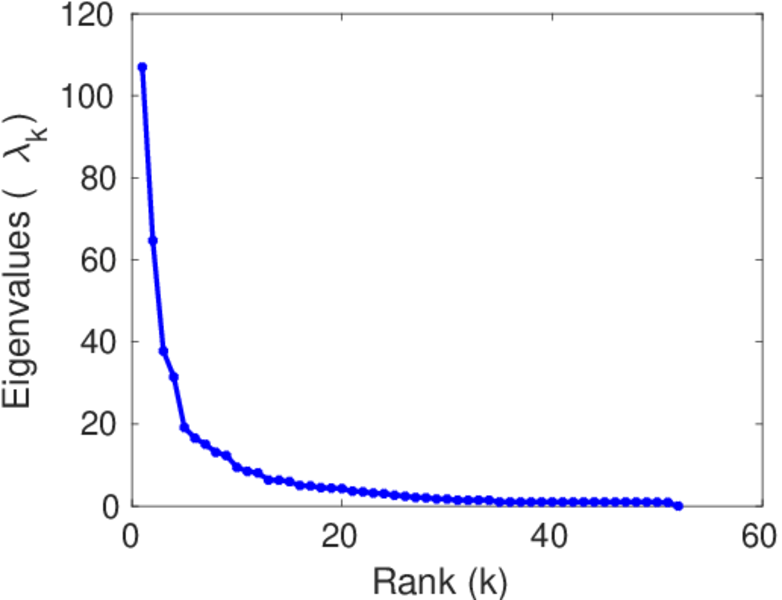
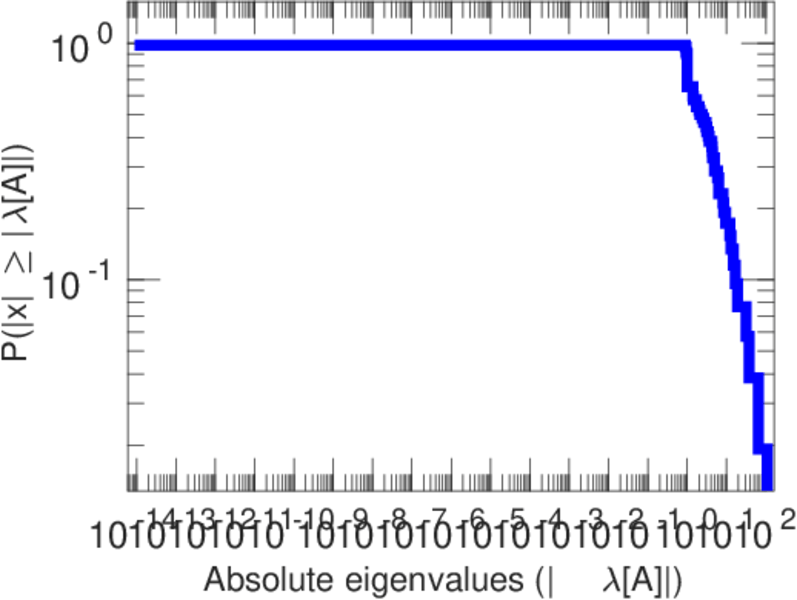
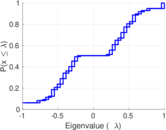
| Spectral norm | α = | 106.964
|
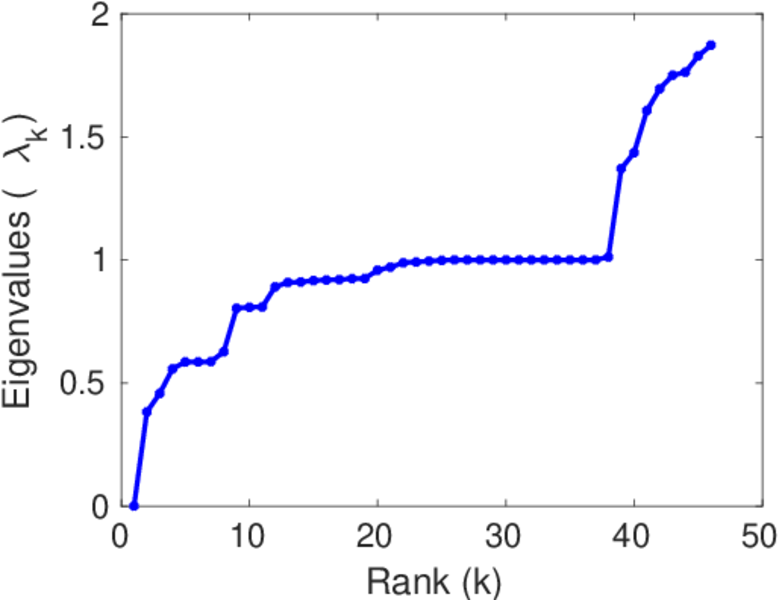
| Algebraic connectivity | a = | 0.382 192
|
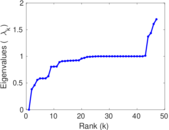
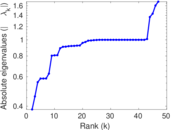
| Spectral separation | |λ1[A] / λ2[A]| = | 1.653 96
|
| Controllability | C = | 1,484
|
| Relative controllability | Cr = | 0.935 687
|
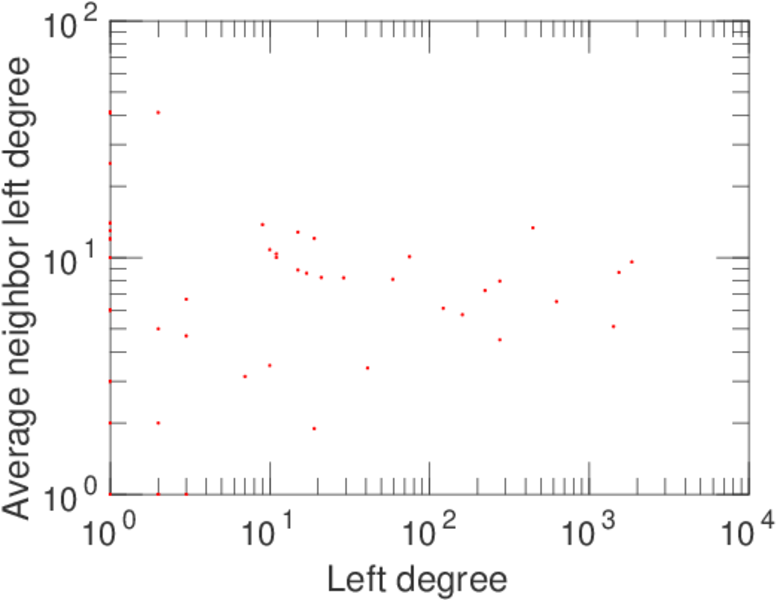
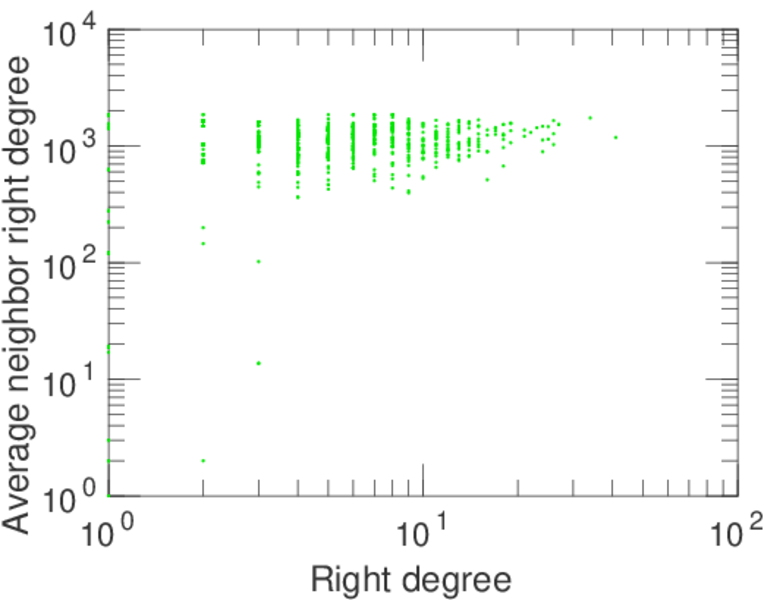
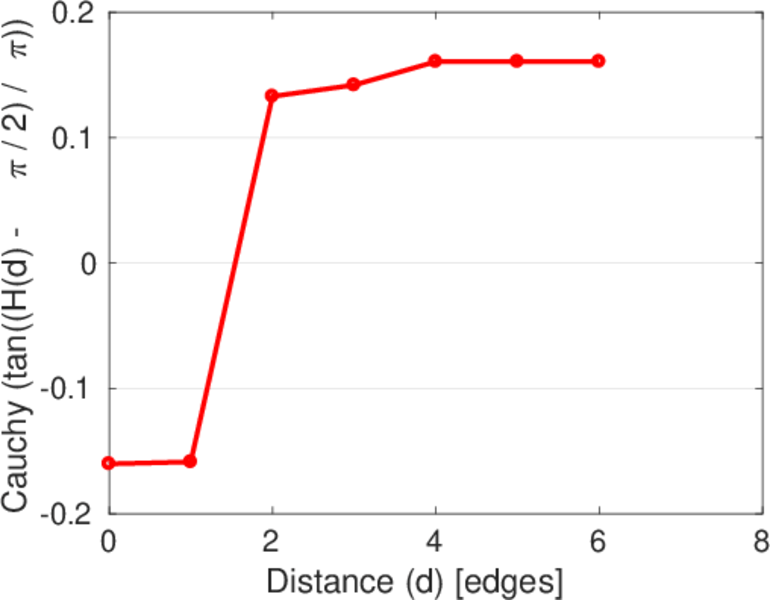
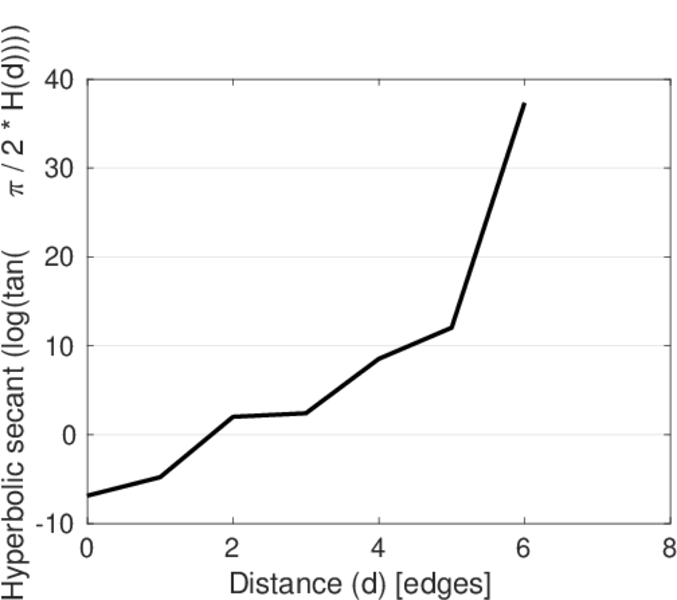
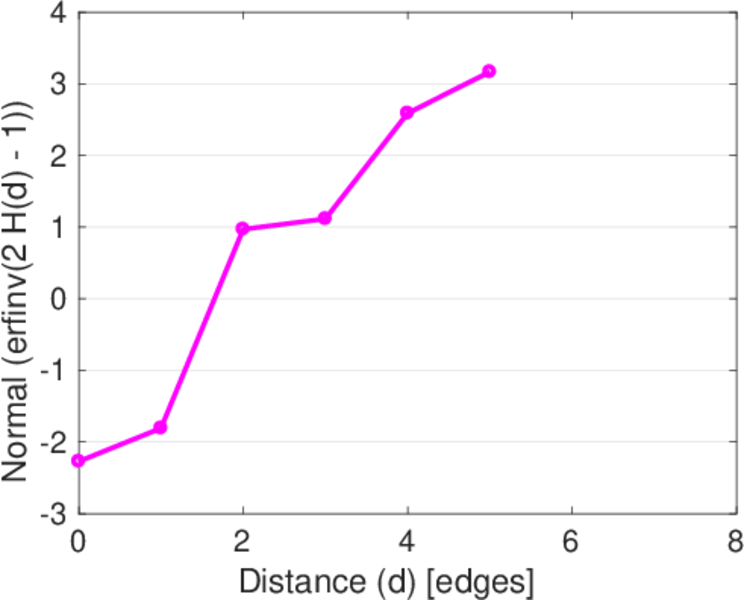
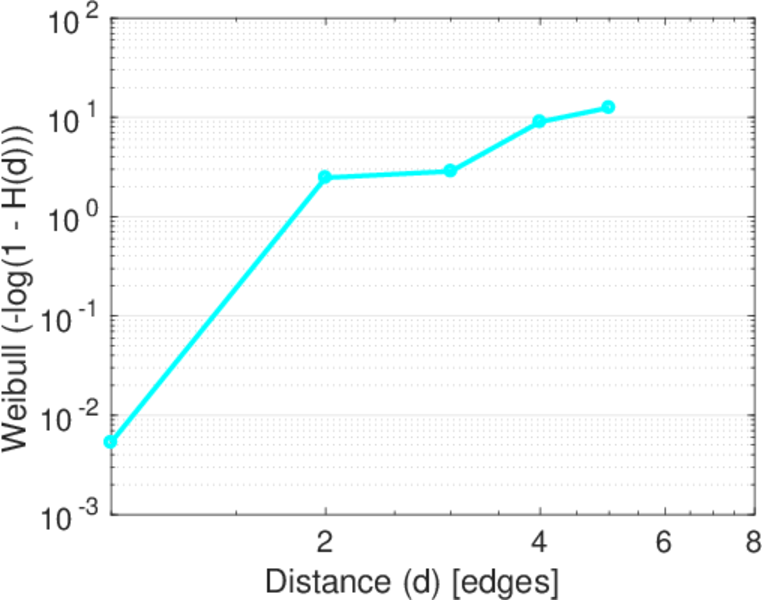
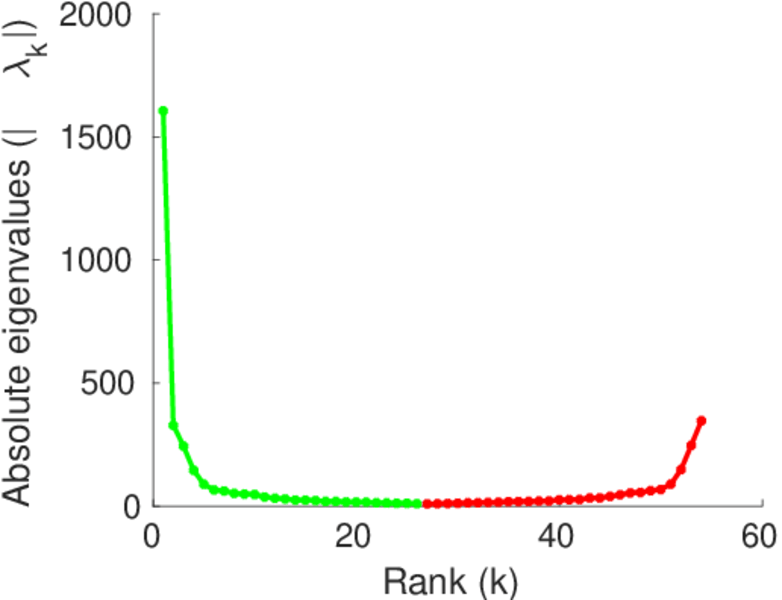
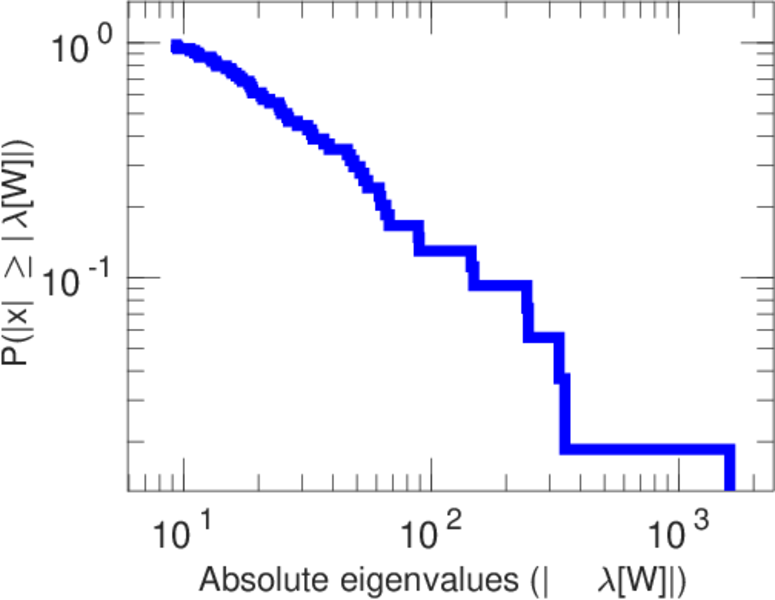
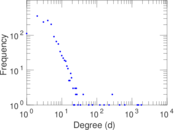
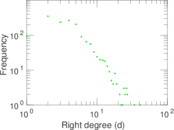
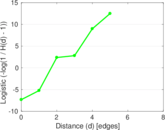
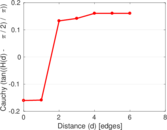
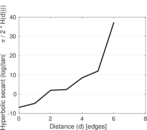
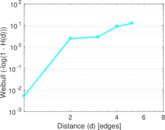
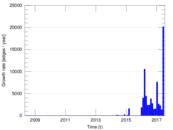
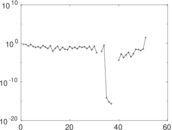
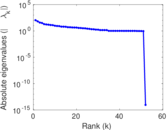
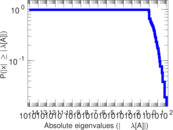
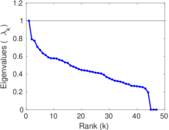
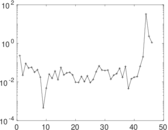
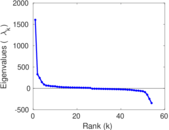
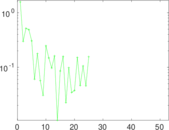
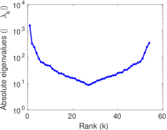
Plots


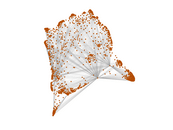


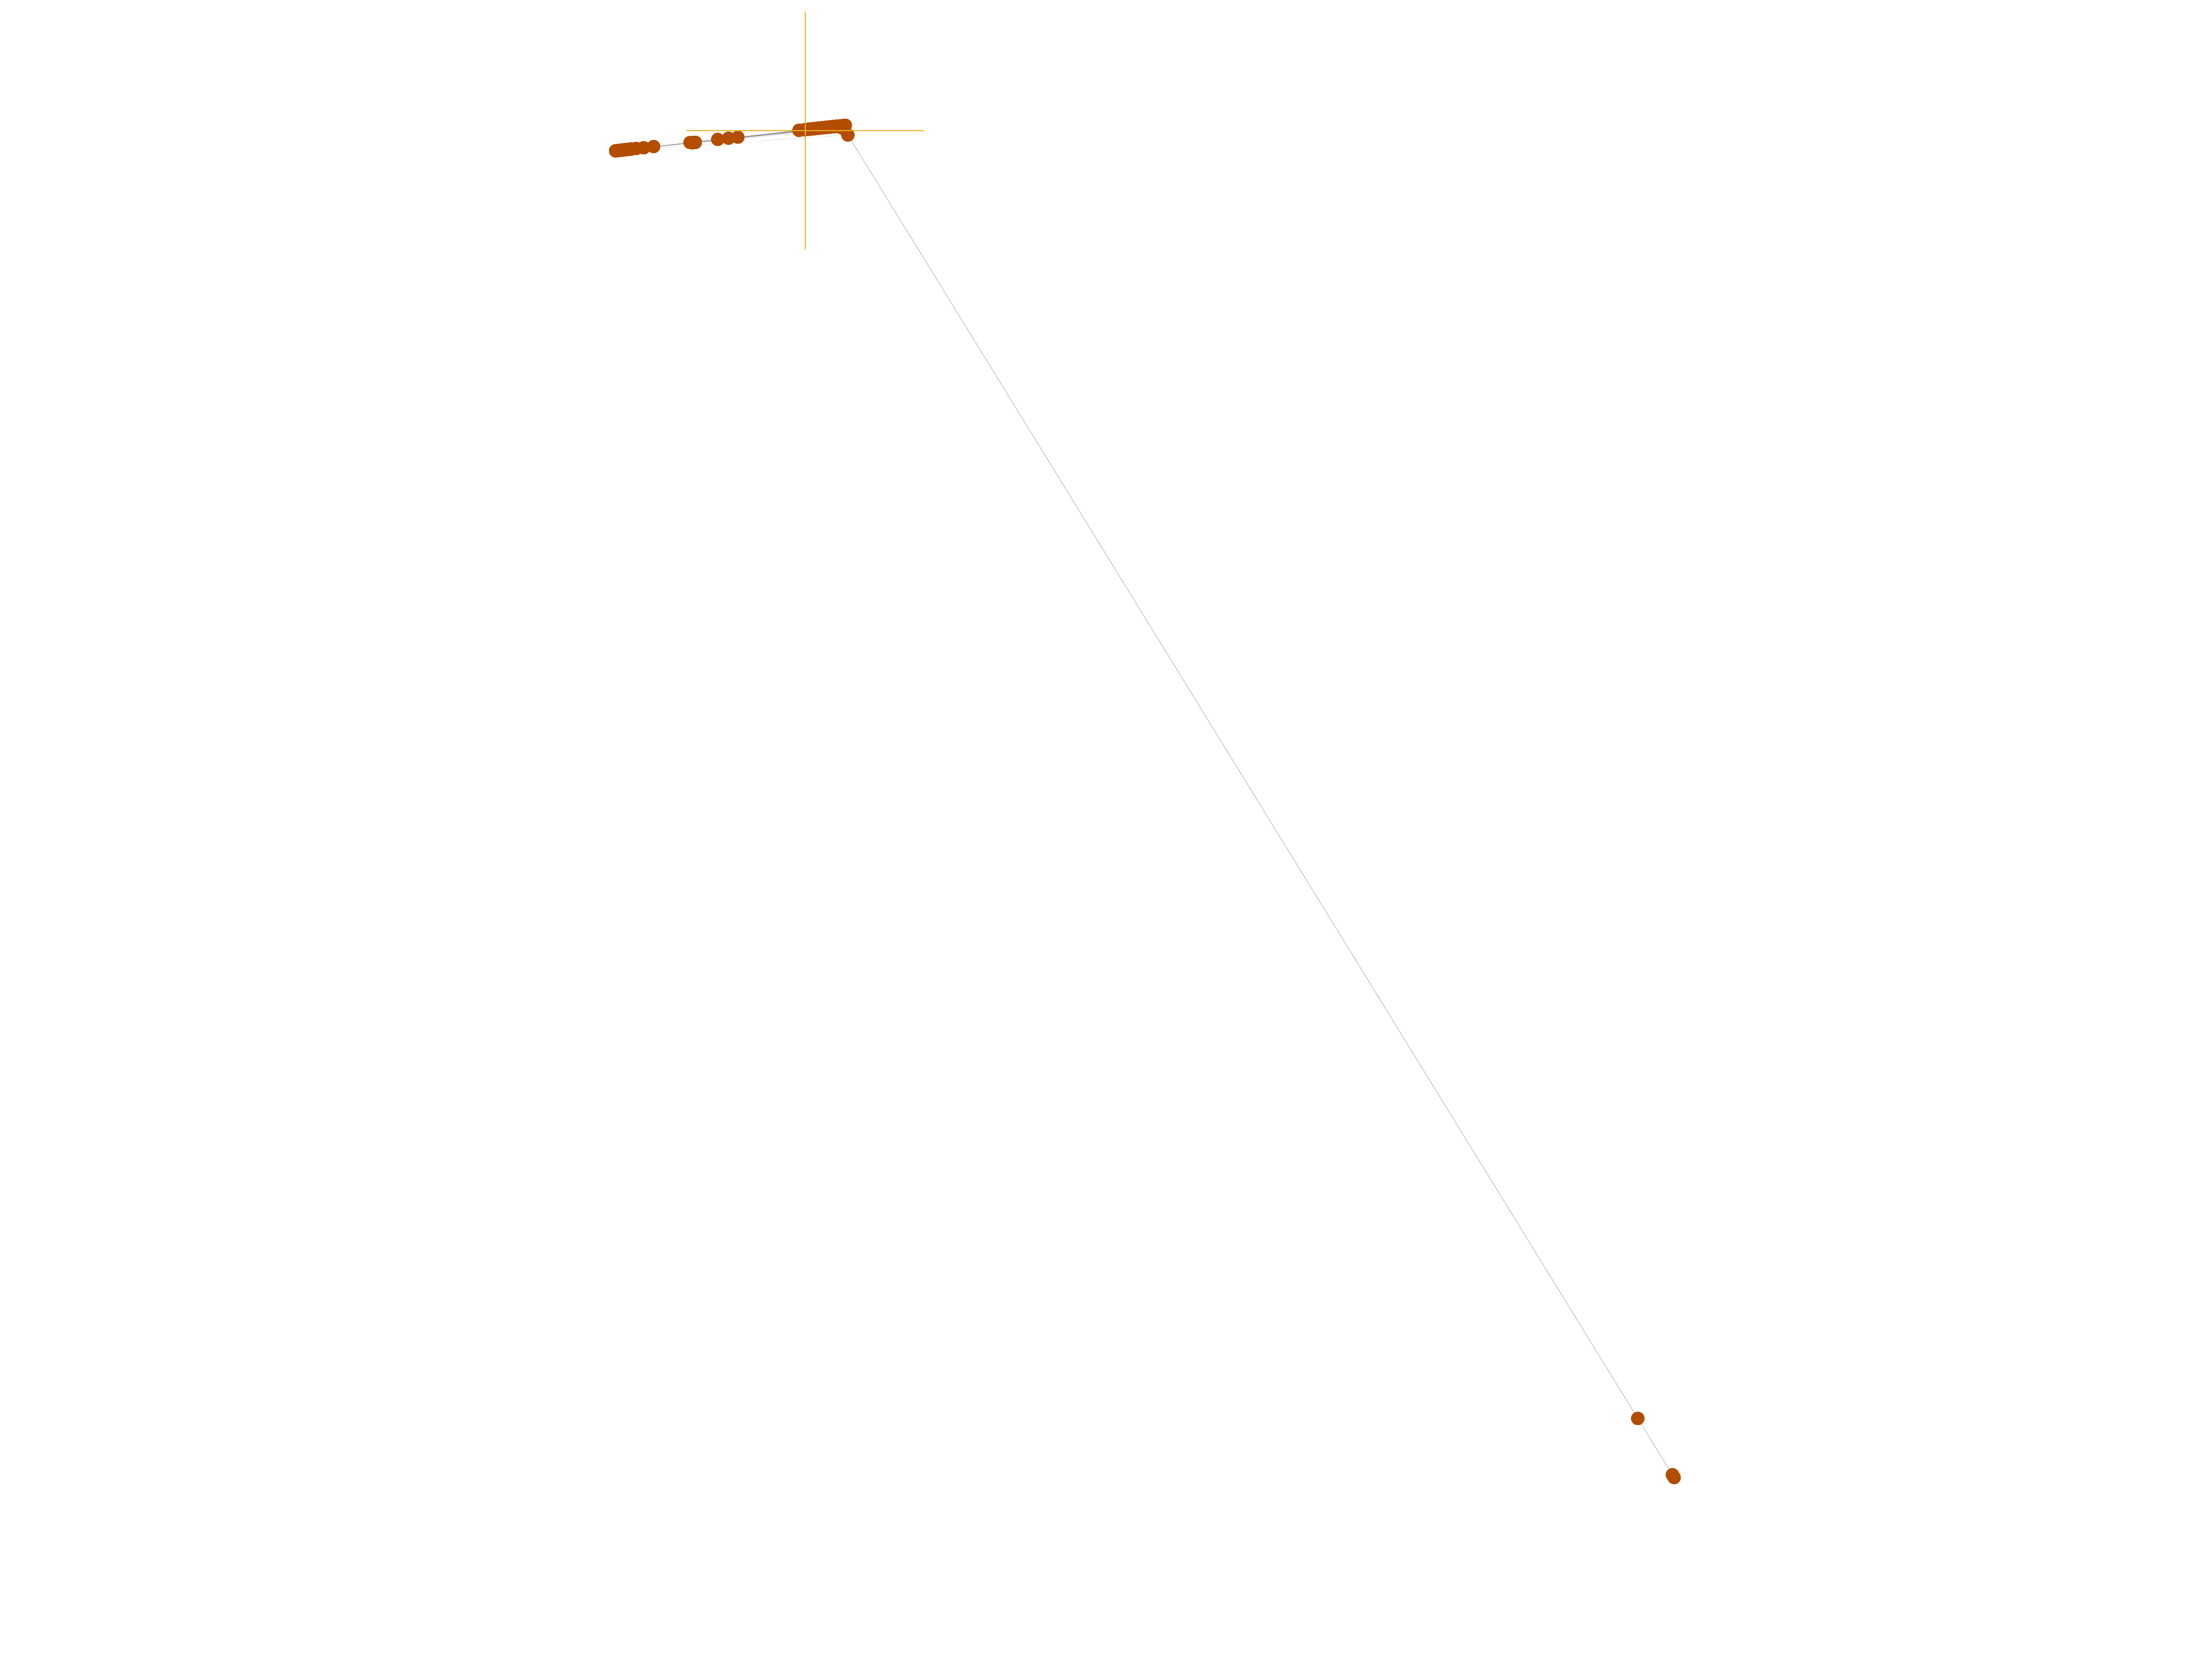
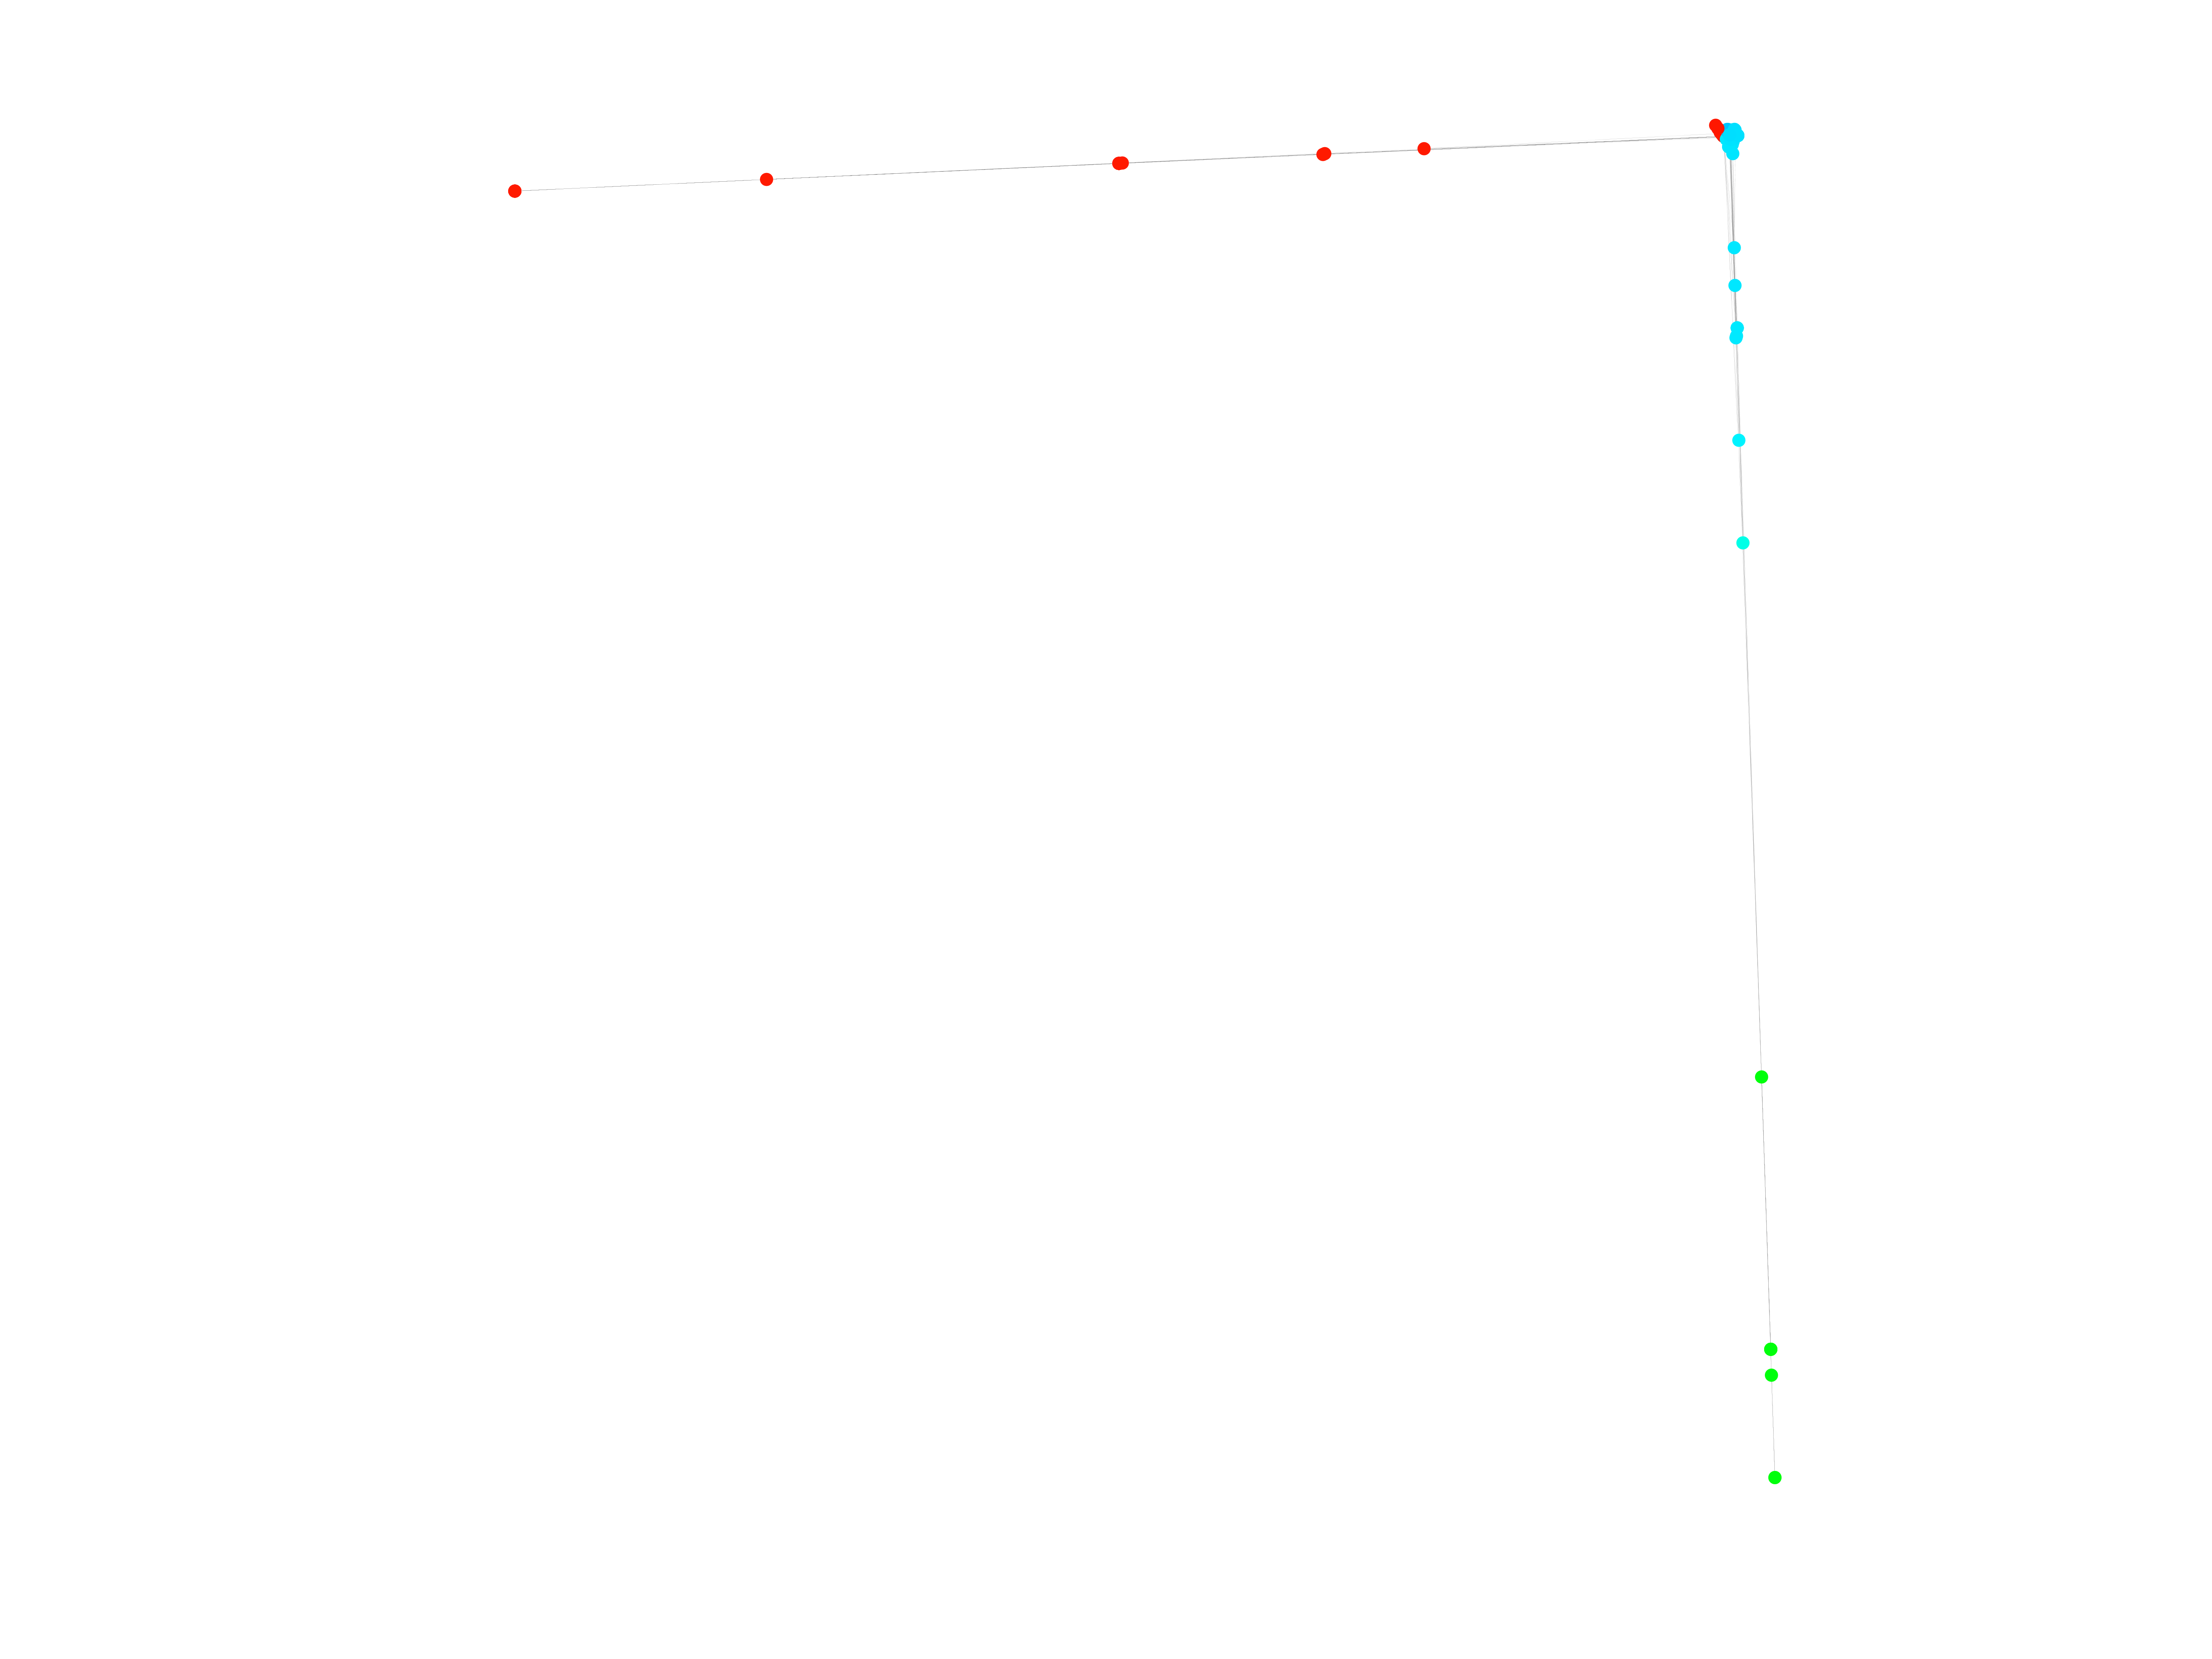
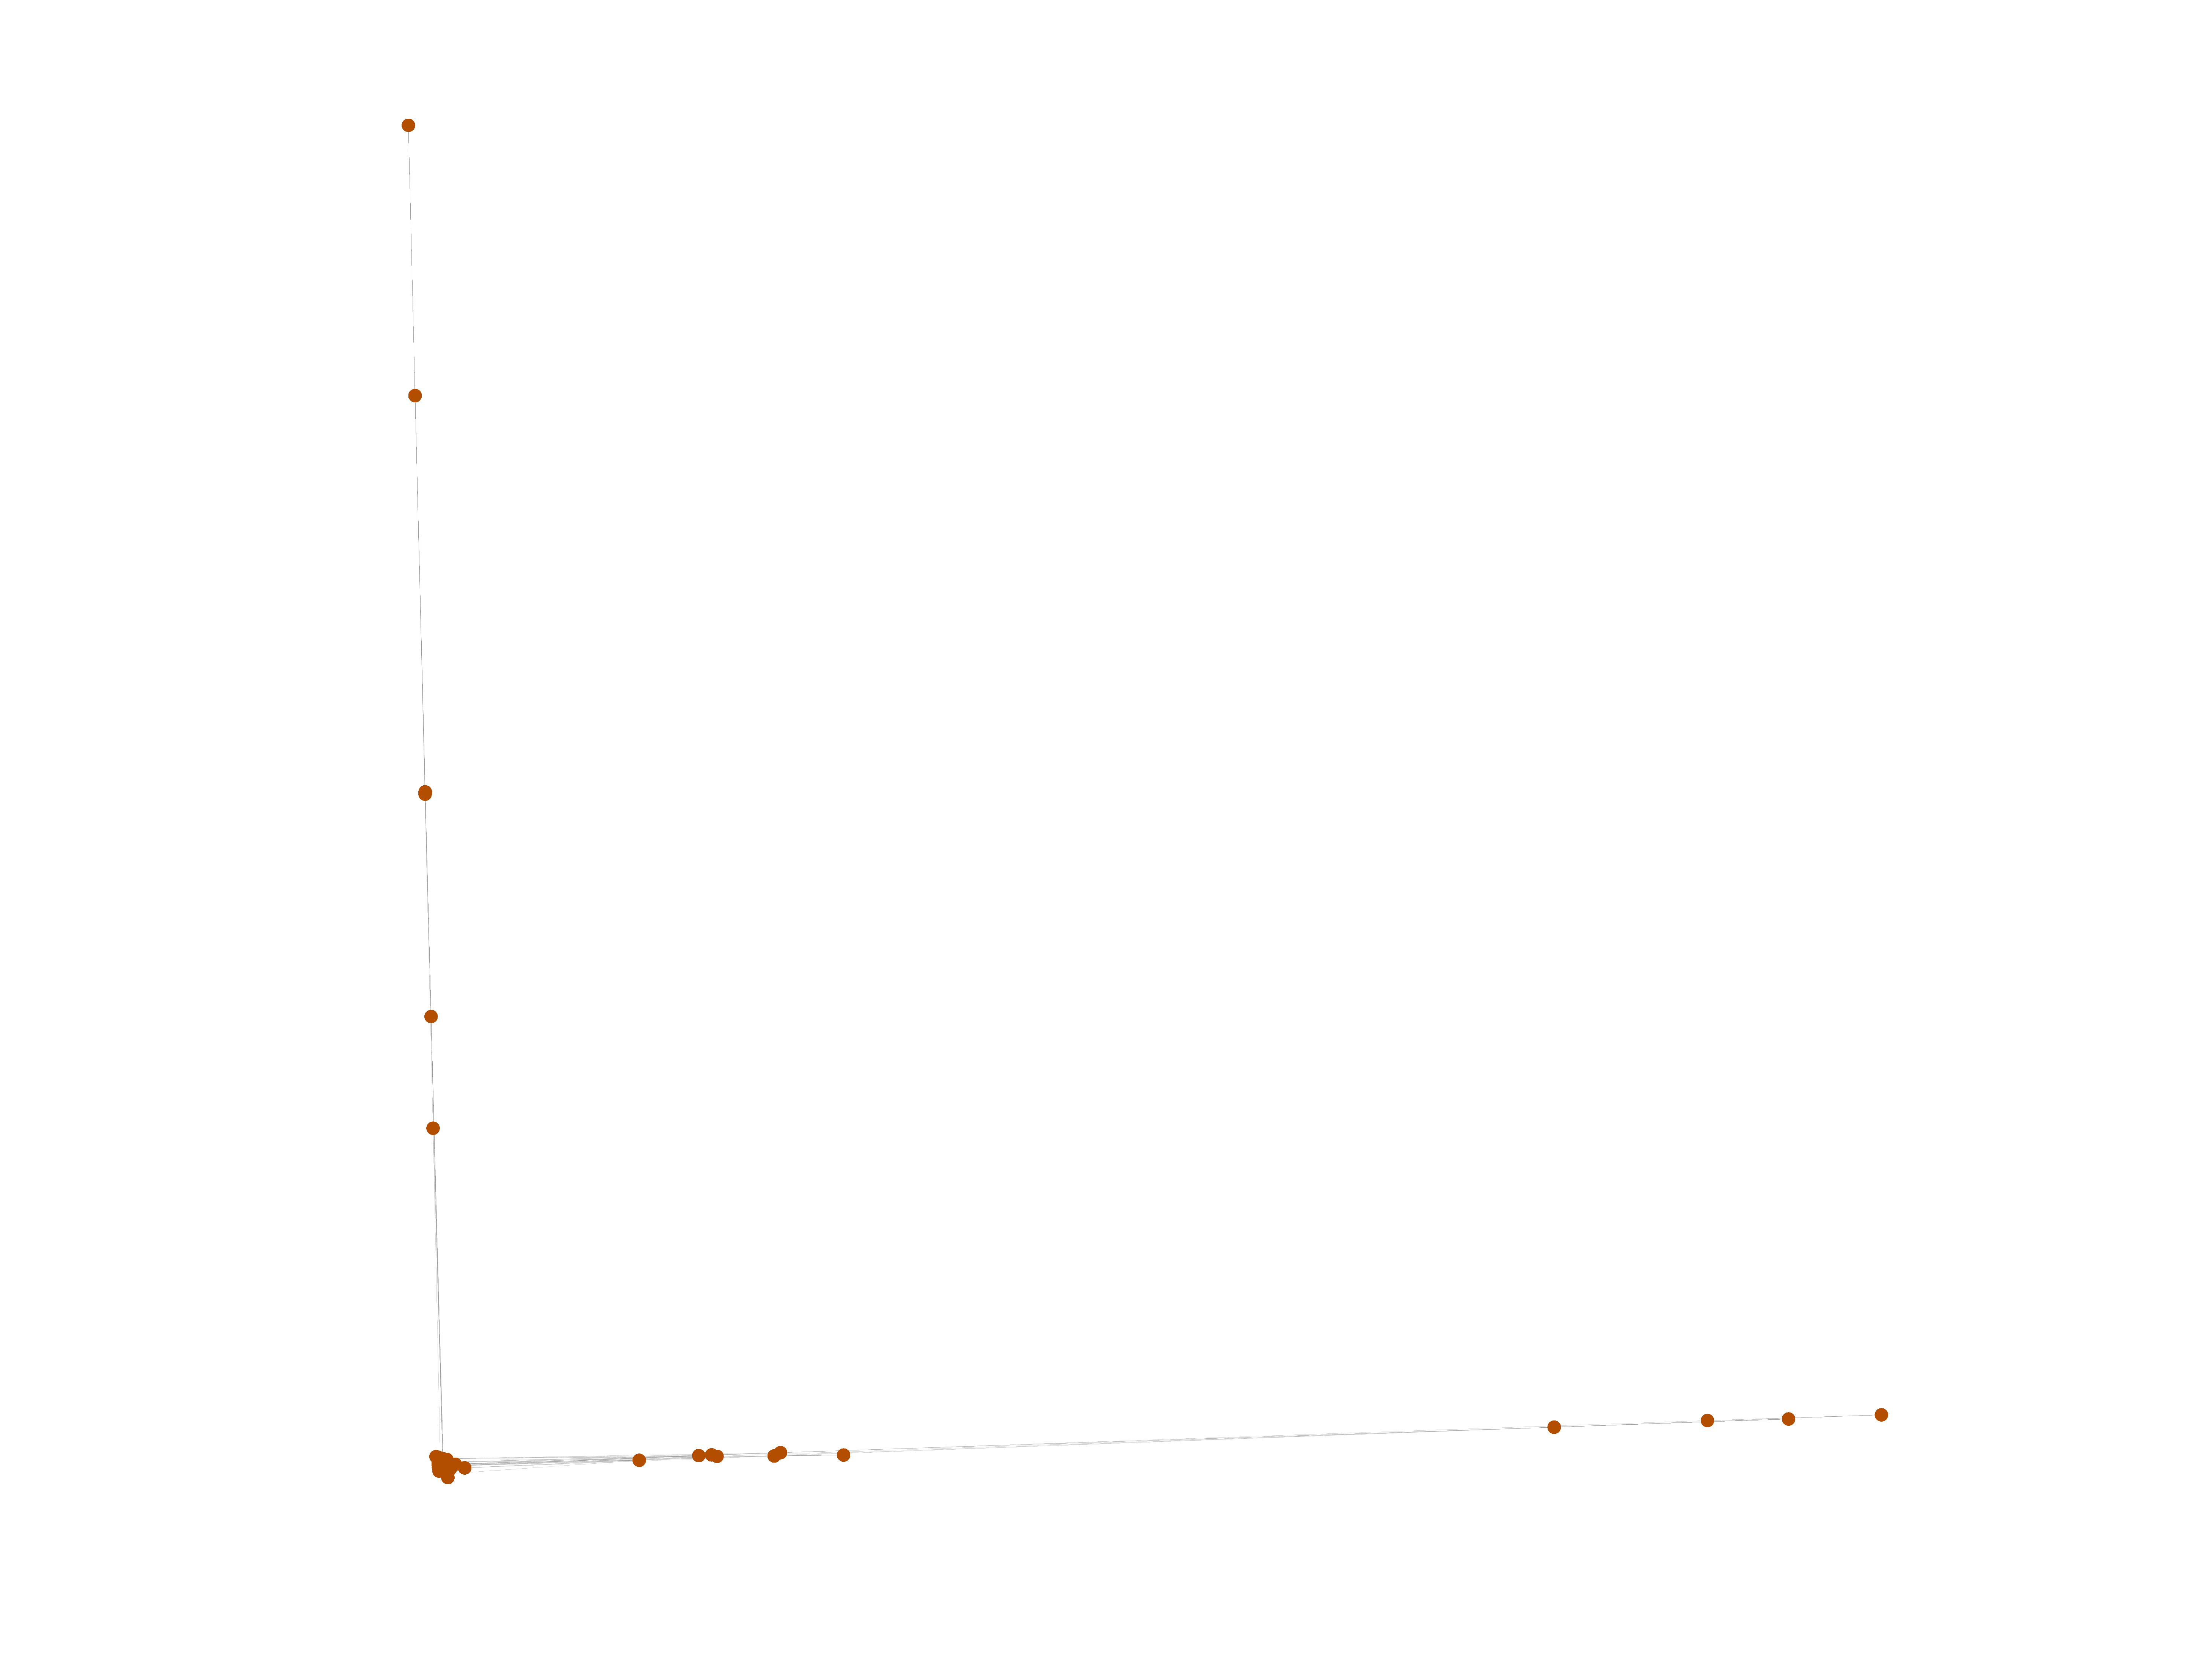
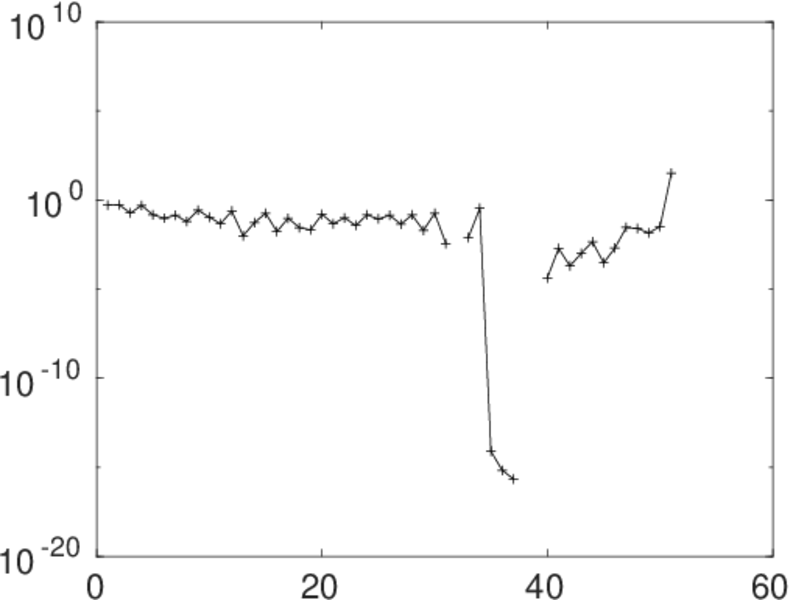
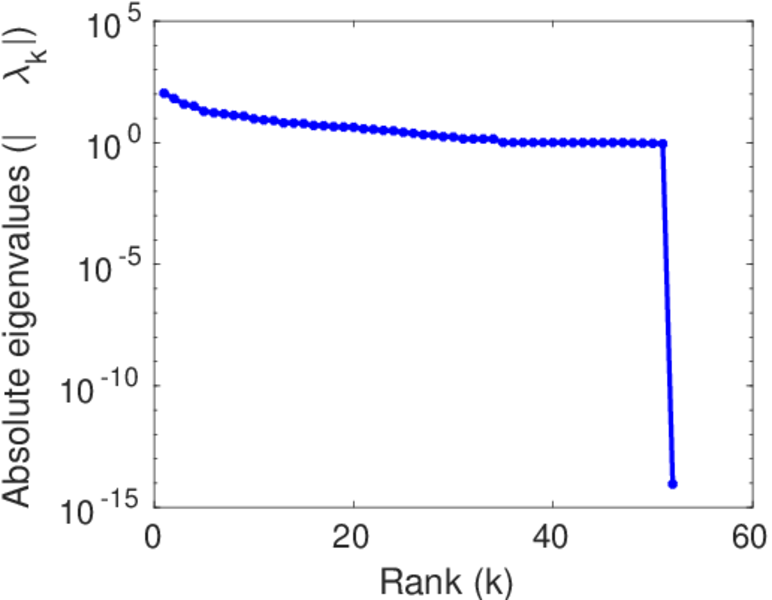
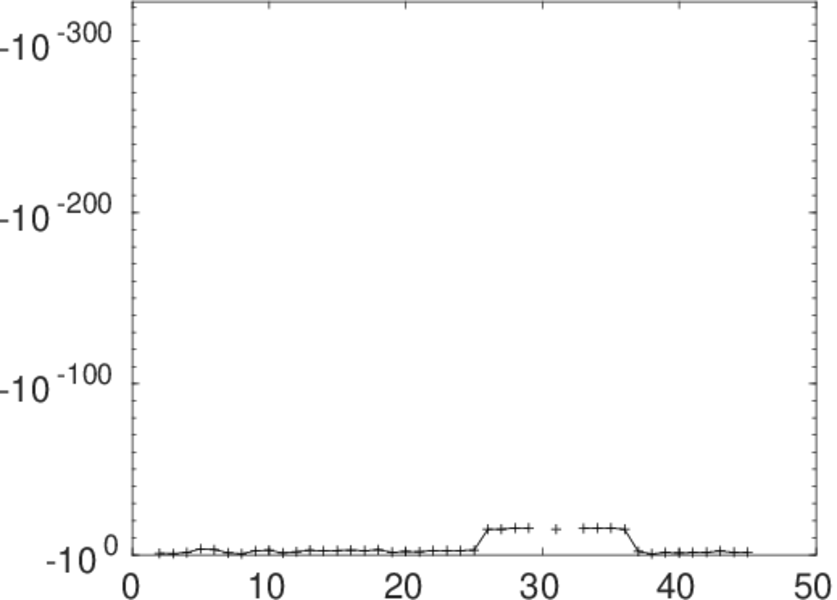
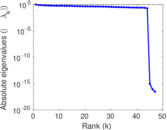
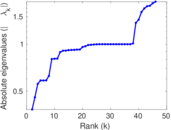
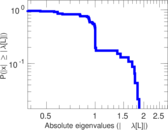
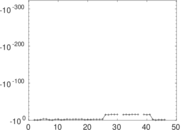
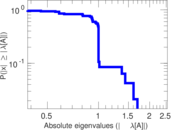
Matrix decompositions plots


Downloads
References
|
[1]
|
Jérôme Kunegis.
KONECT – The Koblenz Network Collection.
In Proc. Int. Conf. on World Wide Web Companion, pages
1343–1350, 2013.
[ http ]
|
|
[2]
|
Wikimedia Foundation.
Wikimedia downloads.
http://dumps.wikimedia.org/, January 2010.
|
 KONECT ‣ Networks ‣
Buy Me a Coffee
KONECT ‣ Networks ‣
Buy Me a Coffee