Wikipedia edits (ki)
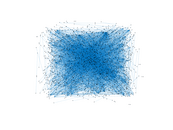
This is the bipartite edit network of the Kikuyu Wikipedia. It contains users
and pages from the Kikuyu Wikipedia, connected by edit events. Each edge
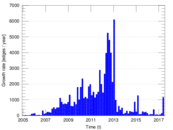
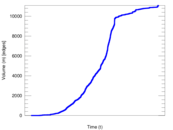
represents an edit. The dataset includes the timestamp of each edit.
Metadata
Statistics
| Size | n = | 3,382
|
| Left size | n1 = | 559
|
| Right size | n2 = | 2,823
|
| Volume | m = | 11,092
|
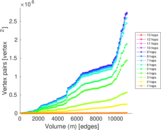
| Unique edge count | m̿ = | 5,147
|
| Wedge count | s = | 277,488
|
| Claw count | z = | 17,168,212
|
| Cross count | x = | 1,109,696,627
|
| Square count | q = | 390,626
|
| 4-Tour count | T4 = | 4,245,386
|
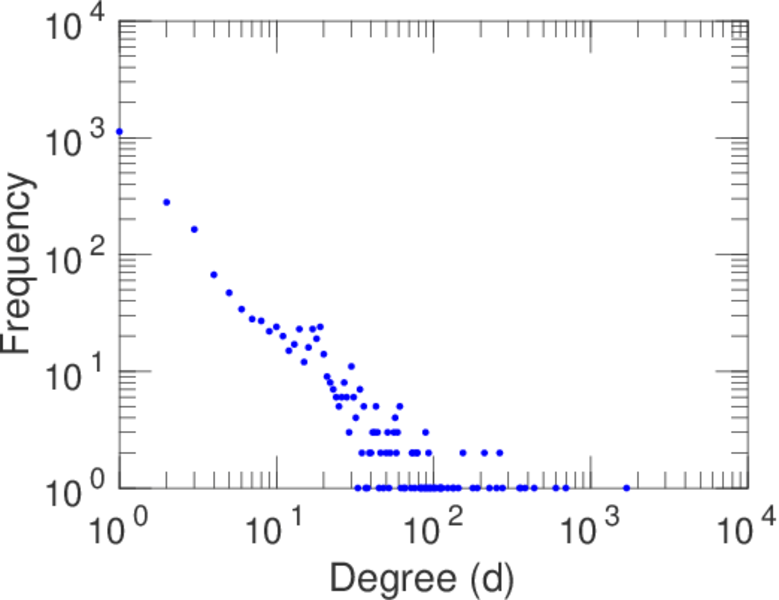
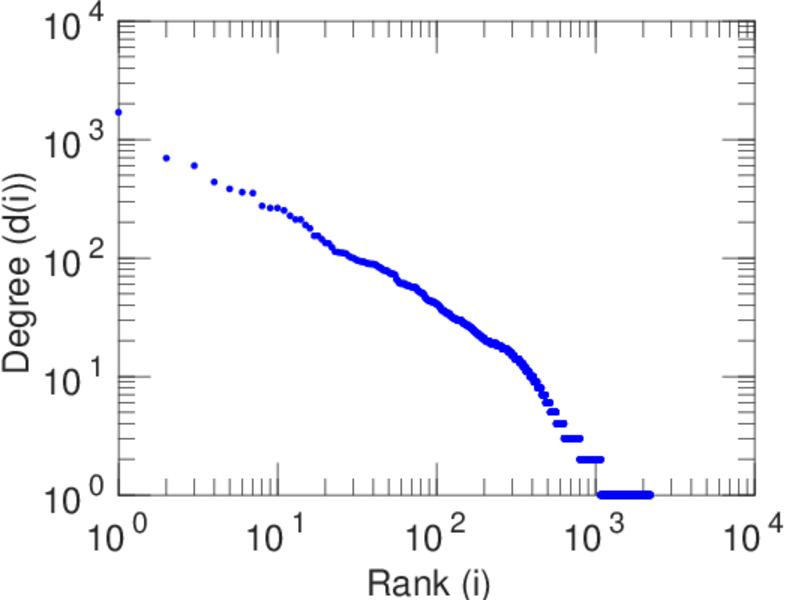
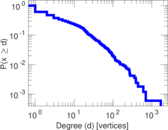
| Maximum degree | dmax = | 1,696
|
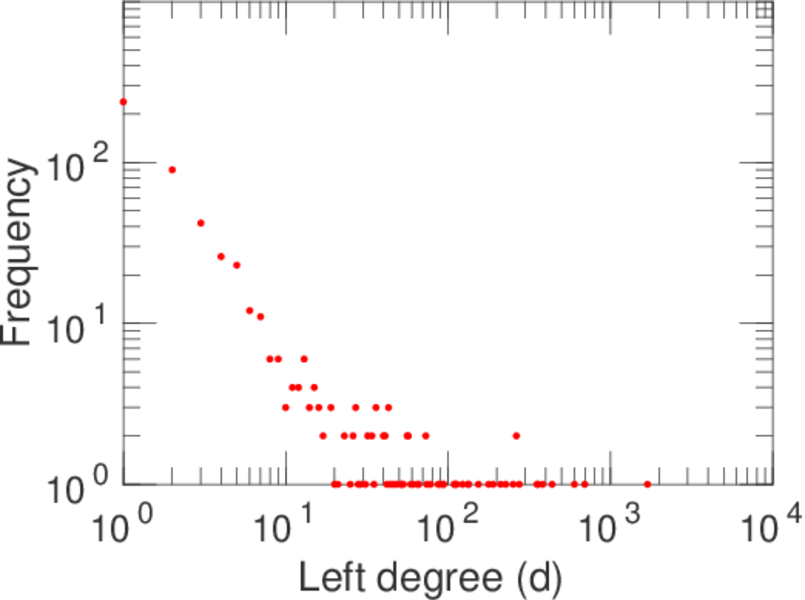
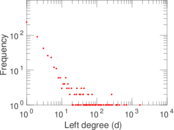
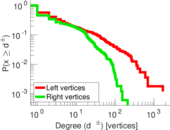
| Maximum left degree | d1max = | 1,696
|
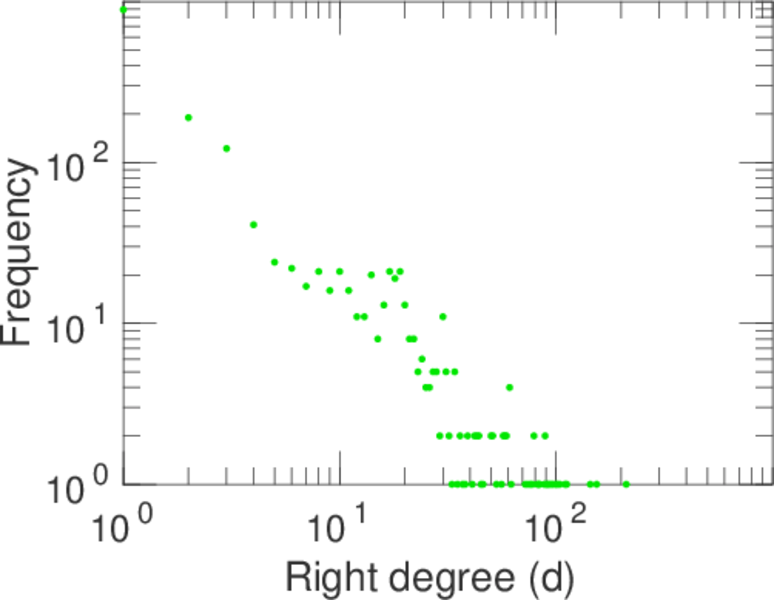
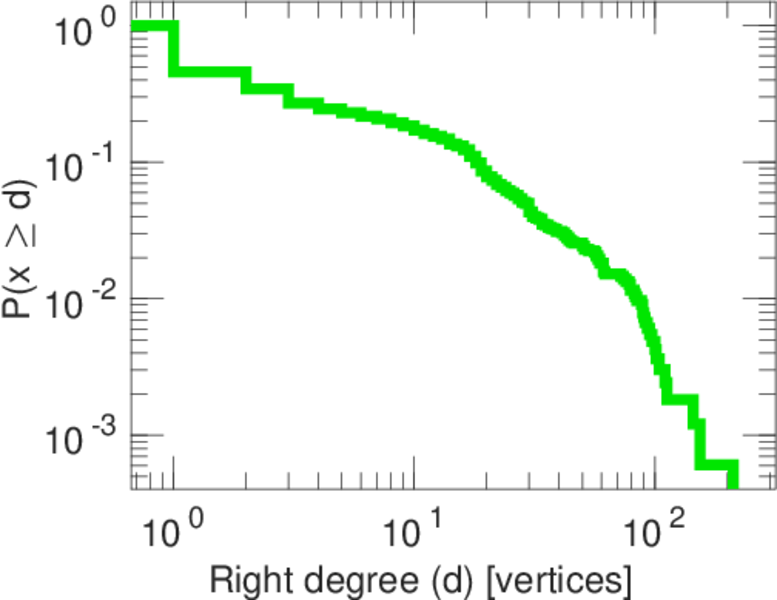
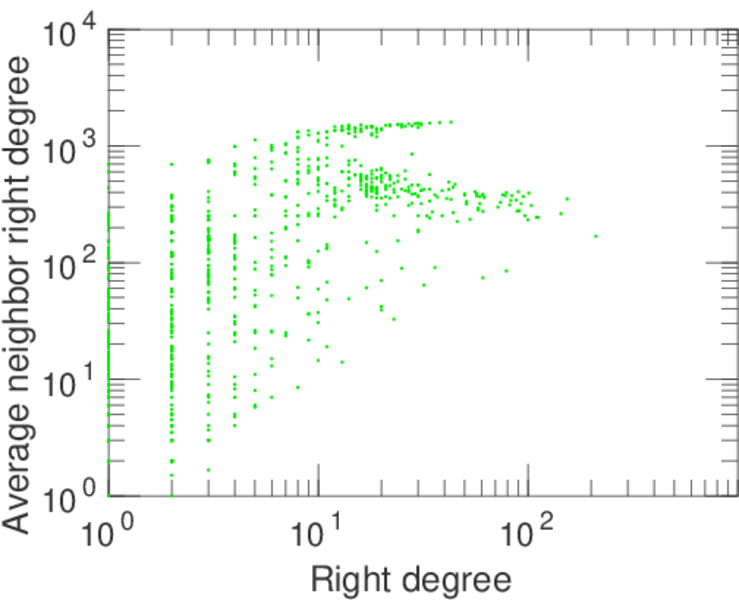
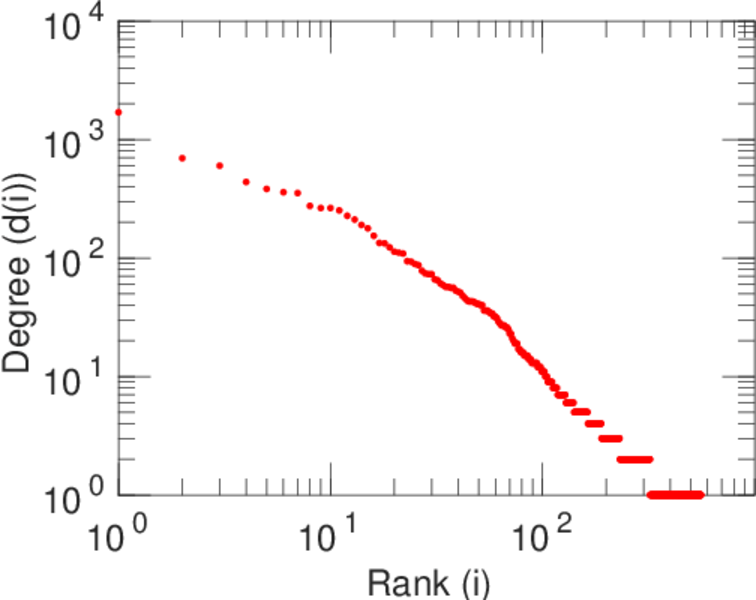
| Maximum right degree | d2max = | 211
|
| Average degree | d = | 6.559 43
|
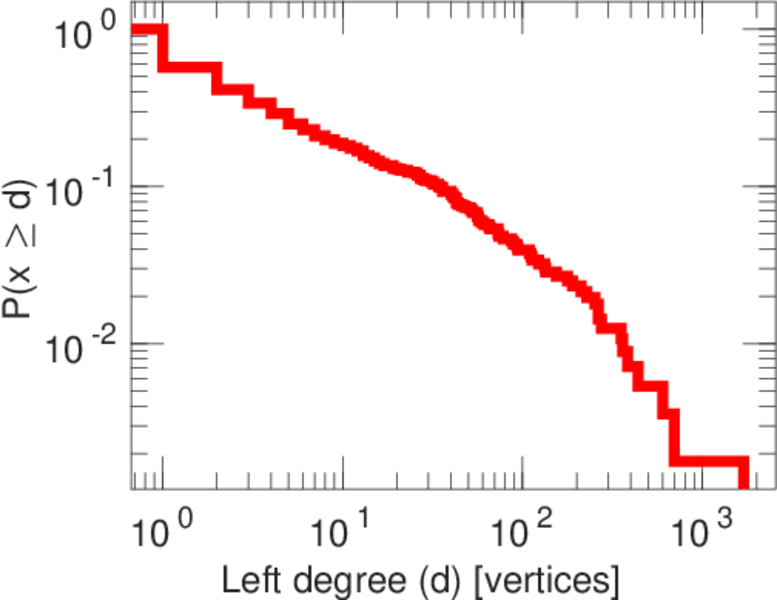
| Average left degree | d1 = | 19.842 6
|
| Average right degree | d2 = | 3.929 15
|
| Fill | p = | 0.003 261 61
|
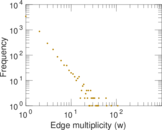
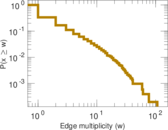
| Average edge multiplicity | m̃ = | 2.155 04
|
| Size of LCC | N = | 1,652
|
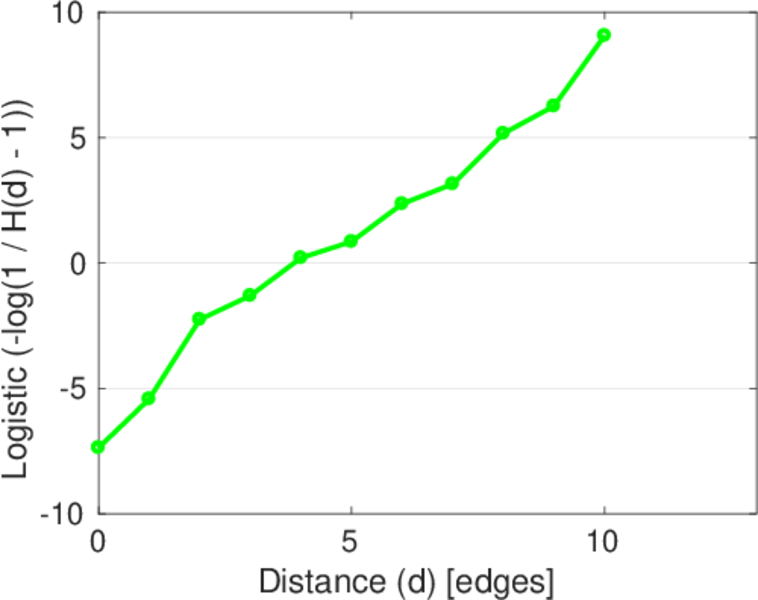
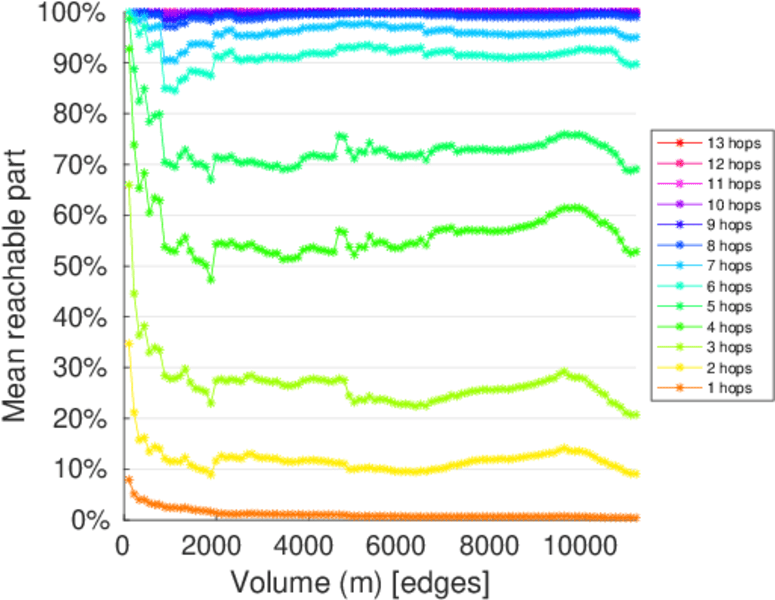
| Diameter | δ = | 13
|
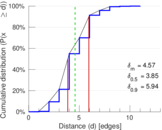
| 50-Percentile effective diameter | δ0.5 = | 3.853 31
|
| 90-Percentile effective diameter | δ0.9 = | 5.937 89
|
| Median distance | δM = | 4
|
| Mean distance | δm = | 4.574 51
|
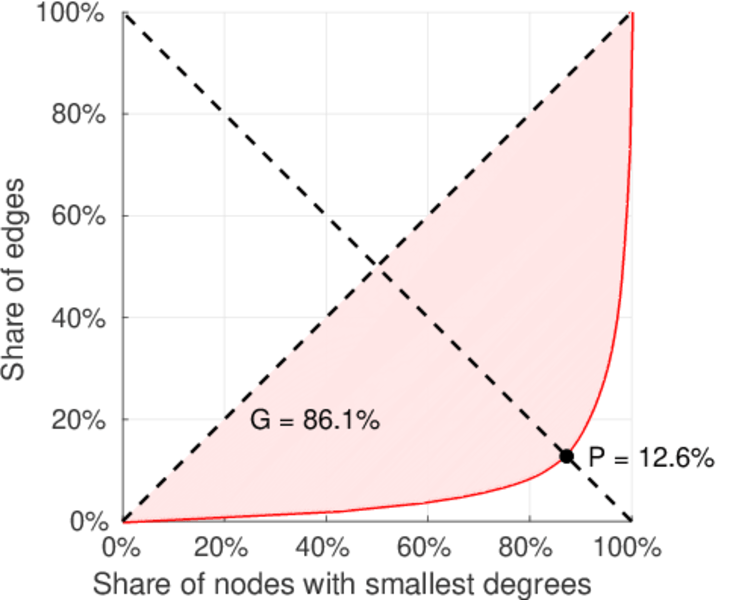
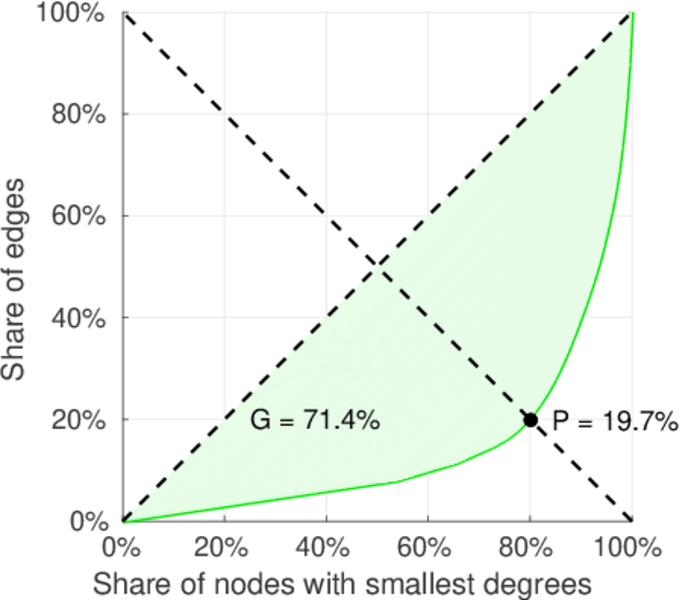
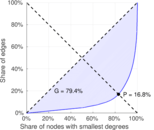
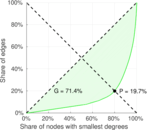
| Gini coefficient | G = | 0.786 243
|
| Balanced inequality ratio | P = | 0.181 798
|
| Left balanced inequality ratio | P1 = | 0.126 037
|
| Right balanced inequality ratio | P2 = | 0.197 169
|
| Relative edge distribution entropy | Her = | 0.836 351
|
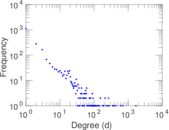
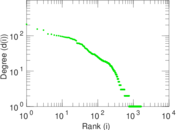
| Power law exponent | γ = | 2.542 36
|
| Tail power law exponent | γt = | 1.921 00
|
| Tail power law exponent with p | γ3 = | 1.921 00
|
| p-value | p = | 0.000 00
|
| Left tail power law exponent with p | γ3,1 = | 1.721 00
|
| Left p-value | p1 = | 0.530 000
|
| Right tail power law exponent with p | γ3,2 = | 2.011 00
|
| Right p-value | p2 = | 0.000 00
|
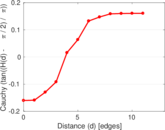
| Degree assortativity | ρ = | −0.076 472 5
|
| Degree assortativity p-value | pρ = | 3.950 60 × 10−8
|
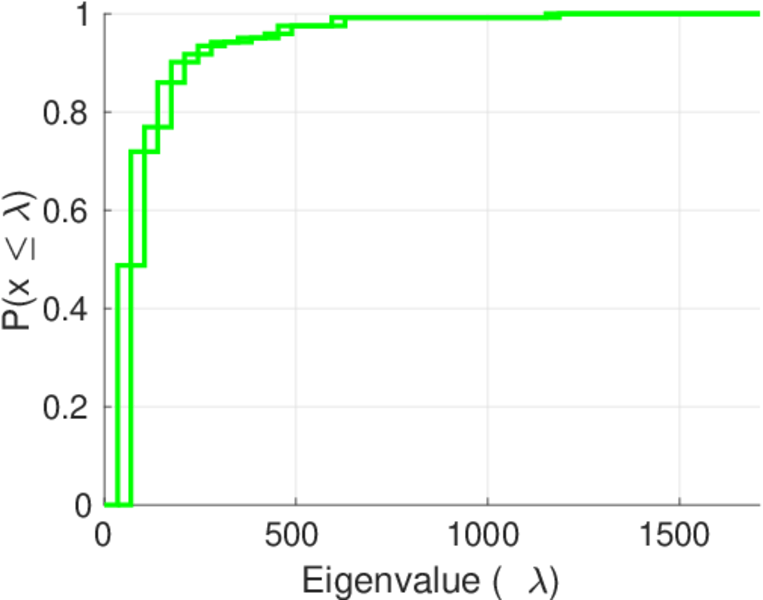
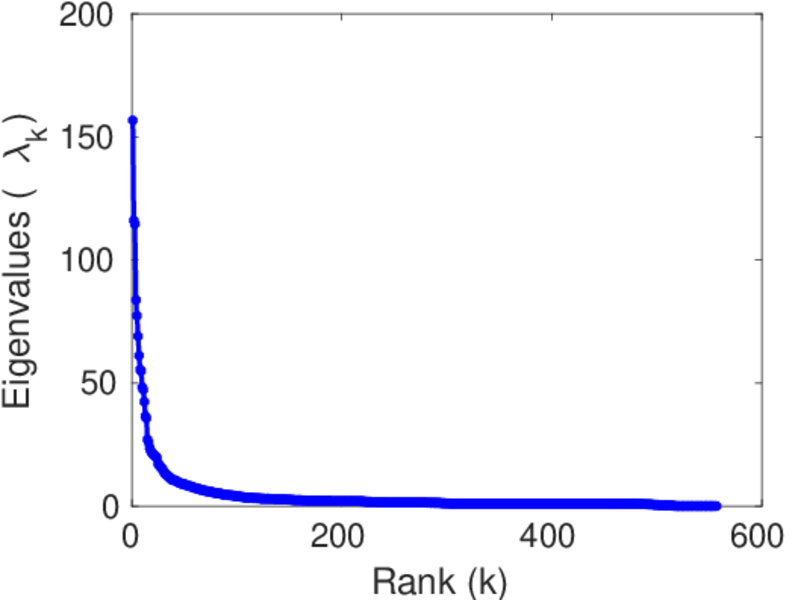
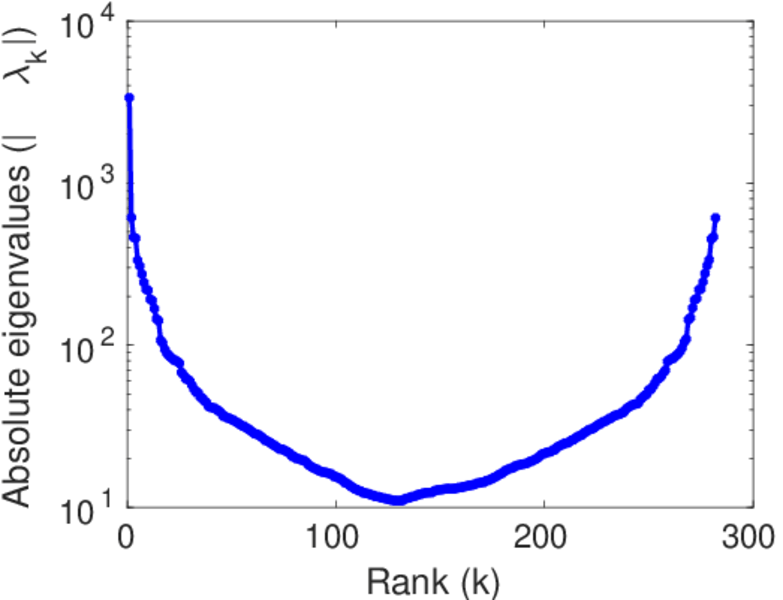
| Spectral norm | α = | 156.645
|
| Algebraic connectivity | a = | 0.027 108 7
|
| Spectral separation | |λ1[A] / λ2[A]| = | 1.349 80
|
| Controllability | C = | 1,171
|
| Relative controllability | Cr = | 0.531 066
|
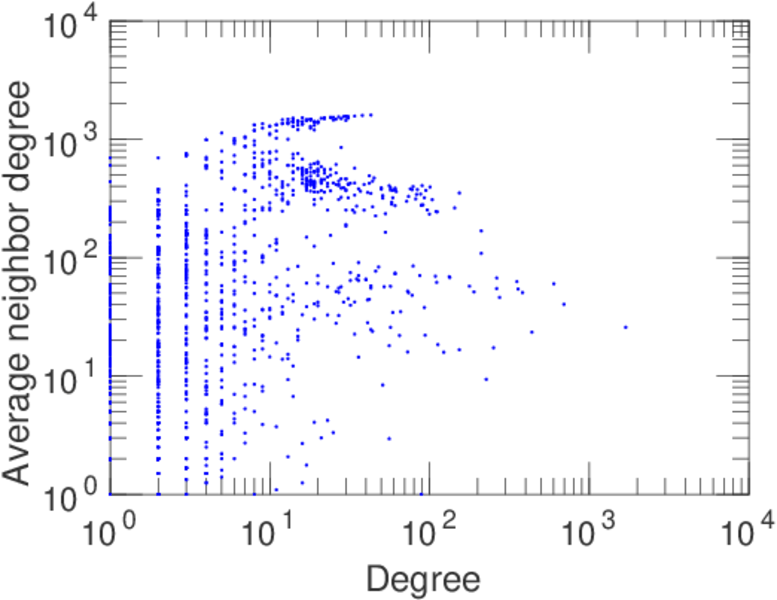
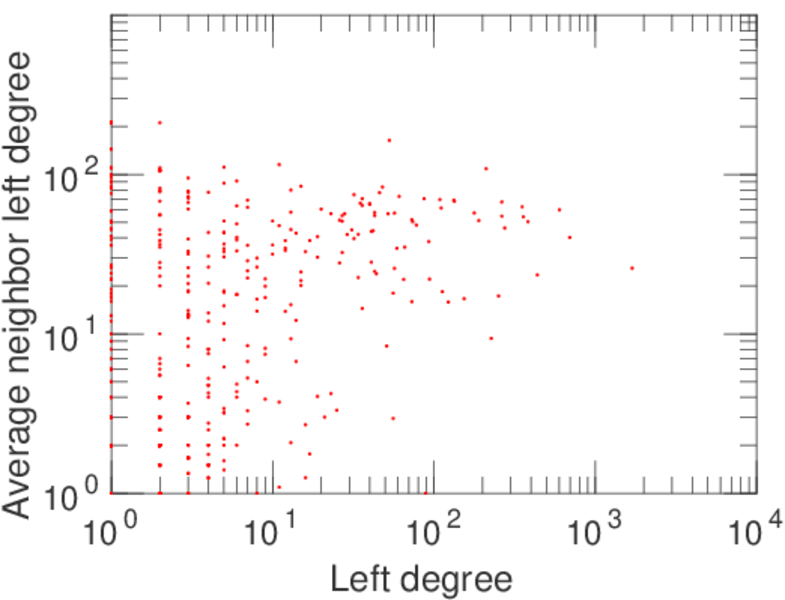
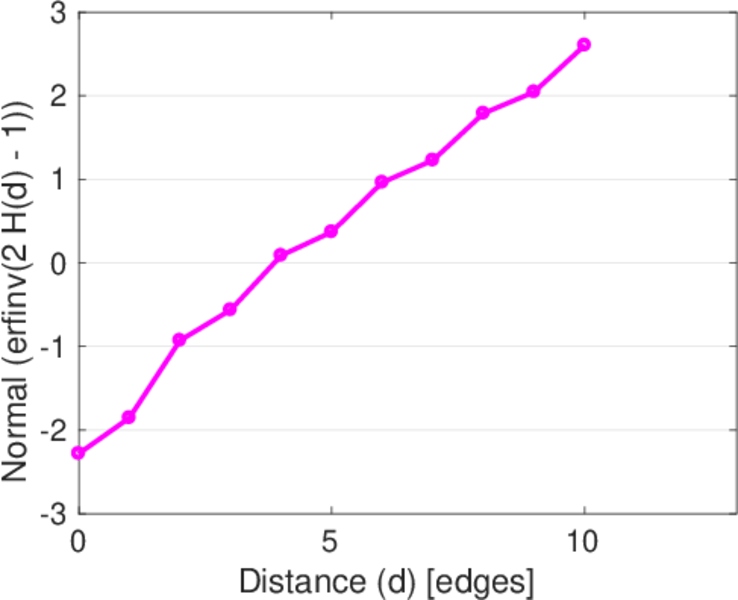
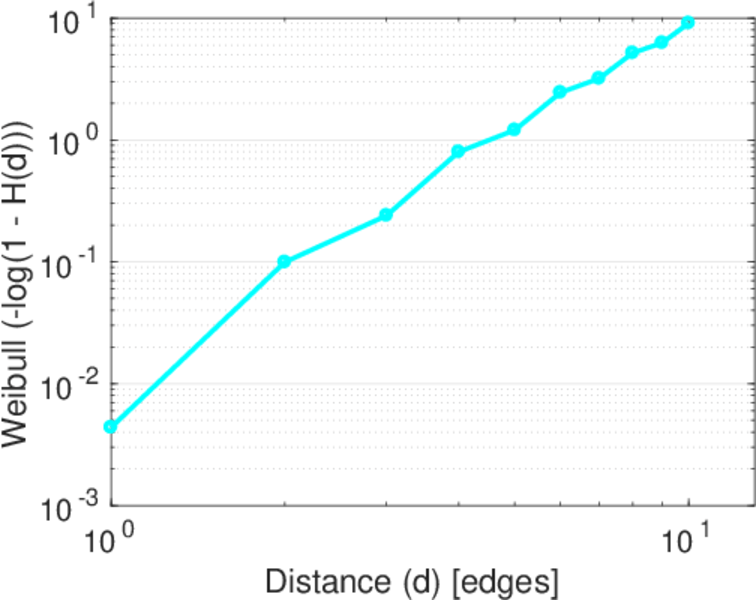
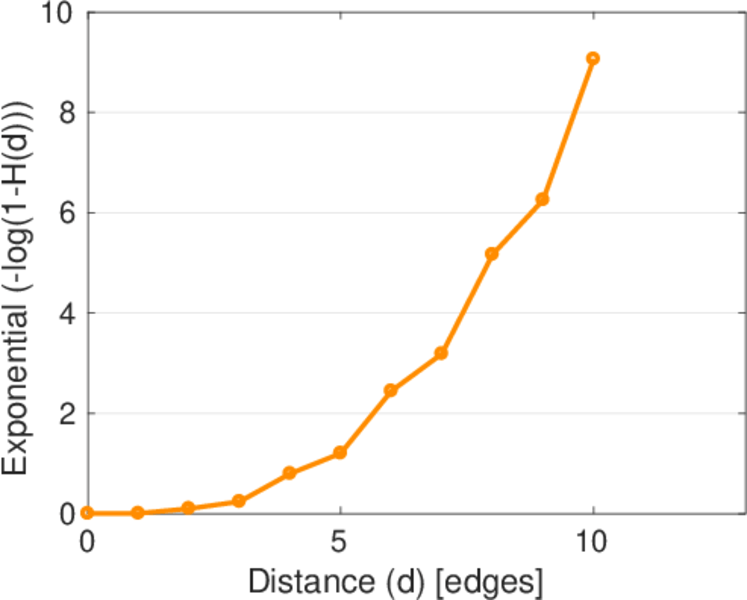
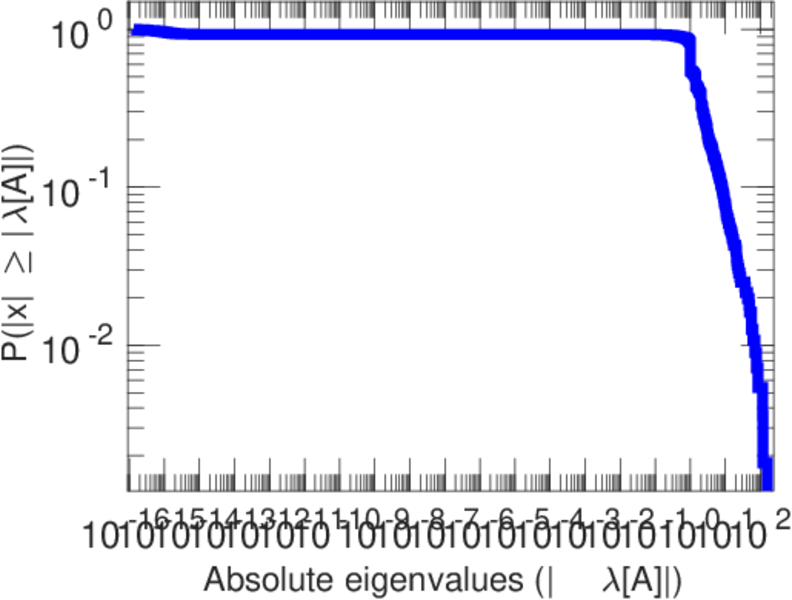
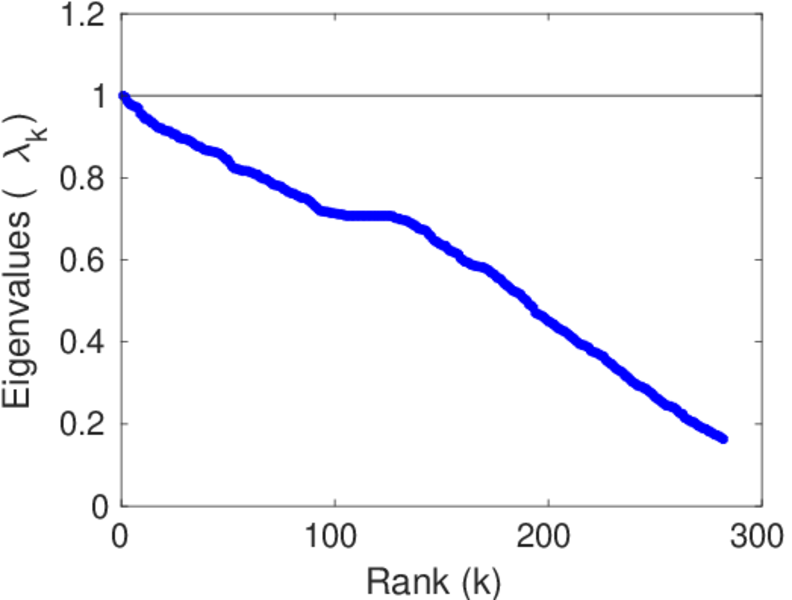
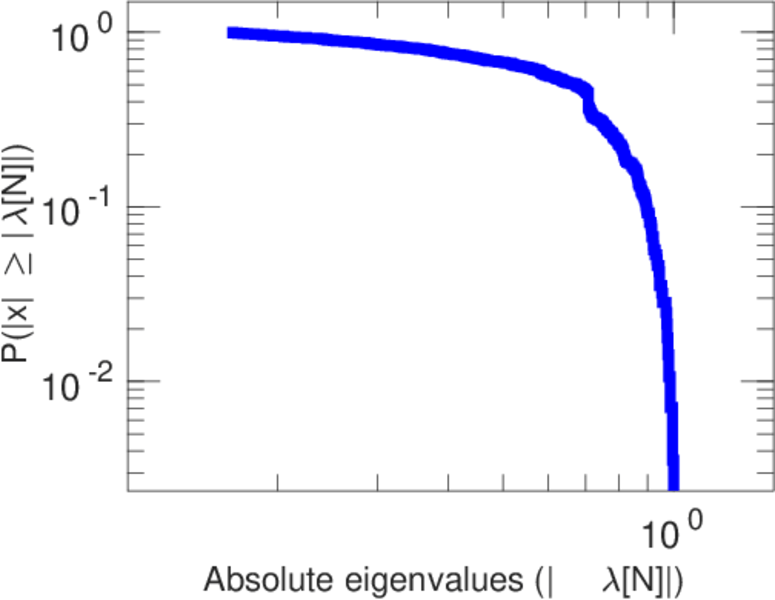
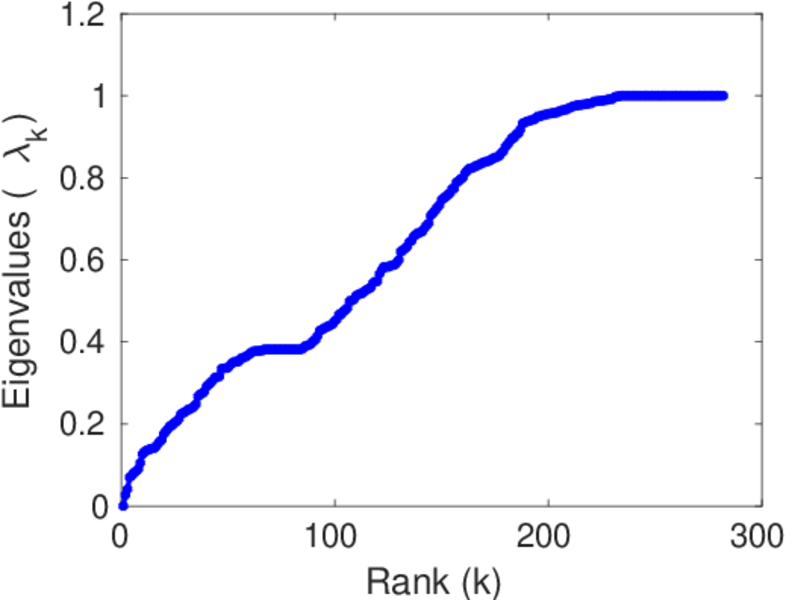
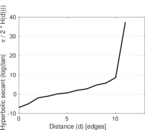
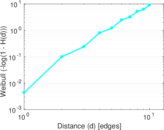
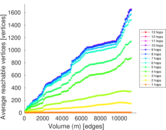
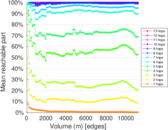
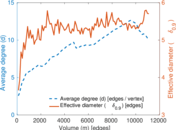
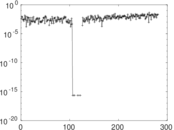
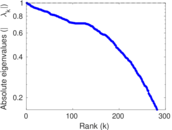
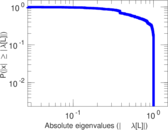
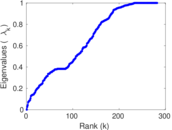
Plots


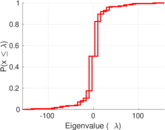
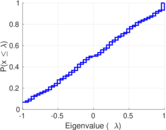

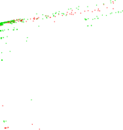


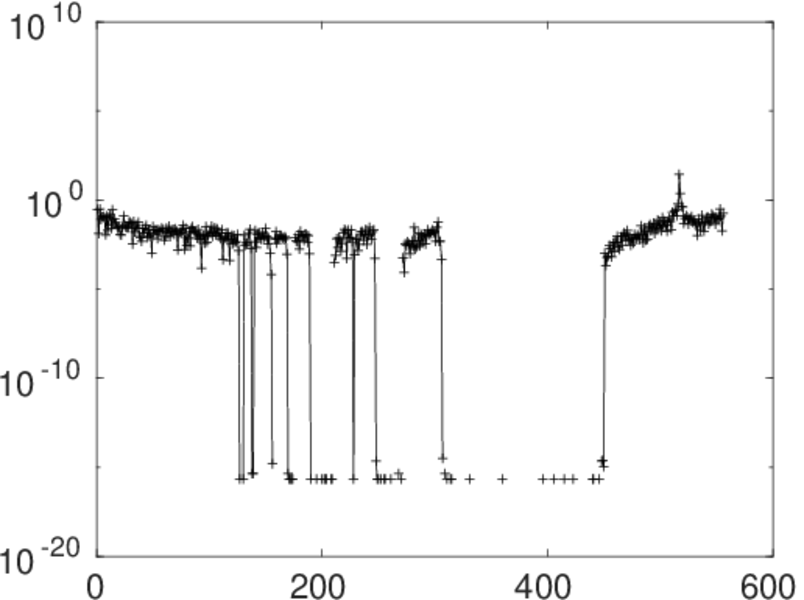
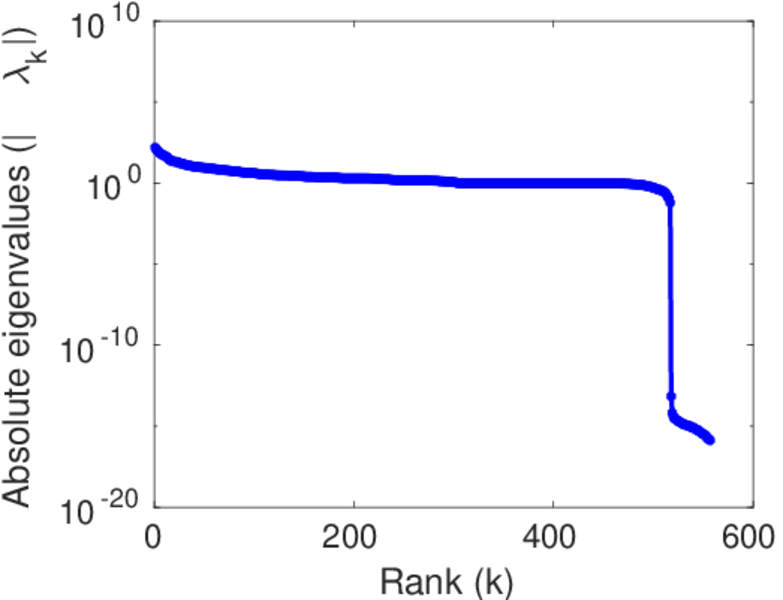
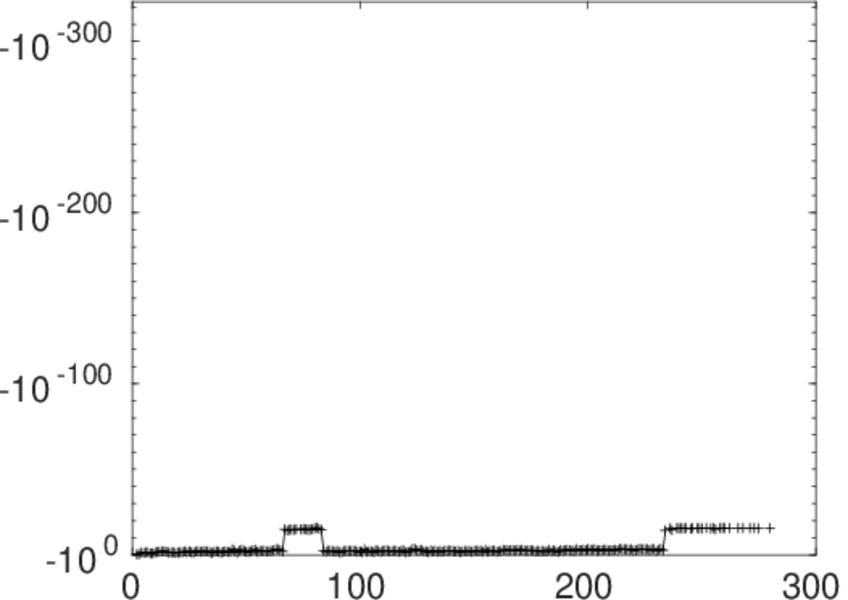
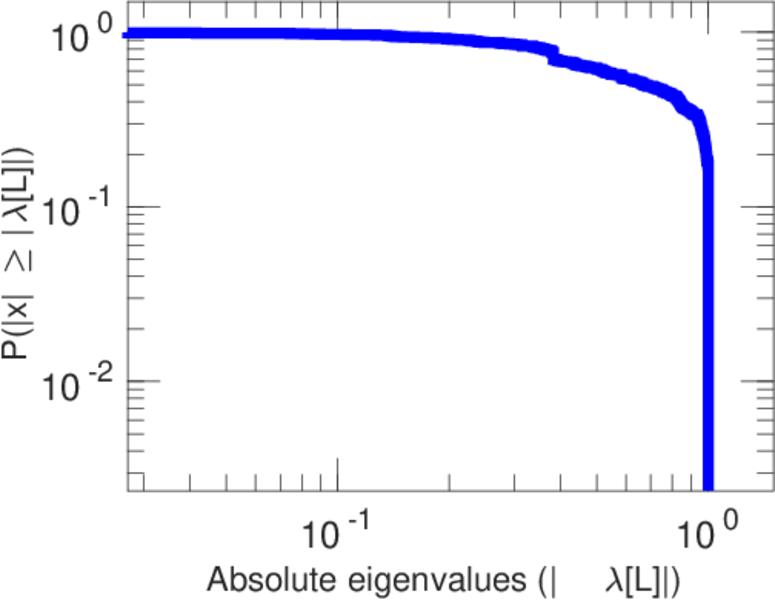
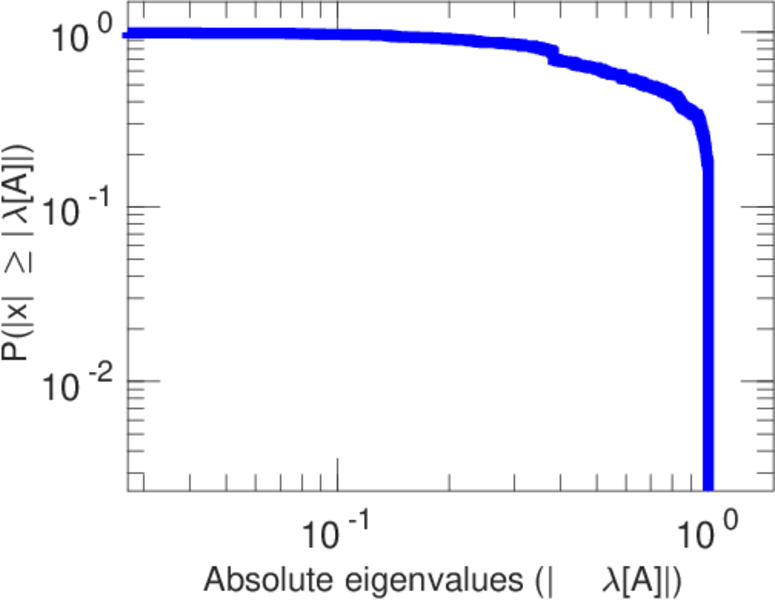
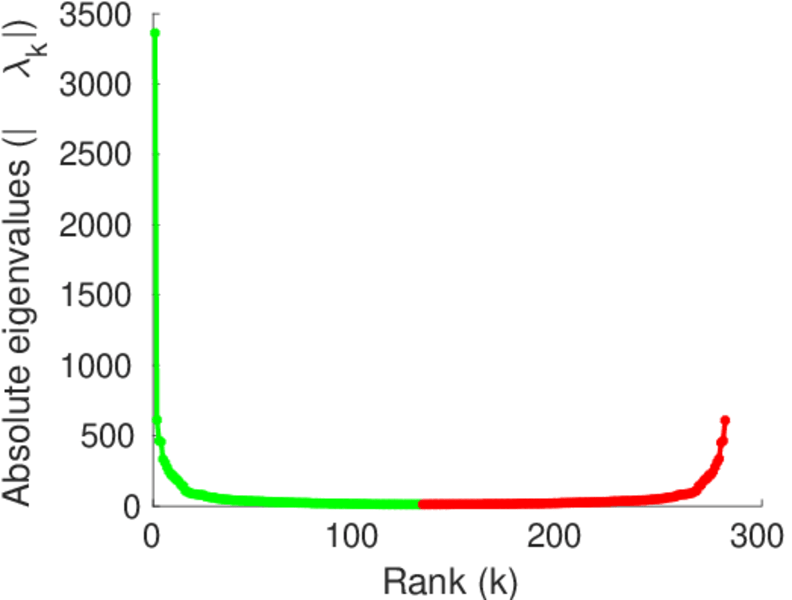
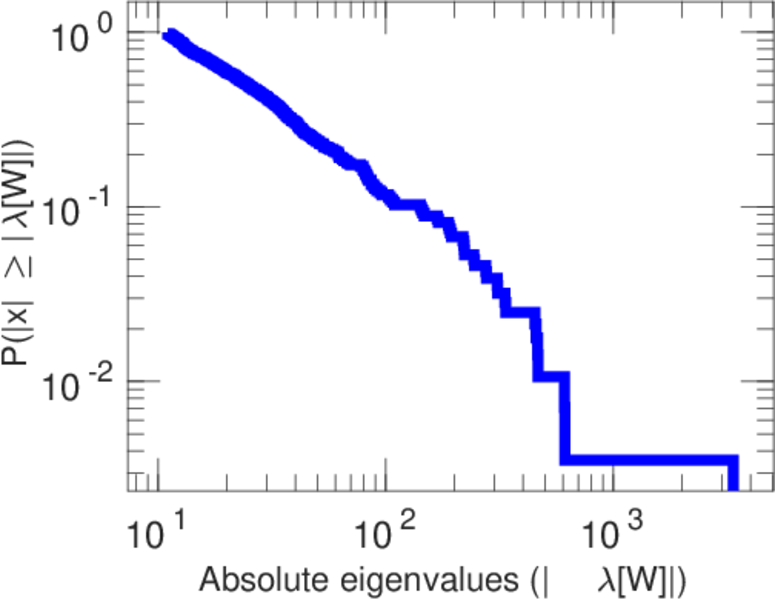
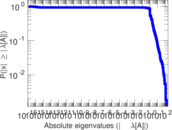
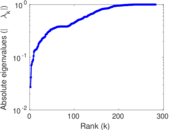
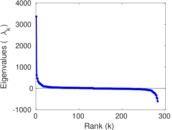
Matrix decompositions plots


Downloads
References
|
[1]
|
Jérôme Kunegis.
KONECT – The Koblenz Network Collection.
In Proc. Int. Conf. on World Wide Web Companion, pages
1343–1350, 2013.
[ http ]
|
|
[2]
|
Wikimedia Foundation.
Wikimedia downloads.
http://dumps.wikimedia.org/, January 2010.
|
 KONECT ‣ Networks ‣
Buy Me a Coffee
KONECT ‣ Networks ‣
Buy Me a Coffee