Wikipedia edits (kk)
This is the bipartite edit network of the Kazakh Wikipedia. It contains users
and pages from the Kazakh Wikipedia, connected by edit events. Each edge
represents an edit. The dataset includes the timestamp of each edit.
Metadata
Statistics
| Size | n = | 515,572
|
| Left size | n1 = | 8,554
|
| Right size | n2 = | 507,018
|
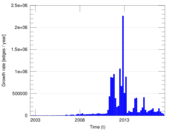
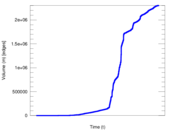
| Volume | m = | 2,304,757
|
| Unique edge count | m̿ = | 1,501,173
|
| Wedge count | s = | 81,728,501,403
|
| Claw count | z = | 6,824,219,657,447,501
|
| Cross count | x = | 5.206 82 × 1020
|
| Square count | q = | 26,387,011,679
|
| 4-Tour count | T4 = | 538,013,594,602
|
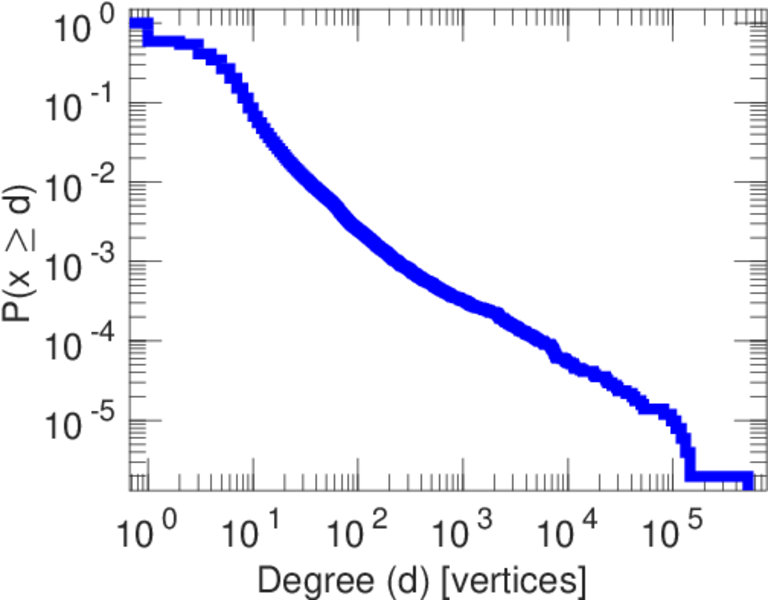
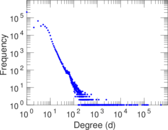
| Maximum degree | dmax = | 517,309
|
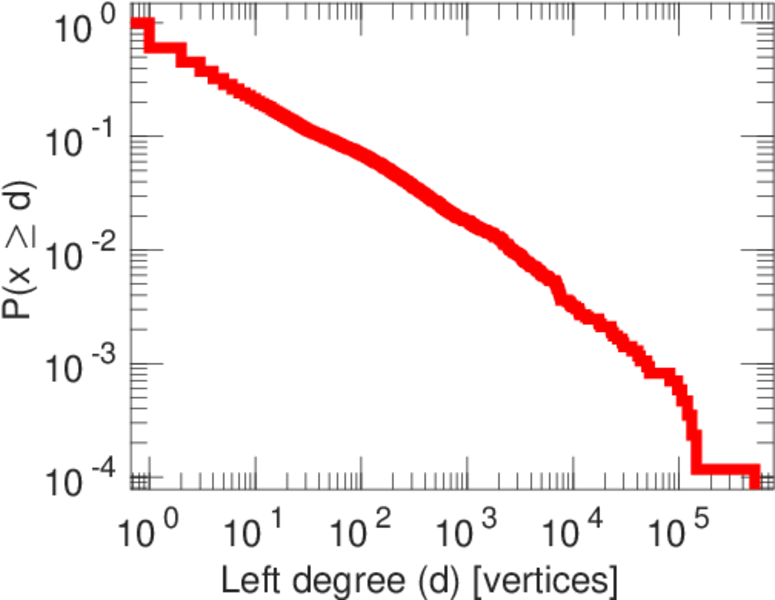
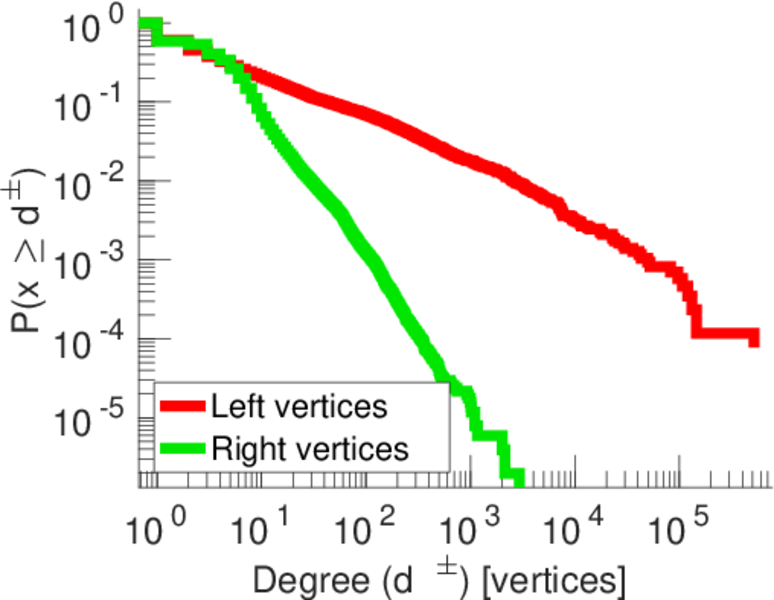
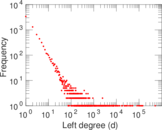
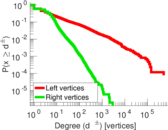
| Maximum left degree | d1max = | 517,309
|
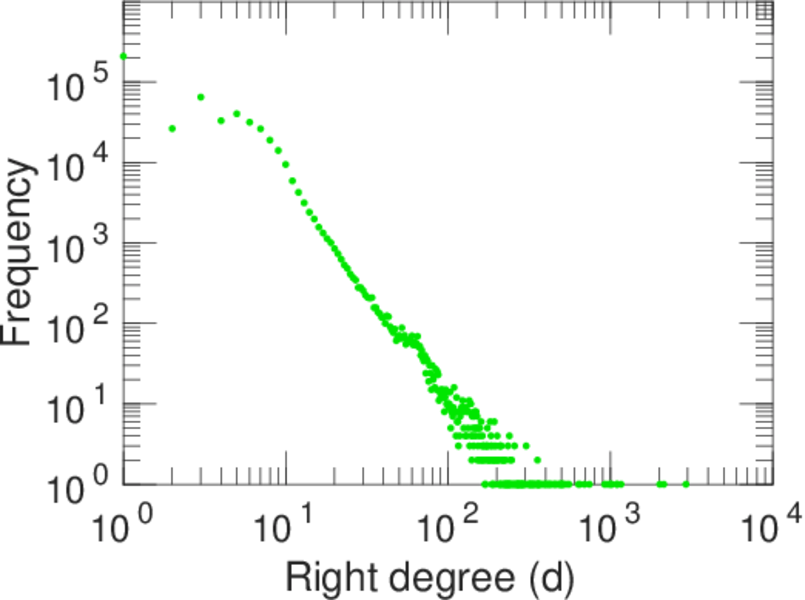
| Maximum right degree | d2max = | 2,925
|
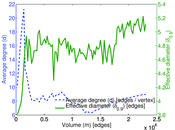
| Average degree | d = | 8.940 58
|
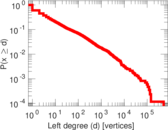
| Average left degree | d1 = | 269.436
|
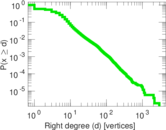
| Average right degree | d2 = | 4.545 71
|
| Fill | p = | 0.000 346 129
|
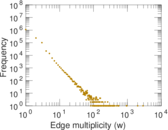
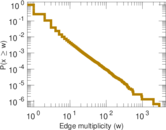
| Average edge multiplicity | m̃ = | 1.535 30
|
| Size of LCC | N = | 512,405
|
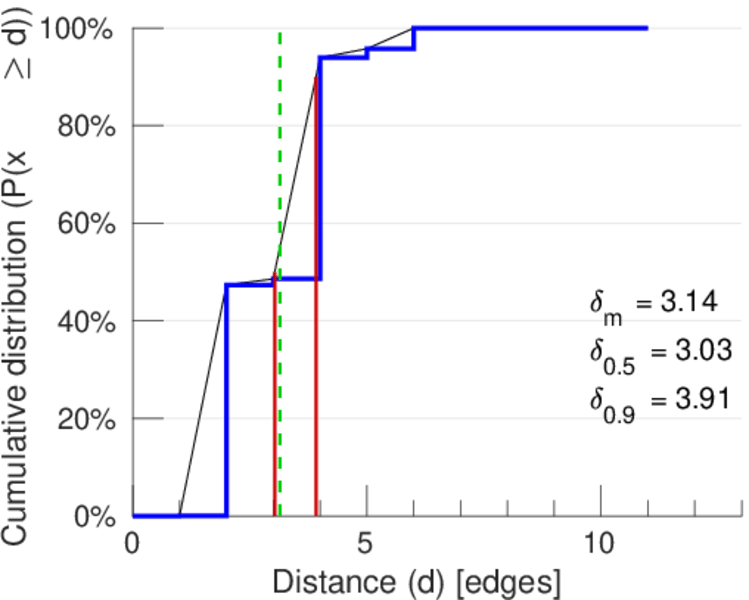
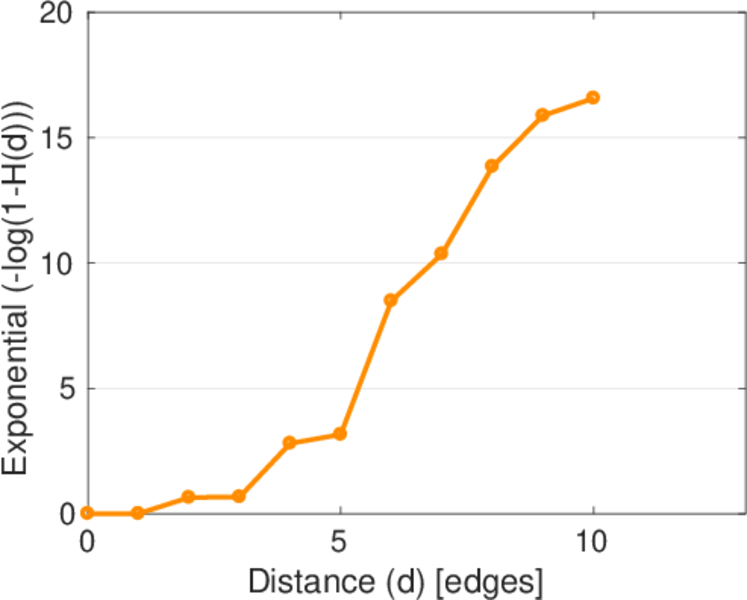
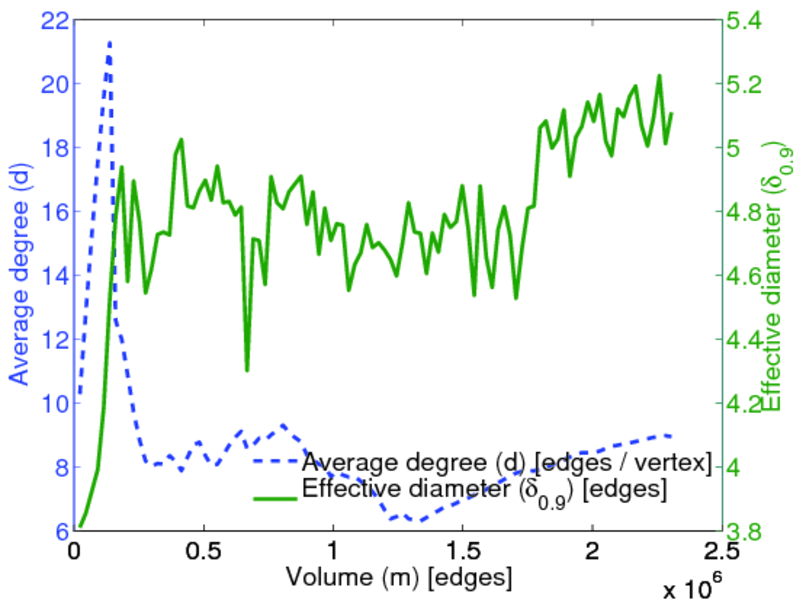
| Diameter | δ = | 13
|
| 50-Percentile effective diameter | δ0.5 = | 3.031 39
|
| 90-Percentile effective diameter | δ0.9 = | 3.913 64
|
| Median distance | δM = | 4
|
| Mean distance | δm = | 3.144 54
|
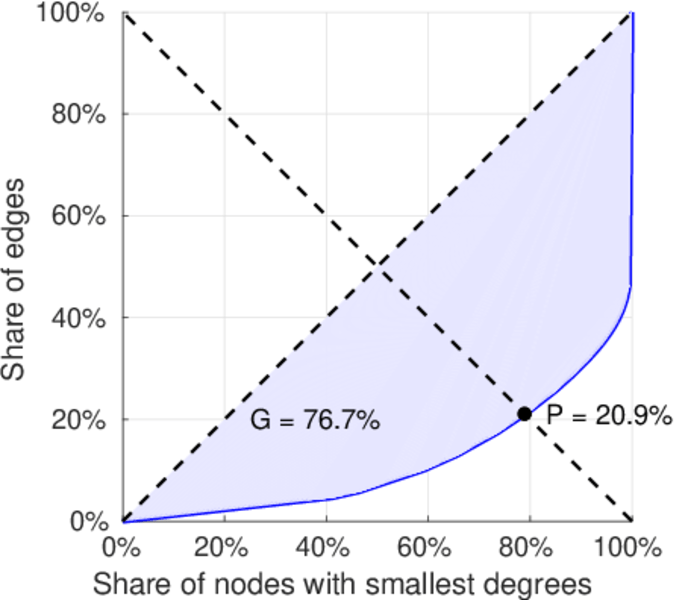
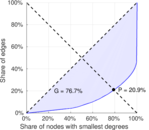
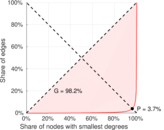
| Gini coefficient | G = | 0.768 668
|
| Balanced inequality ratio | P = | 0.207 934
|
| Left balanced inequality ratio | P1 = | 0.036 729 7
|
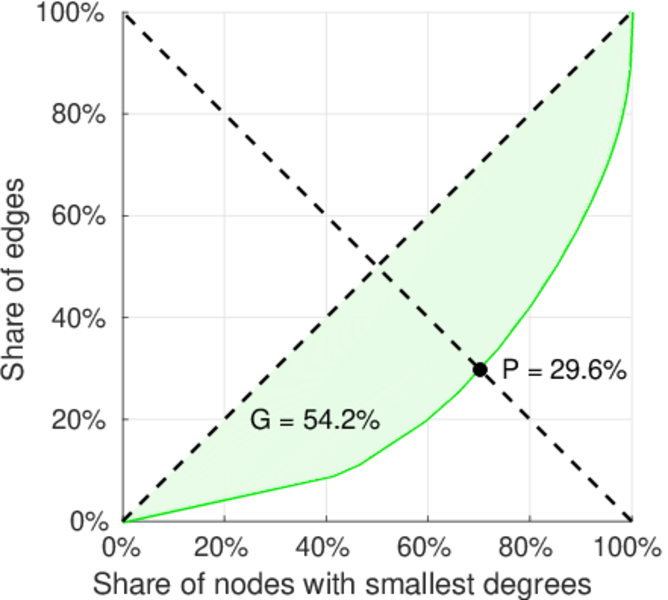
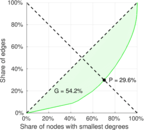
| Right balanced inequality ratio | P2 = | 0.296 150
|
| Relative edge distribution entropy | Her = | 0.686 825
|
| Power law exponent | γ = | 2.389 62
|
| Tail power law exponent | γt = | 1.651 00
|
| Degree assortativity | ρ = | −0.315 556
|
| Degree assortativity p-value | pρ = | 0.000 00
|
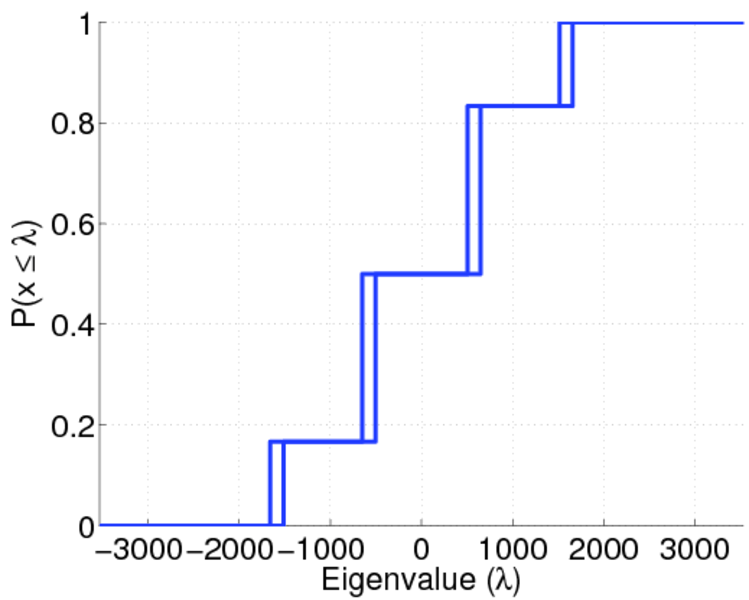
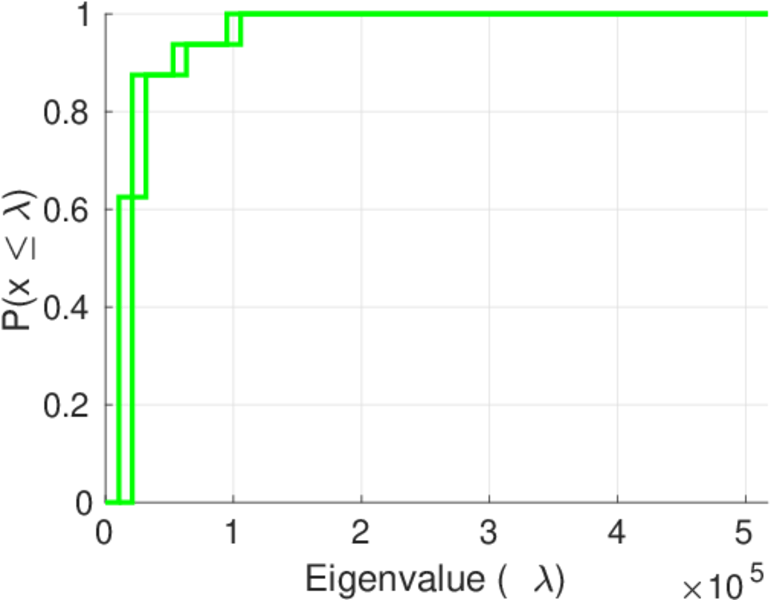
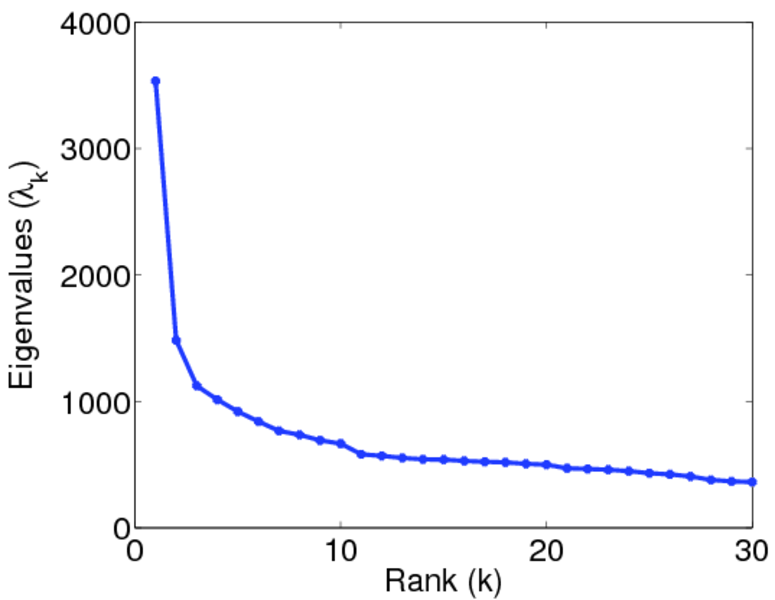
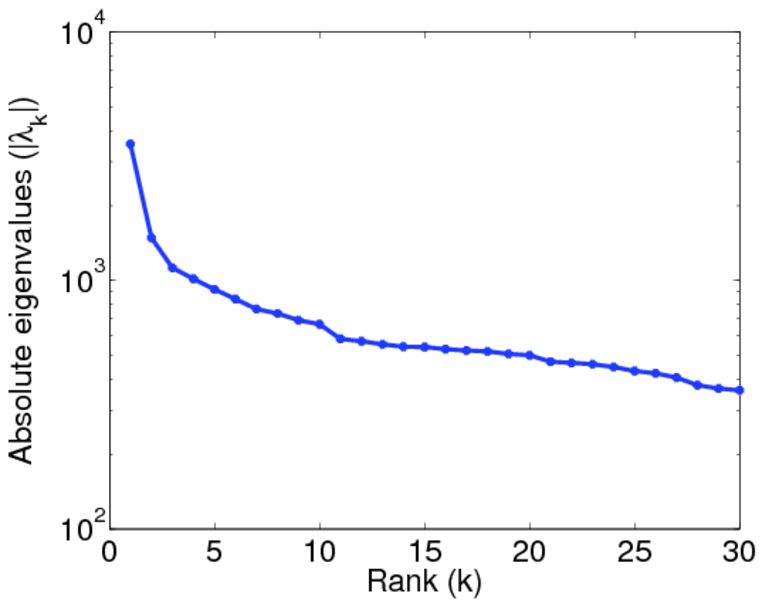
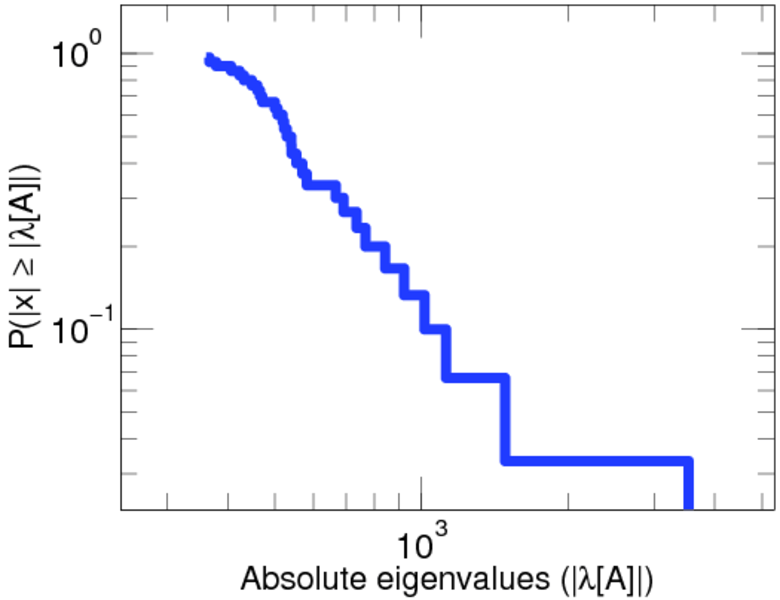
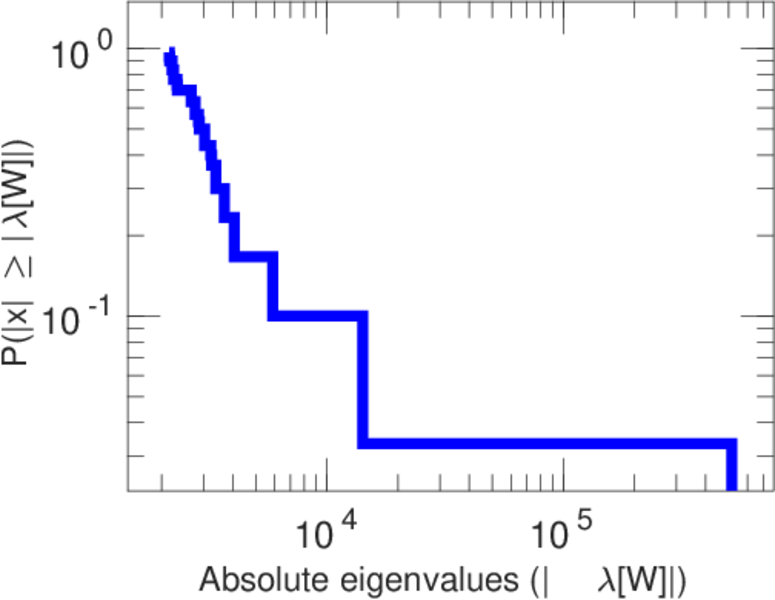
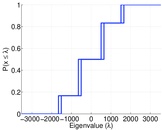
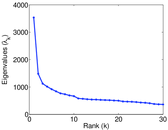
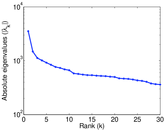
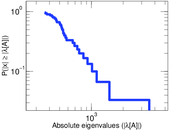
| Spectral norm | α = | 3,534.26
|
| Algebraic connectivity | a = | 0.003 585 19
|
| Spectral separation | |λ1[A] / λ2[A]| = | 2.382 74
|
| Controllability | C = | 498,817
|
| Relative controllability | Cr = | 0.968 831
|
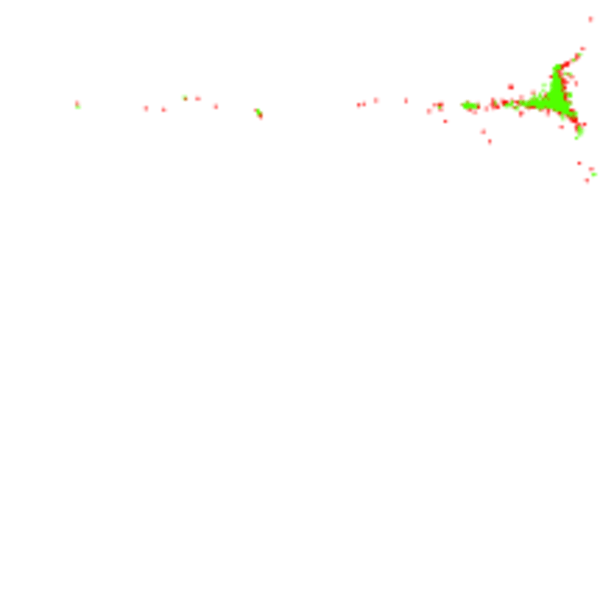
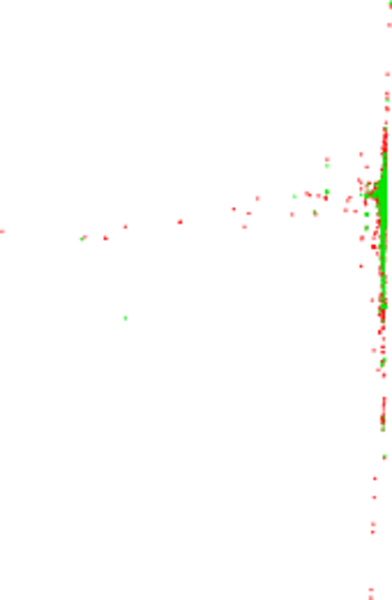
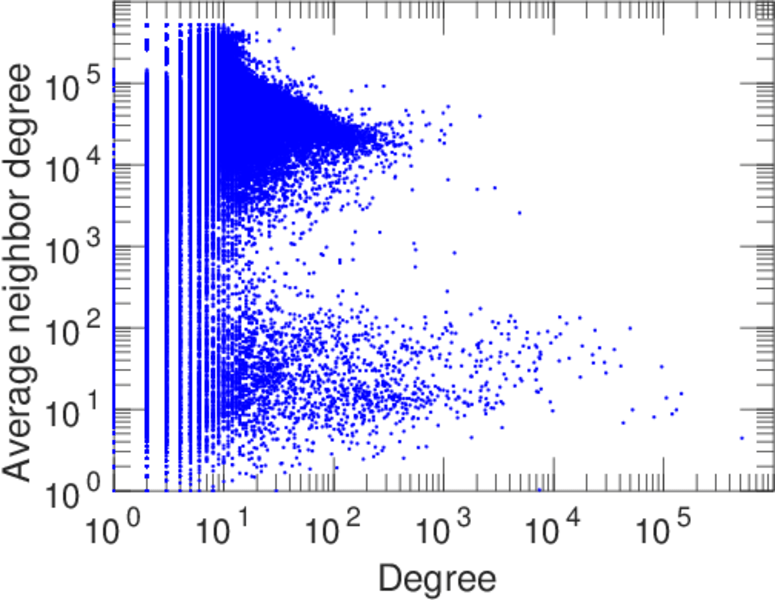
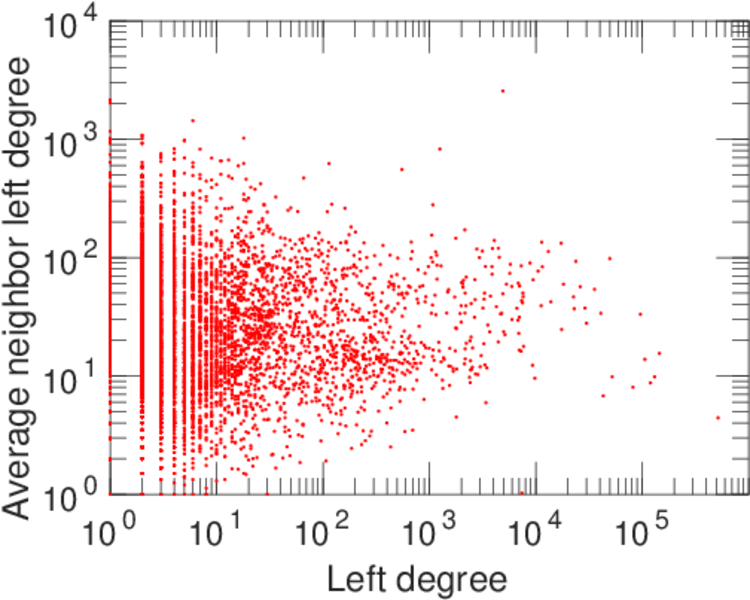
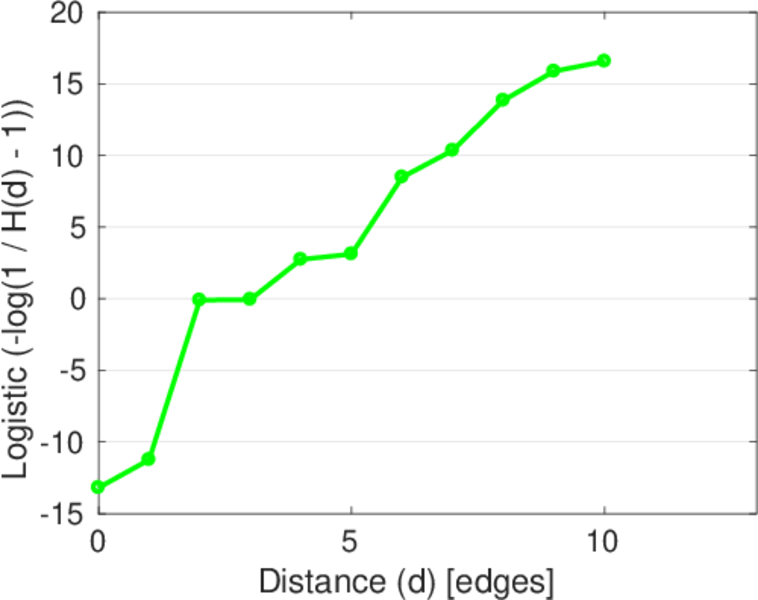
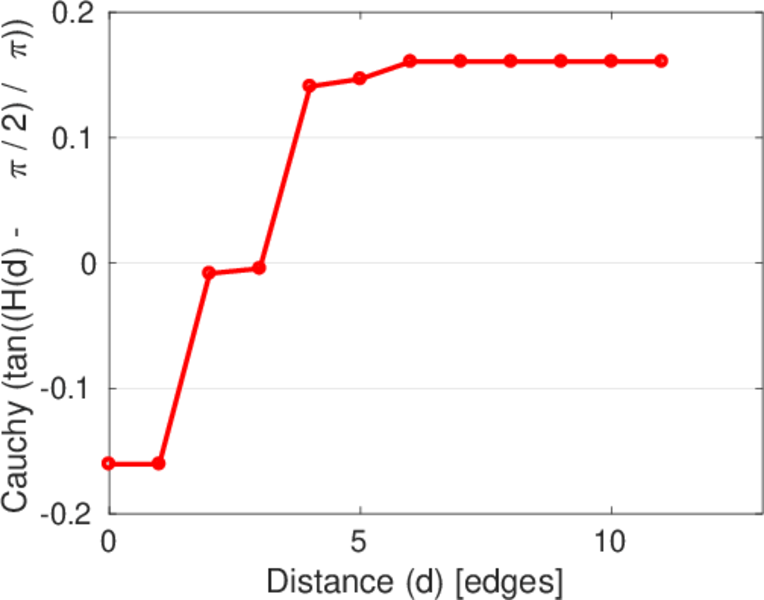
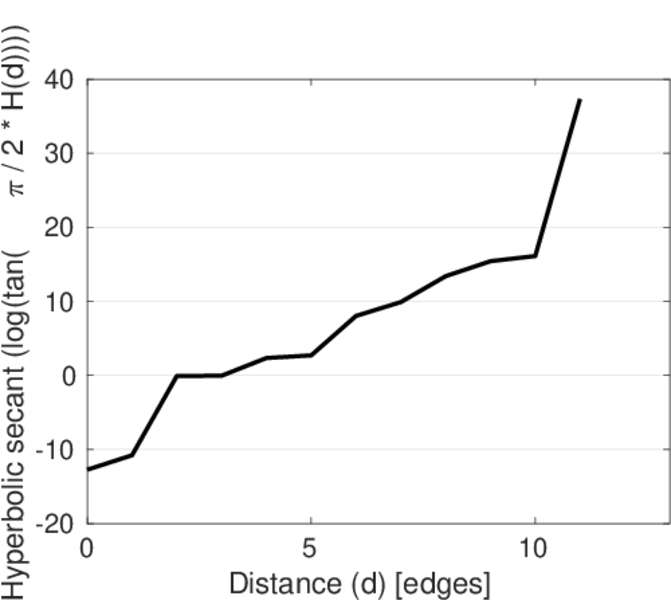
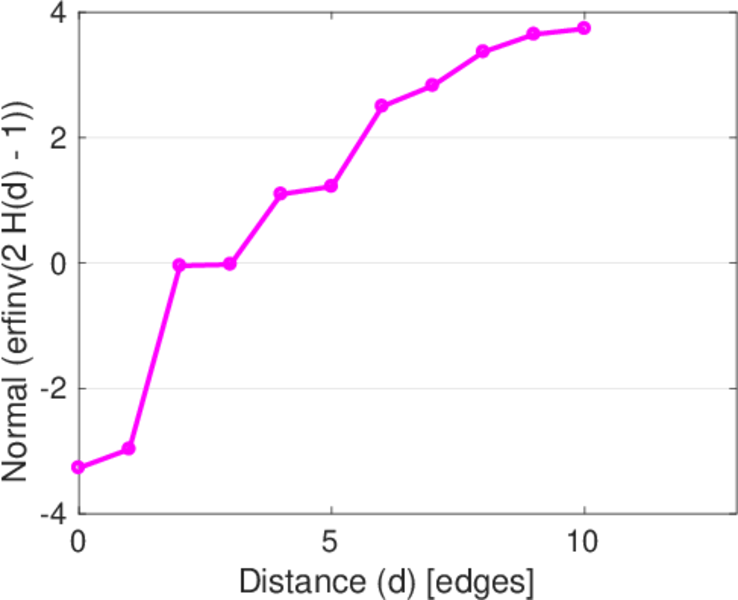
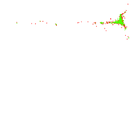
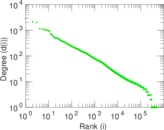
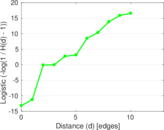
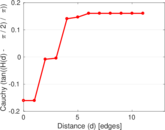
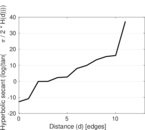
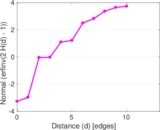
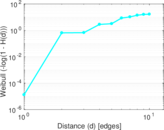
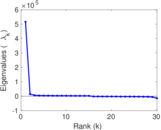
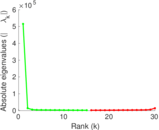
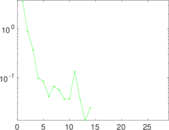
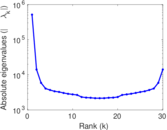
Plots


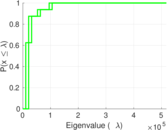

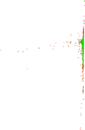


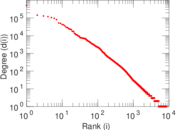


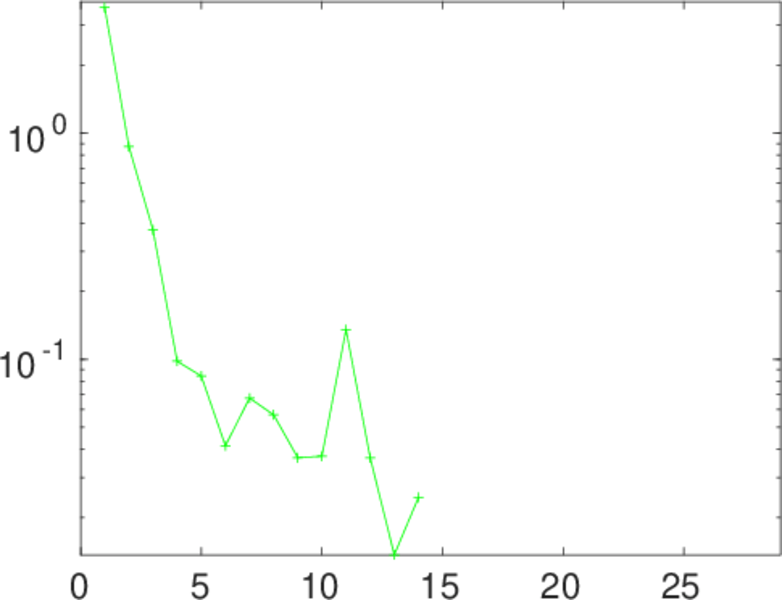
Matrix decompositions plots

Downloads
References
|
[1]
|
Jérôme Kunegis.
KONECT – The Koblenz Network Collection.
In Proc. Int. Conf. on World Wide Web Companion, pages
1343–1350, 2013.
[ http ]
|
|
[2]
|
Wikimedia Foundation.
Wikimedia downloads.
http://dumps.wikimedia.org/, January 2010.
|
 KONECT ‣ Networks ‣
Buy Me a Coffee
KONECT ‣ Networks ‣
Buy Me a Coffee