Wiktionary edits (kn)
This is the bipartite edit network of the Kannada Wiktionary. It contains users
and pages from the Kannada Wiktionary, connected by edit events. Each edge
represents an edit. The dataset includes the timestamp of each edit.
Metadata
Statistics
| Size | n = | 267,279
|
| Left size | n1 = | 468
|
| Right size | n2 = | 266,811
|
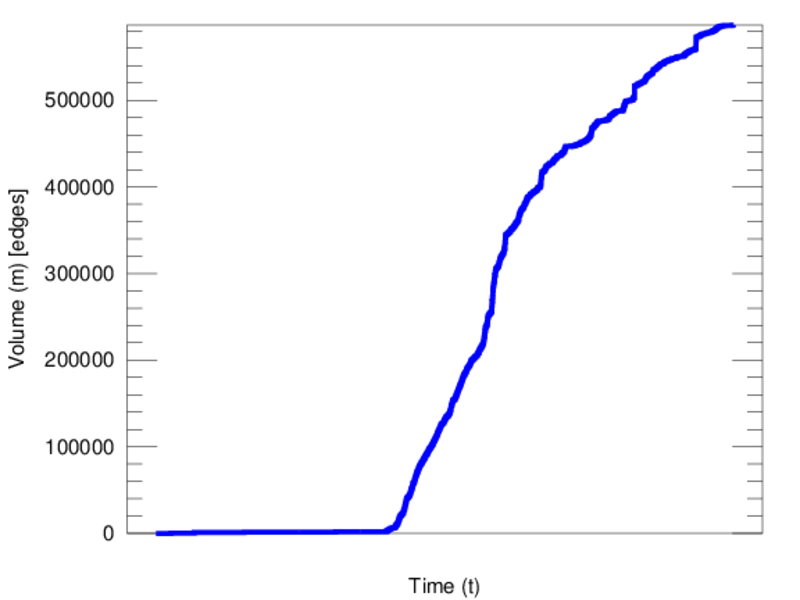
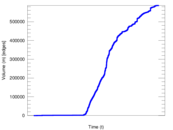
| Volume | m = | 586,987
|
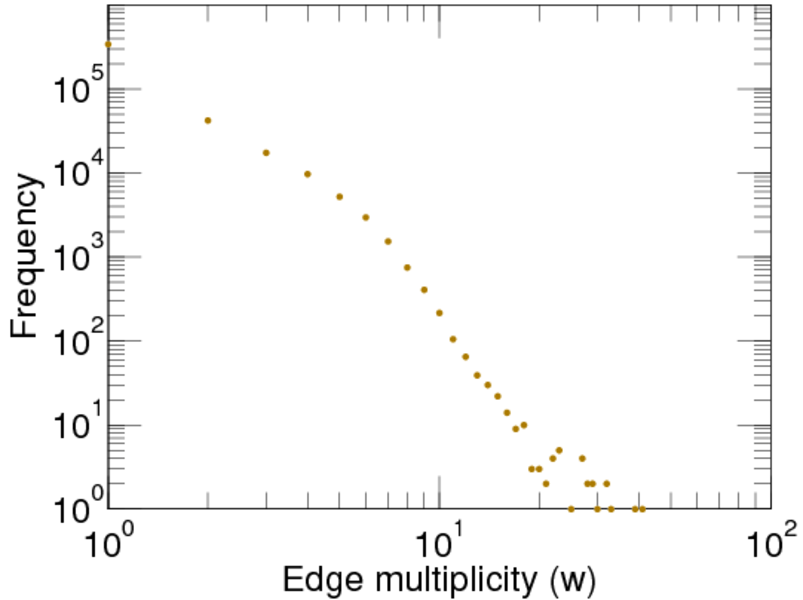
| Unique edge count | m̿ = | 421,367
|
| Wedge count | s = | 9,127,778,521
|
| Claw count | z = | 219,408,954,907,184
|
| Square count | q = | 1,188,362,459
|
| 4-Tour count | T4 = | 46,018,860,470
|
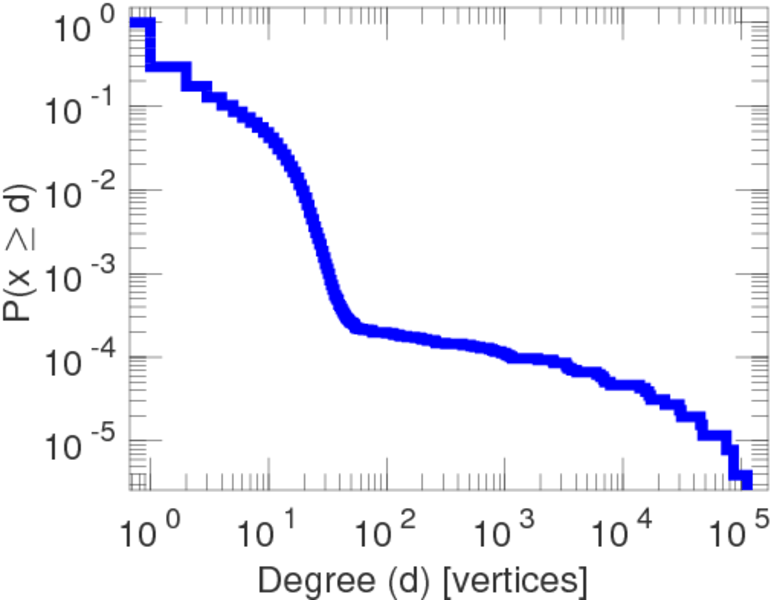
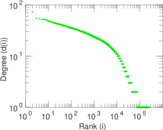
| Maximum degree | dmax = | 112,657
|
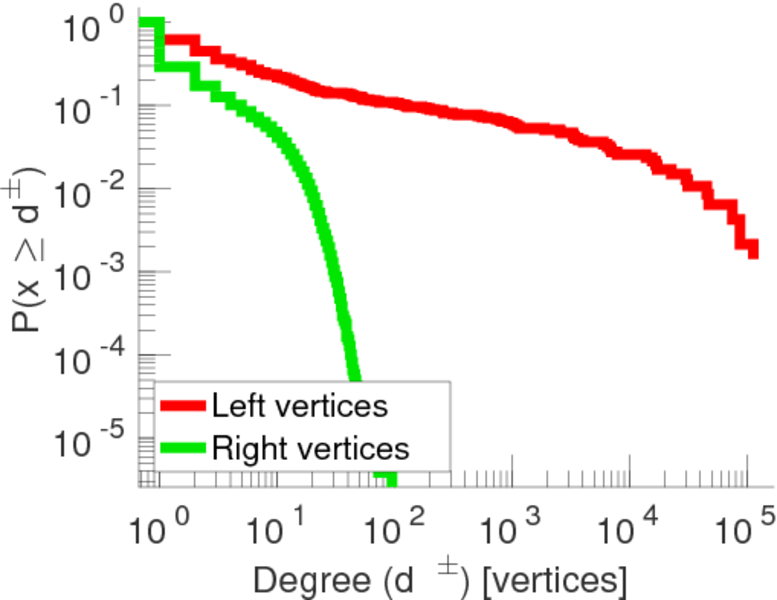
| Maximum left degree | d1max = | 112,657
|
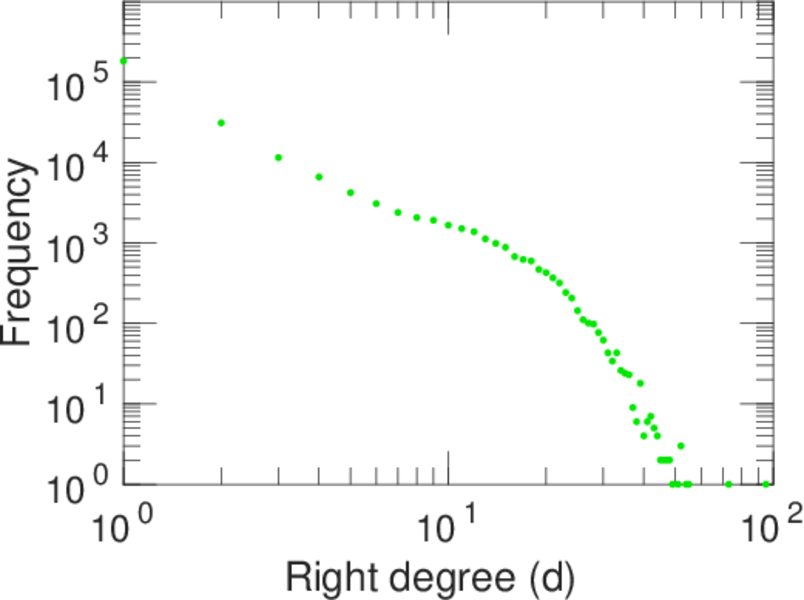
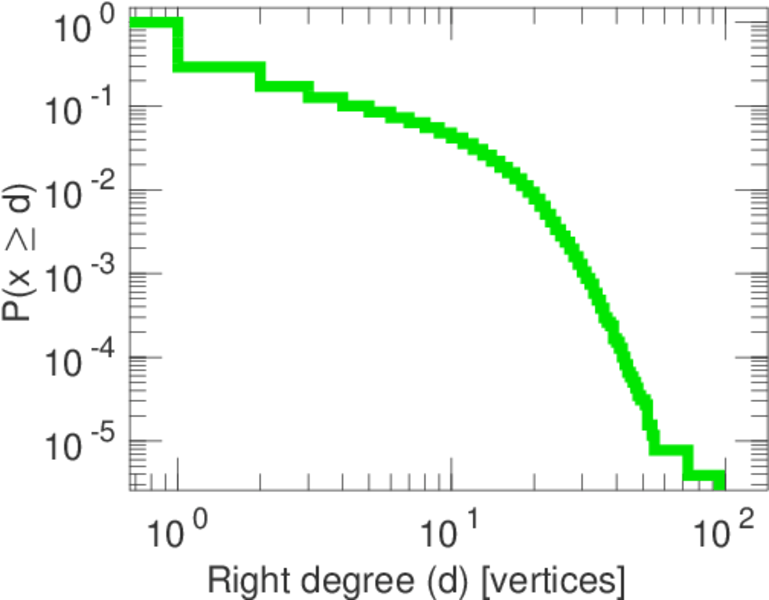
| Maximum right degree | d2max = | 95
|
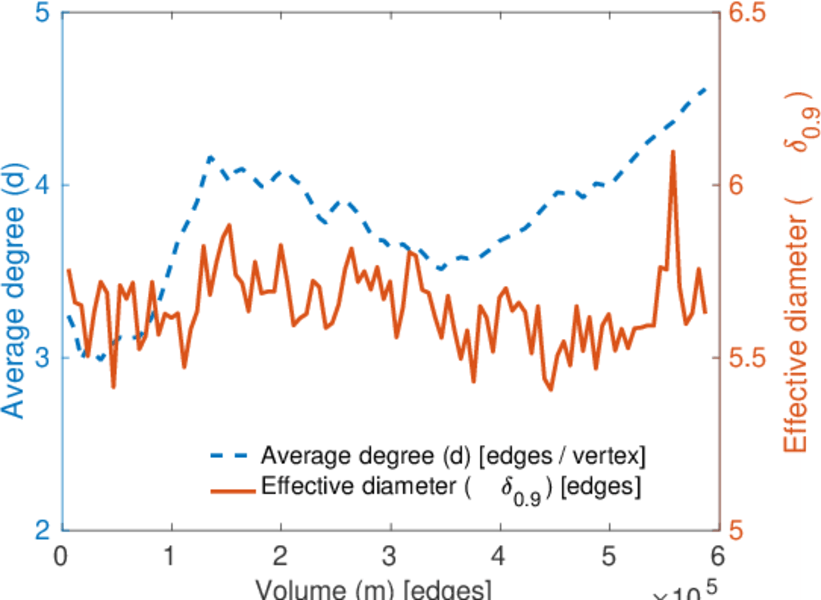
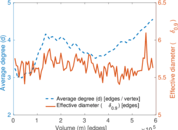
| Average degree | d = | 4.392 32
|
| Average left degree | d1 = | 1,254.25
|
| Average right degree | d2 = | 2.200 01
|
| Fill | p = | 0.003 374 51
|
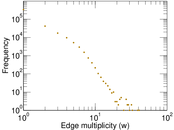
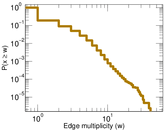
| Average edge multiplicity | m̃ = | 1.393 05
|
| Size of LCC | N = | 256,471
|
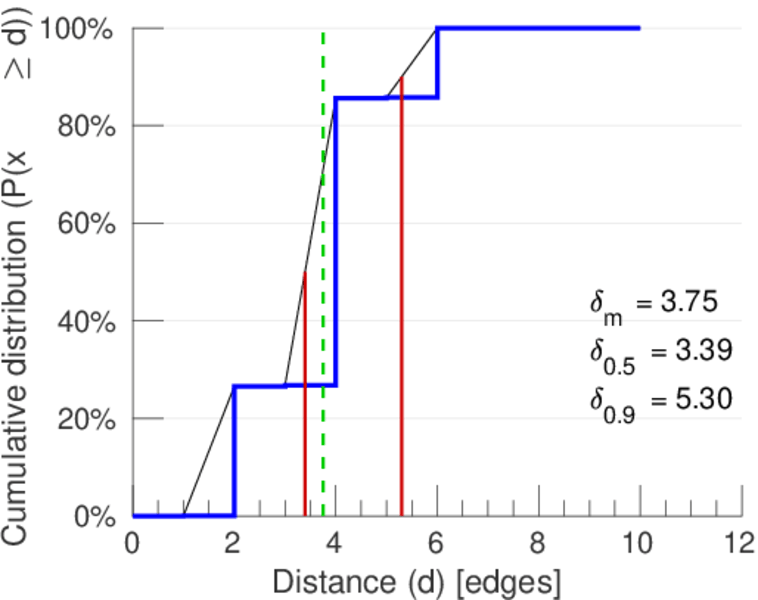
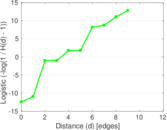
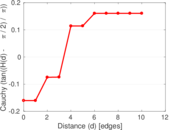
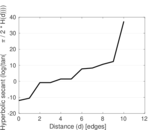
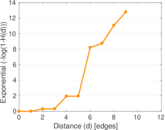
| Diameter | δ = | 12
|
| 50-Percentile effective diameter | δ0.5 = | 3.394 92
|
| 90-Percentile effective diameter | δ0.9 = | 5.299 73
|
| Median distance | δM = | 4
|
| Mean distance | δm = | 3.754 18
|
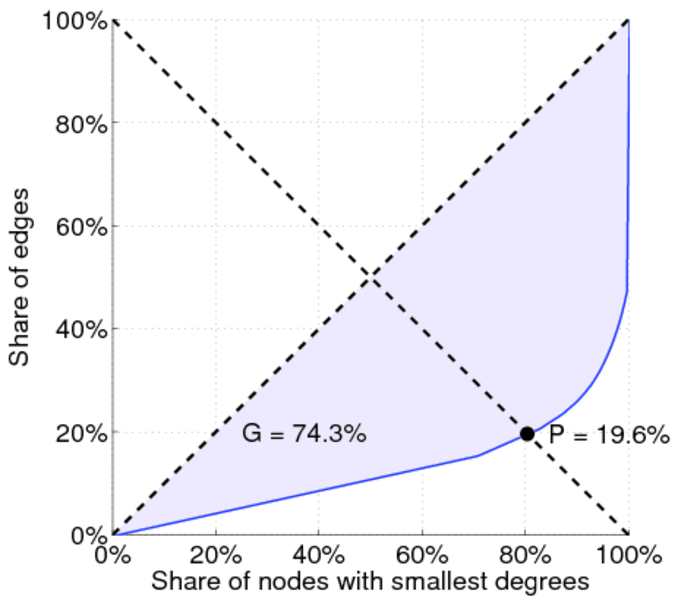
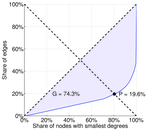
| Gini coefficient | G = | 0.743 352
|
| Balanced inequality ratio | P = | 0.195 813
|
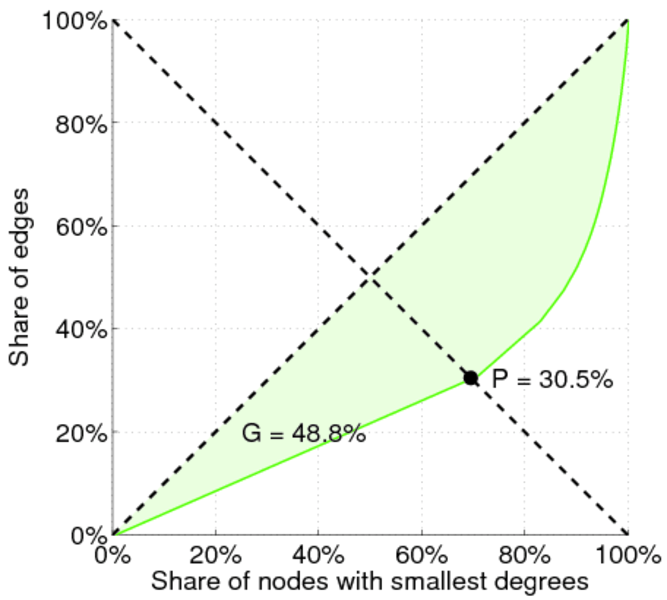
| Left balanced inequality ratio | P1 = | 0.036 535 7
|
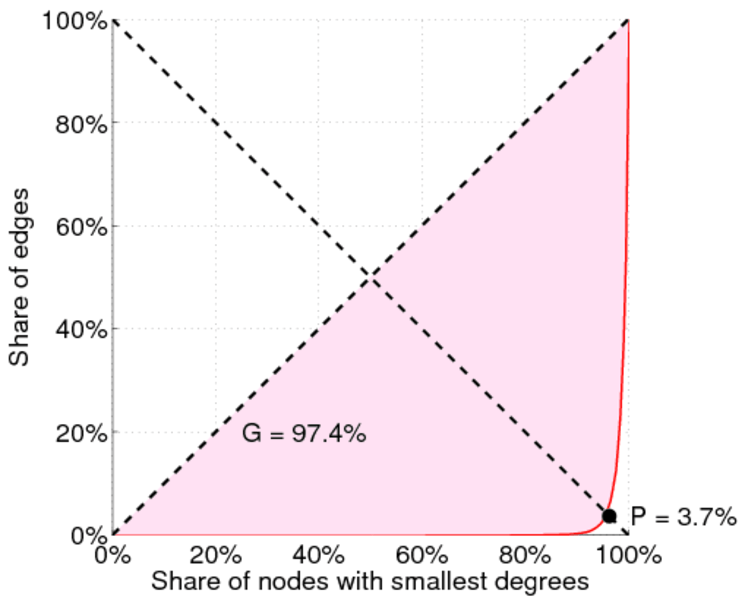
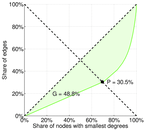
| Right balanced inequality ratio | P2 = | 0.304 652
|
| Relative edge distribution entropy | Her = | 0.656 587
|
| Power law exponent | γ = | 4.477 15
|
| Tail power law exponent | γt = | 2.501 00
|
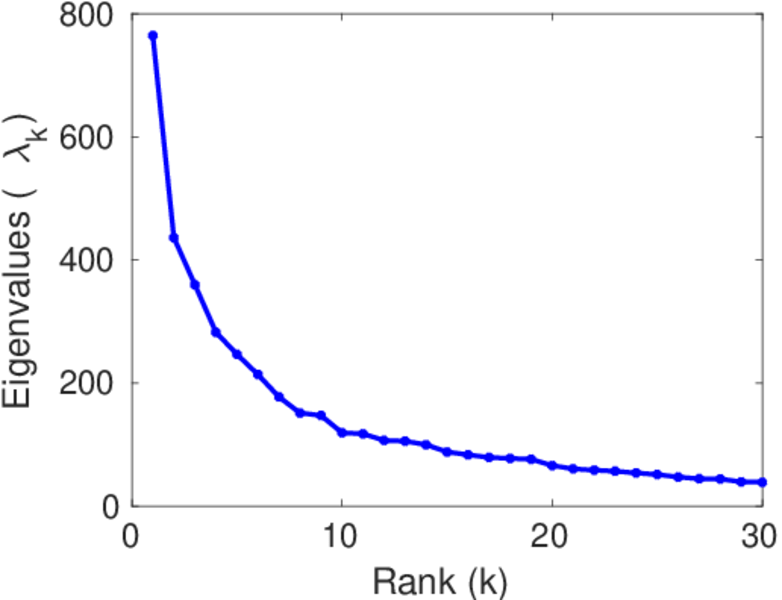
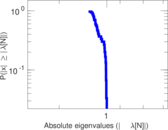
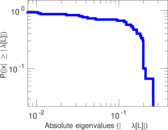
| Spectral norm | α = | 764.358
|
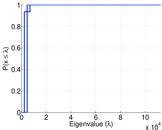
| Algebraic connectivity | a = | 0.007 803 15
|
| Spectral separation | |λ1[A] / λ2[A]| = | 1.752 95
|
| Controllability | C = | 256,860
|
| Relative controllability | Cr = | 0.996 454
|
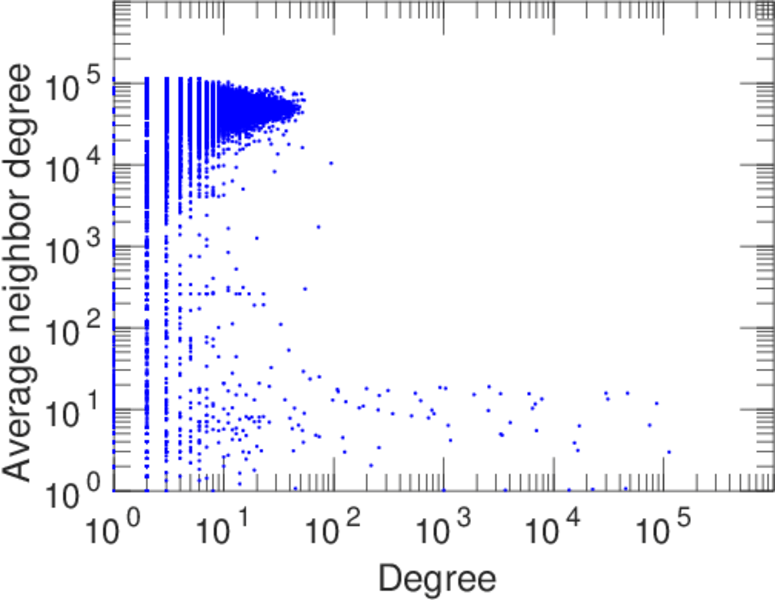
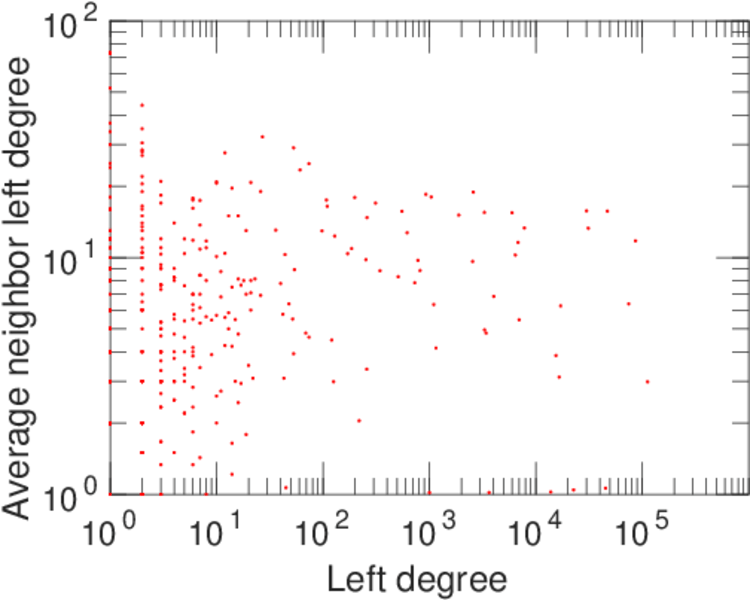
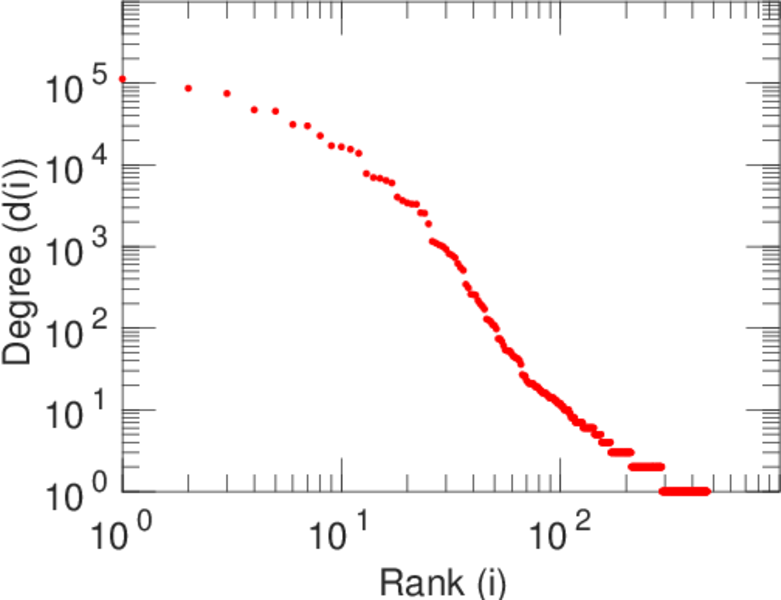
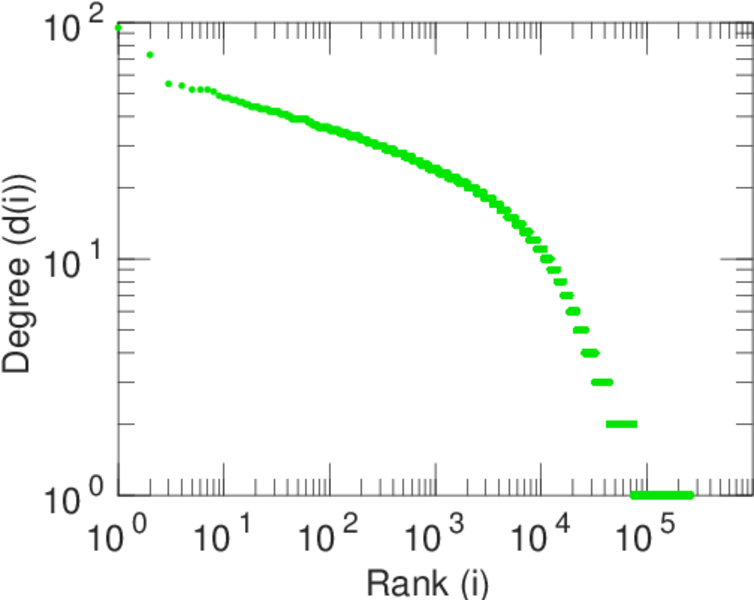
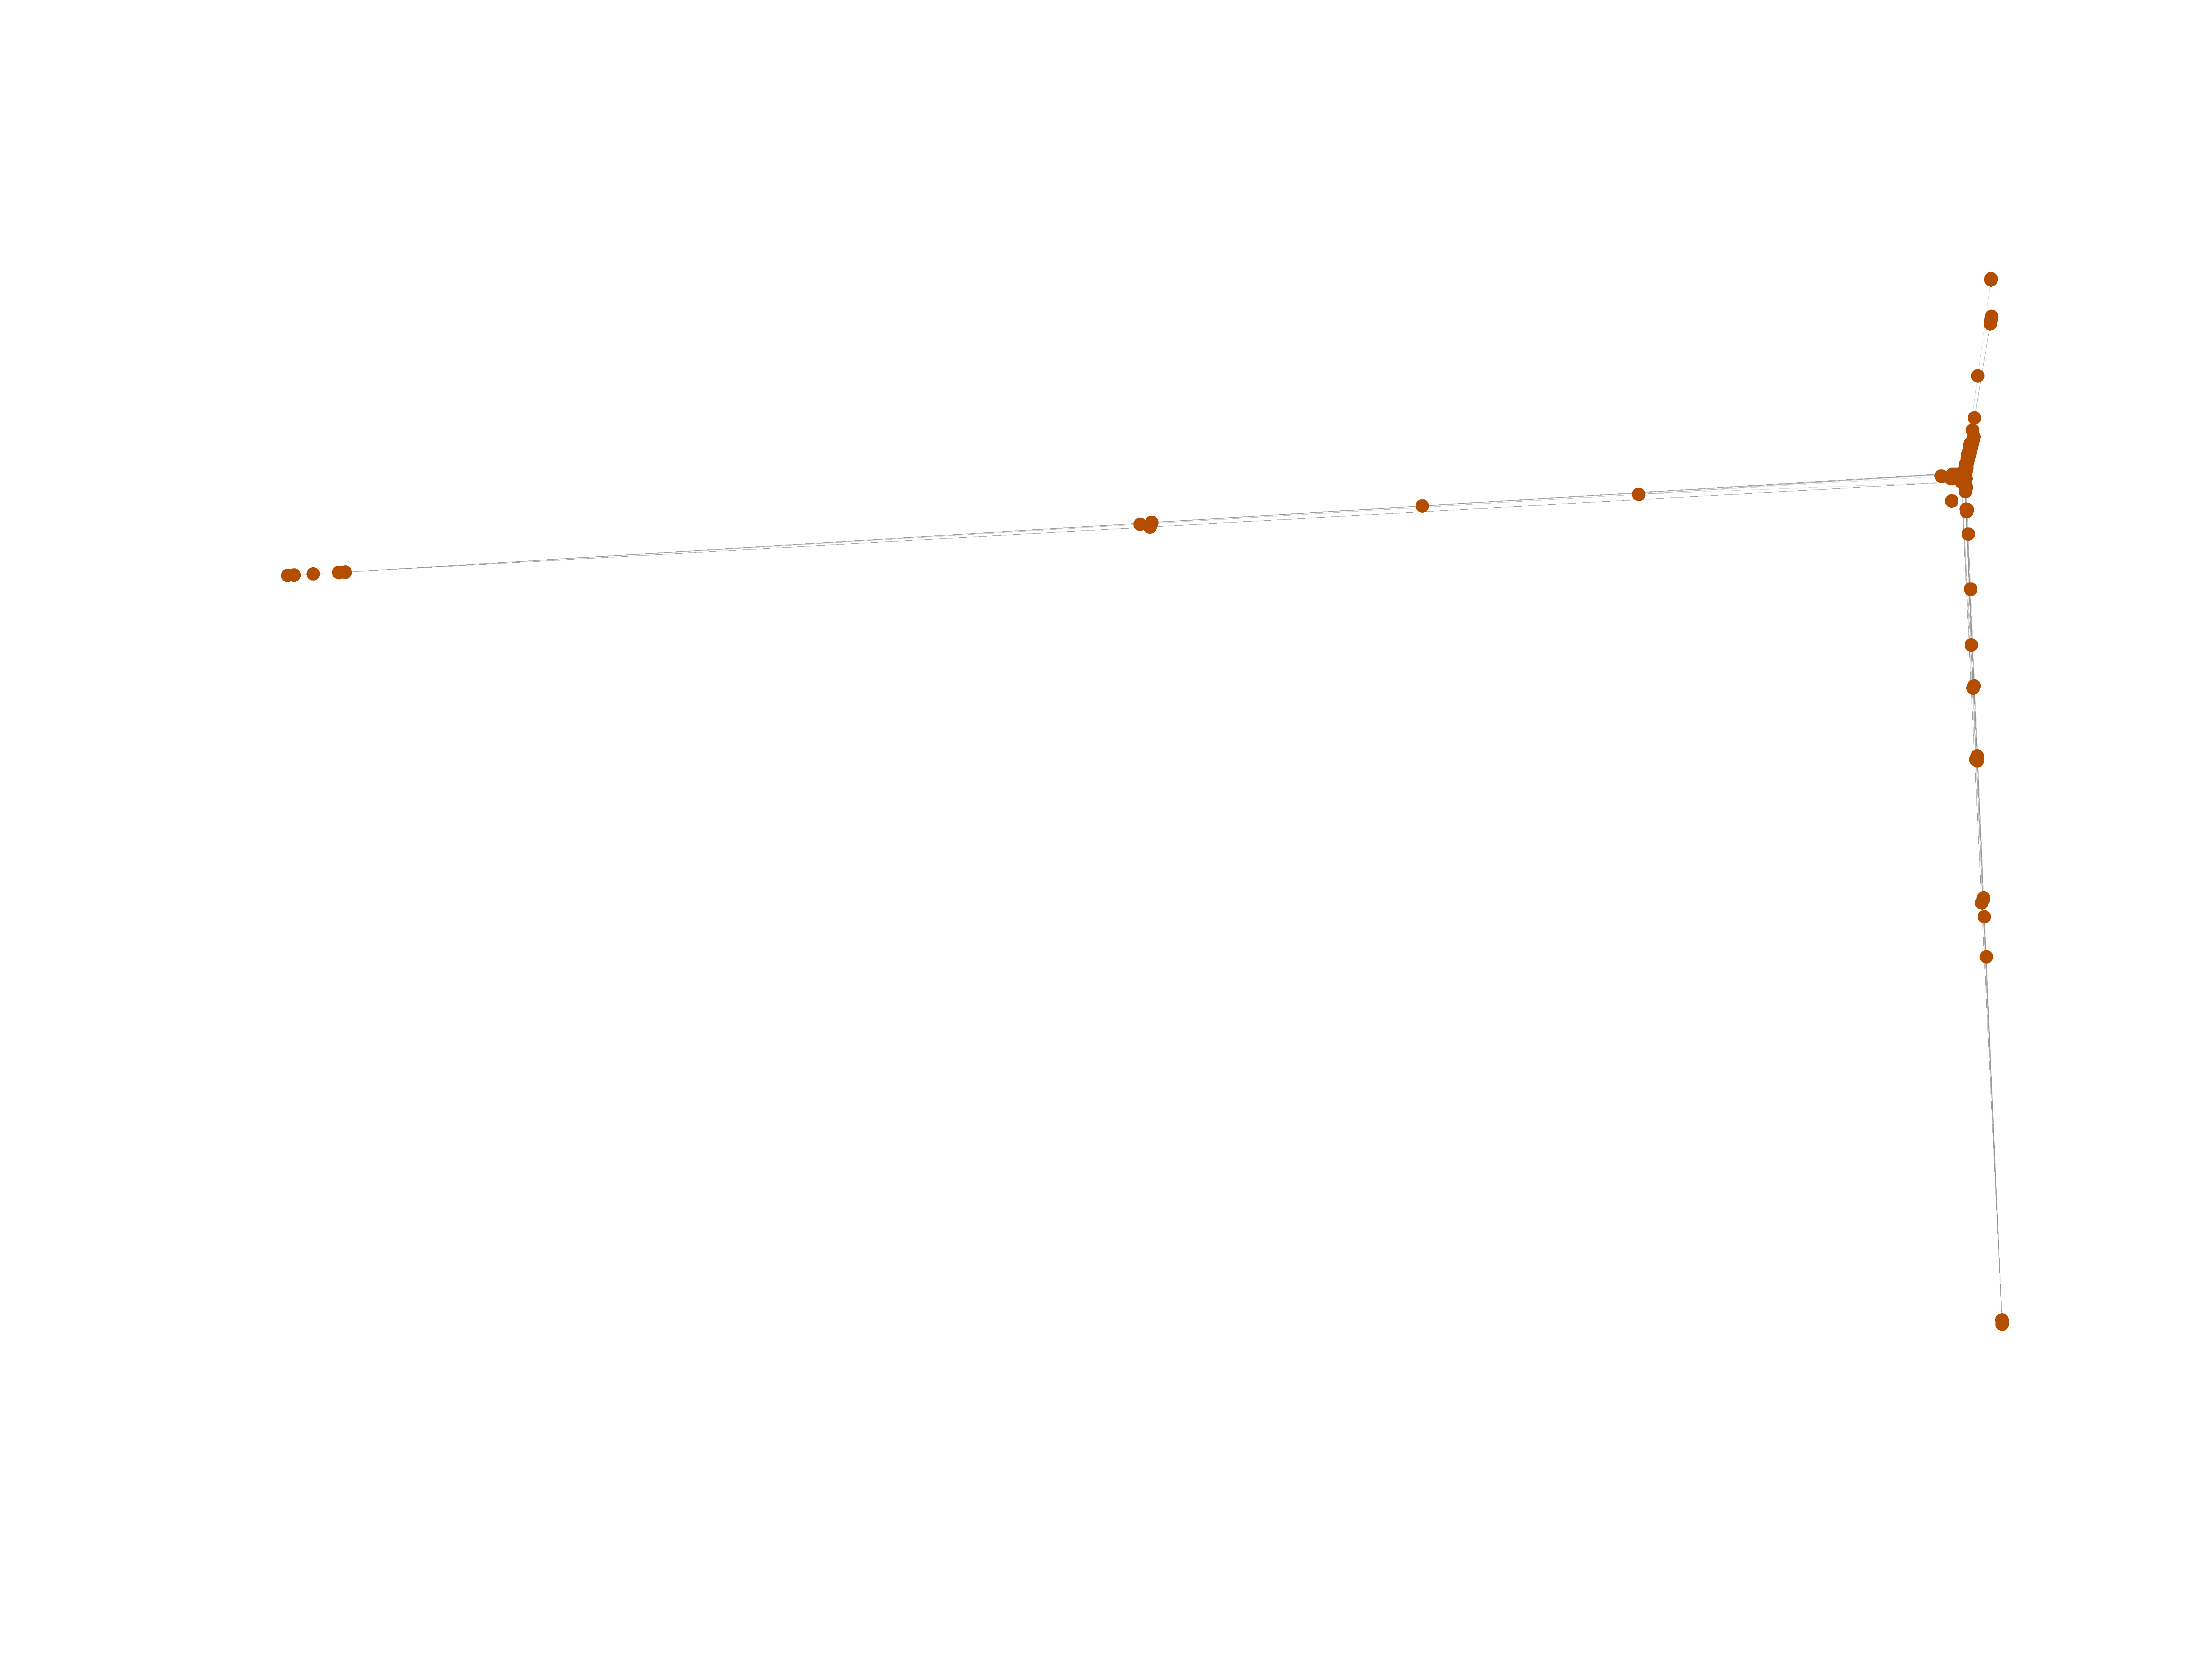
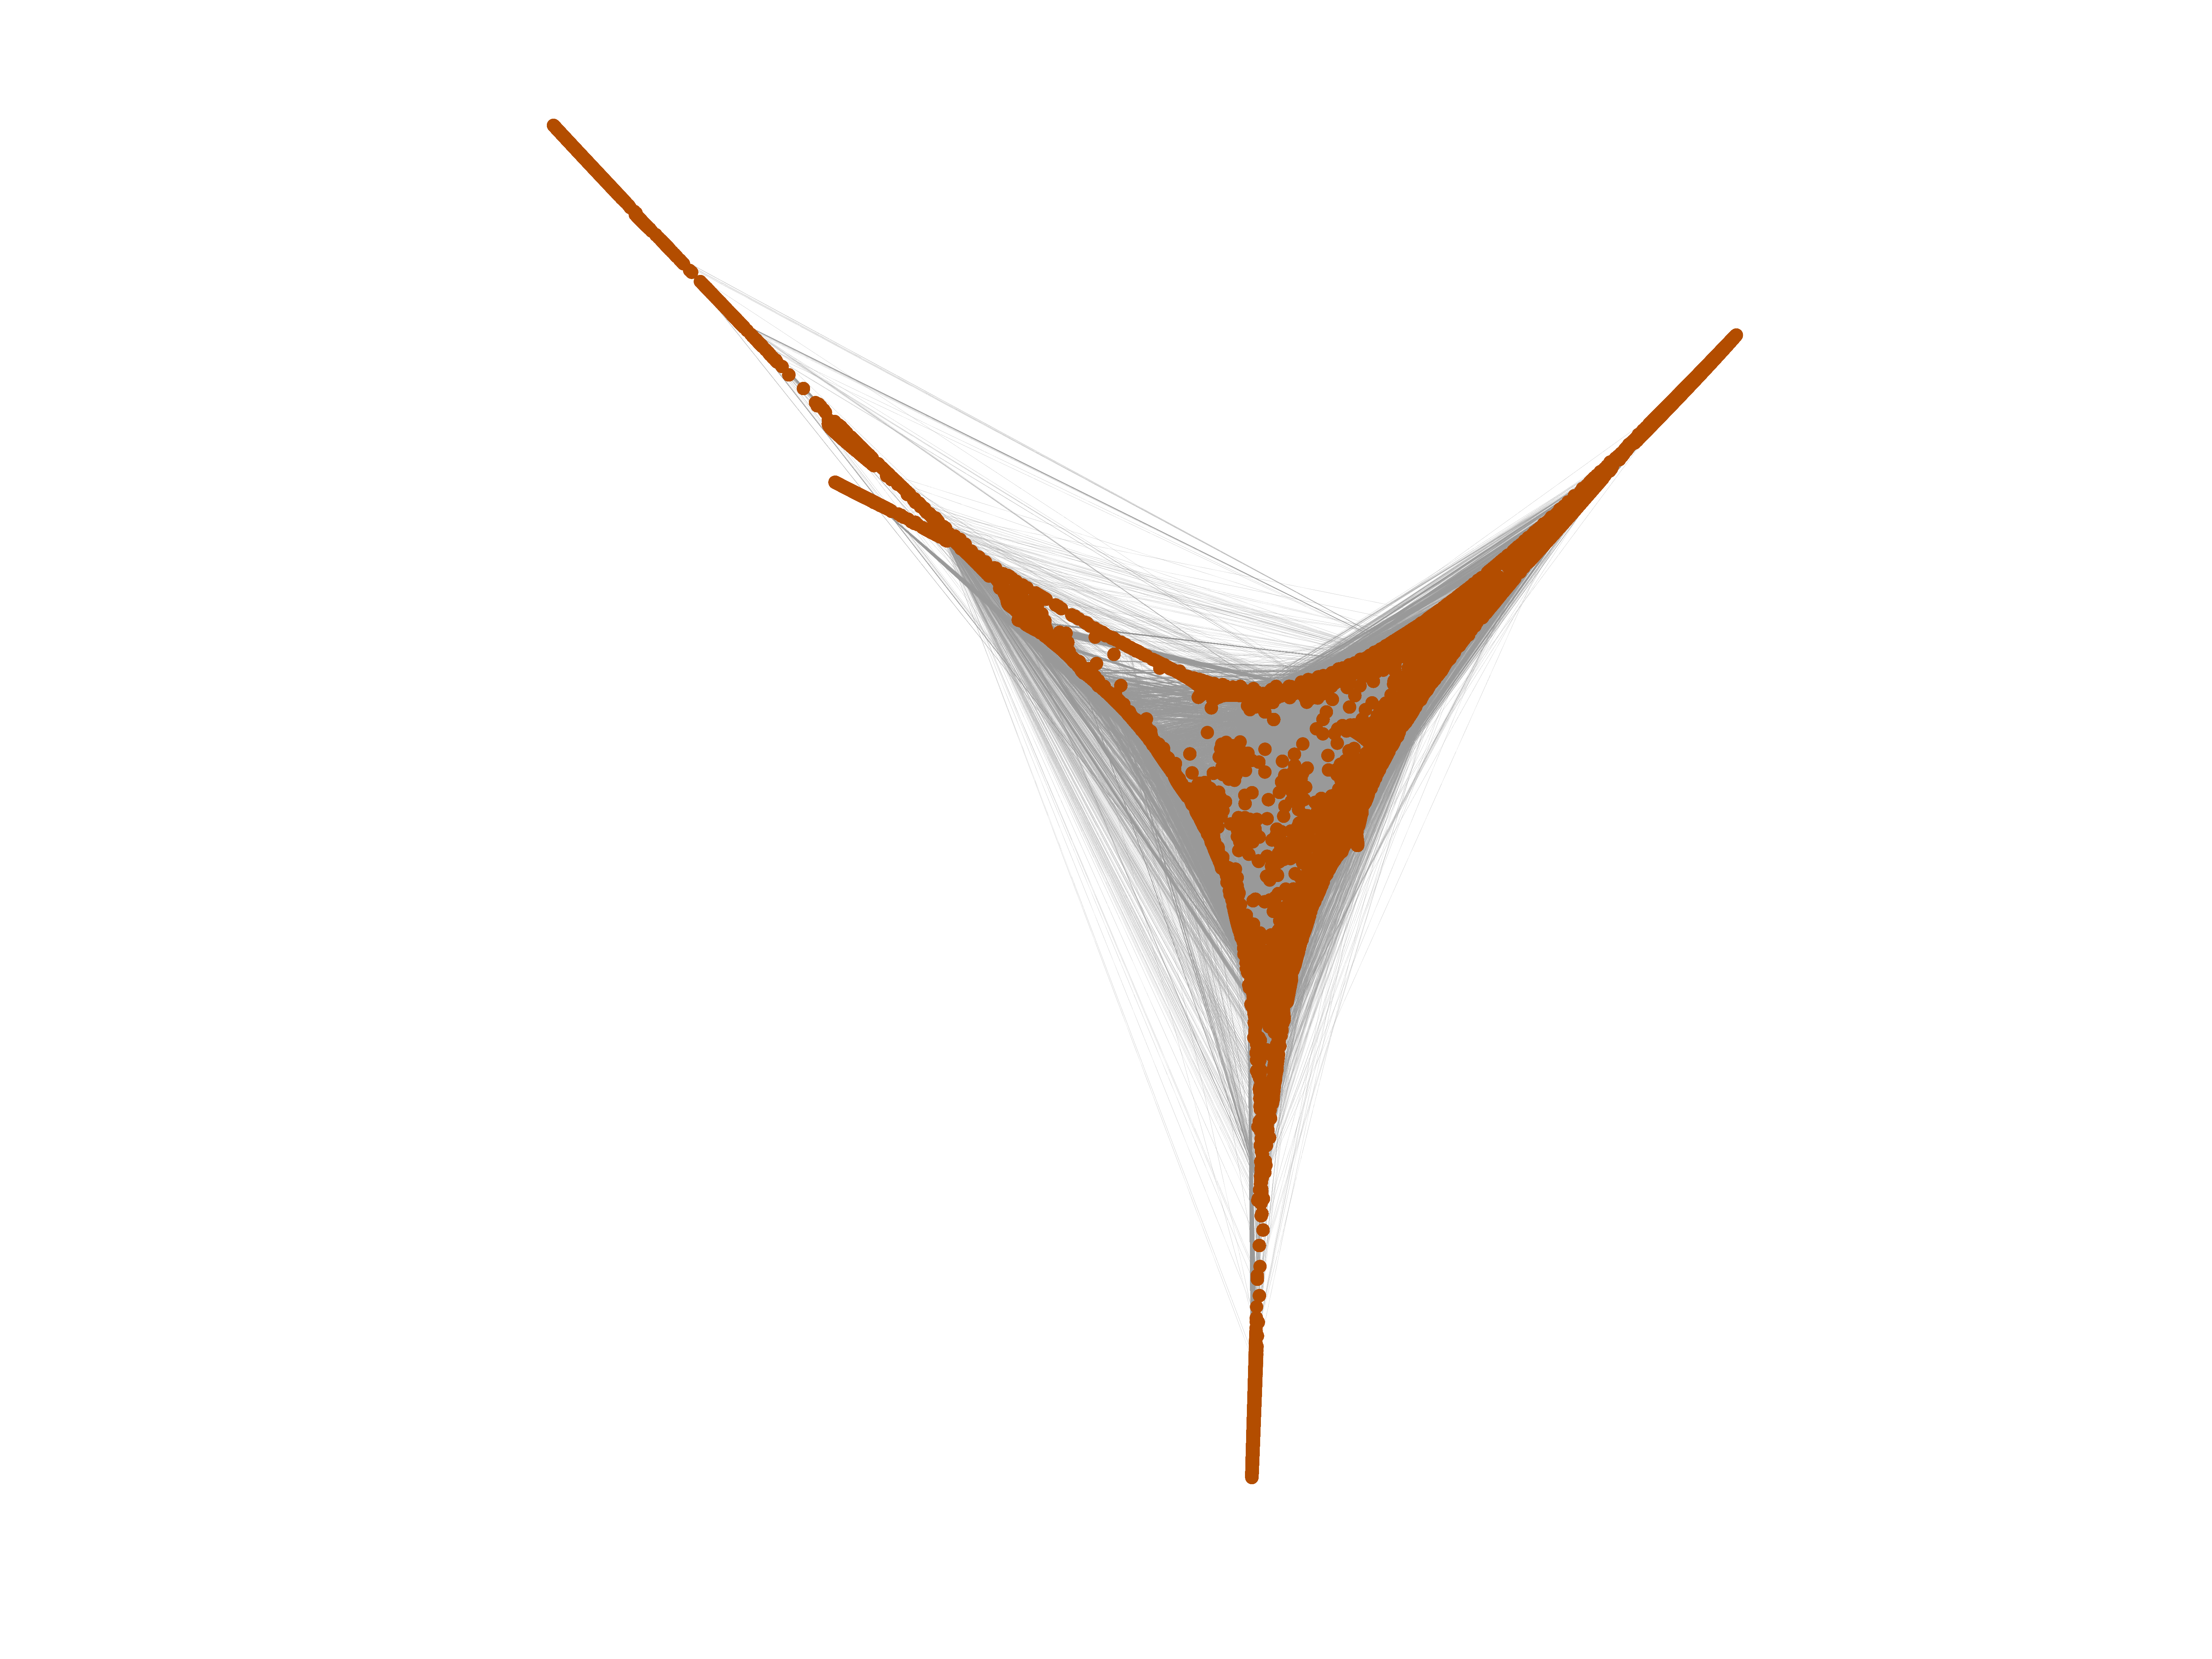
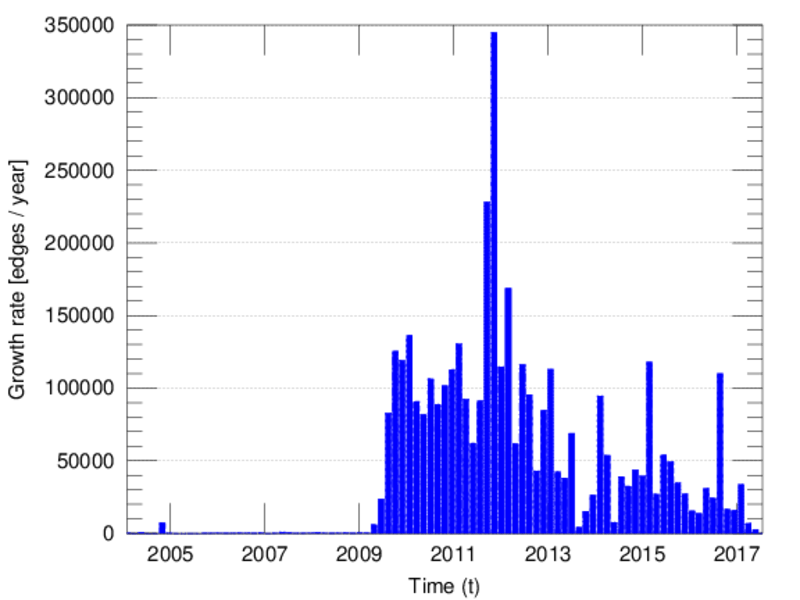
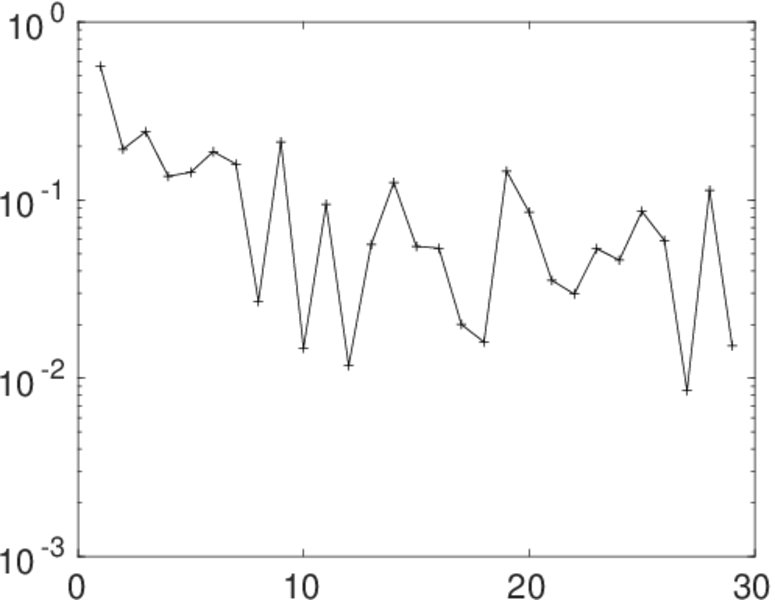
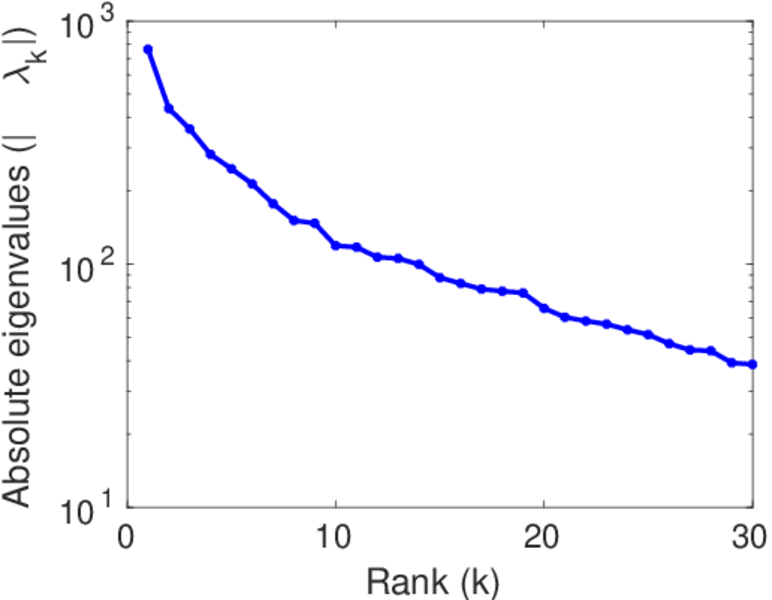
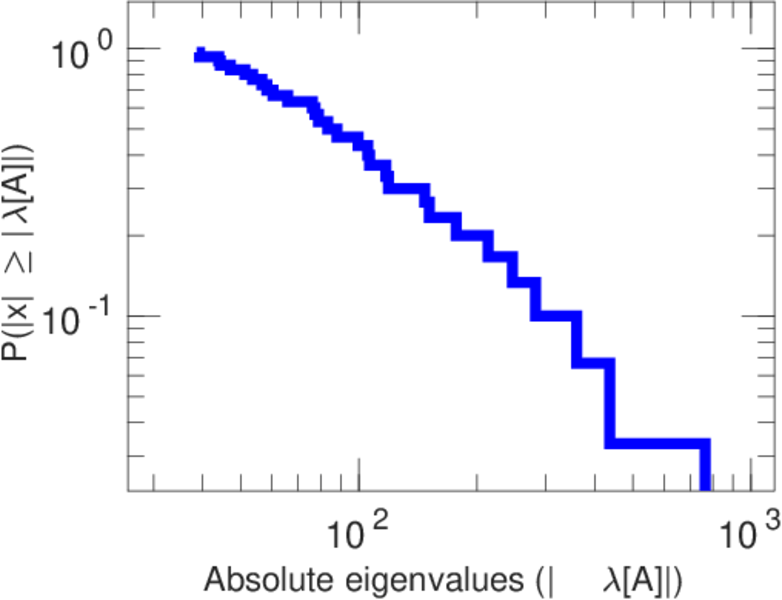
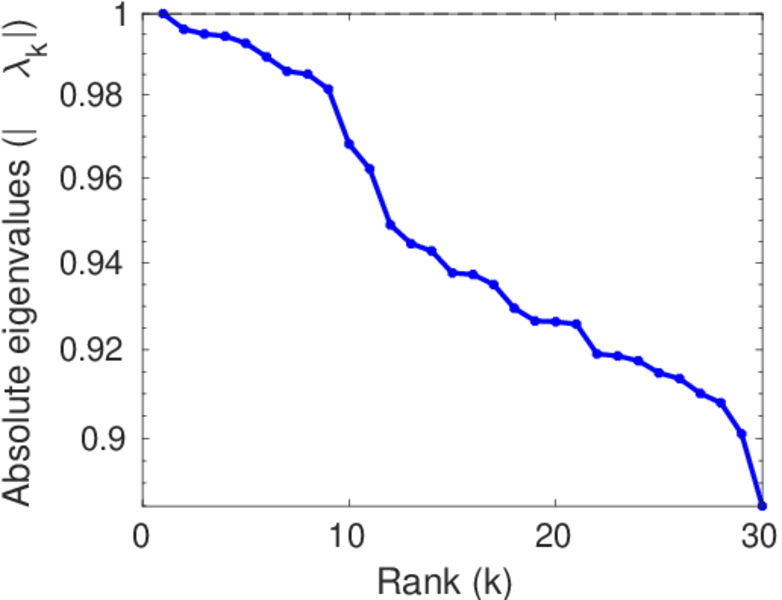
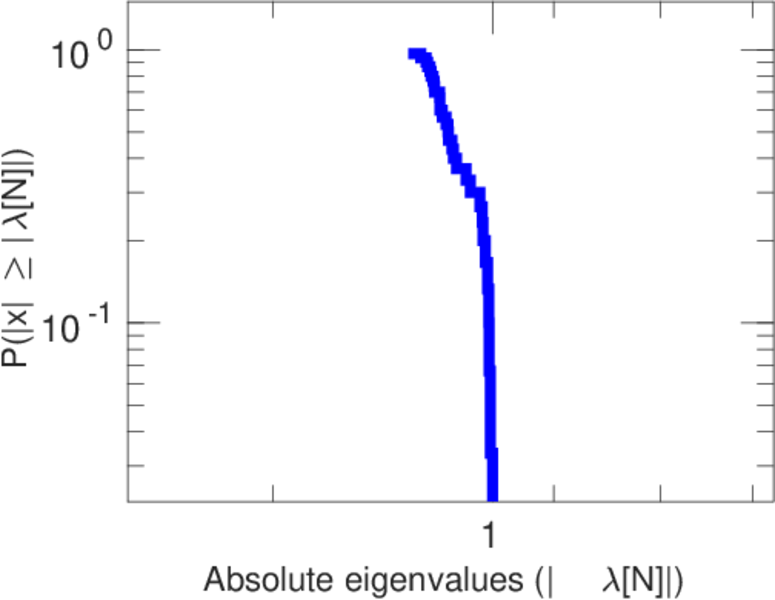
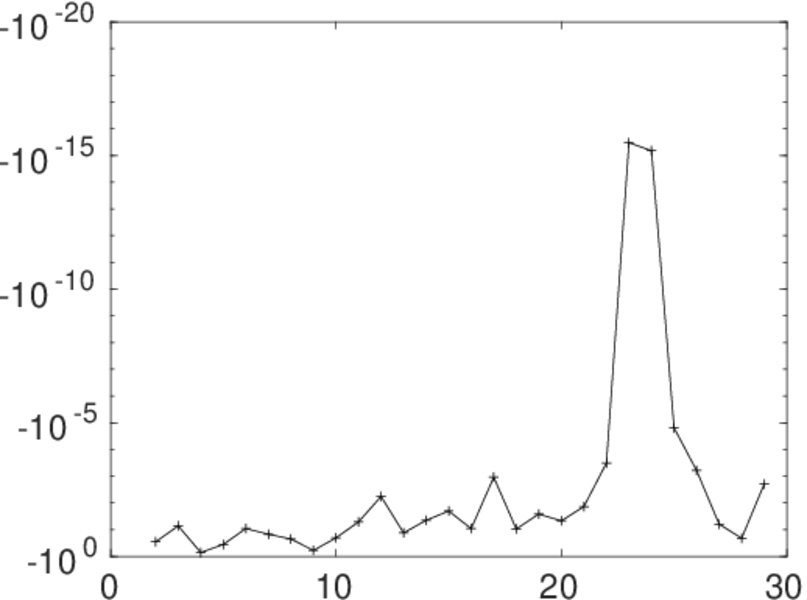
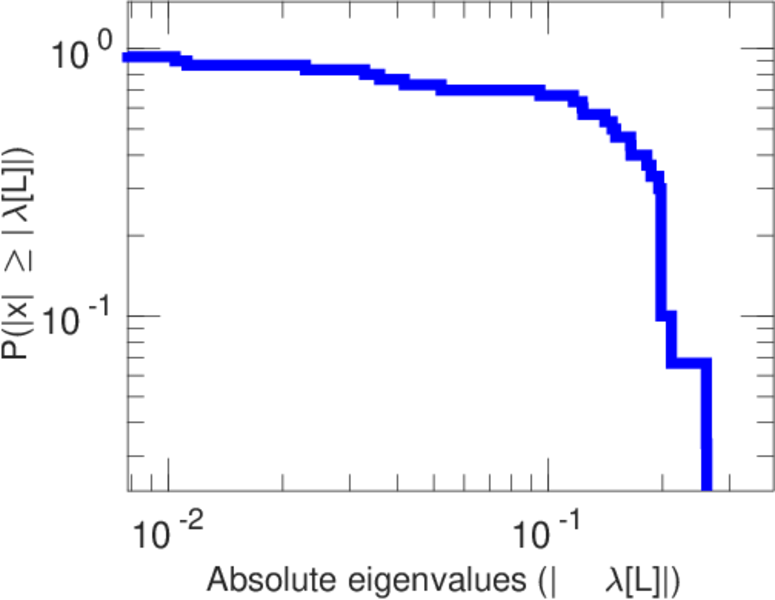
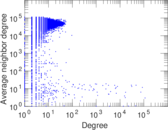
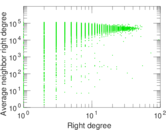
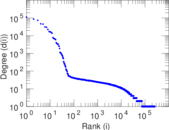
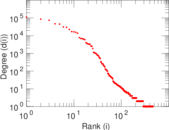
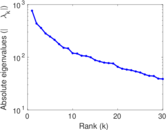
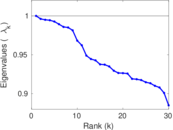
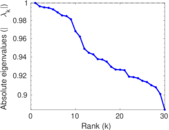
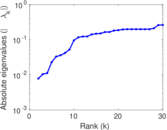
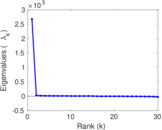
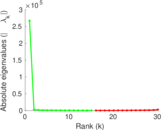
Plots


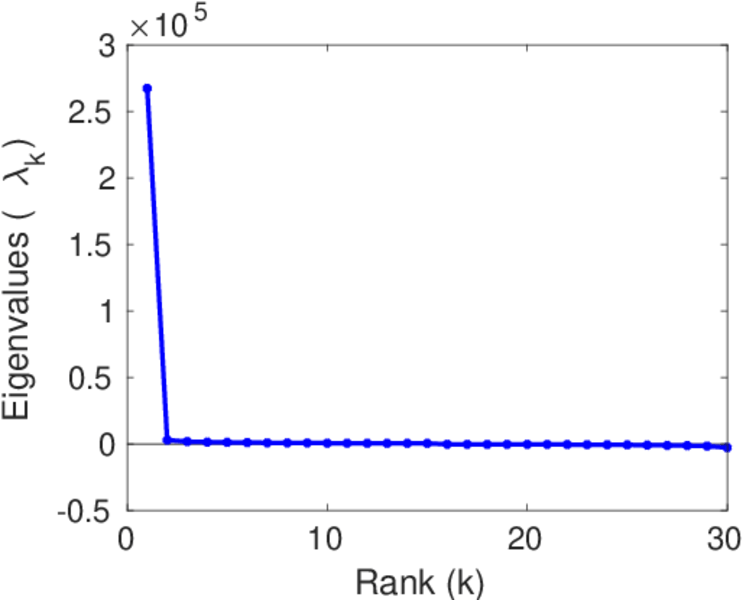
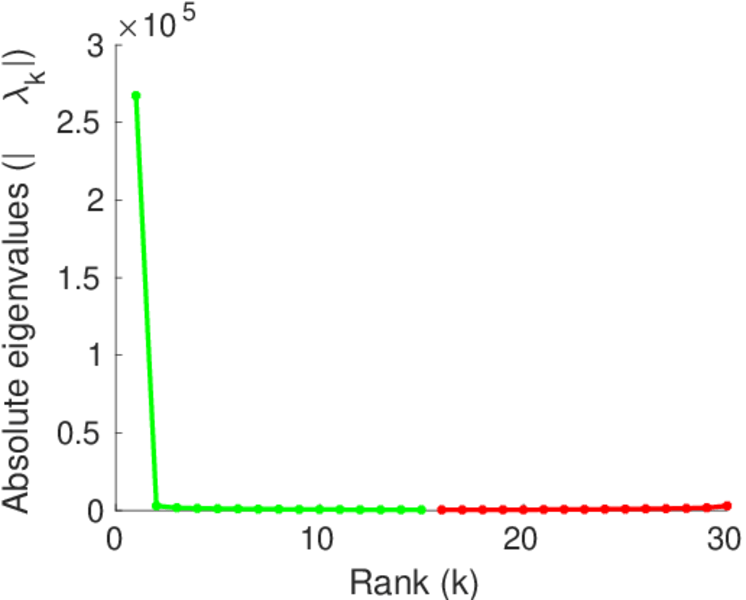
Matrix decompositions plots


Downloads
References
|
[1]
|
Jérôme Kunegis.
KONECT – The Koblenz Network Collection.
In Proc. Int. Conf. on World Wide Web Companion, pages
1343–1350, 2013.
[ http ]
|
|
[2]
|
Wikimedia Foundation.
Wikimedia downloads.
http://dumps.wikimedia.org/, January 2010.
|
 KONECT ‣ Networks ‣
Buy Me a Coffee
KONECT ‣ Networks ‣
Buy Me a Coffee