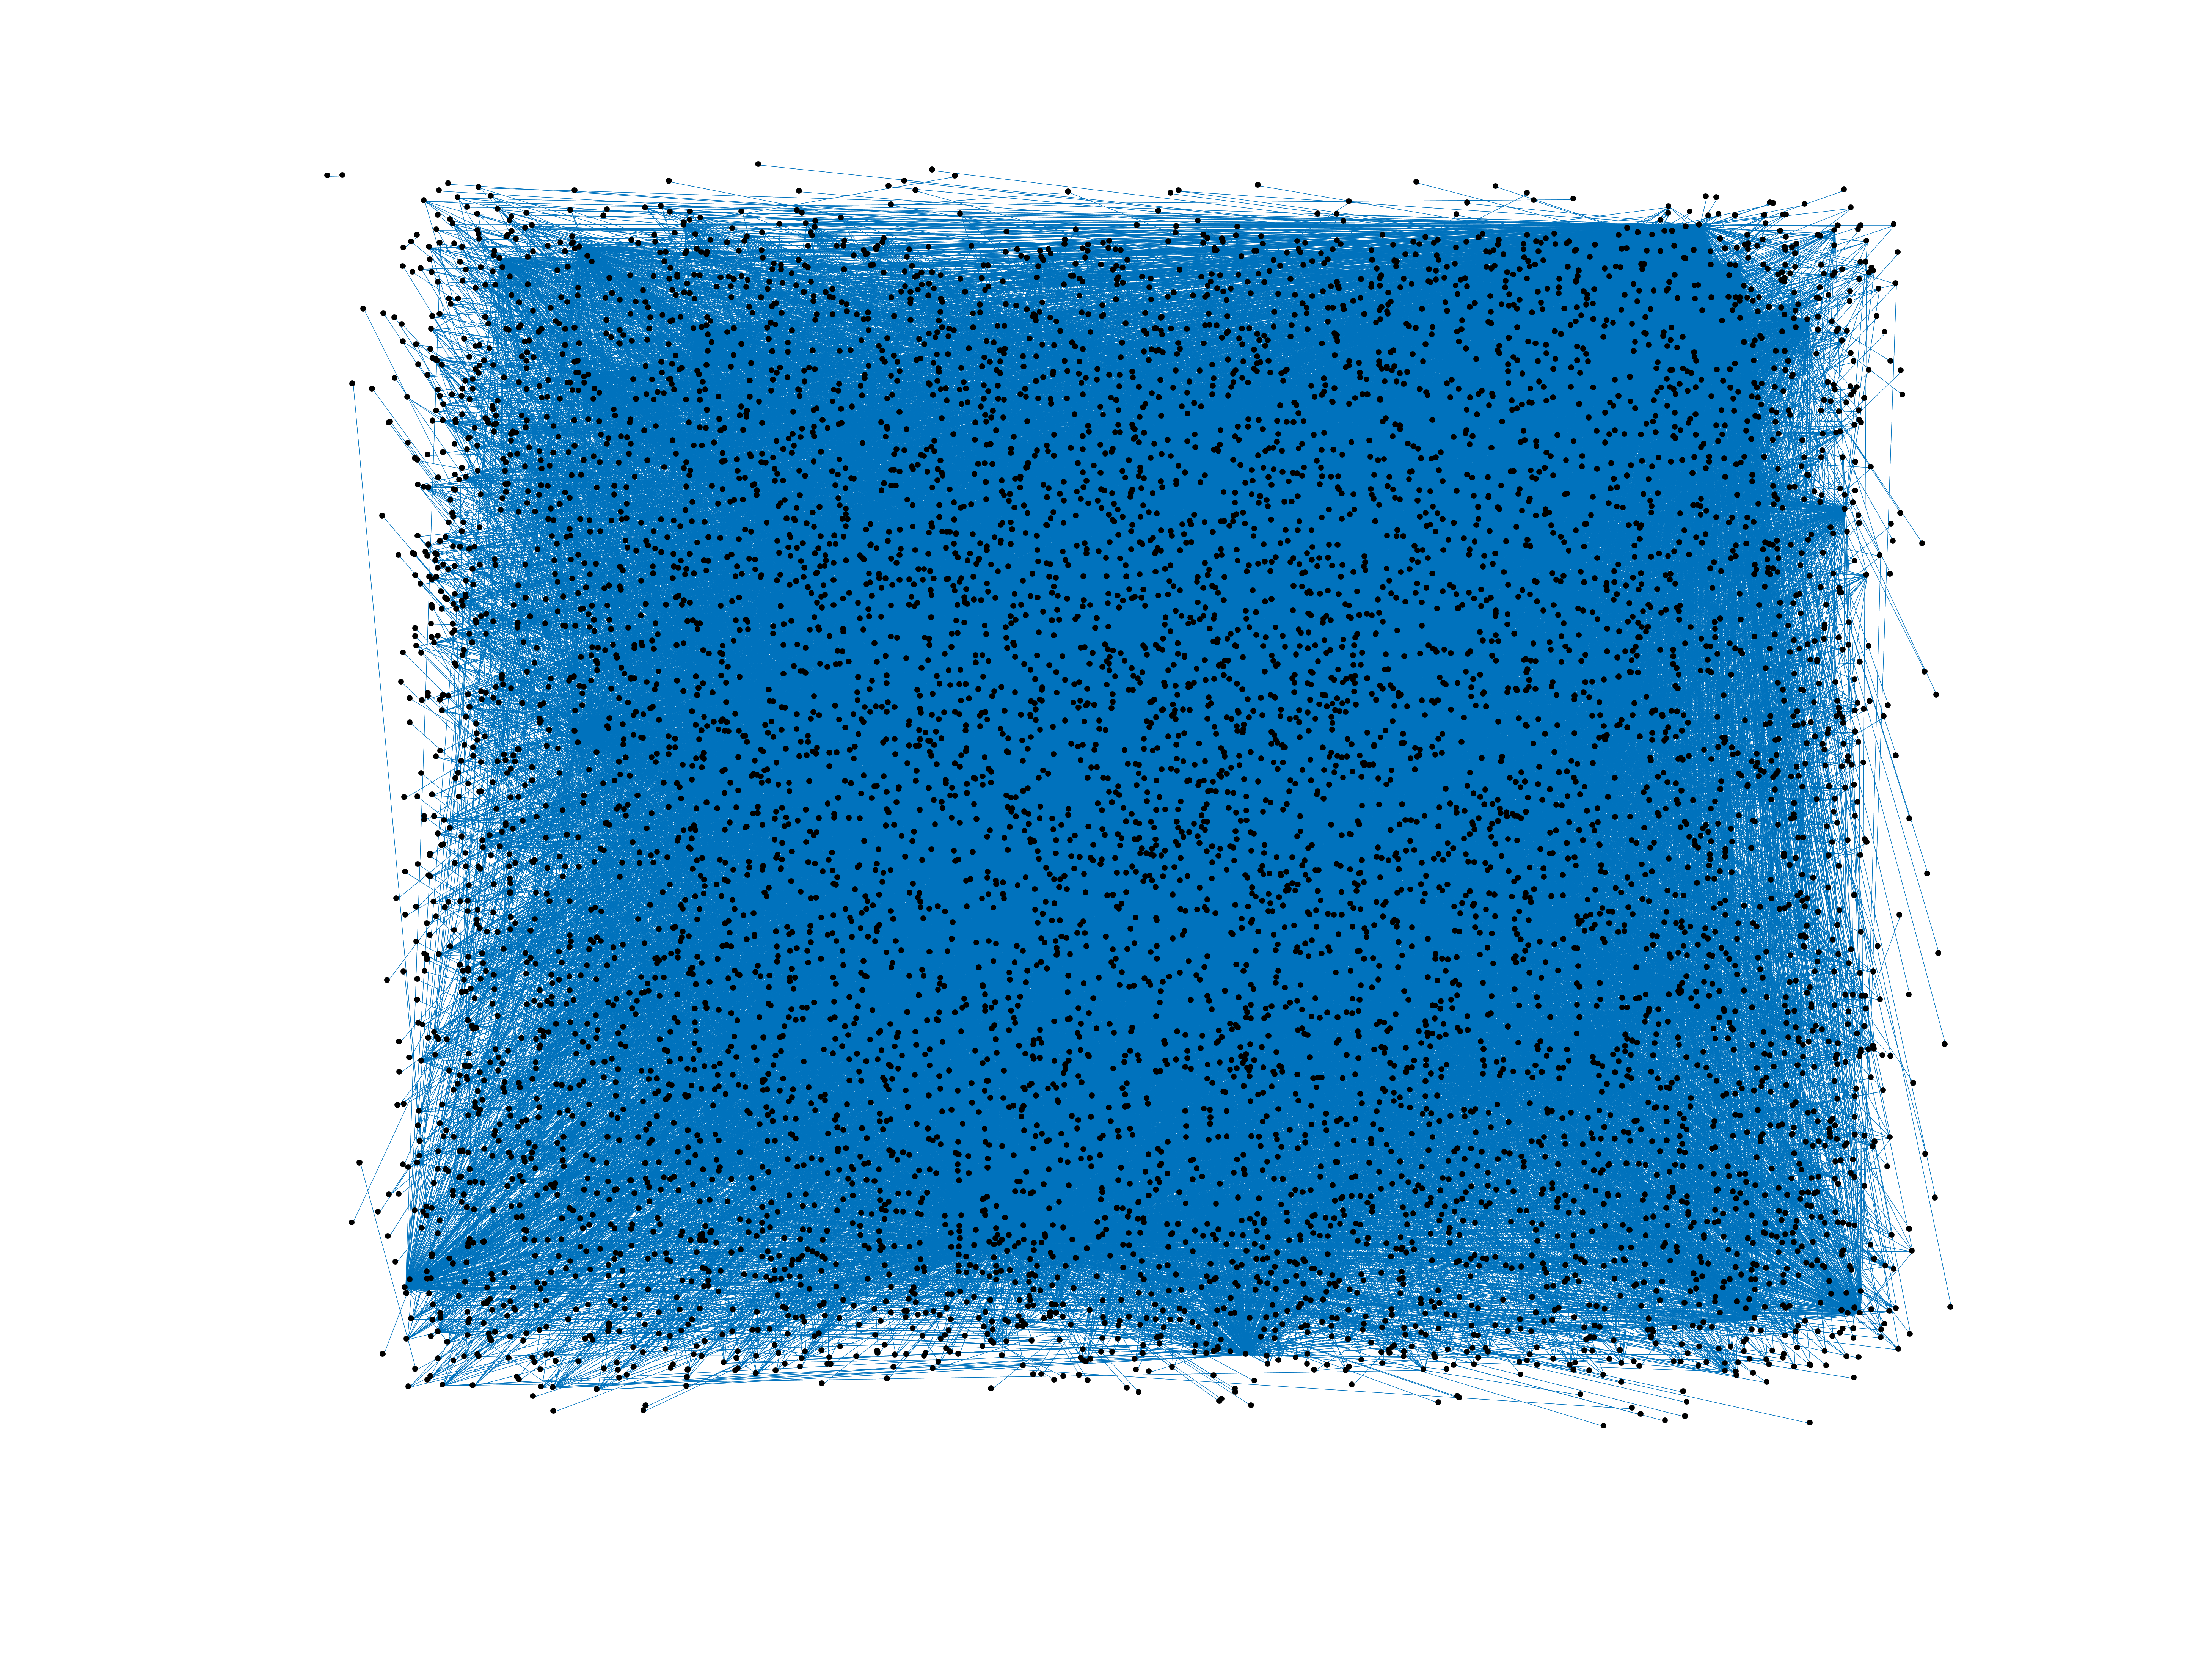
Wikipedia edits (koi)
This is the bipartite edit network of the Komi-Permyak Wikipedia. It contains
users and pages from the Komi-Permyak Wikipedia, connected by edit events. Each
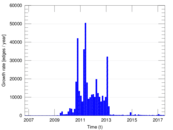
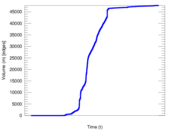
edge represents an edit. The dataset includes the timestamp of each edit.
Metadata
Statistics
| Size | n = | 7,691
|
| Left size | n1 = | 532
|
| Right size | n2 = | 7,159
|
| Volume | m = | 47,771
|
| Unique edge count | m̿ = | 27,885
|
| Wedge count | s = | 19,116,309
|
| Claw count | z = | 14,601,310,956
|
| Cross count | x = | 9,775,998,346,319
|
| Square count | q = | 17,138,592
|
| 4-Tour count | T4 = | 213,631,022
|
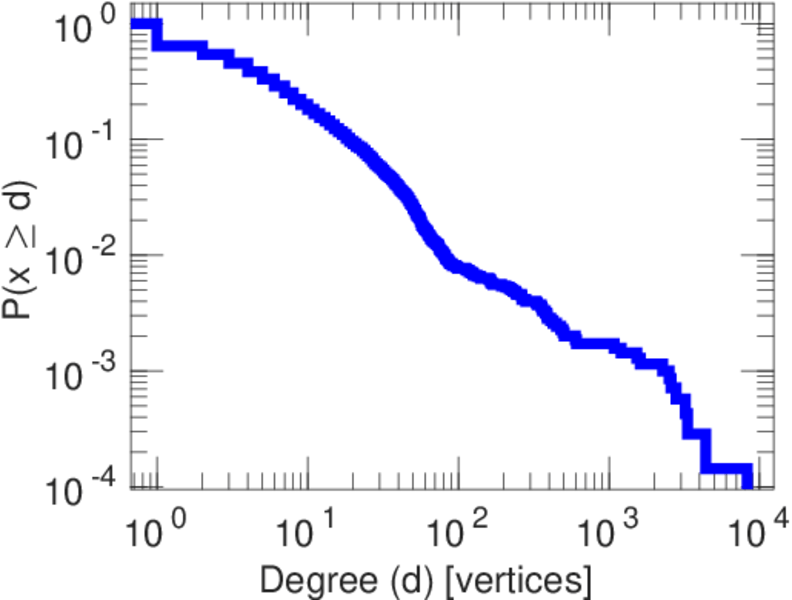
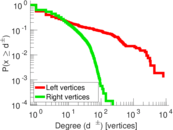
| Maximum degree | dmax = | 8,245
|
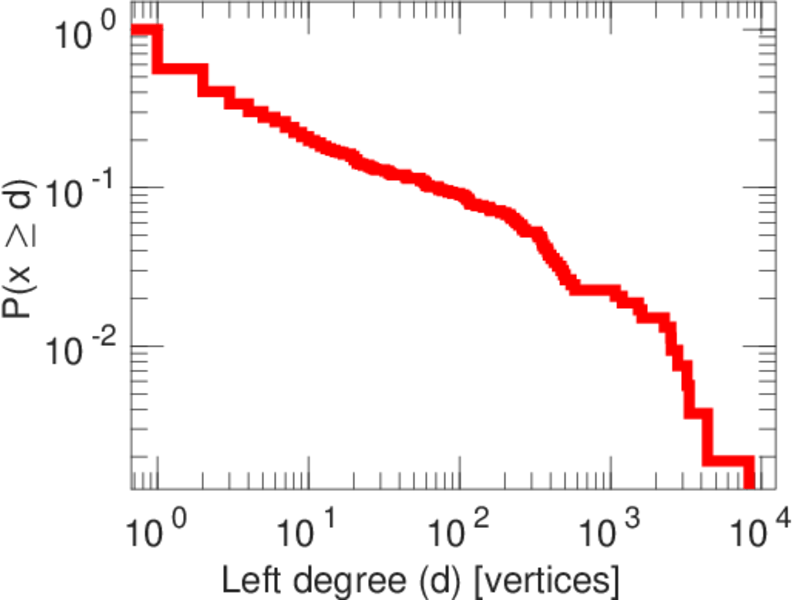
| Maximum left degree | d1max = | 8,245
|
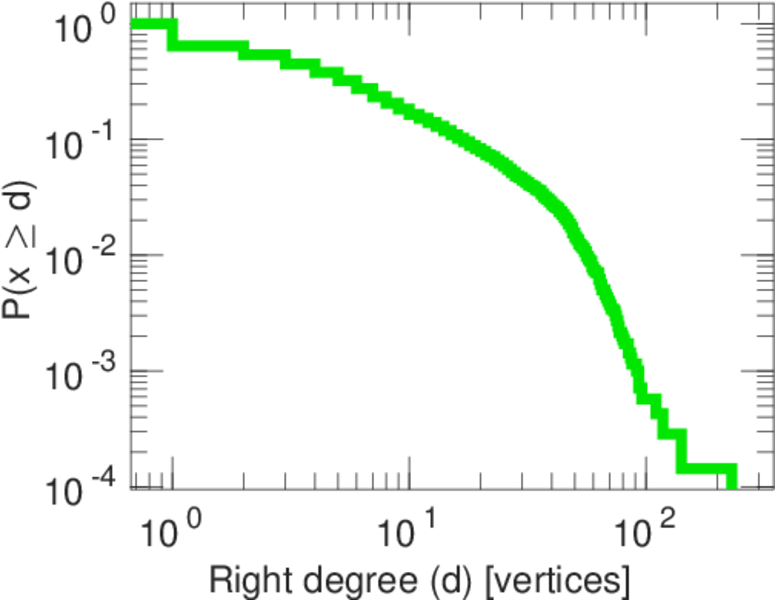
| Maximum right degree | d2max = | 230
|
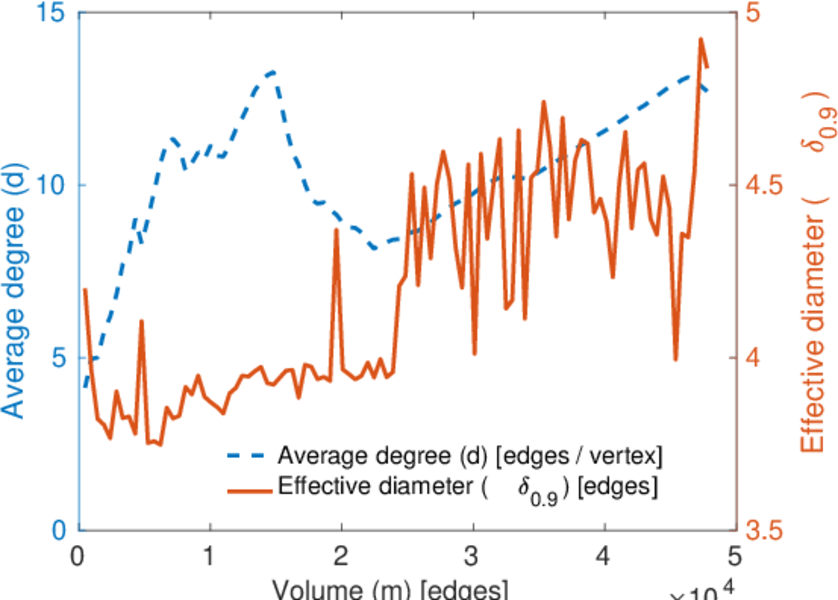
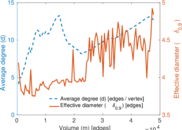
| Average degree | d = | 12.422 6
|
| Average left degree | d1 = | 89.795 1
|
| Average right degree | d2 = | 6.672 86
|
| Fill | p = | 0.007 321 61
|
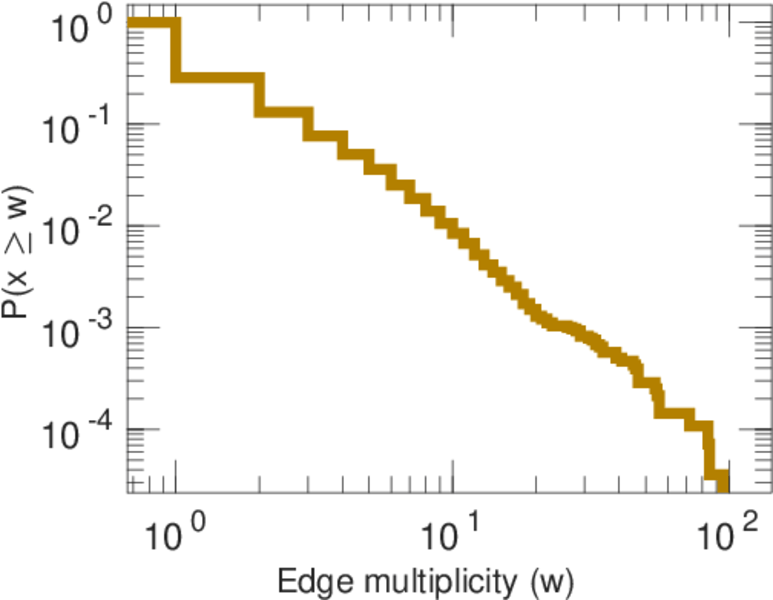
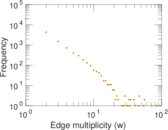
| Average edge multiplicity | m̃ = | 1.713 14
|
| Size of LCC | N = | 7,198
|
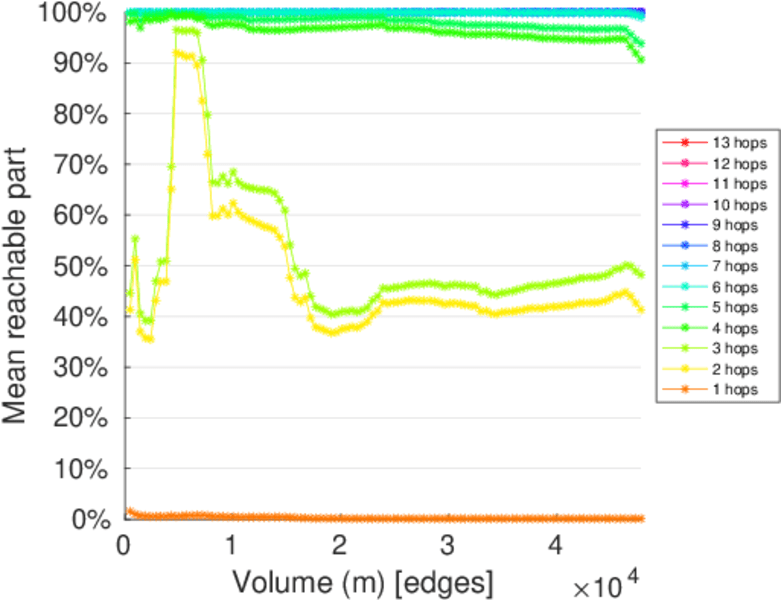
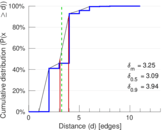
| Diameter | δ = | 13
|
| 50-Percentile effective diameter | δ0.5 = | 3.087 79
|
| 90-Percentile effective diameter | δ0.9 = | 3.939 12
|
| Median distance | δM = | 4
|
| Mean distance | δm = | 3.251 08
|
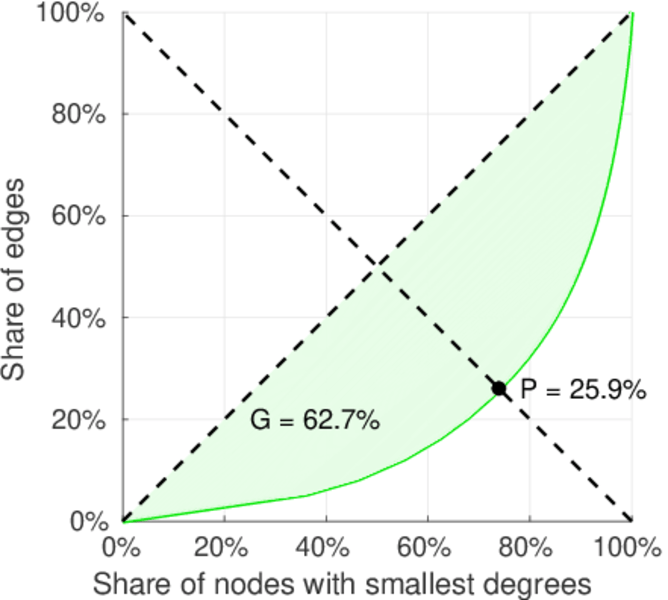
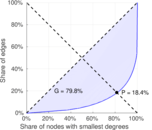
| Gini coefficient | G = | 0.802 919
|
| Balanced inequality ratio | P = | 0.179 743
|
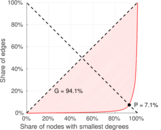
| Left balanced inequality ratio | P1 = | 0.070 984 5
|
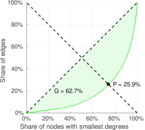
| Right balanced inequality ratio | P2 = | 0.259 279
|
| Relative edge distribution entropy | Her = | 0.754 099
|
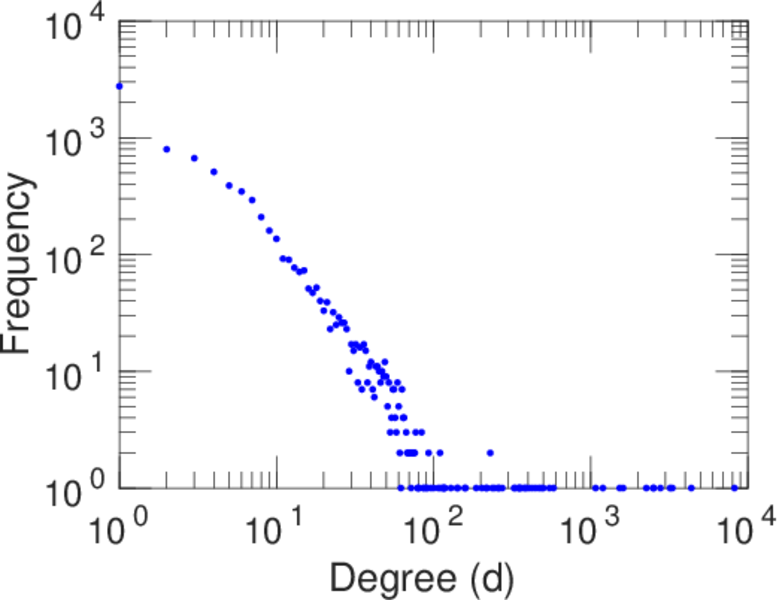
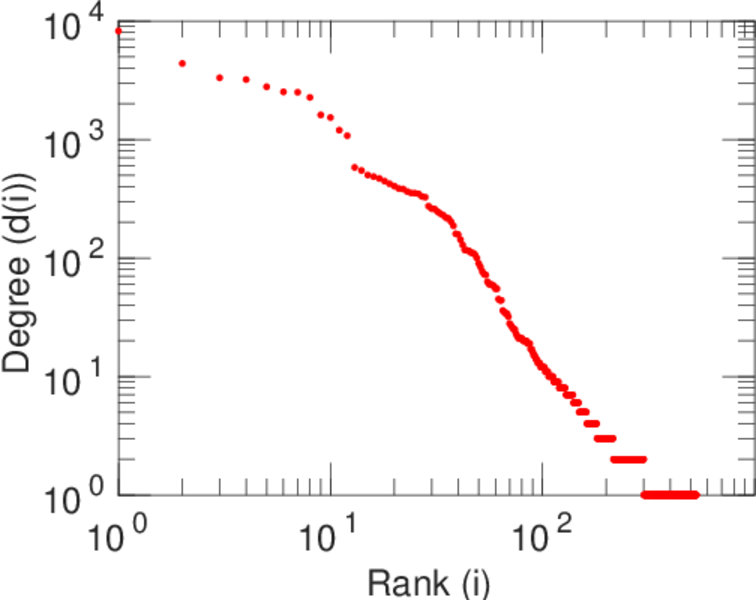
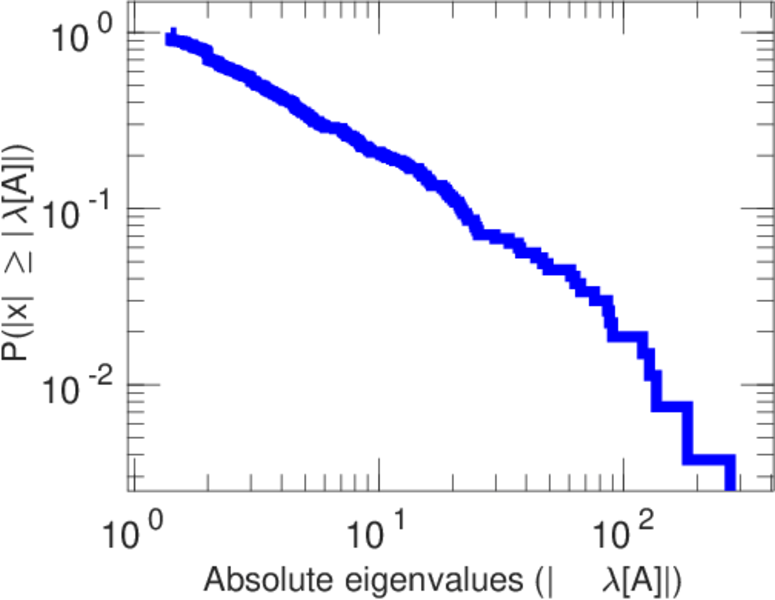
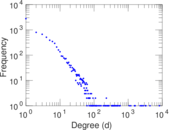
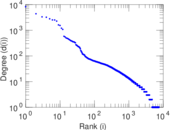
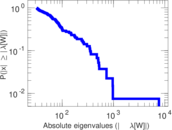
| Power law exponent | γ = | 2.076 34
|
| Tail power law exponent | γt = | 2.401 00
|
| Tail power law exponent with p | γ3 = | 2.401 00
|
| p-value | p = | 0.000 00
|
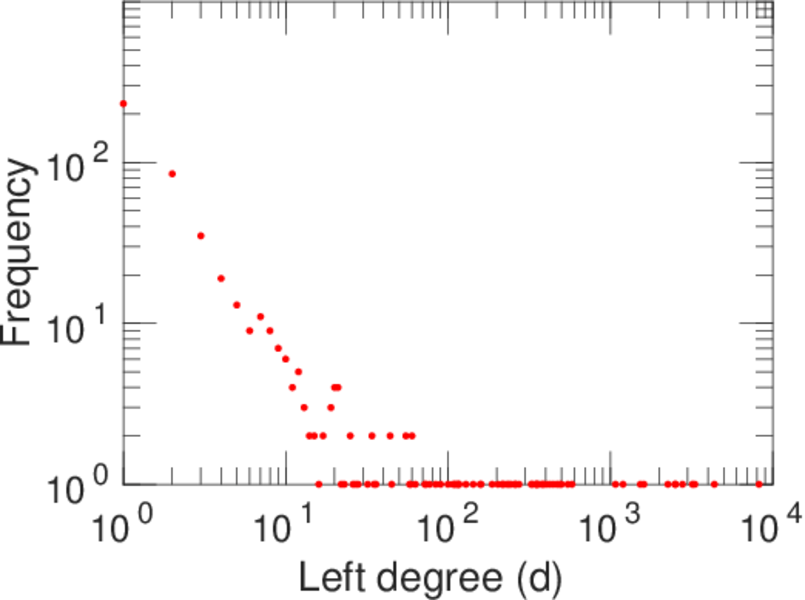
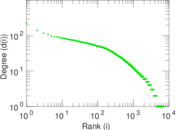
| Left tail power law exponent with p | γ3,1 = | 1.471 00
|
| Left p-value | p1 = | 0.006 000 00
|
| Right tail power law exponent with p | γ3,2 = | 2.631 00
|
| Right p-value | p2 = | 0.000 00
|
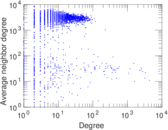
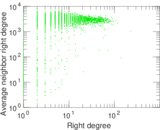
| Degree assortativity | ρ = | −0.345 502
|
| Degree assortativity p-value | pρ = | 0.000 00
|
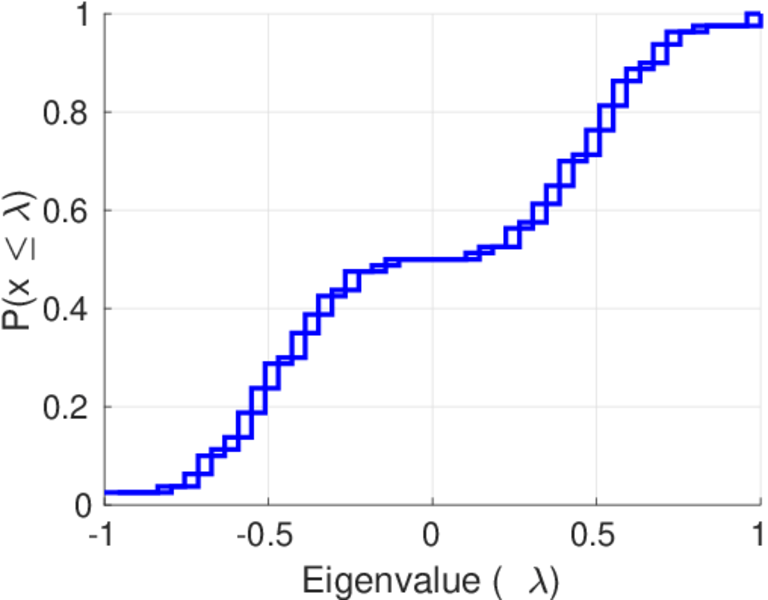
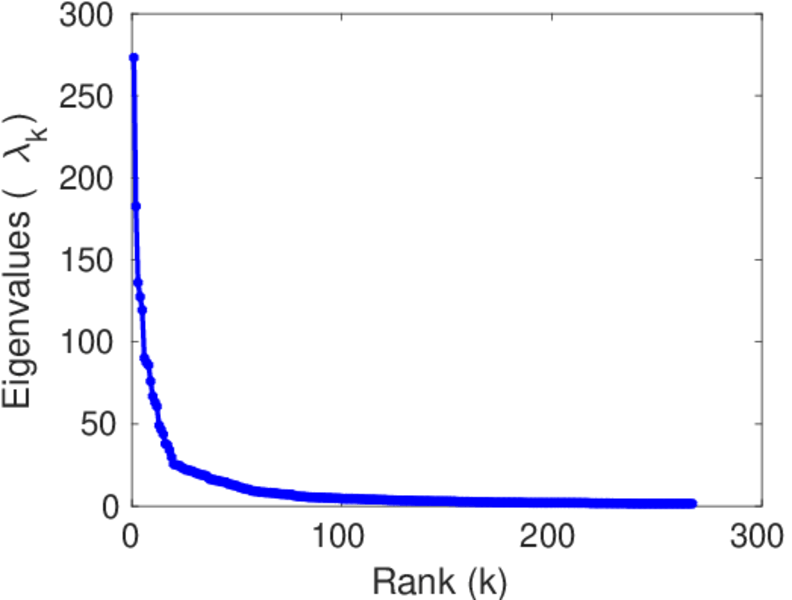
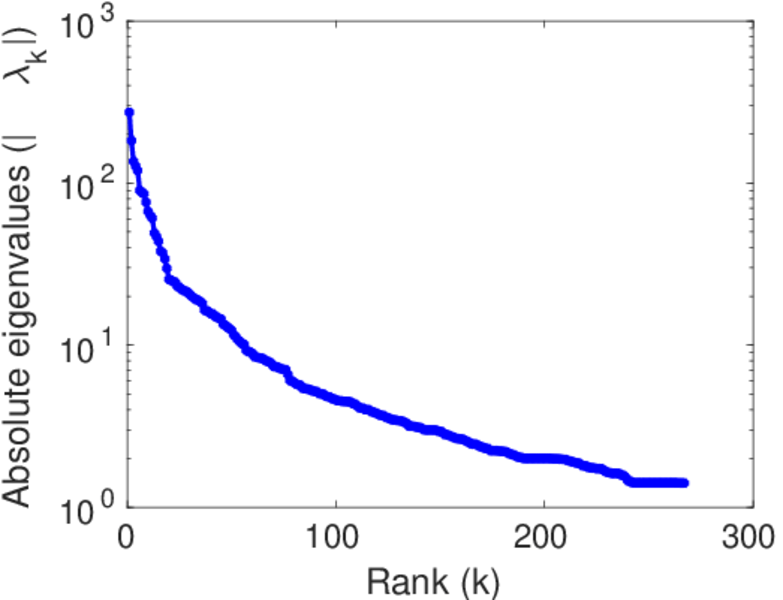
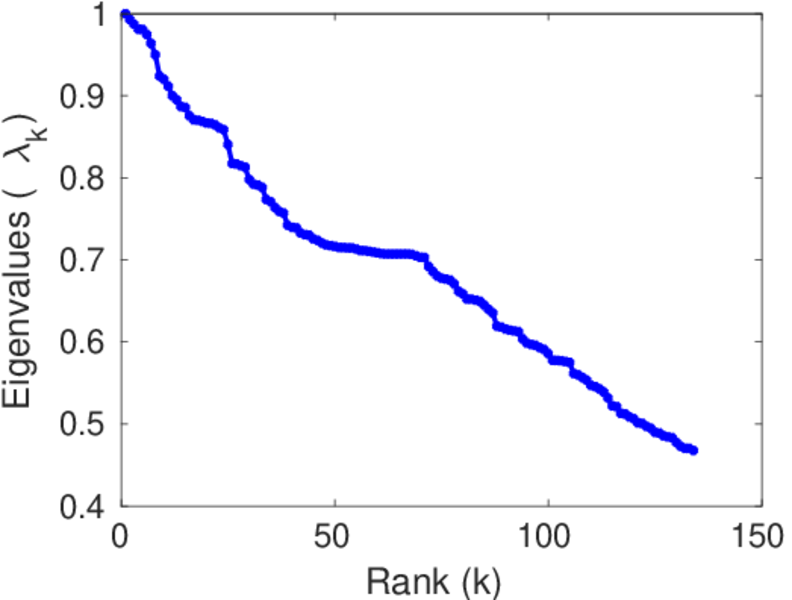
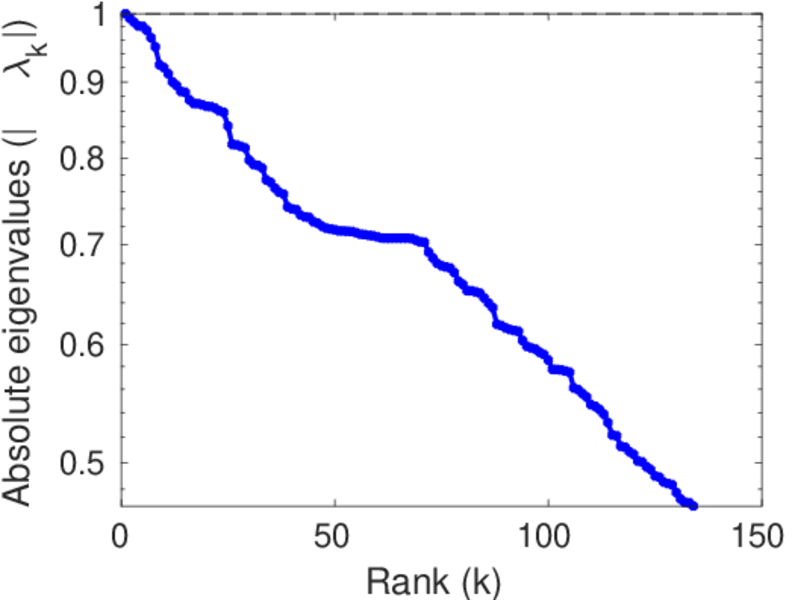
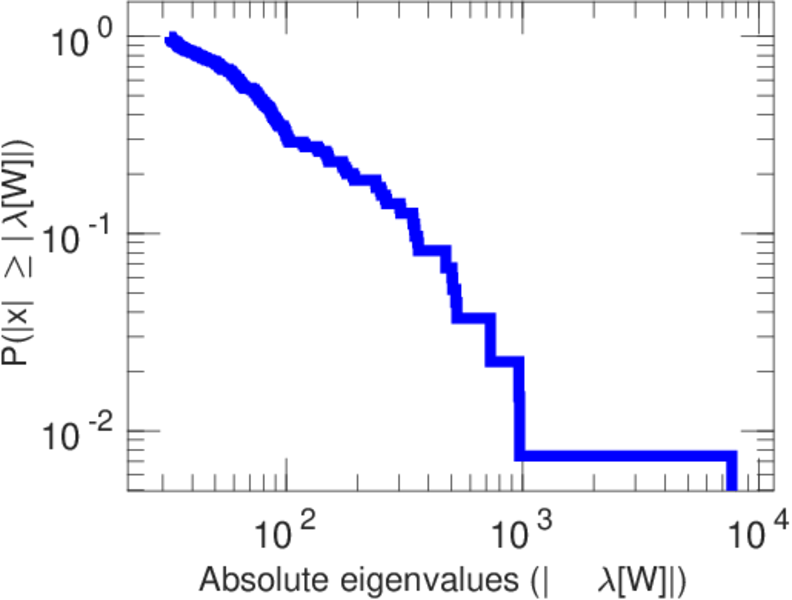
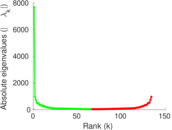
| Spectral norm | α = | 273.164
|
| Algebraic connectivity | a = | 0.028 556 5
|
| Spectral separation | |λ1[A] / λ2[A]| = | 1.495 35
|
| Controllability | C = | 6,531
|
| Relative controllability | Cr = | 0.868 831
|
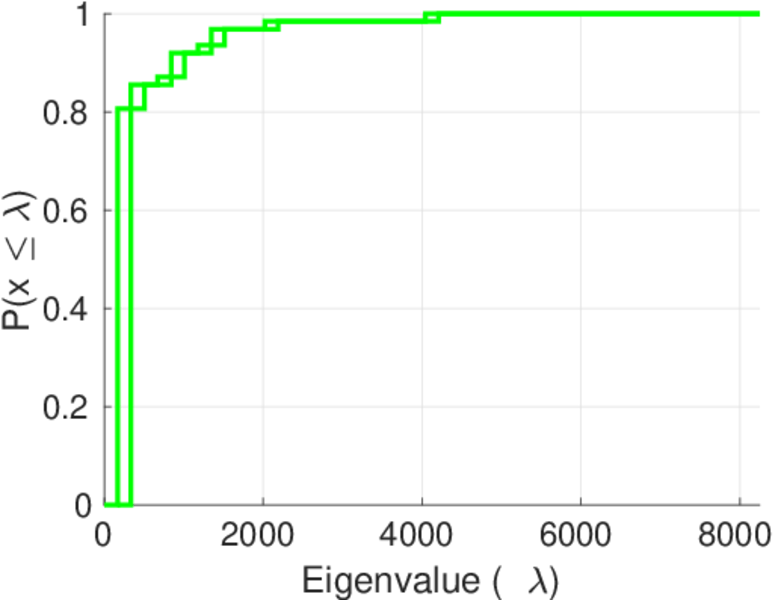
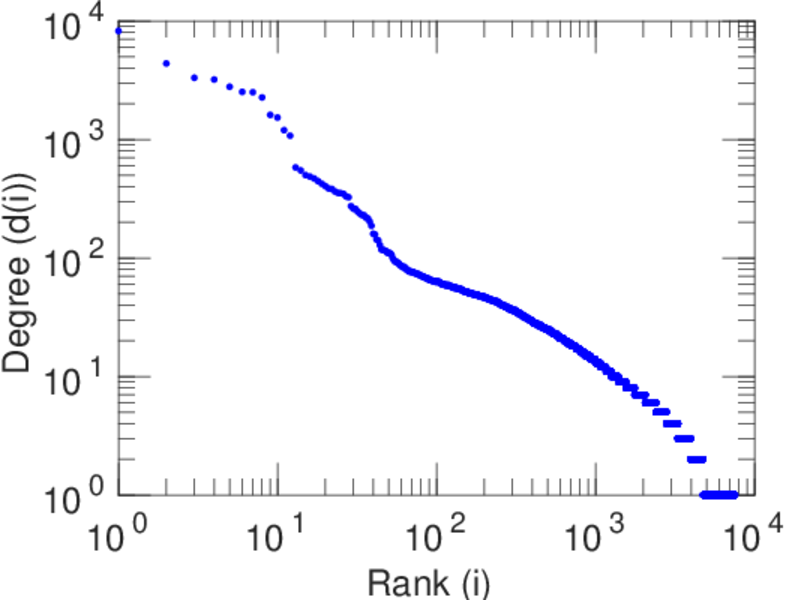
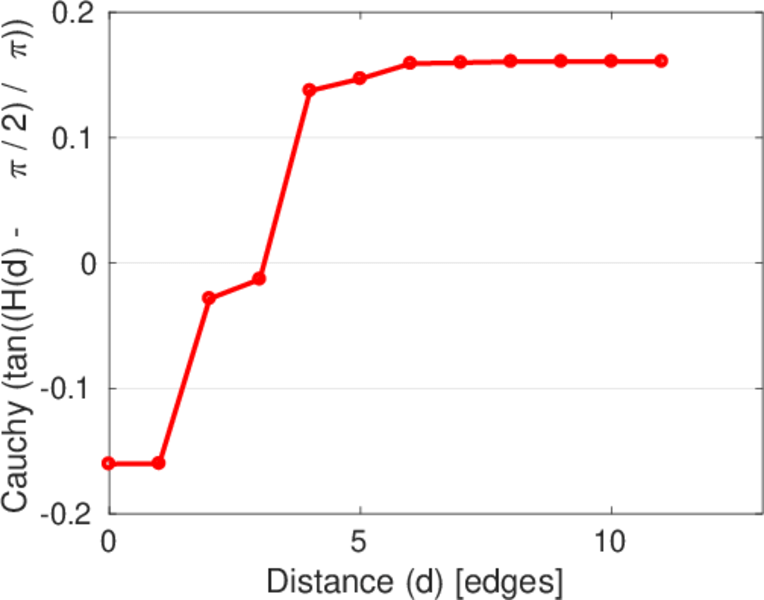
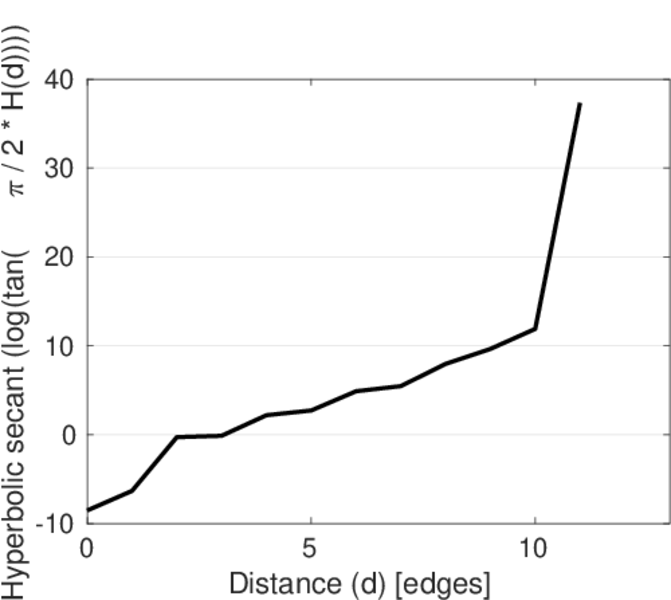
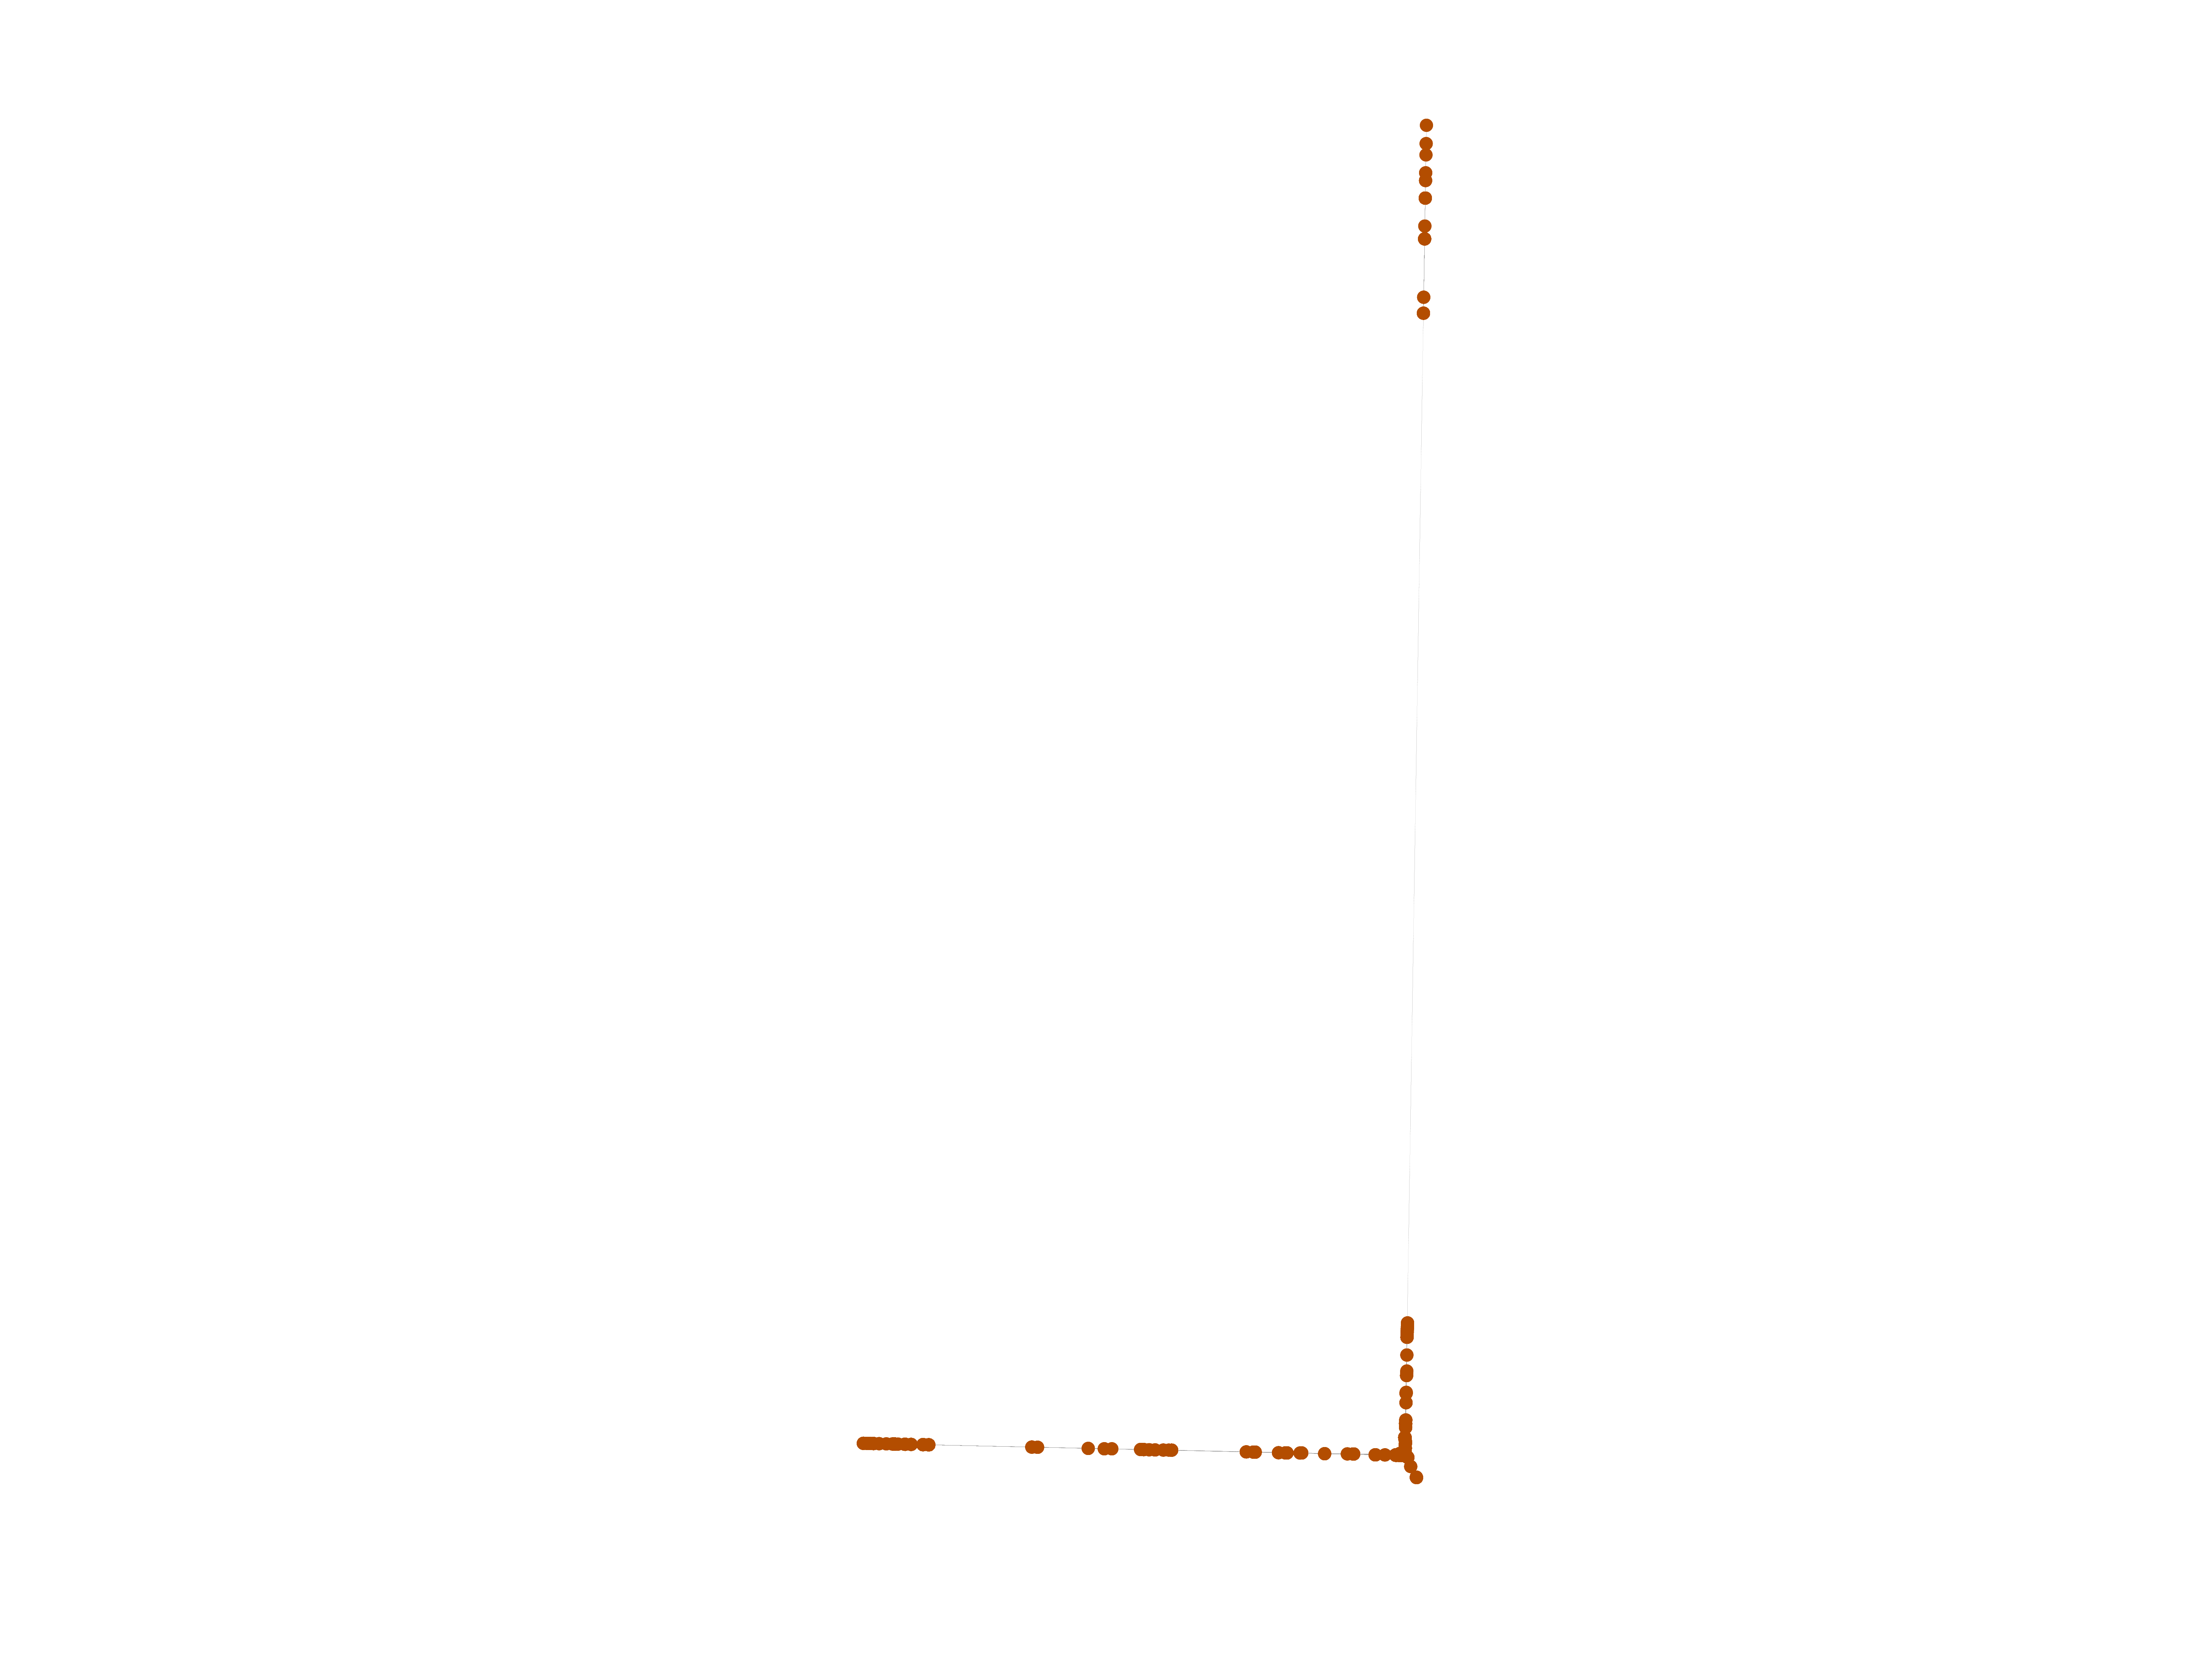
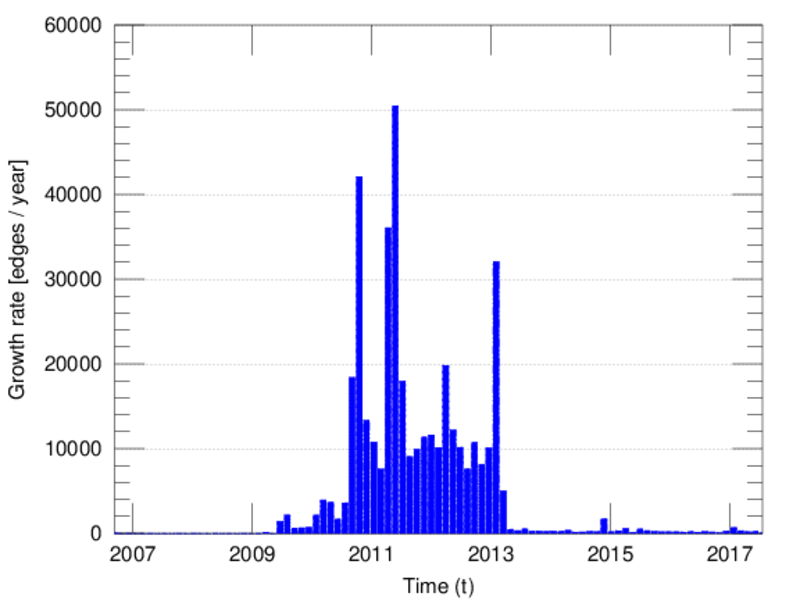
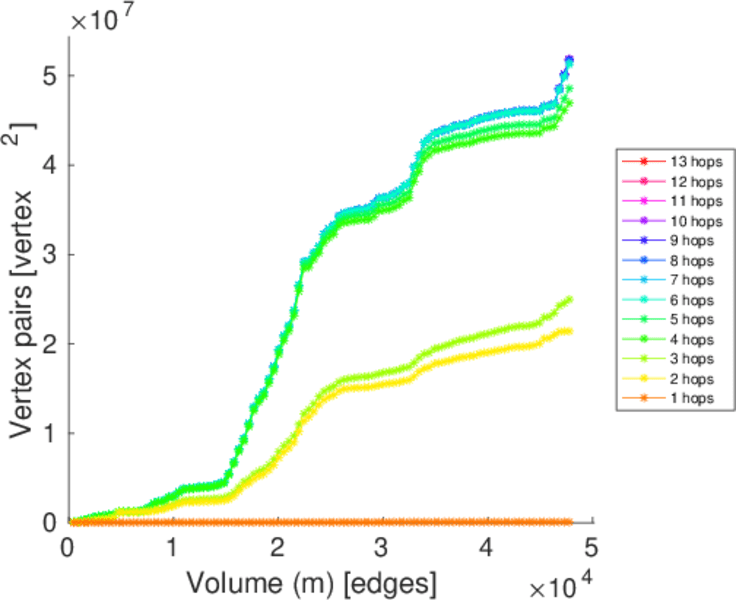
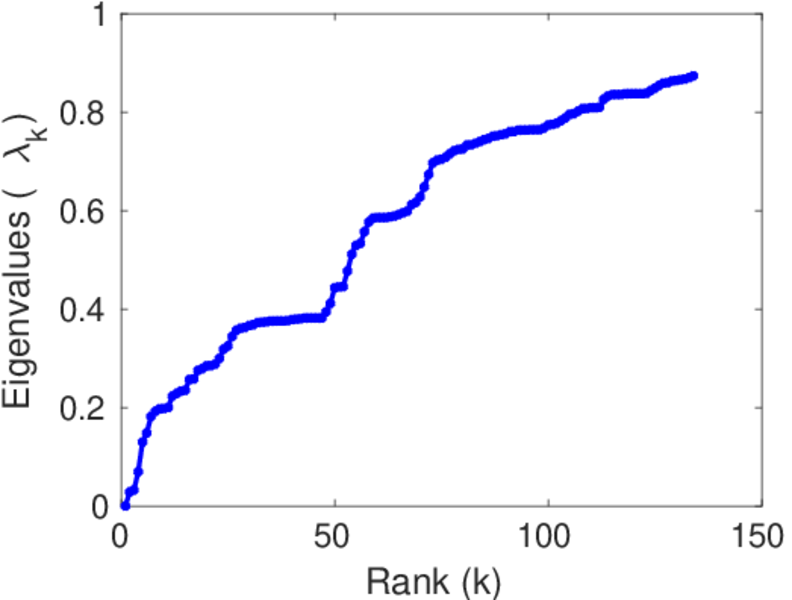
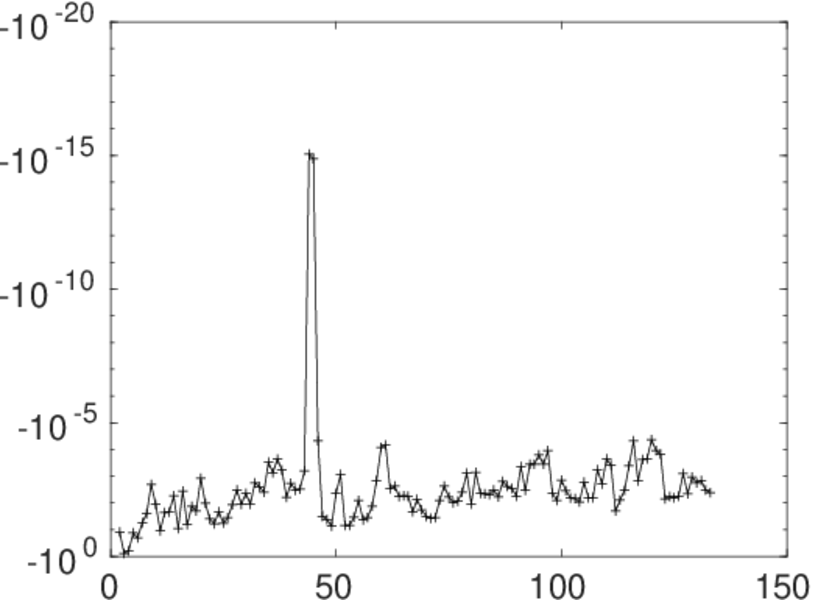
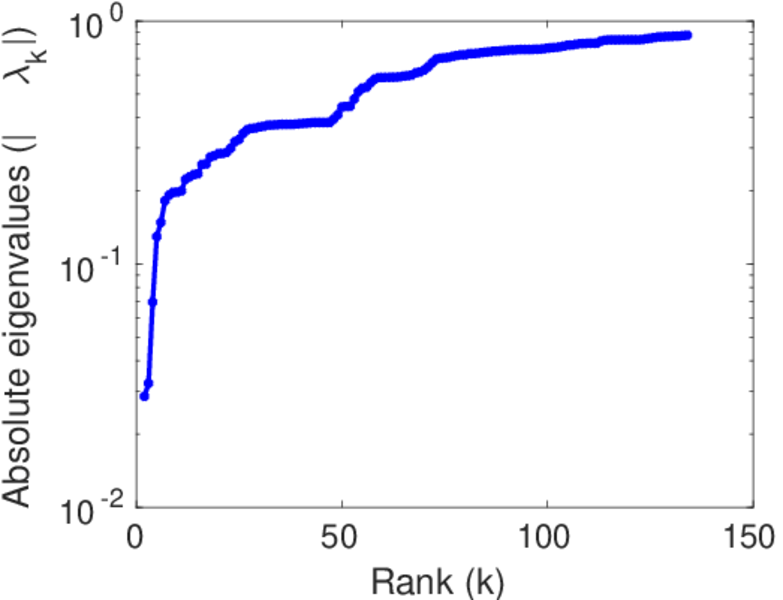
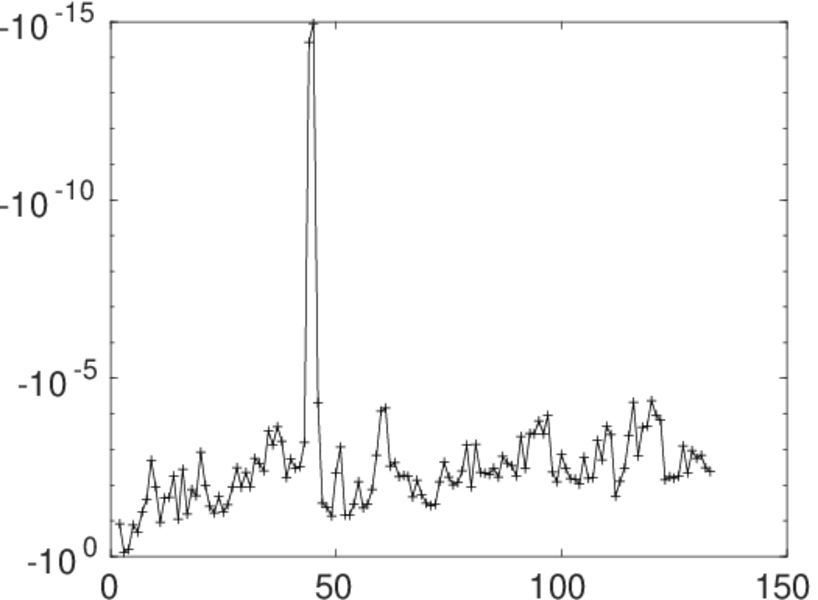
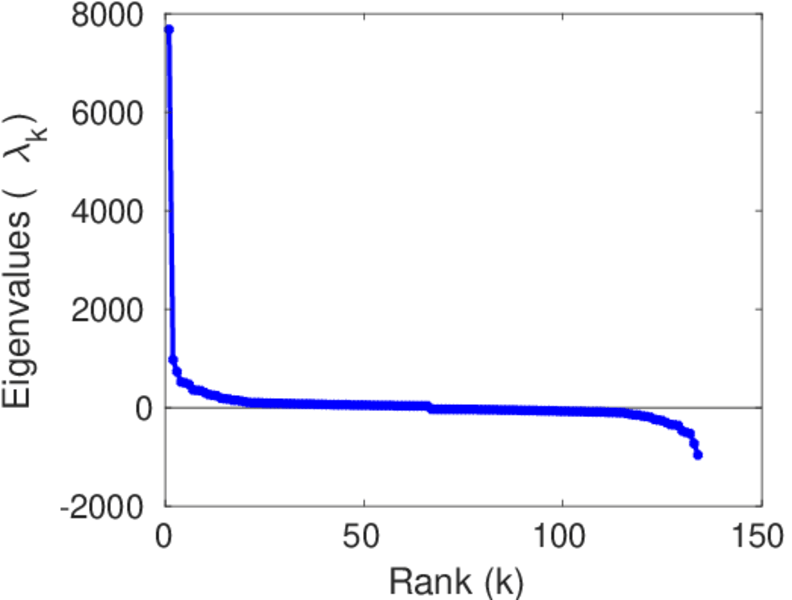
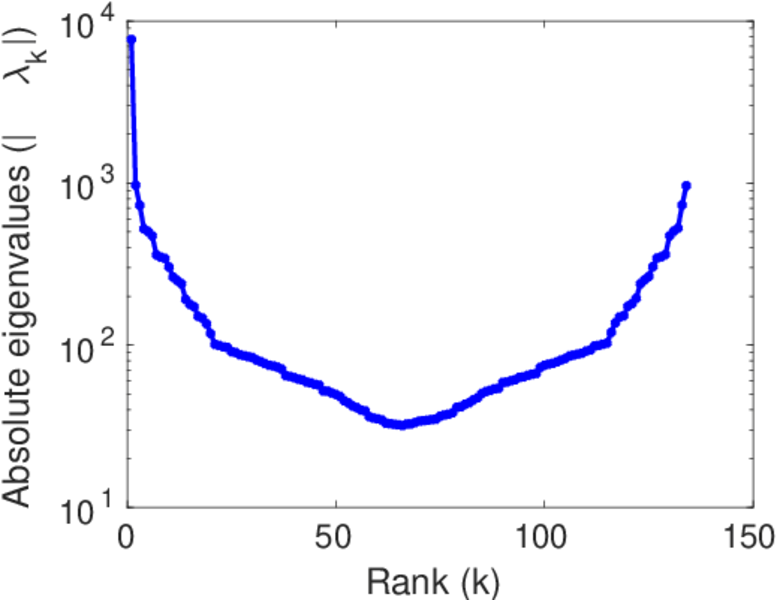
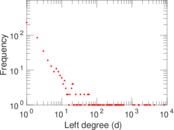
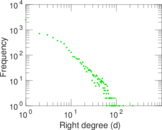
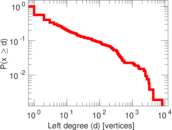
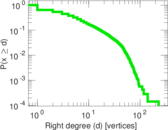
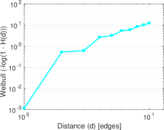
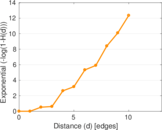
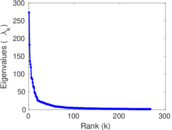
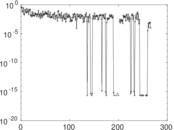
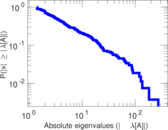
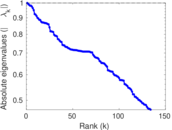
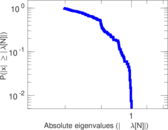
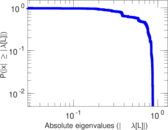
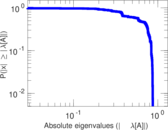
Plots


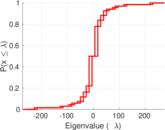

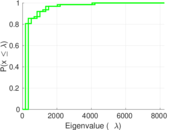


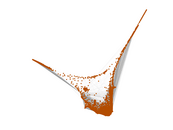
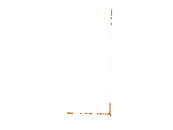
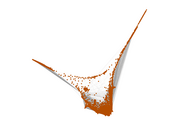


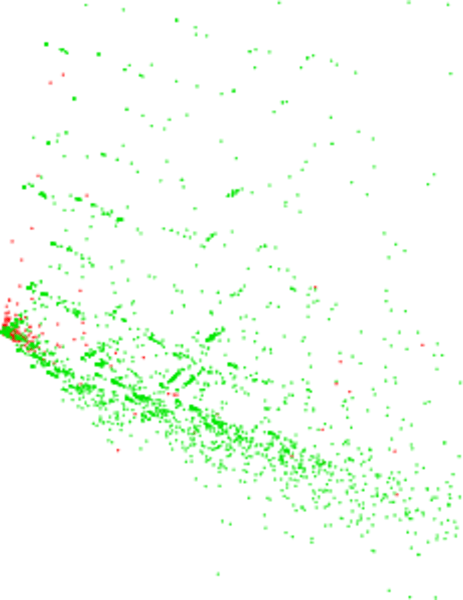
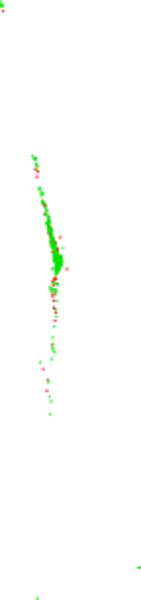
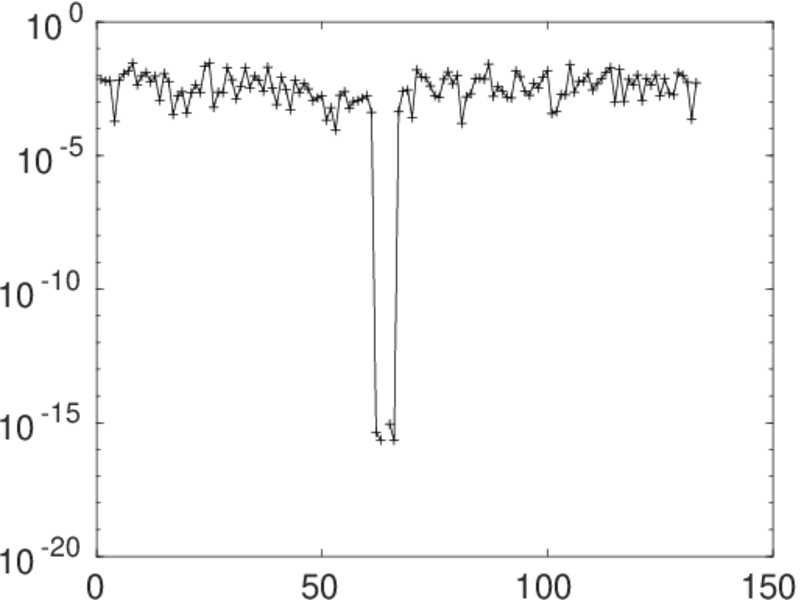
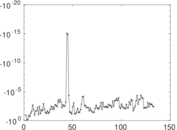
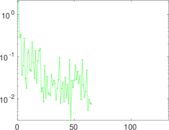
Matrix decompositions plots


Downloads
References
|
[1]
|
Jérôme Kunegis.
KONECT – The Koblenz Network Collection.
In Proc. Int. Conf. on World Wide Web Companion, pages
1343–1350, 2013.
[ http ]
|
|
[2]
|
Wikimedia Foundation.
Wikimedia downloads.
http://dumps.wikimedia.org/, January 2010.
|
 KONECT ‣ Networks ‣
Buy Me a Coffee
KONECT ‣ Networks ‣
Buy Me a Coffee