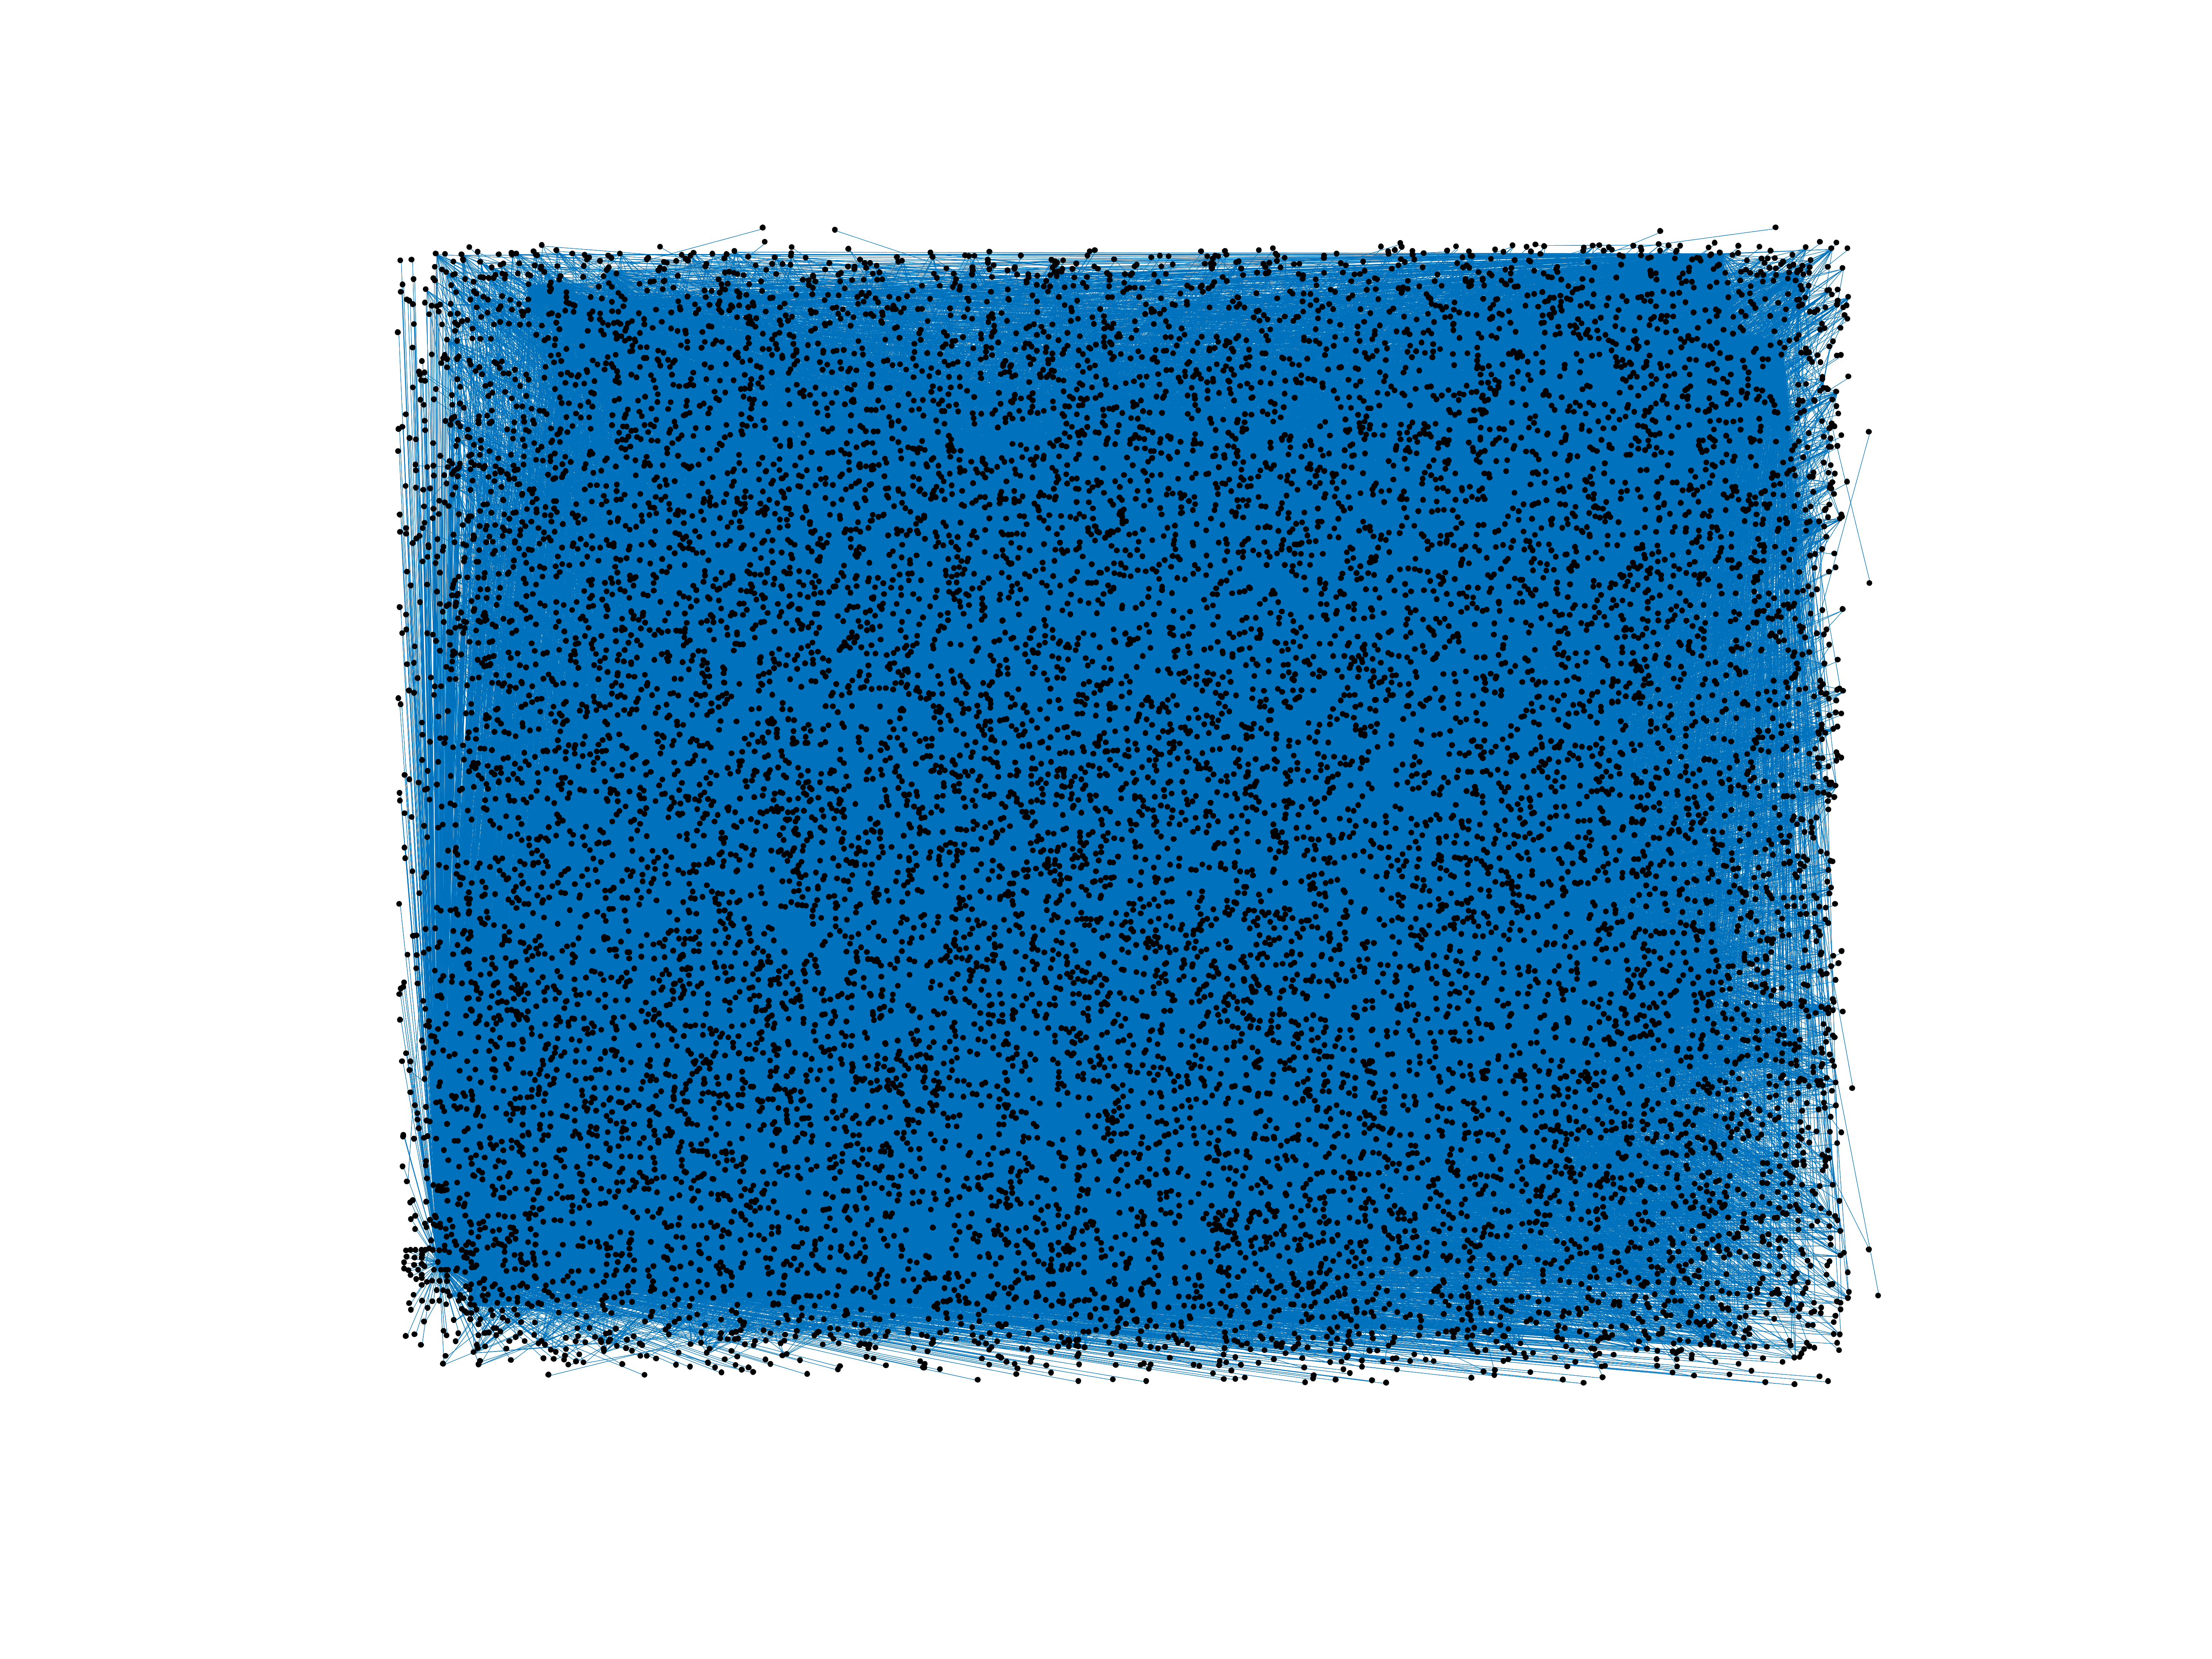
Wikipedia edits (krc)
This is the bipartite edit network of the Karachay-Balkar Wikipedia. It
contains users and pages from the Karachay-Balkar Wikipedia, connected by edit
events. Each edge represents an edit. The dataset includes the timestamp of
each edit.
Metadata
Statistics
| Size | n = | 13,944
|
| Left size | n1 = | 665
|
| Right size | n2 = | 13,279
|
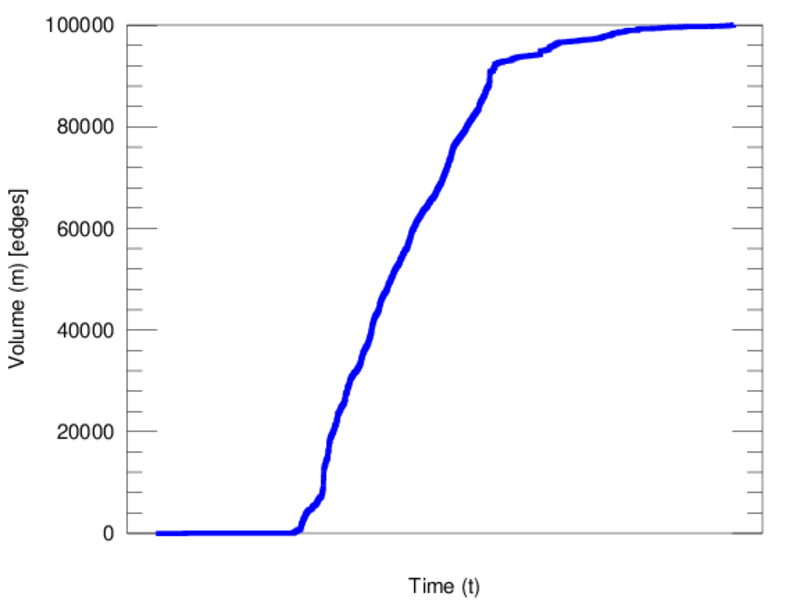
| Volume | m = | 100,023
|
| Unique edge count | m̿ = | 49,445
|
| Wedge count | s = | 67,826,352
|
| Claw count | z = | 146,096,187,855
|
| Cross count | x = | 310,781,482,896,884
|
| Square count | q = | 57,183,431
|
| 4-Tour count | T4 = | 728,964,578
|
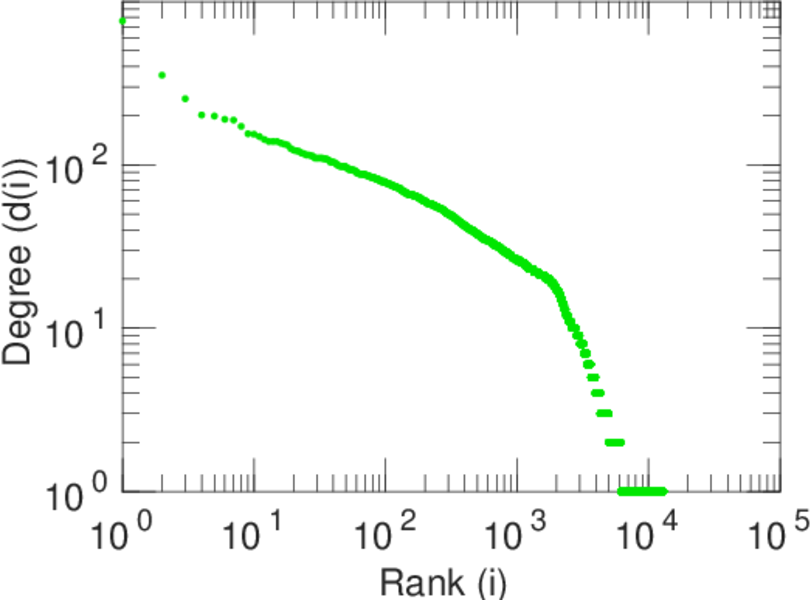
| Maximum degree | dmax = | 22,048
|
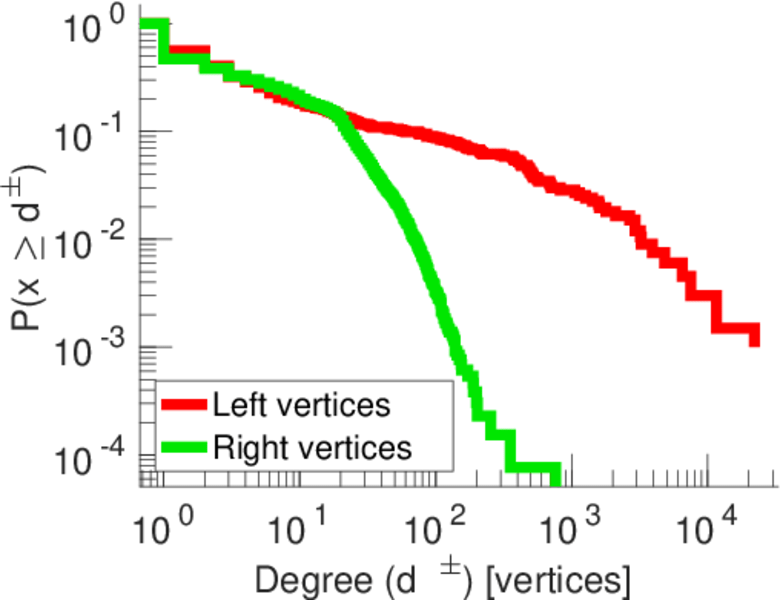
| Maximum left degree | d1max = | 22,048
|
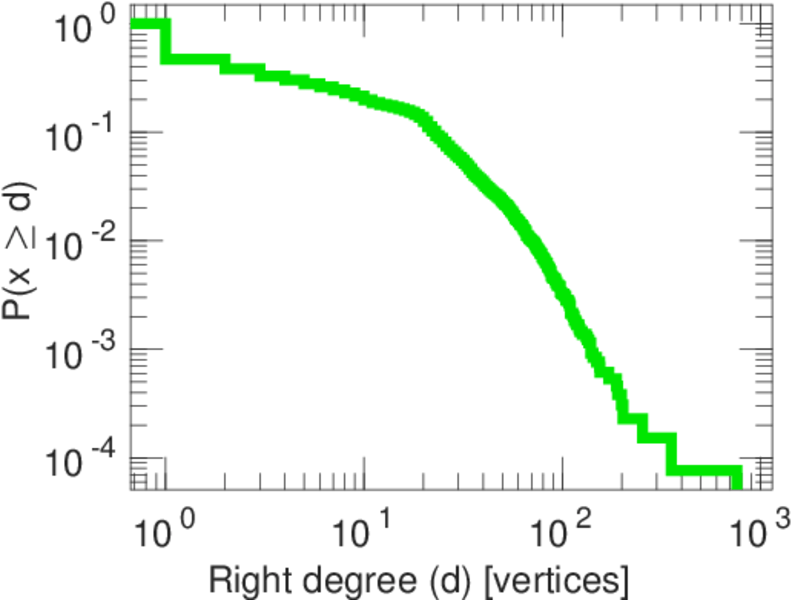
| Maximum right degree | d2max = | 761
|
| Average degree | d = | 14.346 4
|
| Average left degree | d1 = | 150.411
|
| Average right degree | d2 = | 7.532 42
|
| Fill | p = | 0.005 599 32
|
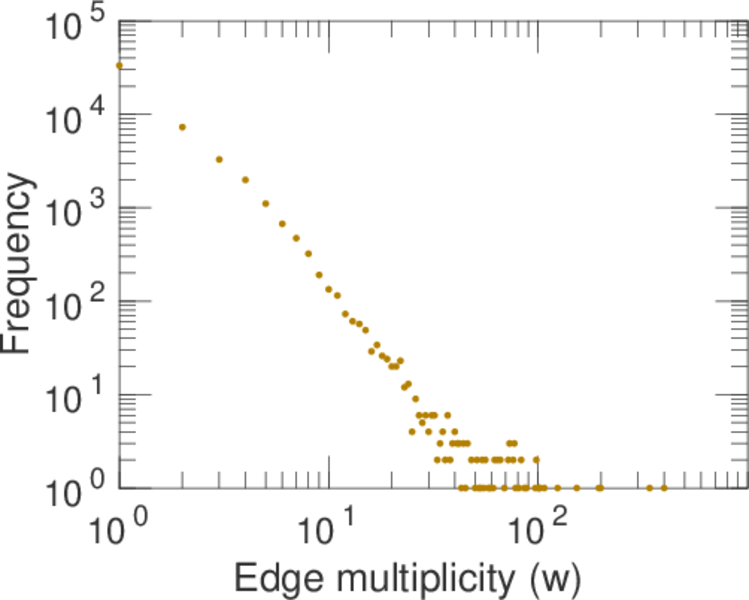
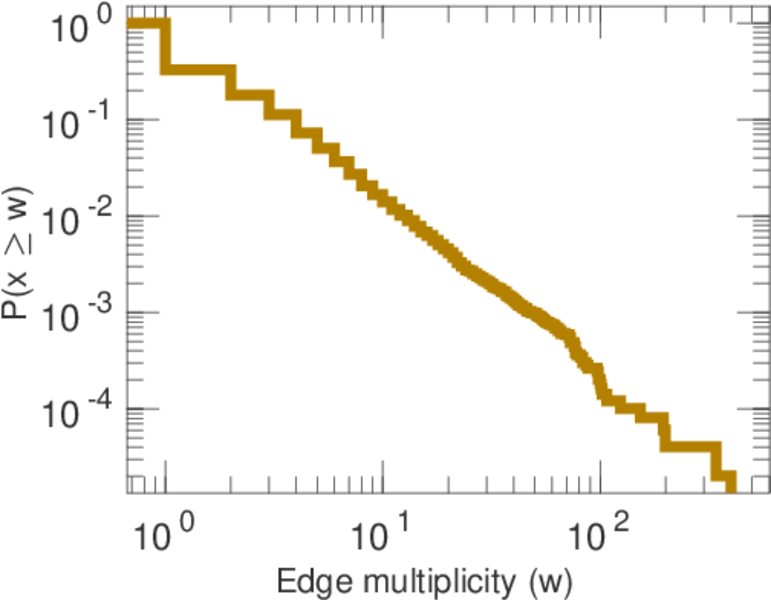
| Average edge multiplicity | m̃ = | 2.022 91
|
| Size of LCC | N = | 13,348
|
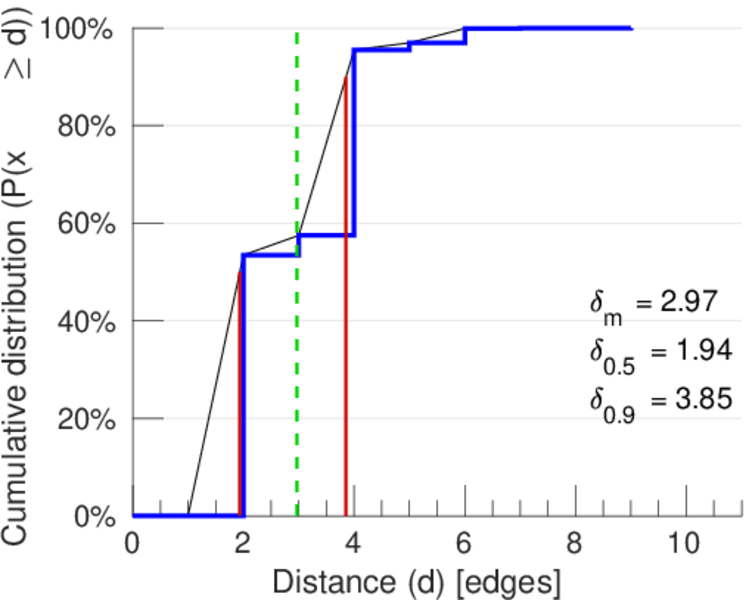
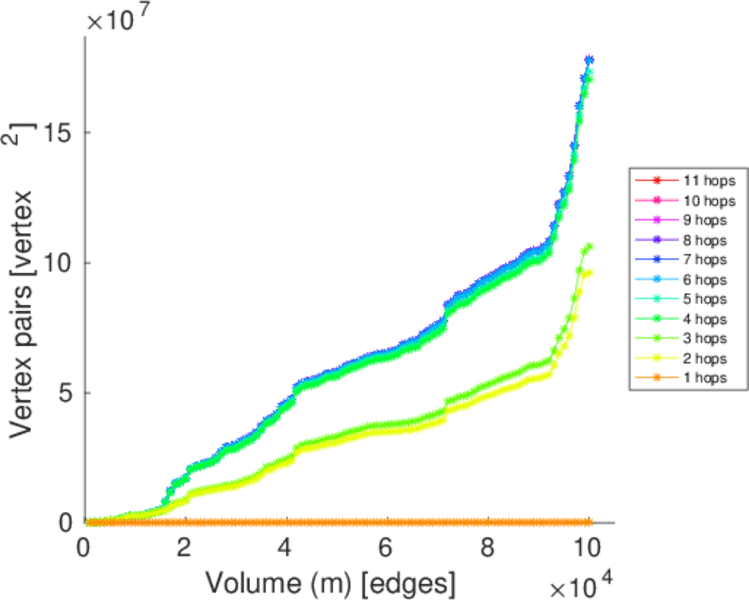
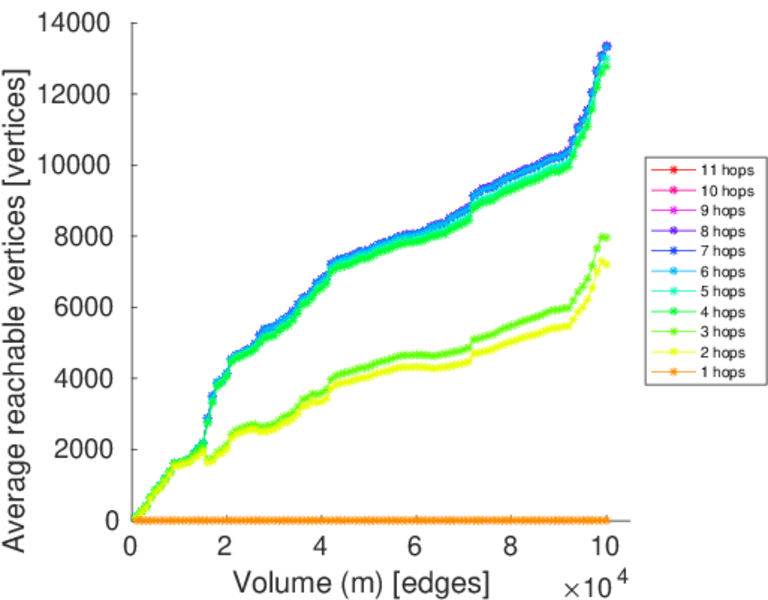
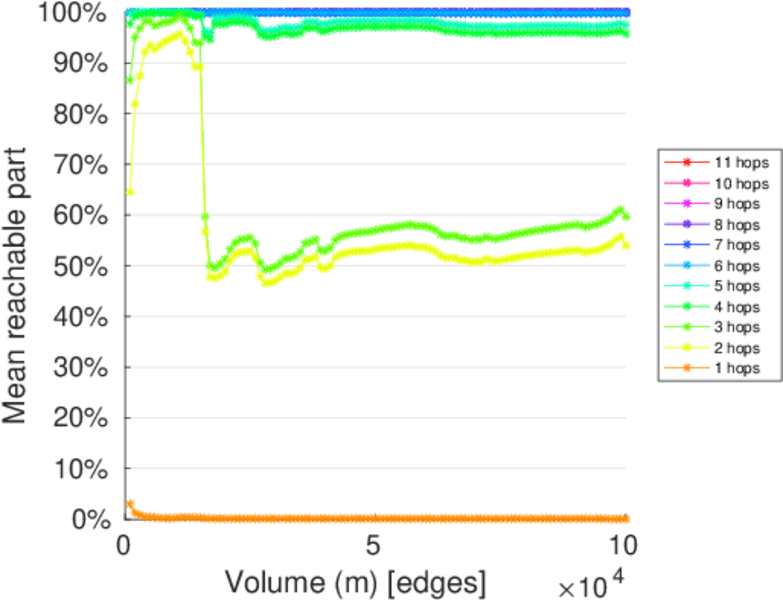
| Diameter | δ = | 11
|
| 50-Percentile effective diameter | δ0.5 = | 1.935 20
|
| 90-Percentile effective diameter | δ0.9 = | 3.854 73
|
| Median distance | δM = | 2
|
| Mean distance | δm = | 2.966 88
|
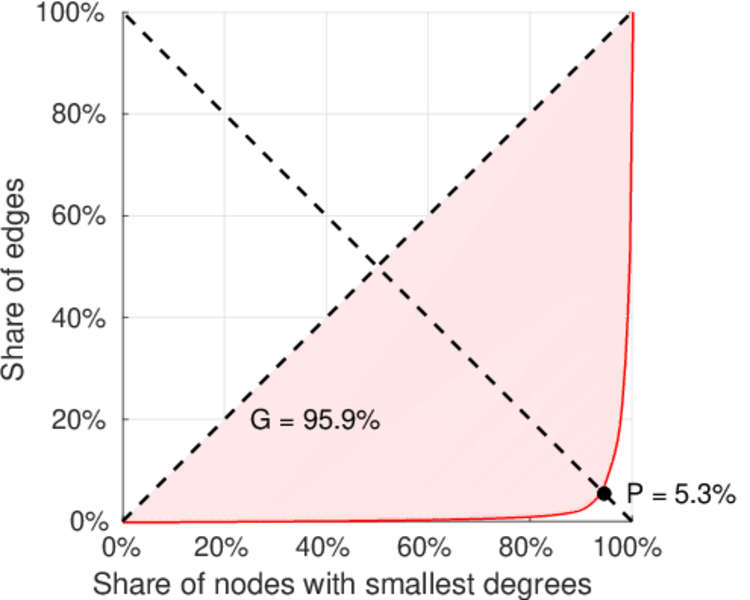
| Gini coefficient | G = | 0.845 712
|
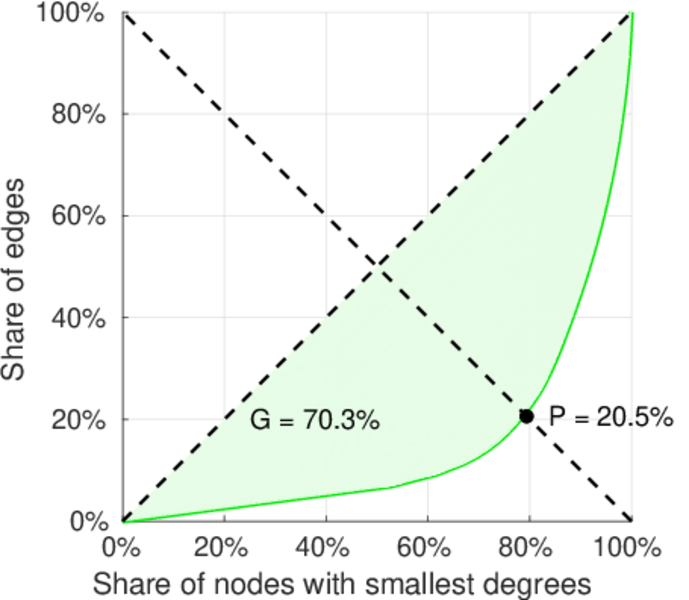
| Balanced inequality ratio | P = | 0.150 270
|
| Left balanced inequality ratio | P1 = | 0.052 707 9
|
| Right balanced inequality ratio | P2 = | 0.204 523
|
| Relative edge distribution entropy | Her = | 0.729 840
|
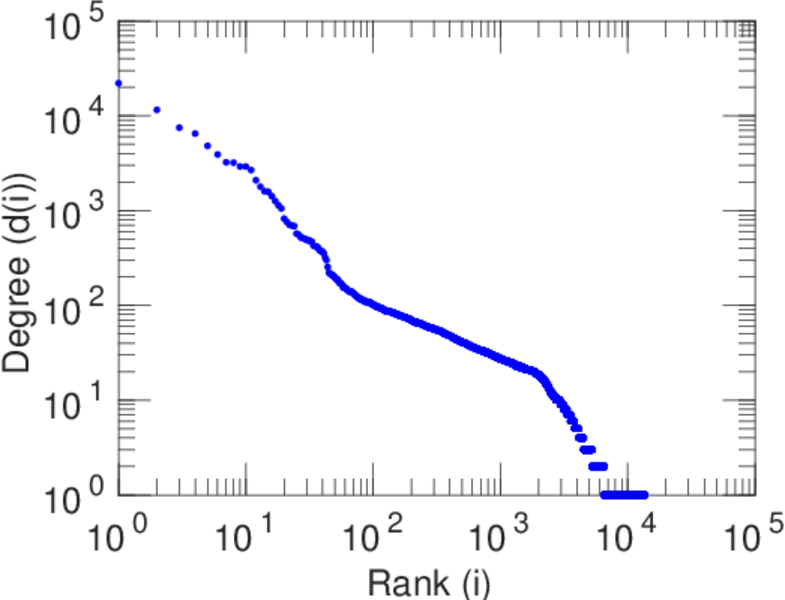
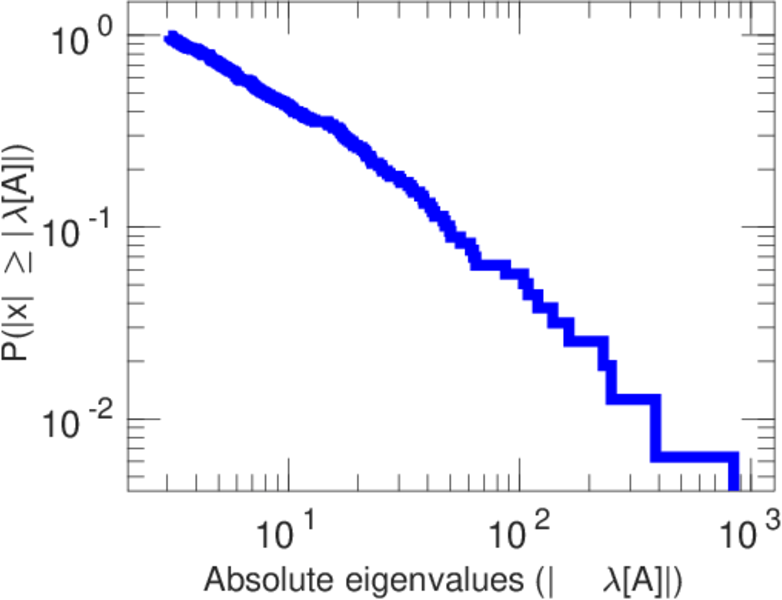
| Power law exponent | γ = | 2.371 97
|
| Tail power law exponent | γt = | 1.851 00
|
| Tail power law exponent with p | γ3 = | 1.851 00
|
| p-value | p = | 0.000 00
|
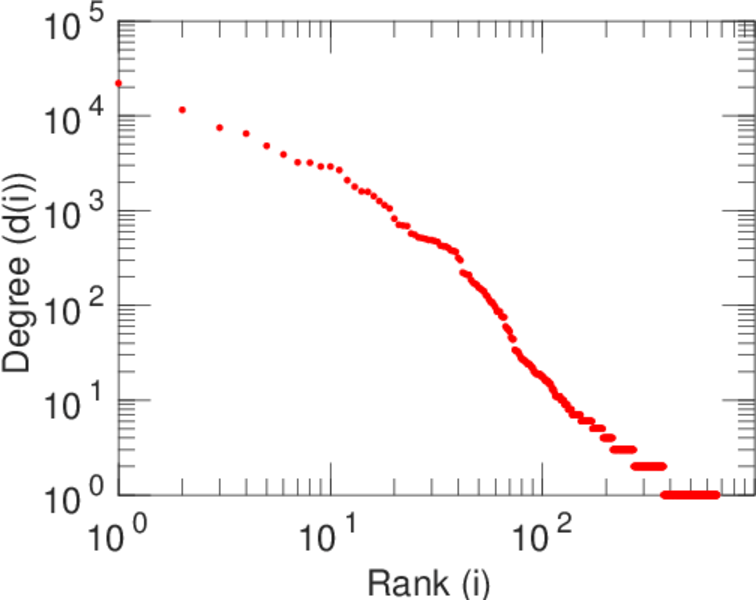
| Left tail power law exponent with p | γ3,1 = | 1.641 00
|
| Left p-value | p1 = | 0.000 00
|
| Right tail power law exponent with p | γ3,2 = | 4.741 00
|
| Right p-value | p2 = | 0.000 00
|
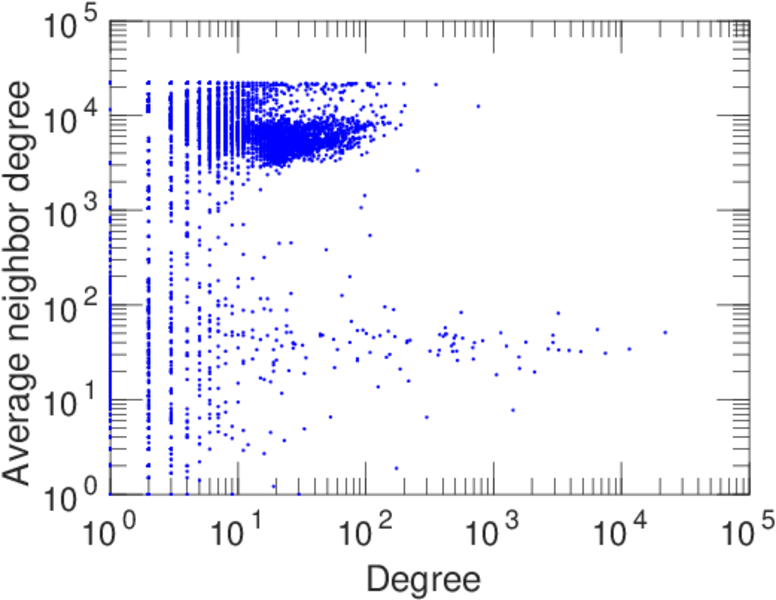
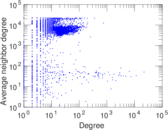
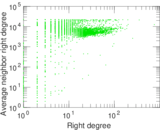
| Degree assortativity | ρ = | −0.460 524
|
| Degree assortativity p-value | pρ = | 0.000 00
|
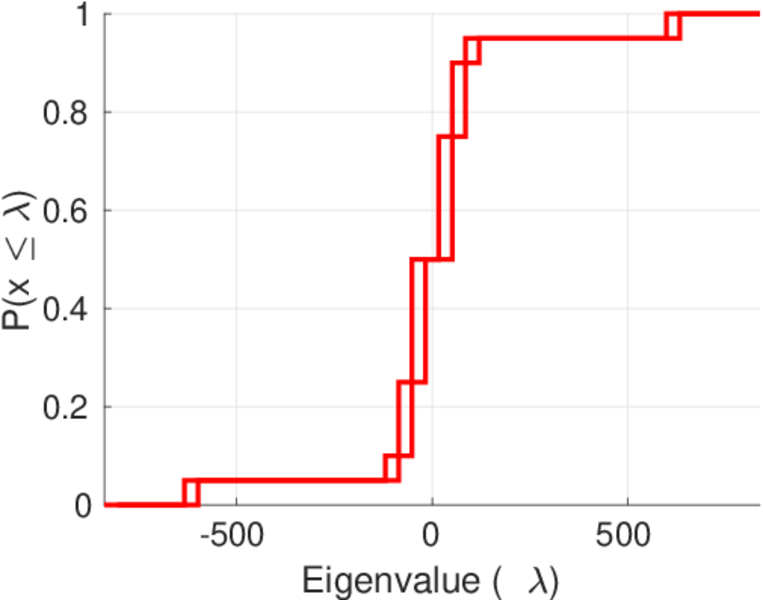
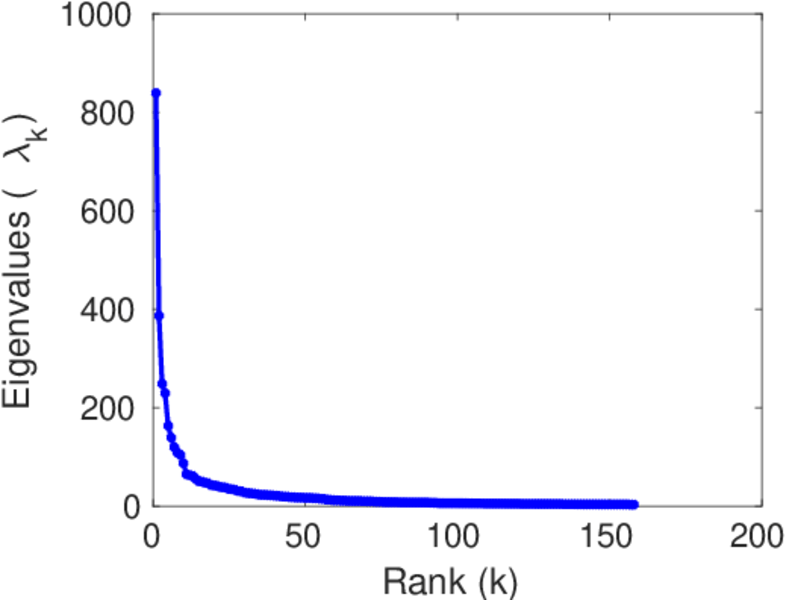
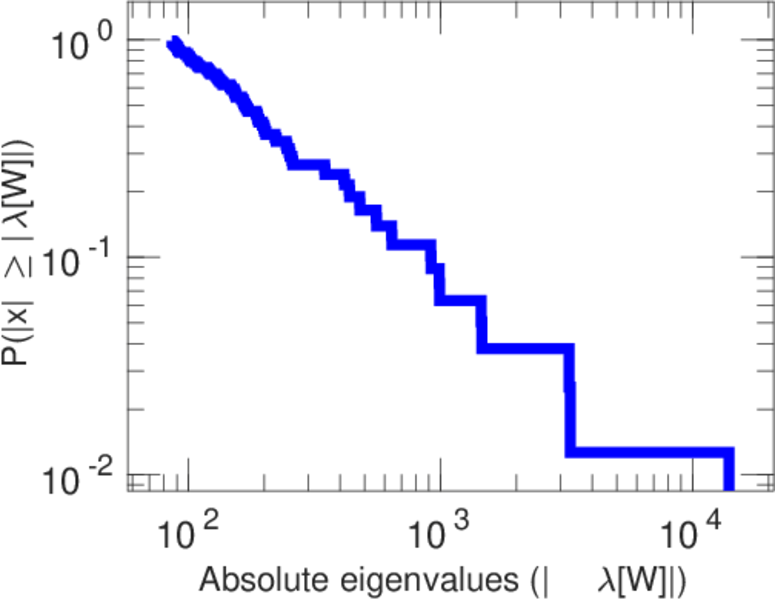
| Spectral norm | α = | 839.044
|
| Algebraic connectivity | a = | 0.024 875 7
|
| Spectral separation | |λ1[A] / λ2[A]| = | 2.172 12
|
| Controllability | C = | 12,510
|
| Relative controllability | Cr = | 0.912 872
|
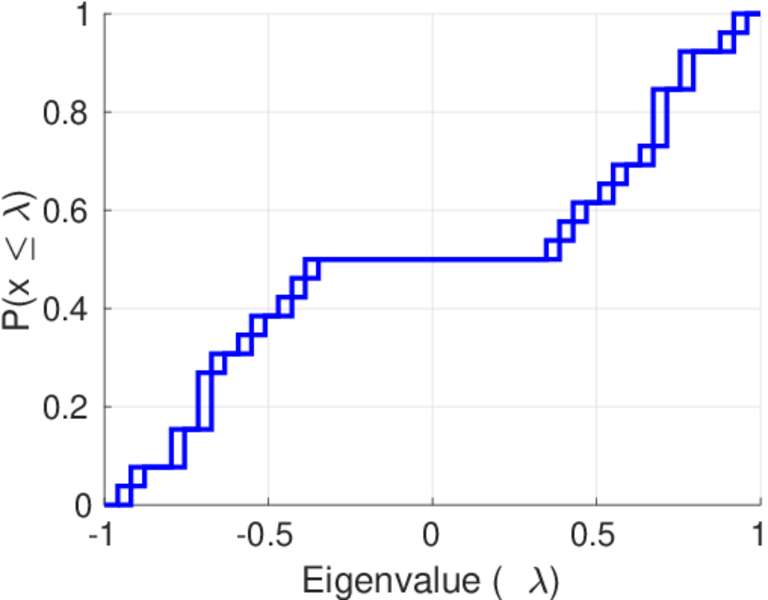
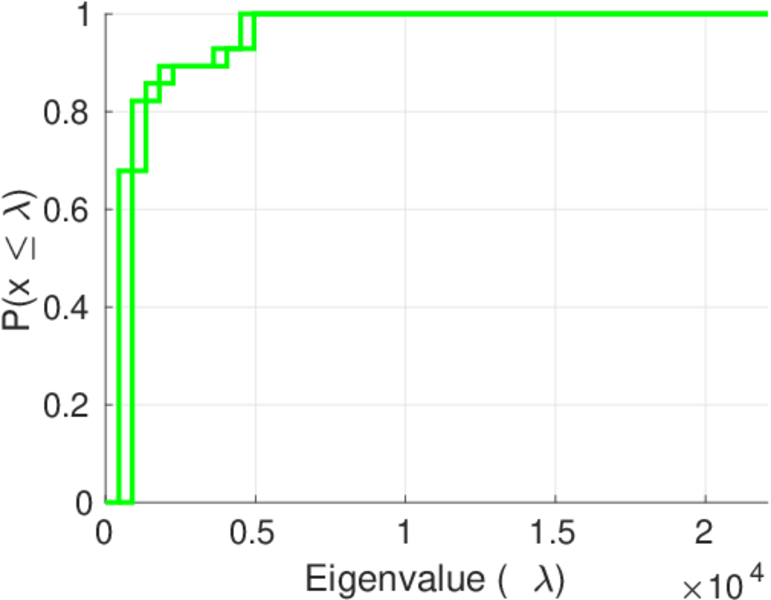
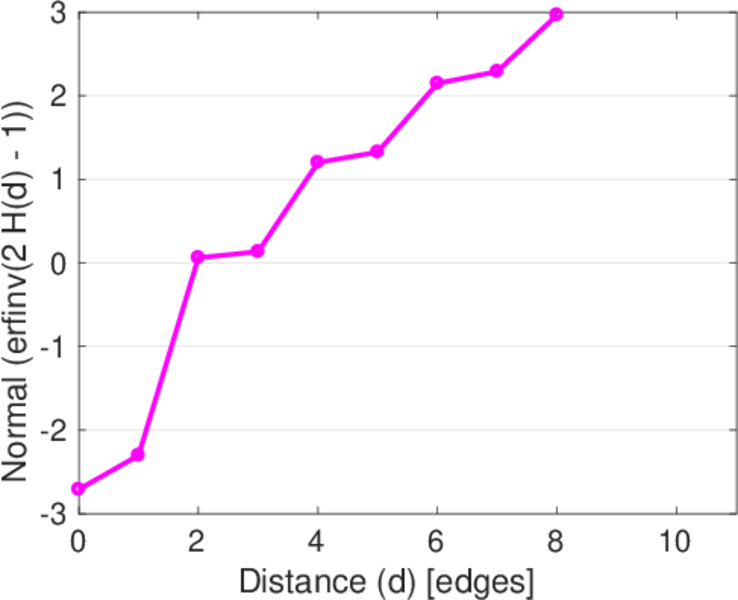
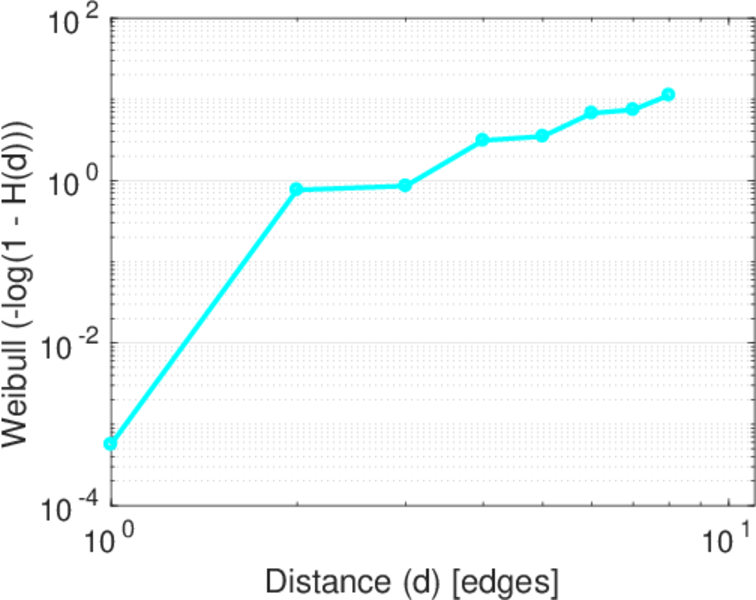
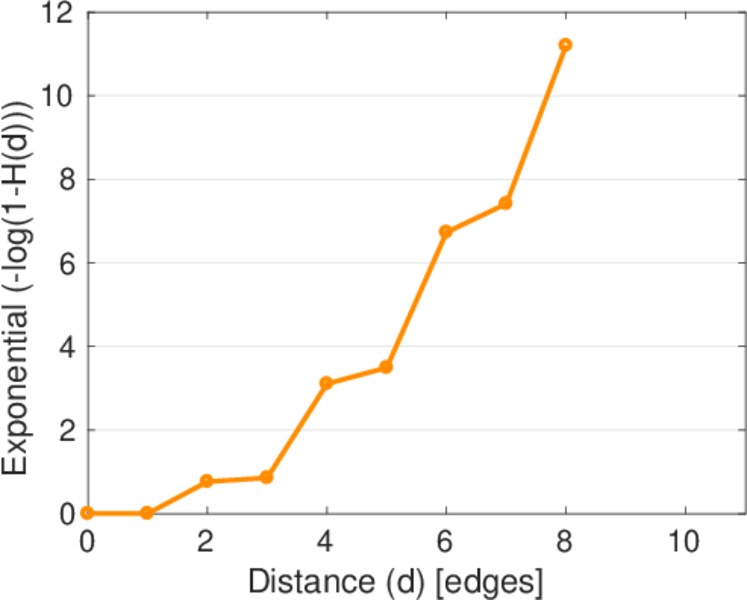
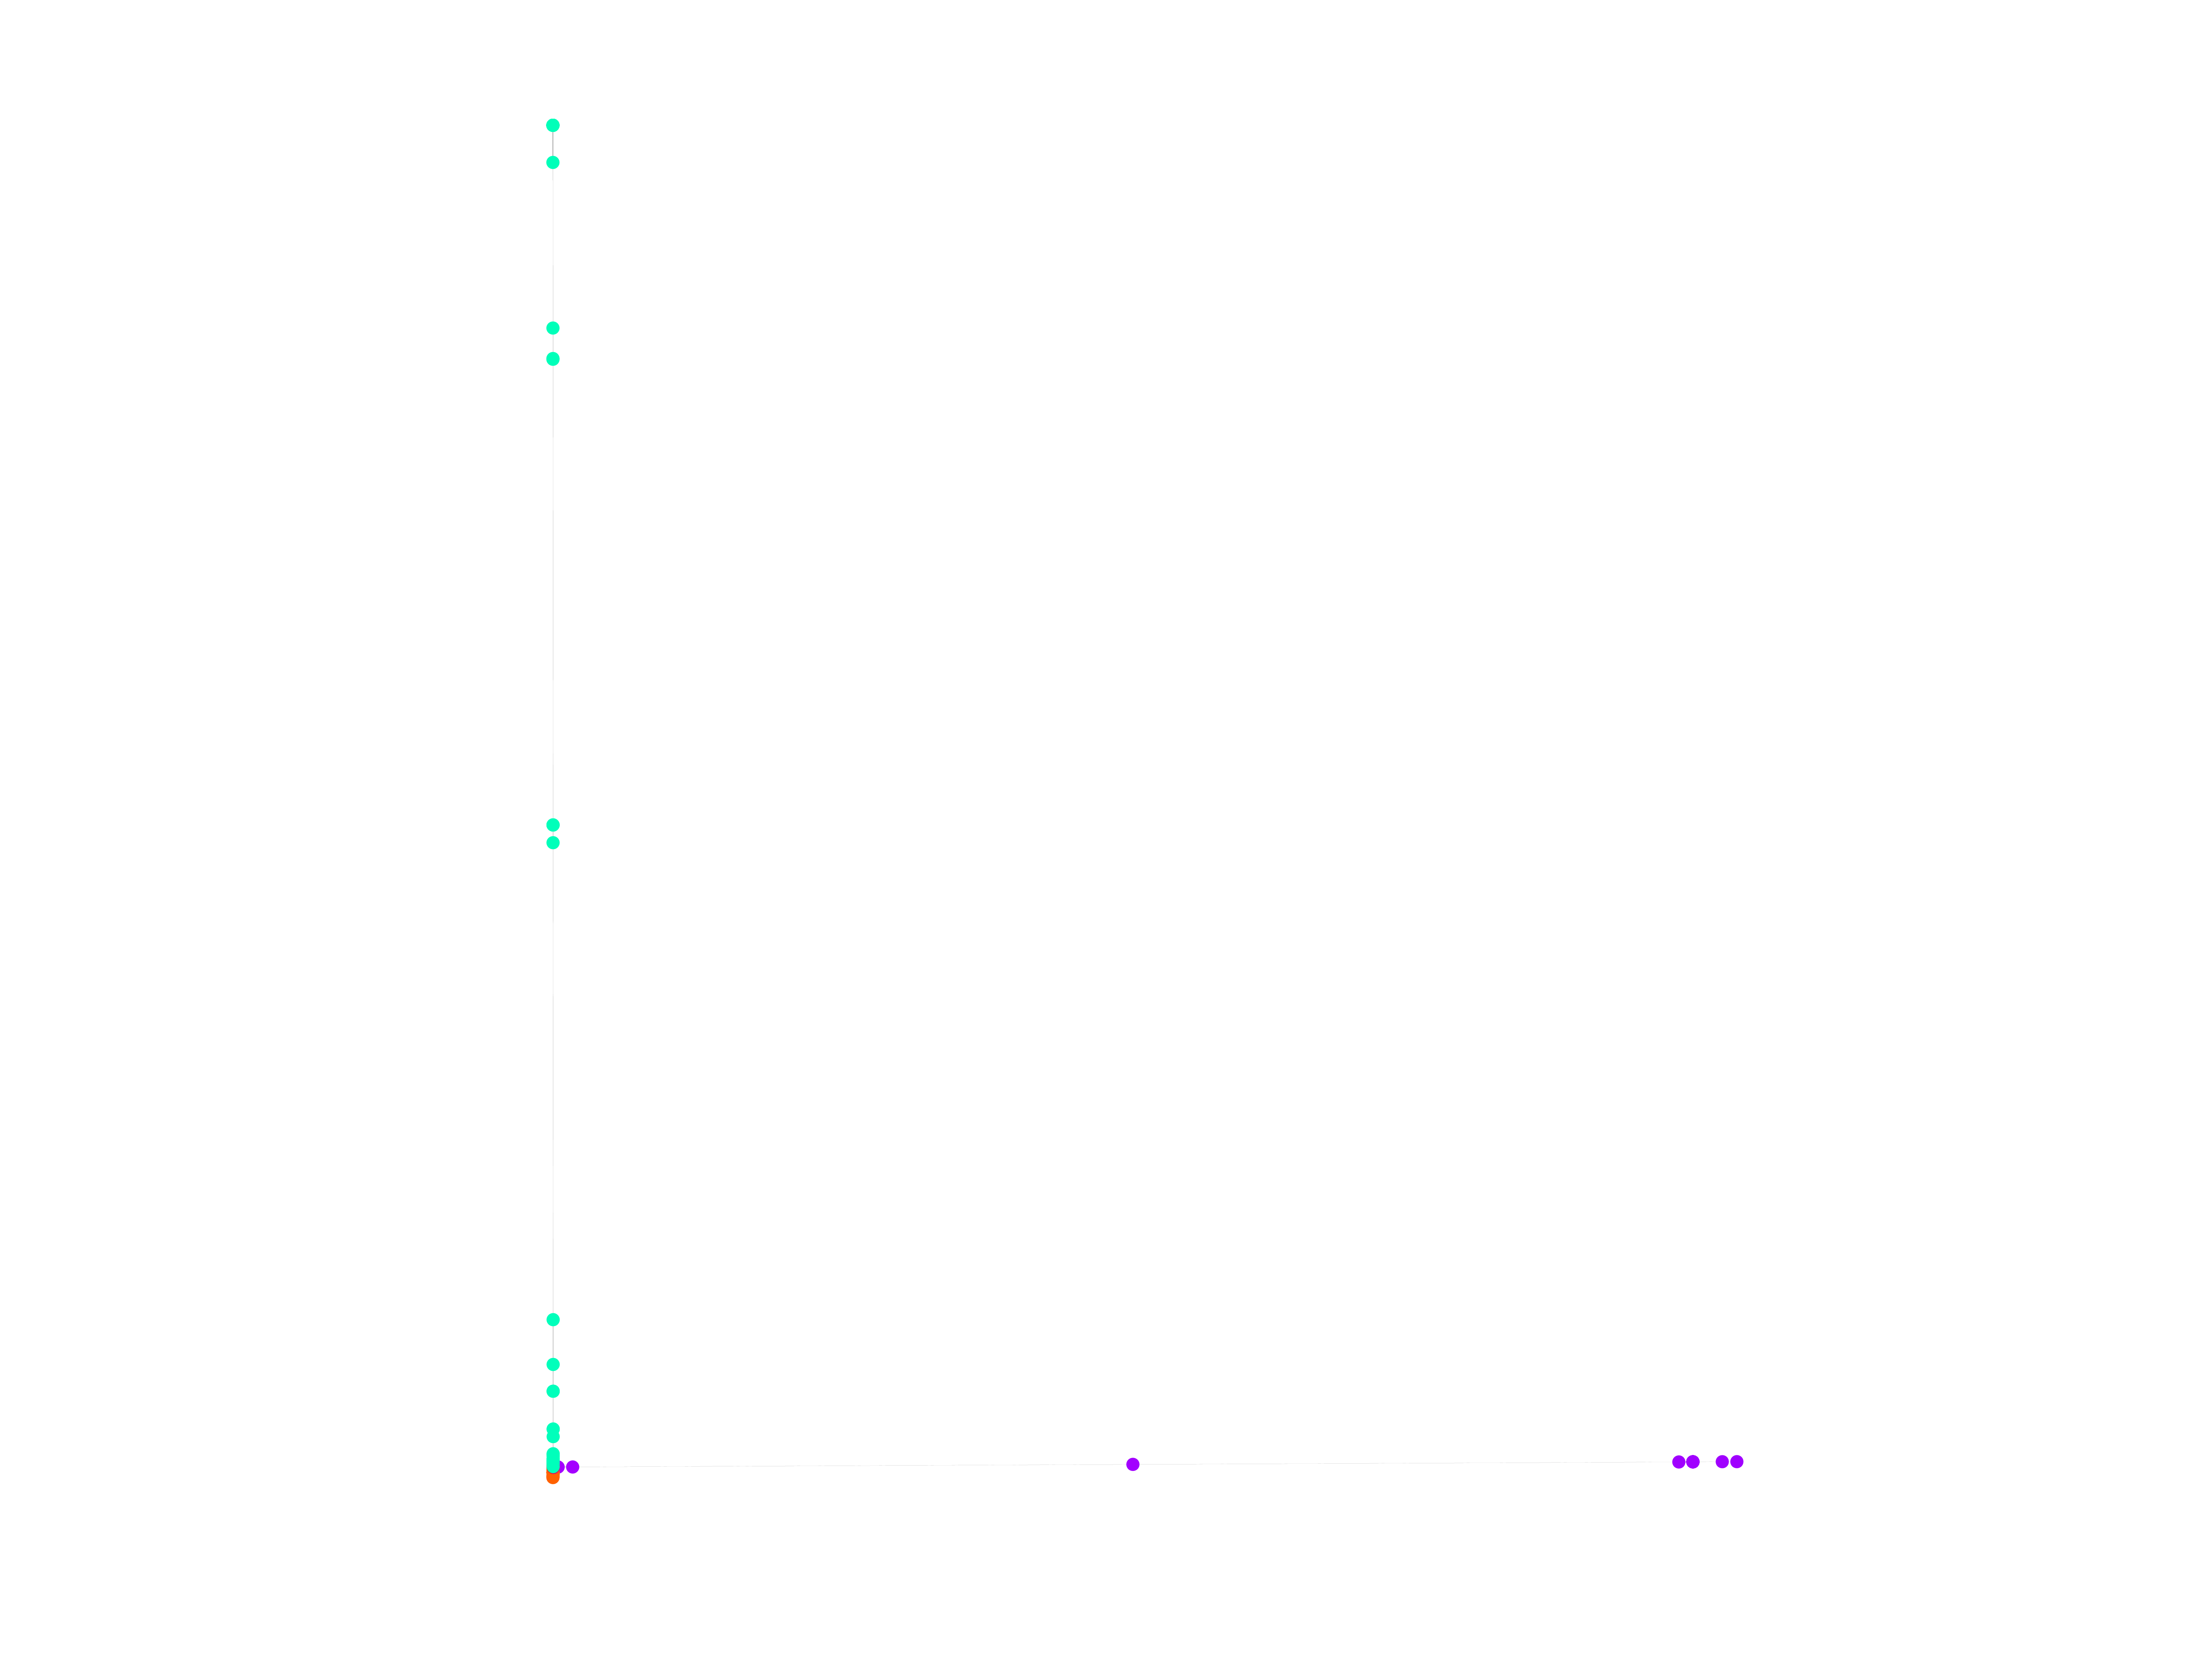
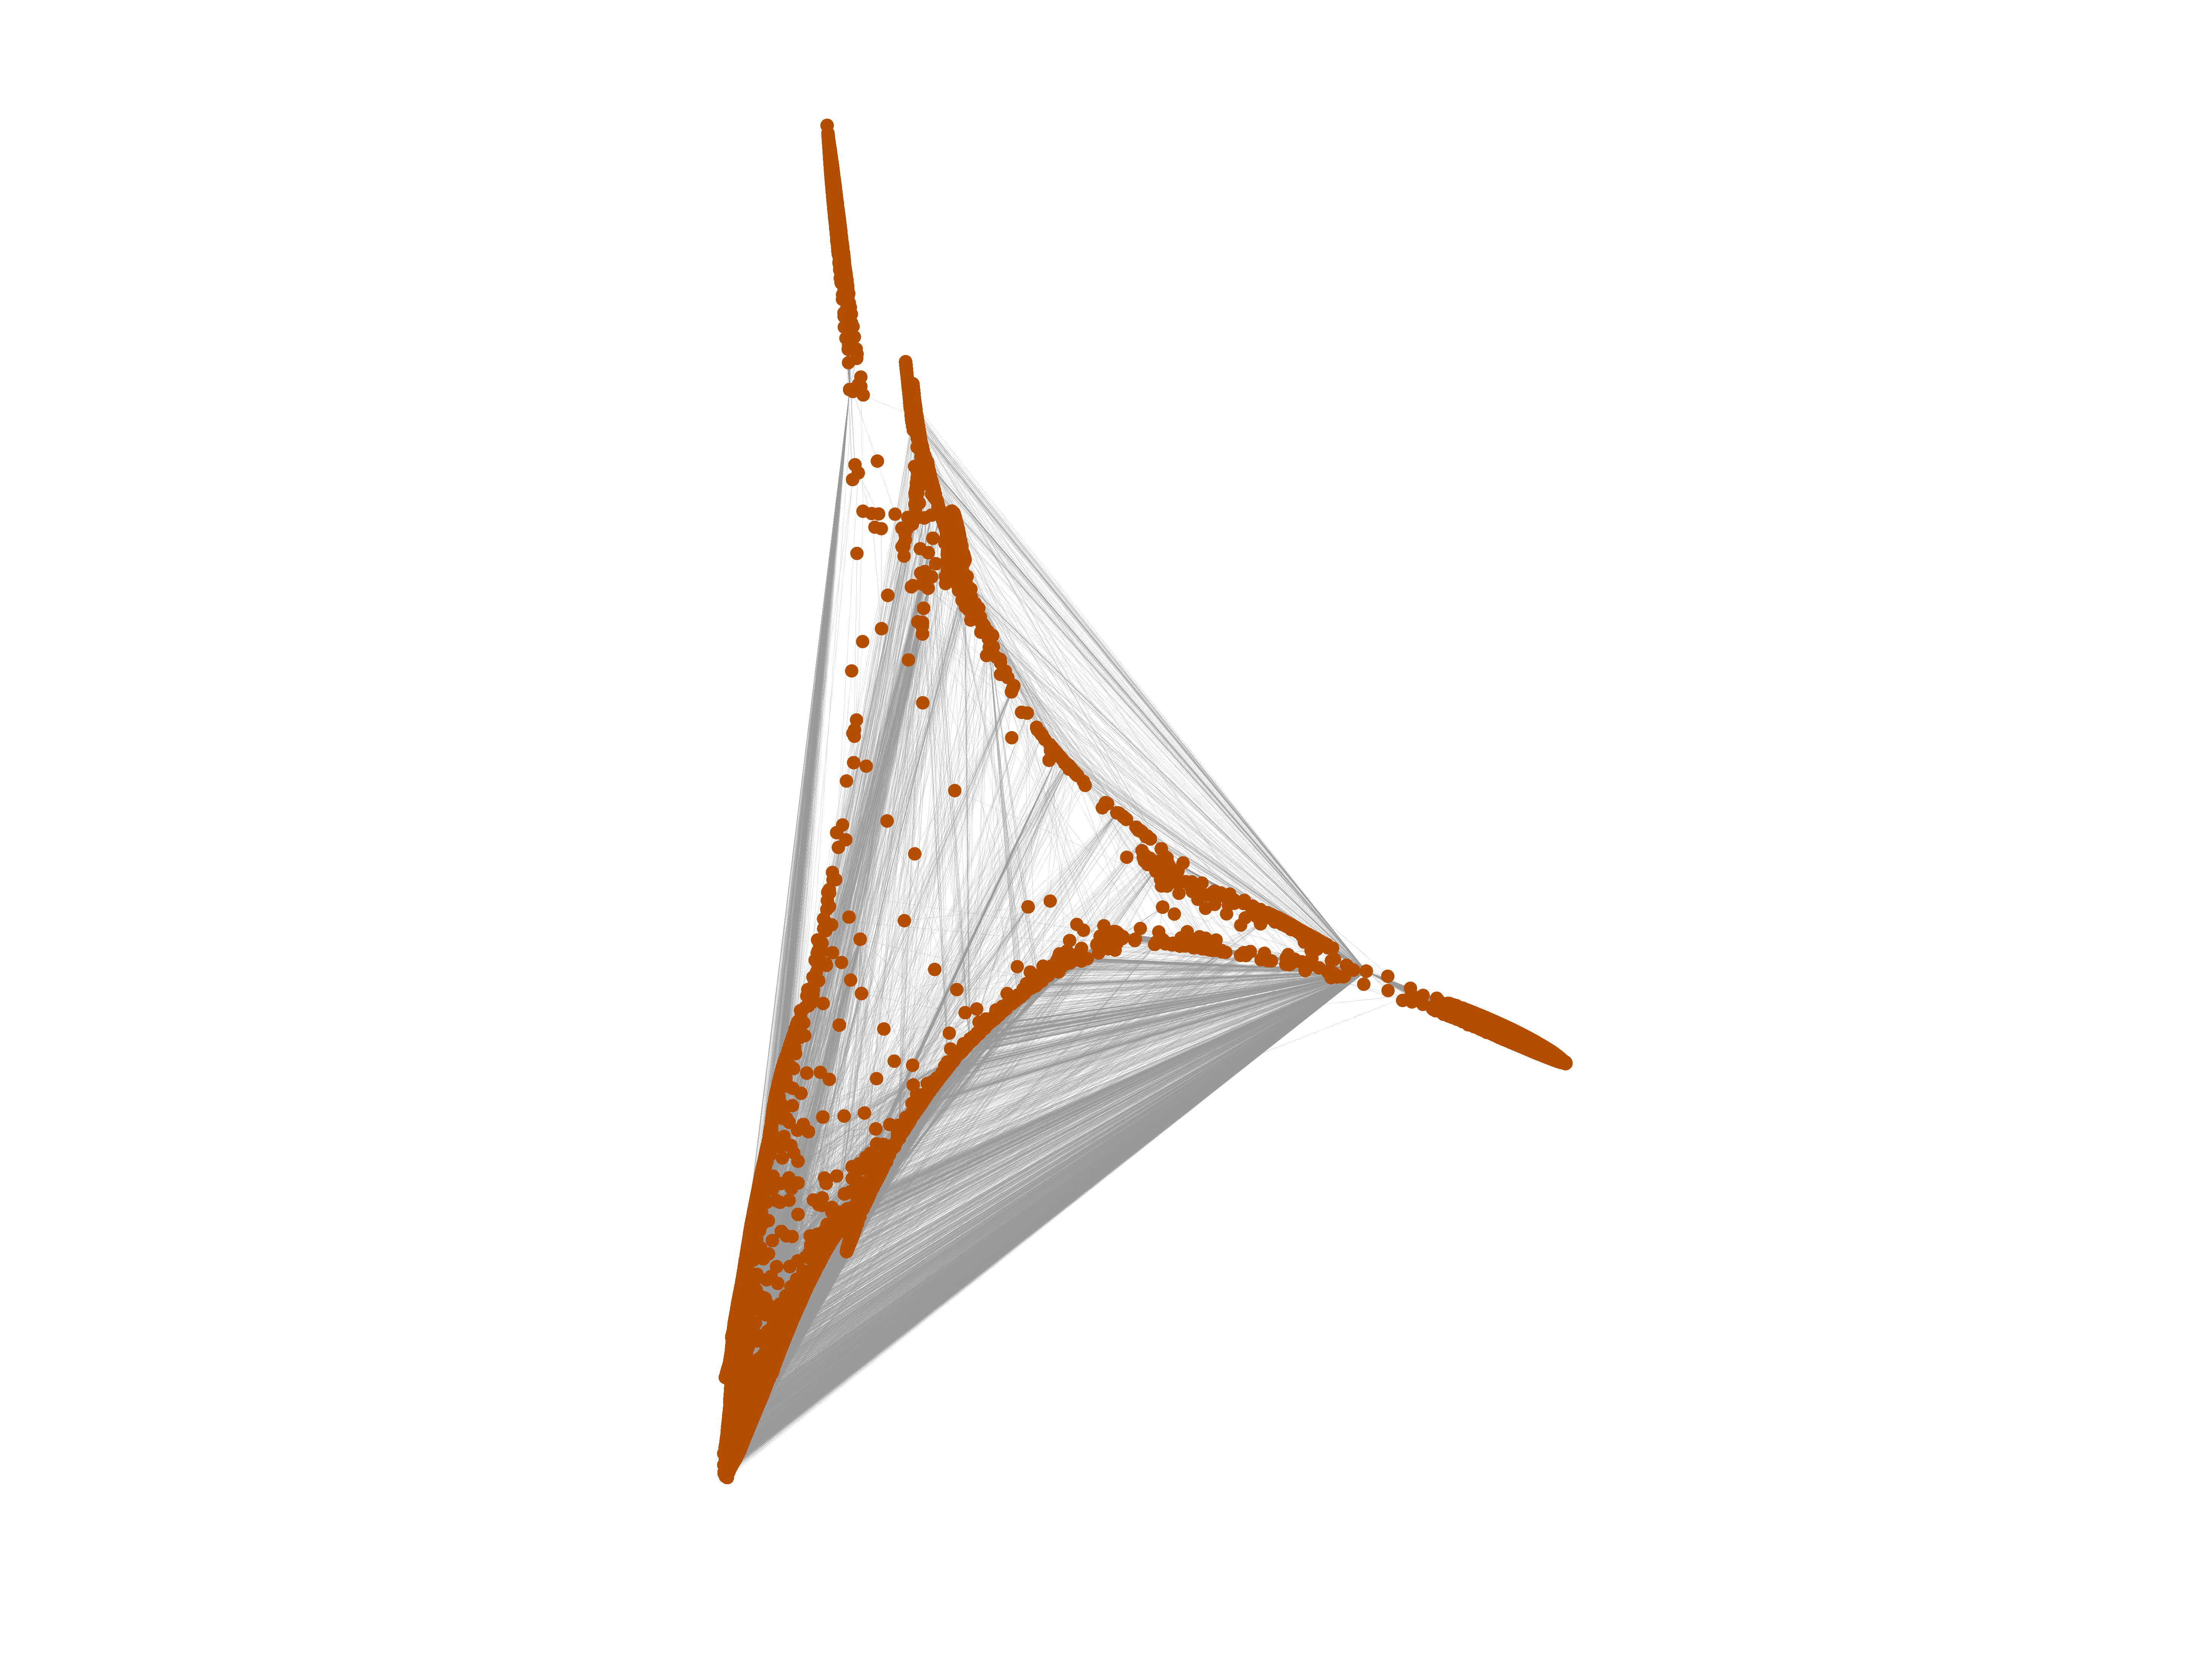
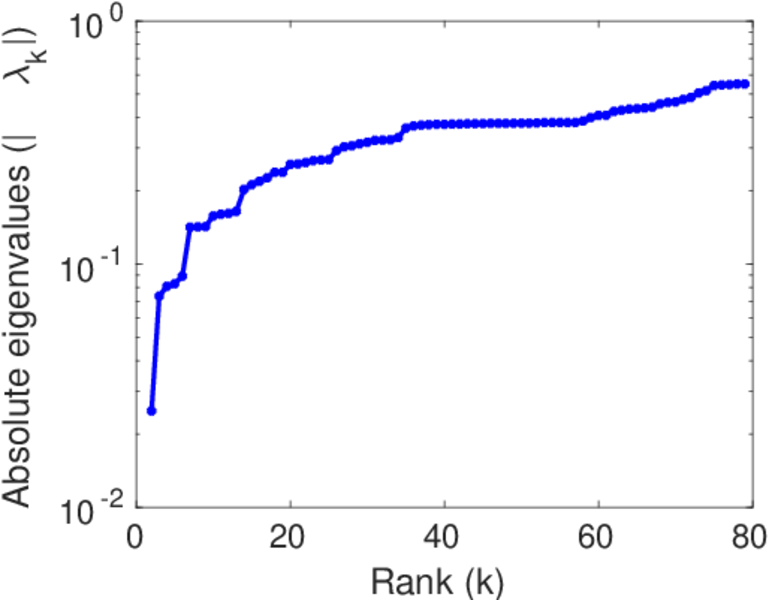
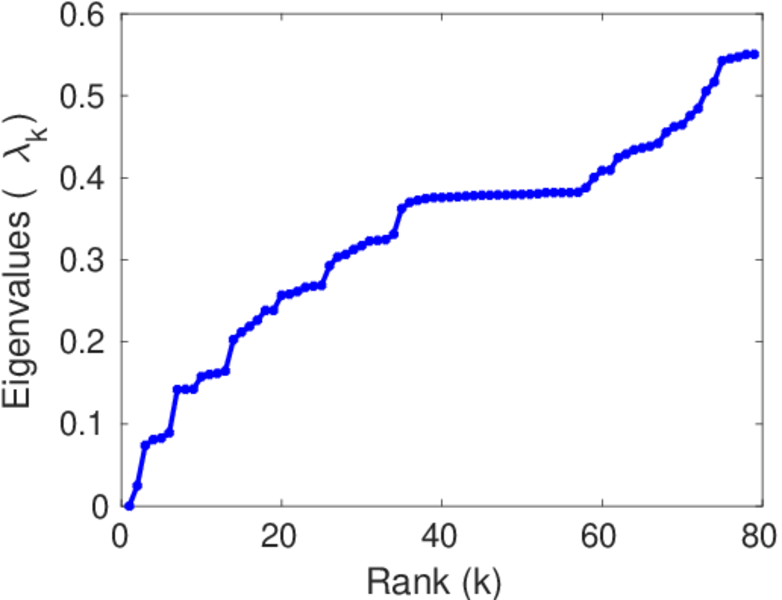
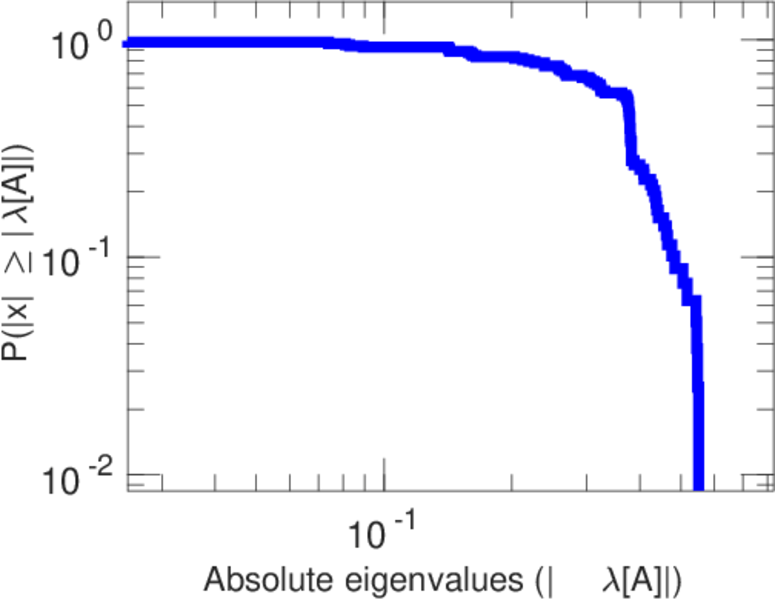
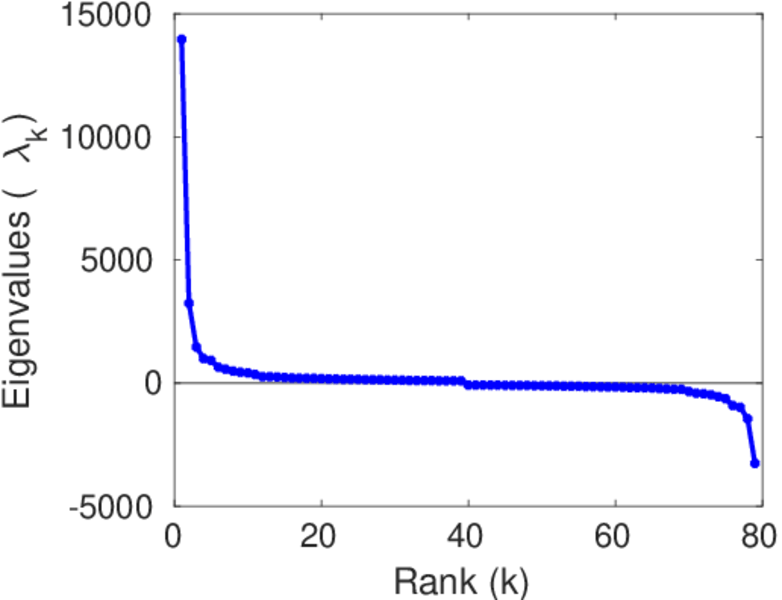
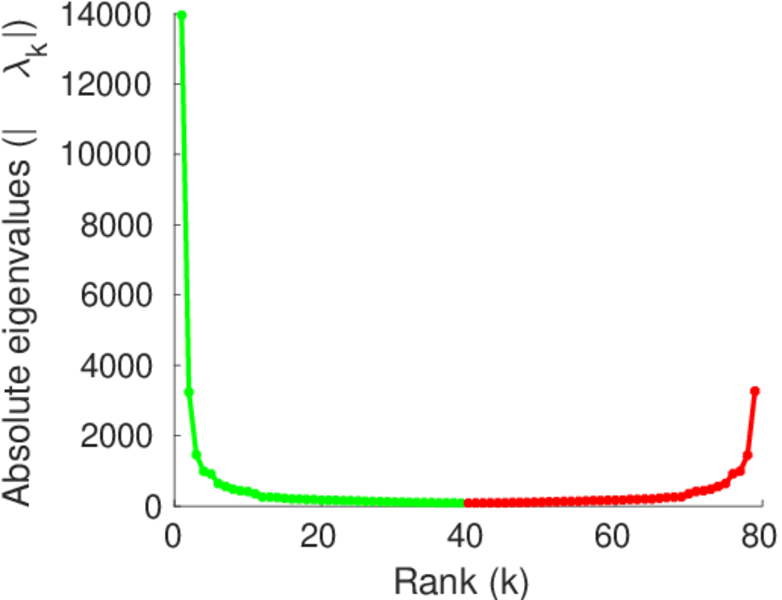
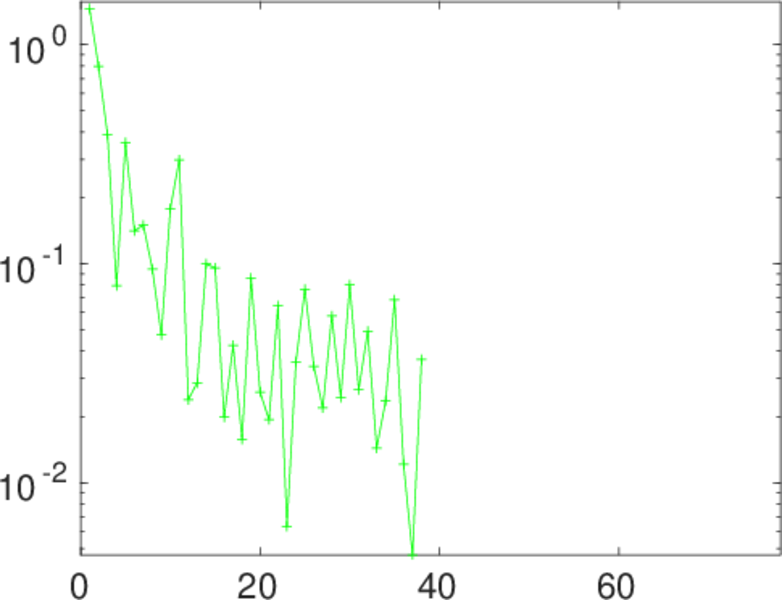
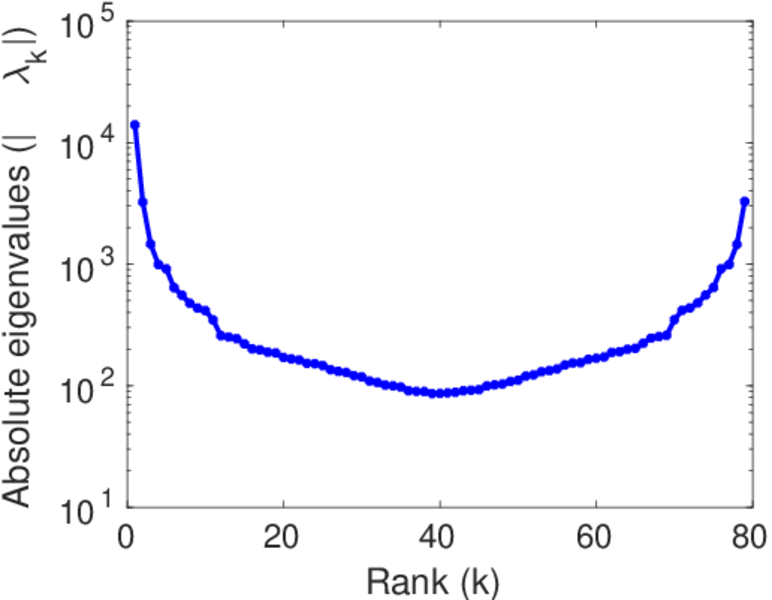
Plots


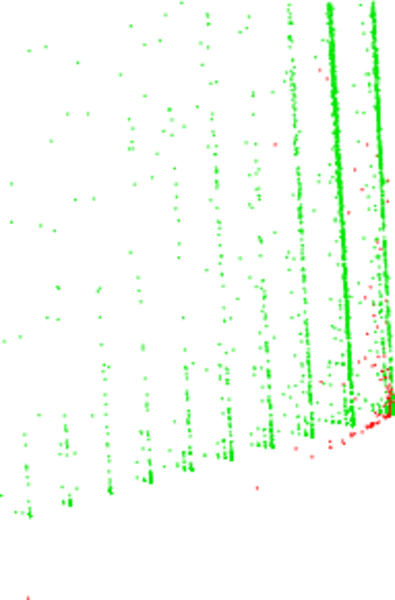
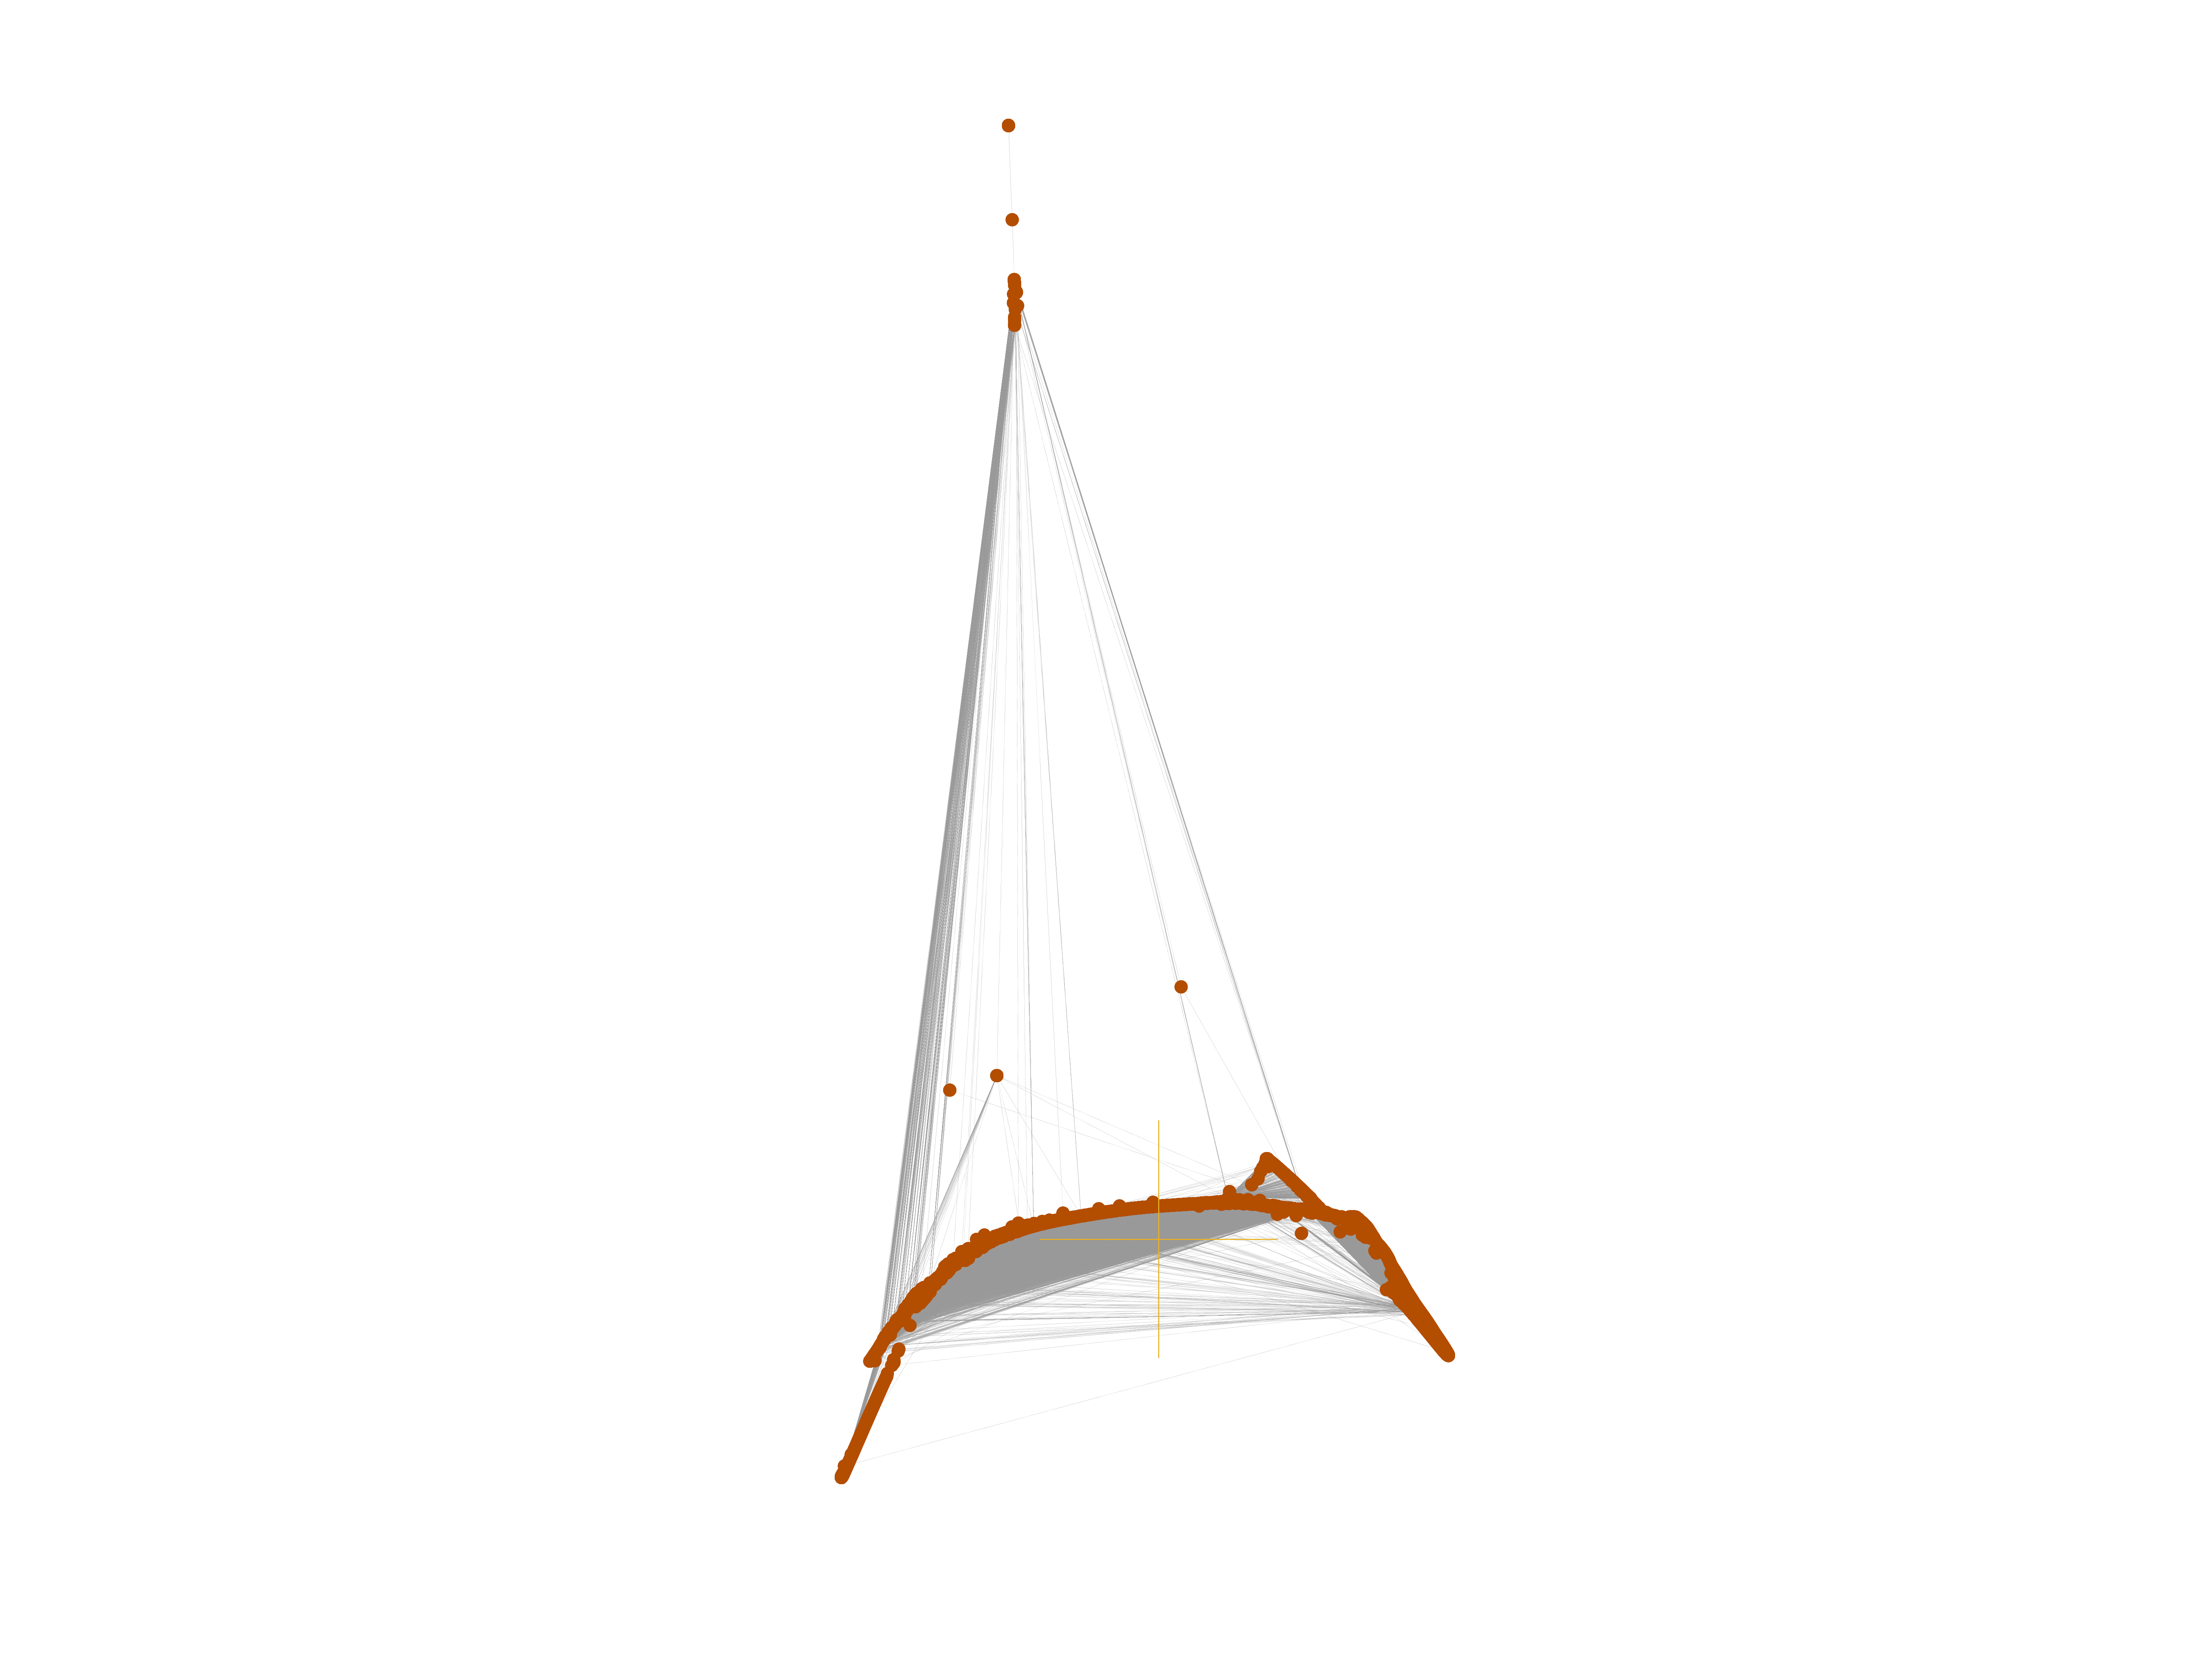
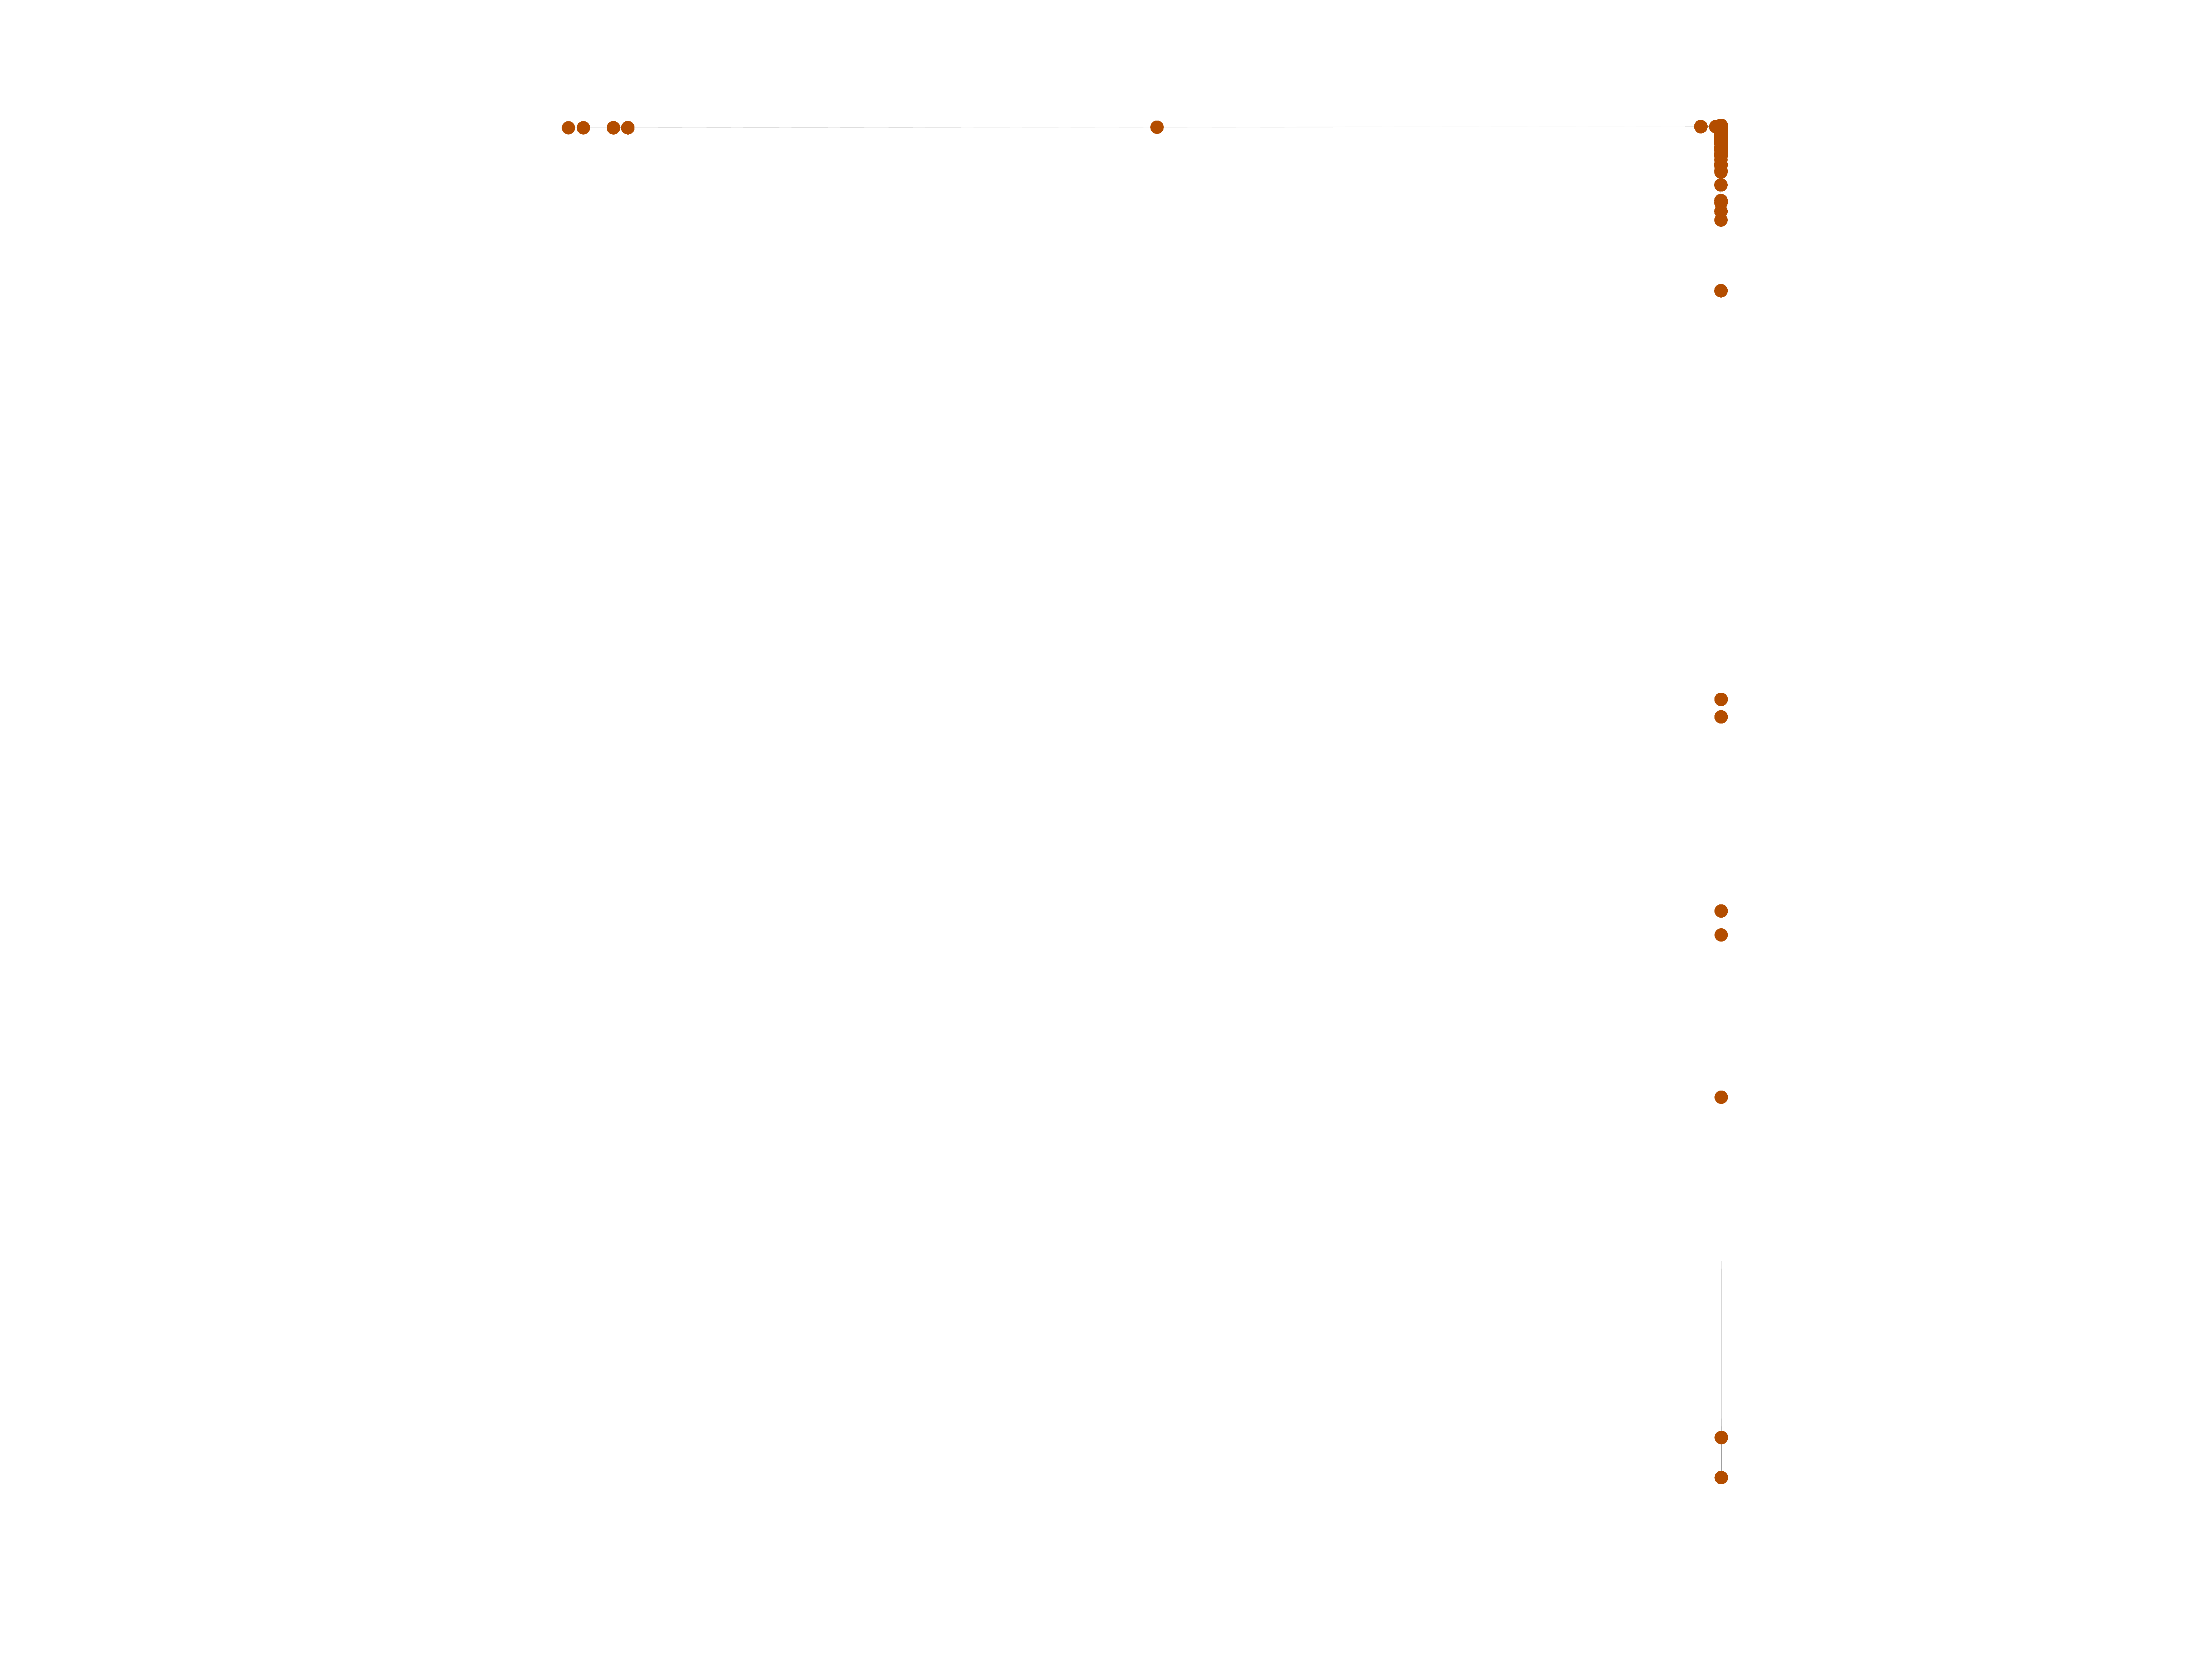
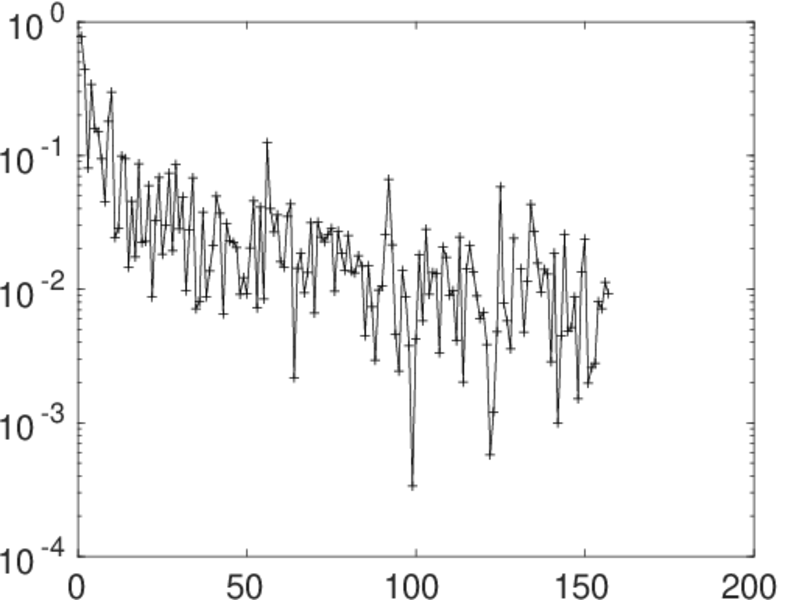
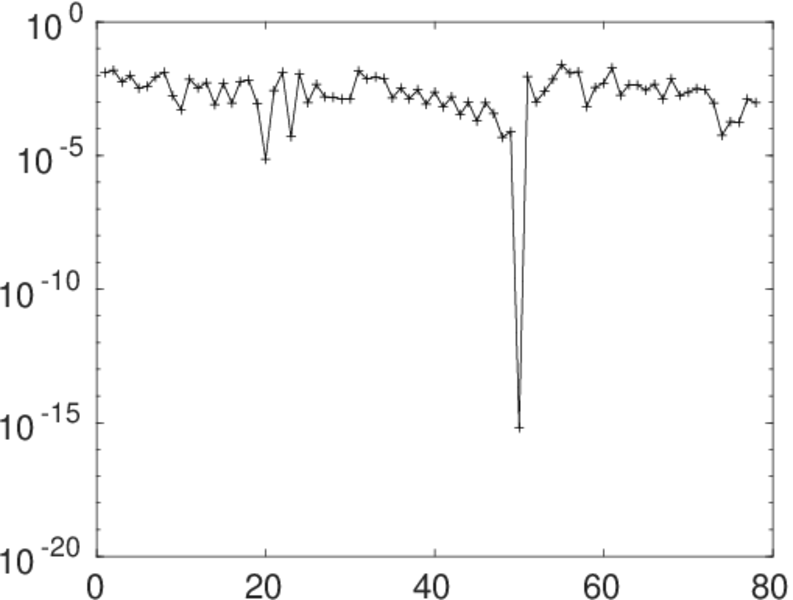
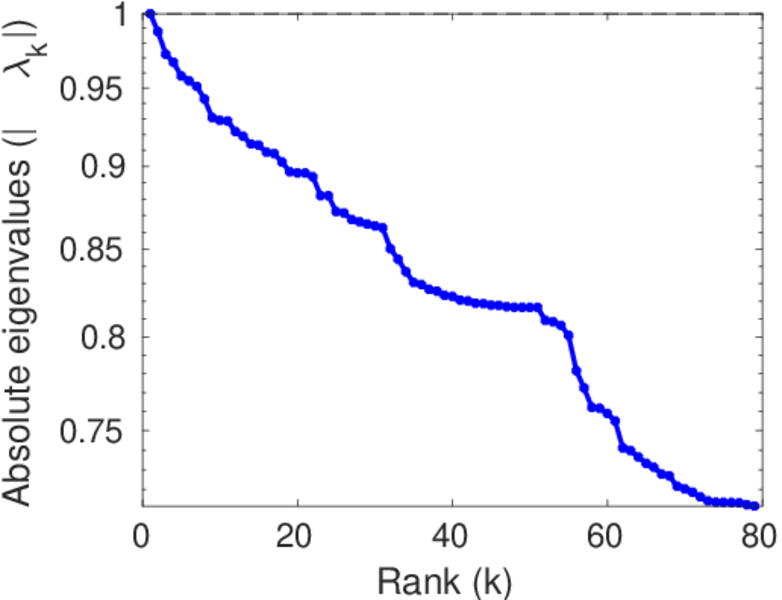
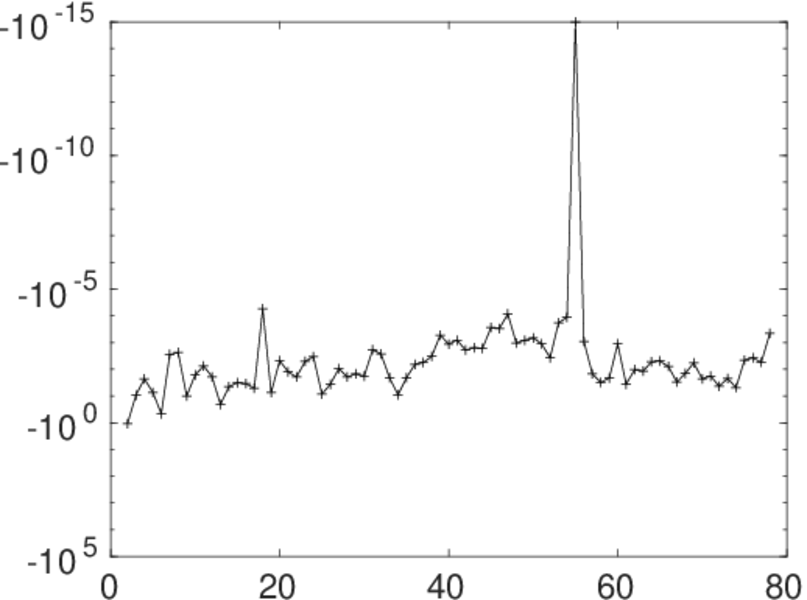
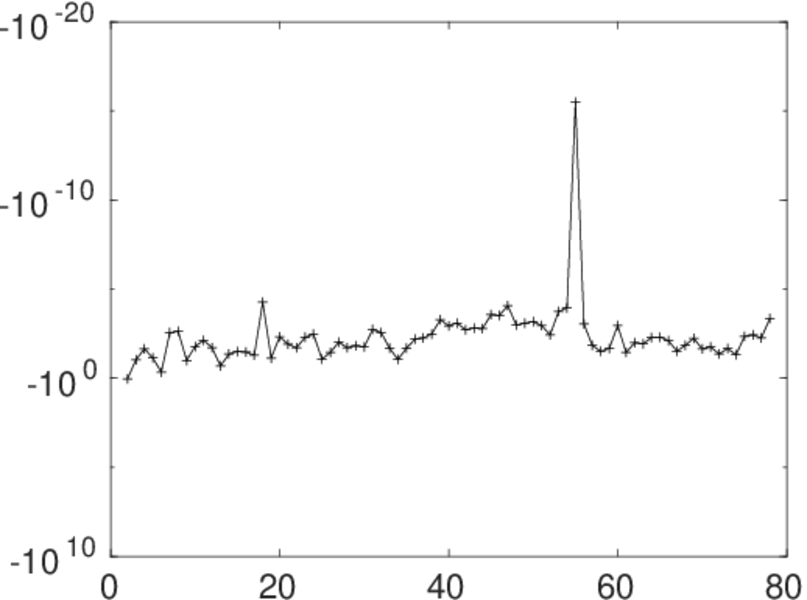
Matrix decompositions plots


Downloads
References
|
[1]
|
Jérôme Kunegis.
KONECT – The Koblenz Network Collection.
In Proc. Int. Conf. on World Wide Web Companion, pages
1343–1350, 2013.
[ http ]
|
|
[2]
|
Wikimedia Foundation.
Wikimedia downloads.
http://dumps.wikimedia.org/, January 2010.
|
 KONECT ‣ Networks ‣
Buy Me a Coffee
KONECT ‣ Networks ‣
Buy Me a Coffee