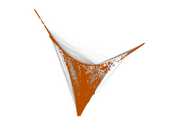
Wikipedia edits (ksh)
This is the bipartite edit network of the Colognian Wikipedia. It contains
users and pages from the Colognian Wikipedia, connected by edit events. Each
edge represents an edit. The dataset includes the timestamp of each edit.
Metadata
Statistics
| Size | n = | 11,673
|
| Left size | n1 = | 1,410
|
| Right size | n2 = | 10,263
|
| Volume | m = | 161,147
|
| Unique edge count | m̿ = | 60,910
|
| Wedge count | s = | 54,856,687
|
| Claw count | z = | 61,154,924,562
|
| Cross count | x = | 70,303,801,448,860
|
| Square count | q = | 146,947,923
|
| 4-Tour count | T4 = | 1,395,163,204
|
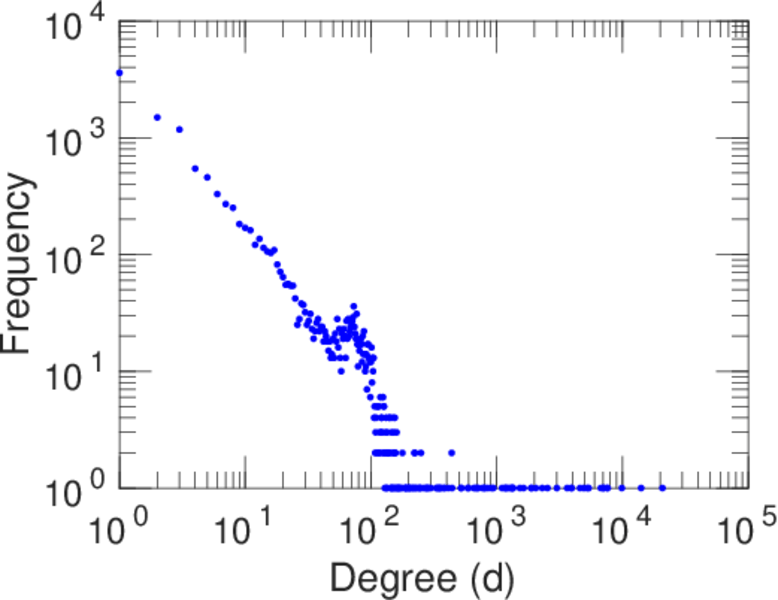
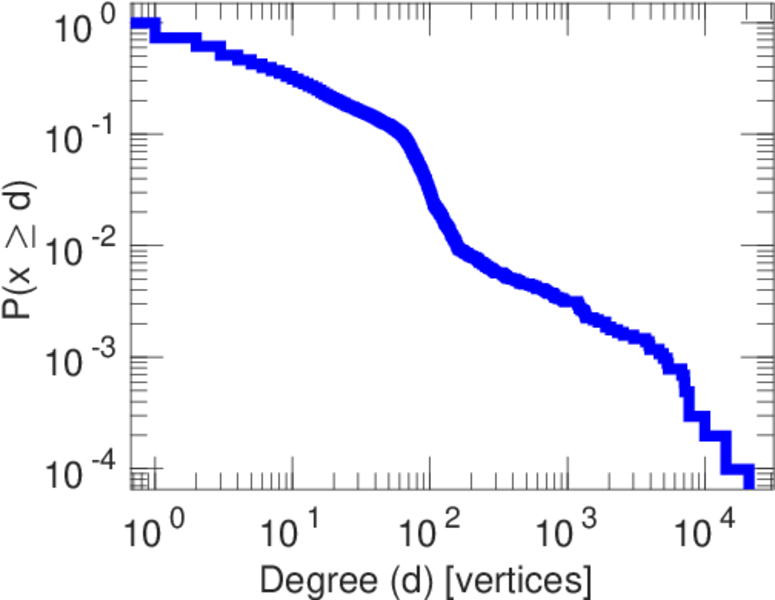
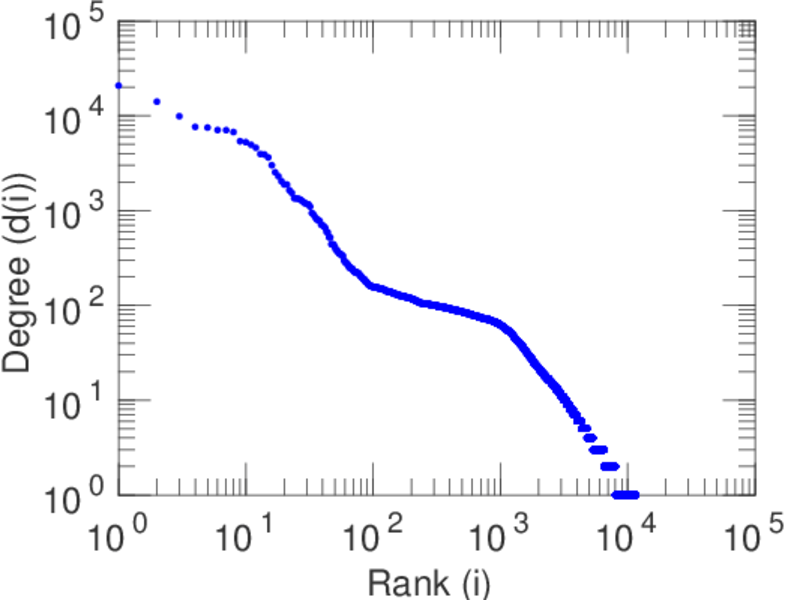
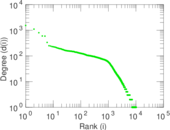
| Maximum degree | dmax = | 20,833
|
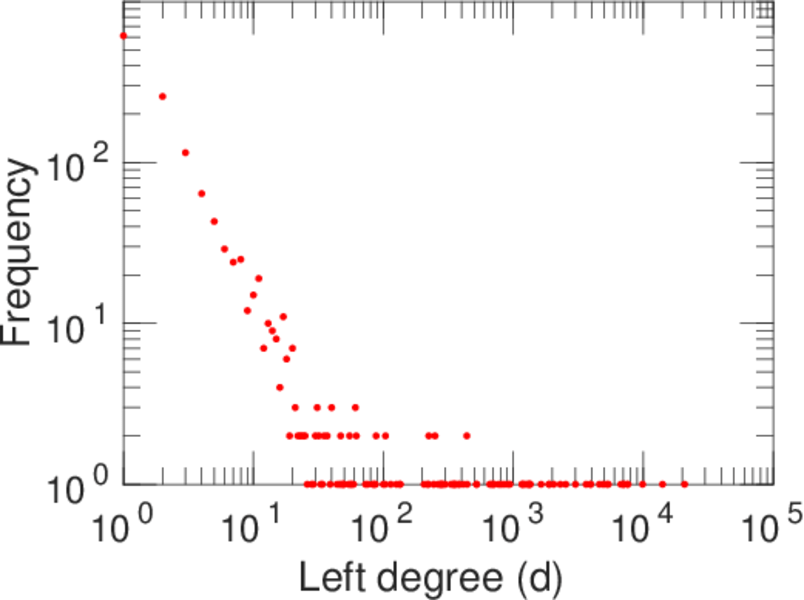
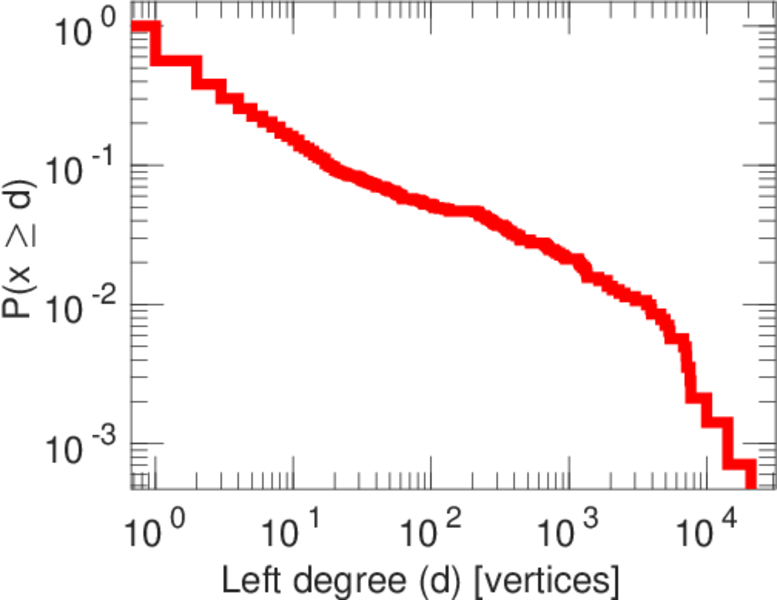
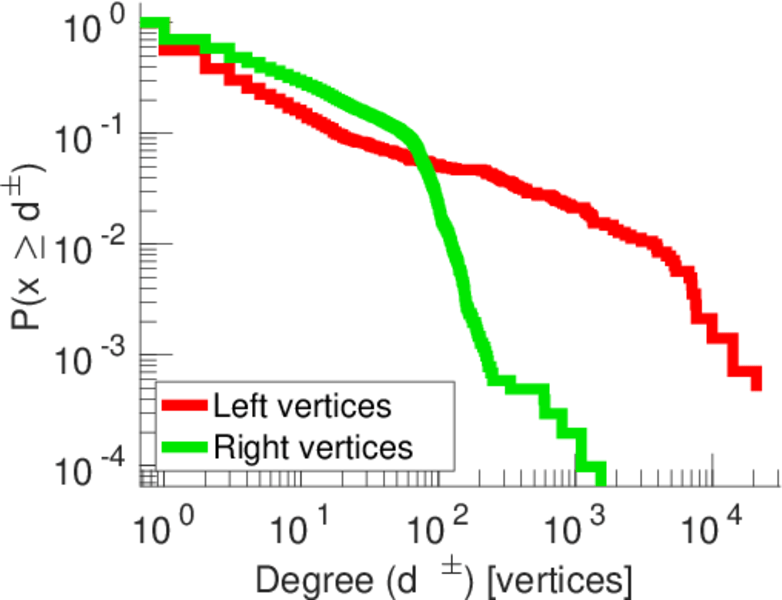
| Maximum left degree | d1max = | 20,833
|
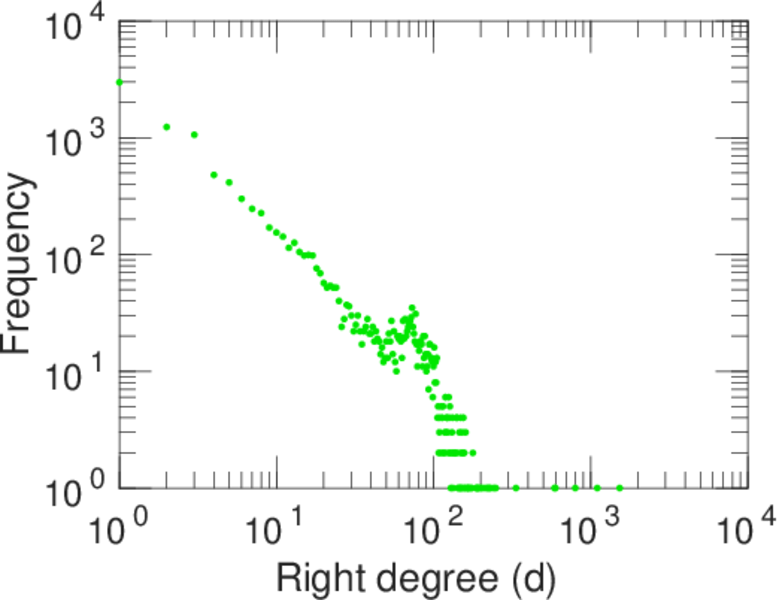
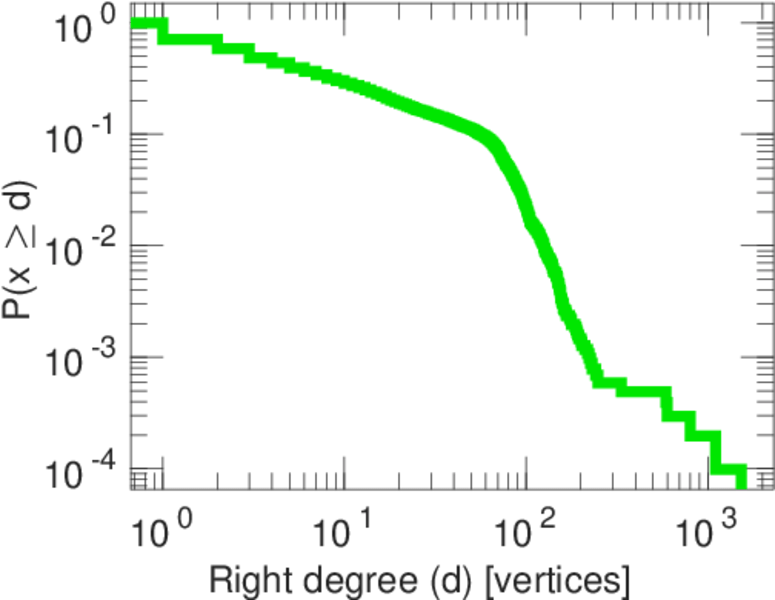
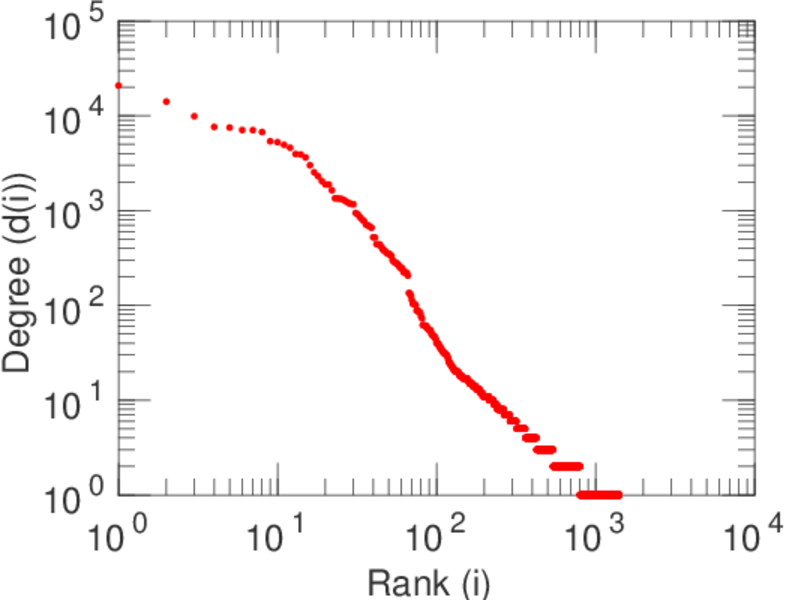
| Maximum right degree | d2max = | 1,532
|
| Average degree | d = | 27.610 2
|
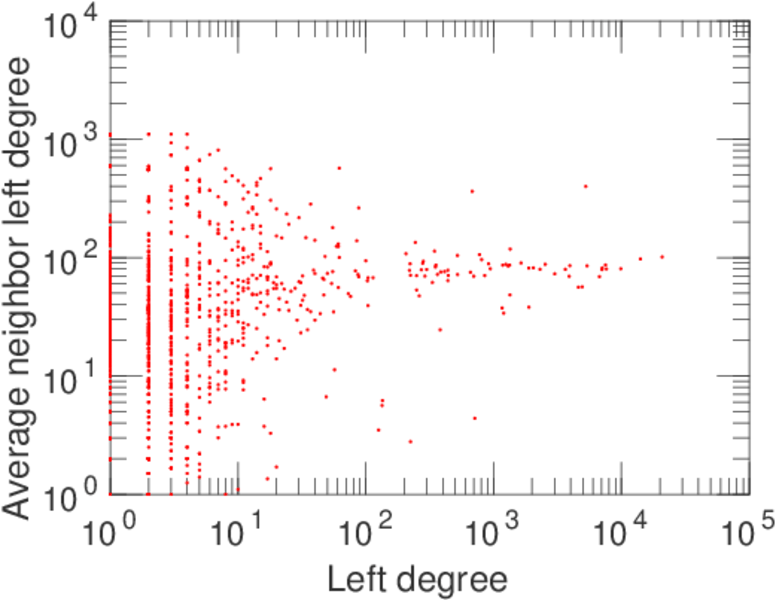
| Average left degree | d1 = | 114.289
|
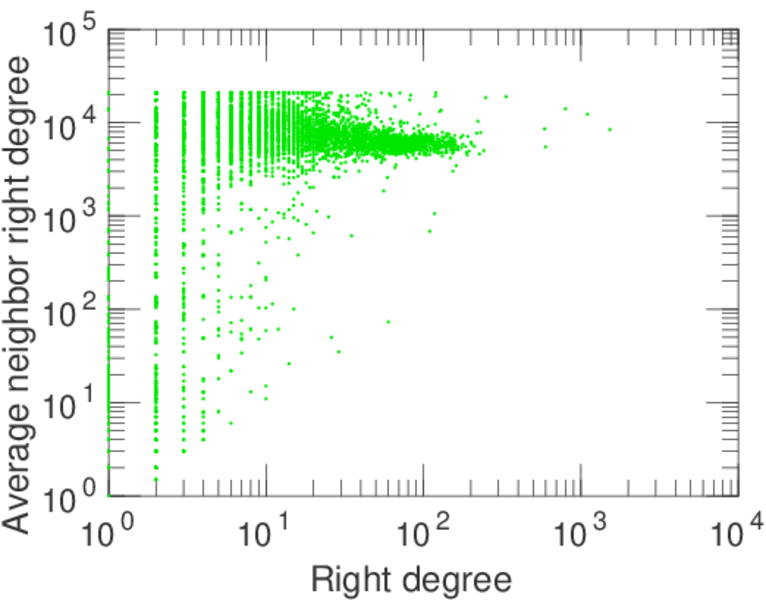
| Average right degree | d2 = | 15.701 7
|
| Fill | p = | 0.004 209 16
|
| Average edge multiplicity | m̃ = | 2.645 66
|
| Size of LCC | N = | 11,013
|
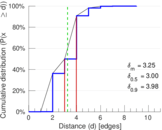
| Diameter | δ = | 11
|
| 50-Percentile effective diameter | δ0.5 = | 3.001 07
|
| 90-Percentile effective diameter | δ0.9 = | 3.979 05
|
| Median distance | δM = | 4
|
| Mean distance | δm = | 3.248 14
|
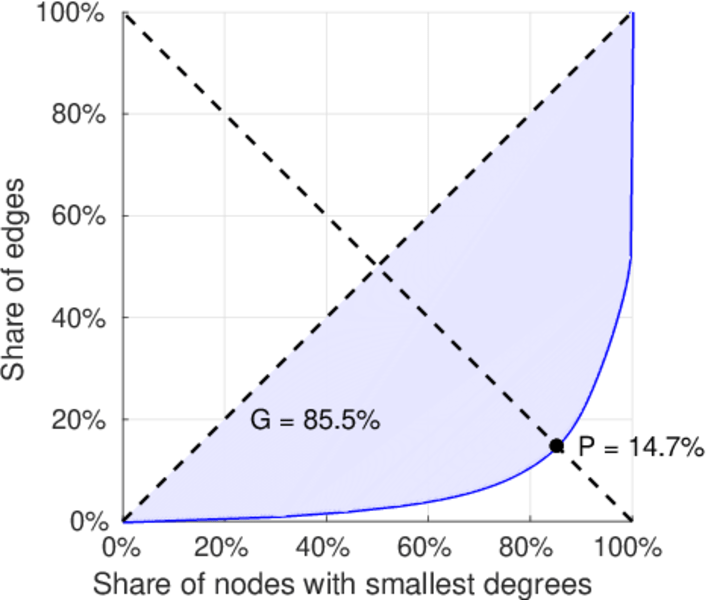
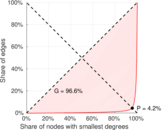
| Gini coefficient | G = | 0.846 312
|
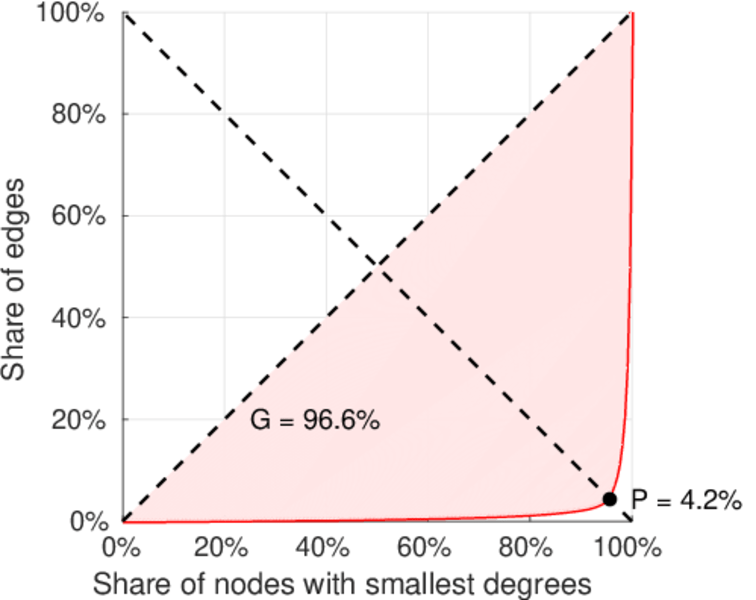
| Balanced inequality ratio | P = | 0.151 998
|
| Left balanced inequality ratio | P1 = | 0.041 769 3
|
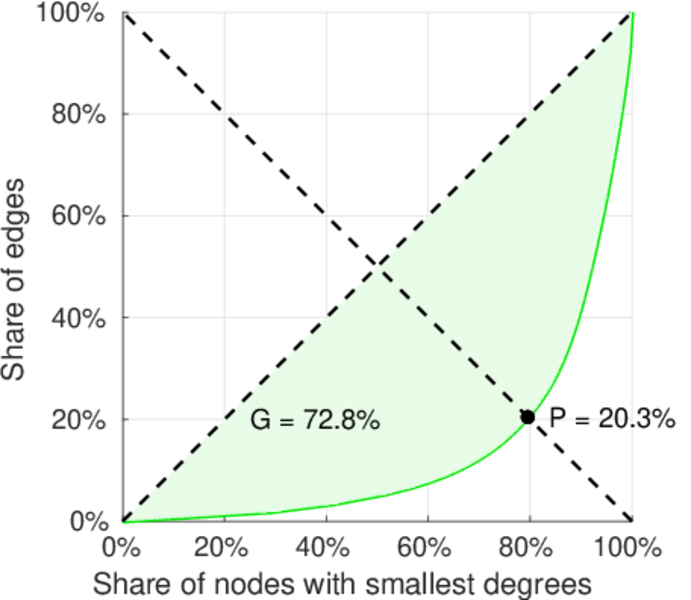
| Right balanced inequality ratio | P2 = | 0.202 864
|
| Relative edge distribution entropy | Her = | 0.753 025
|
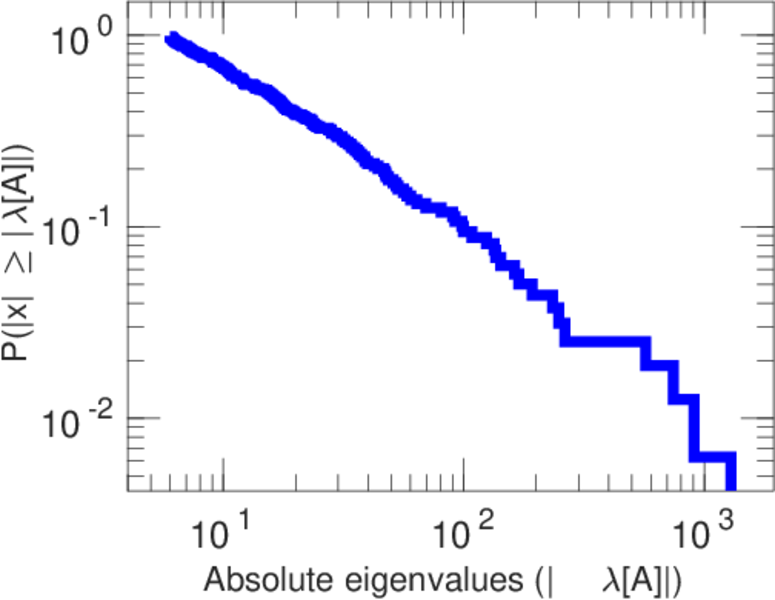
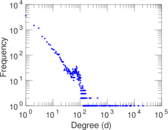
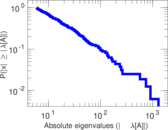
| Power law exponent | γ = | 2.001 04
|
| Tail power law exponent | γt = | 1.681 00
|
| Tail power law exponent with p | γ3 = | 1.681 00
|
| p-value | p = | 0.000 00
|
| Left tail power law exponent with p | γ3,1 = | 1.741 00
|
| Left p-value | p1 = | 0.000 00
|
| Right tail power law exponent with p | γ3,2 = | 8.911 00
|
| Right p-value | p2 = | 0.047 000 0
|
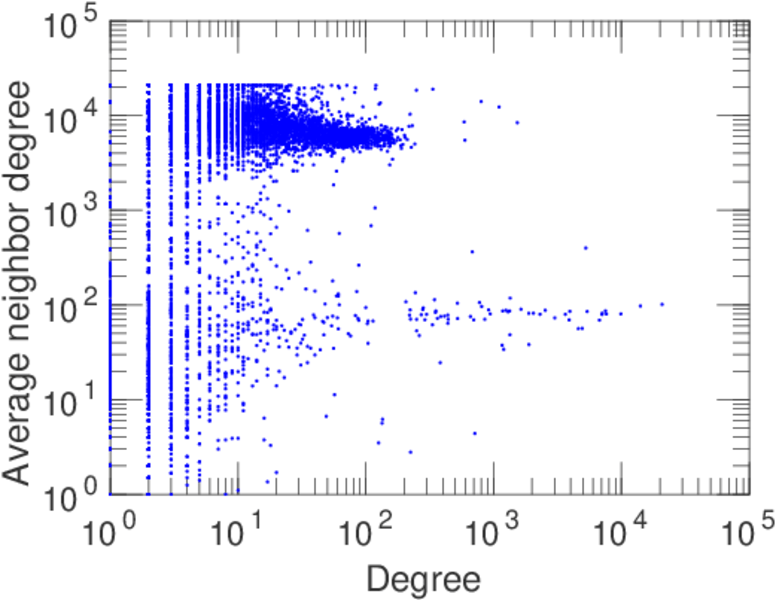
| Degree assortativity | ρ = | −0.329 427
|
| Degree assortativity p-value | pρ = | 0.000 00
|
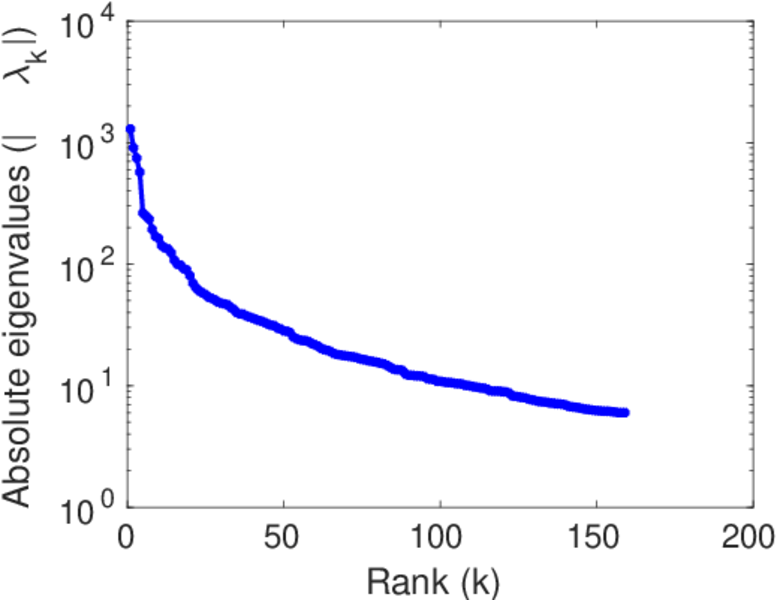
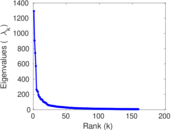
| Spectral norm | α = | 1,292.59
|
| Algebraic connectivity | a = | 0.044 811 8
|
| Spectral separation | |λ1[A] / λ2[A]| = | 1.426 24
|
| Controllability | C = | 9,061
|
| Relative controllability | Cr = | 0.781 525
|
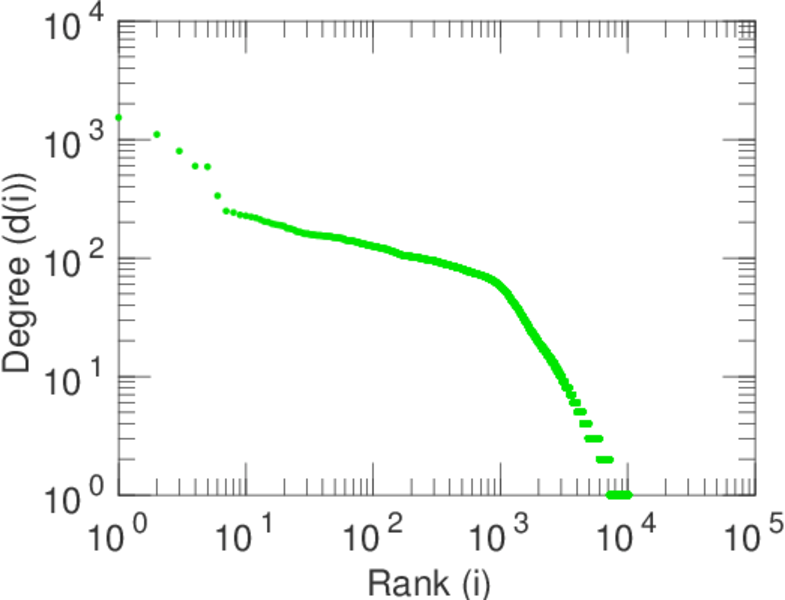
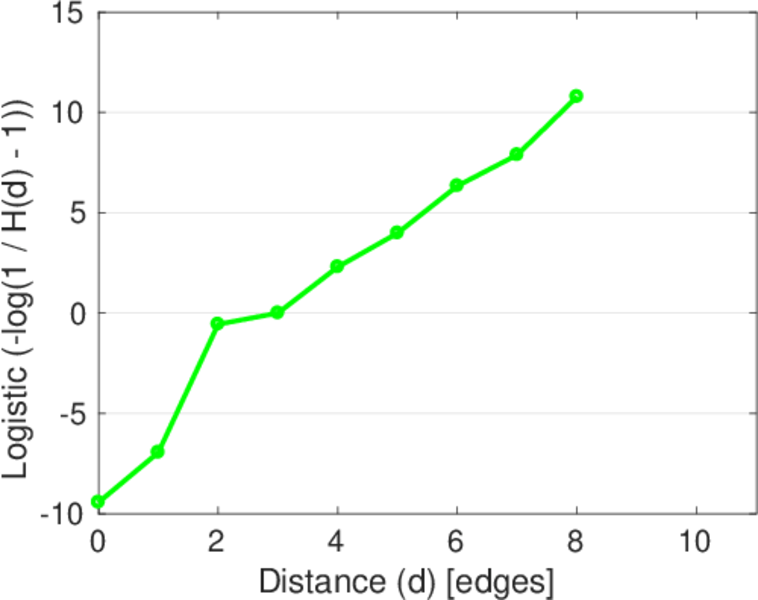
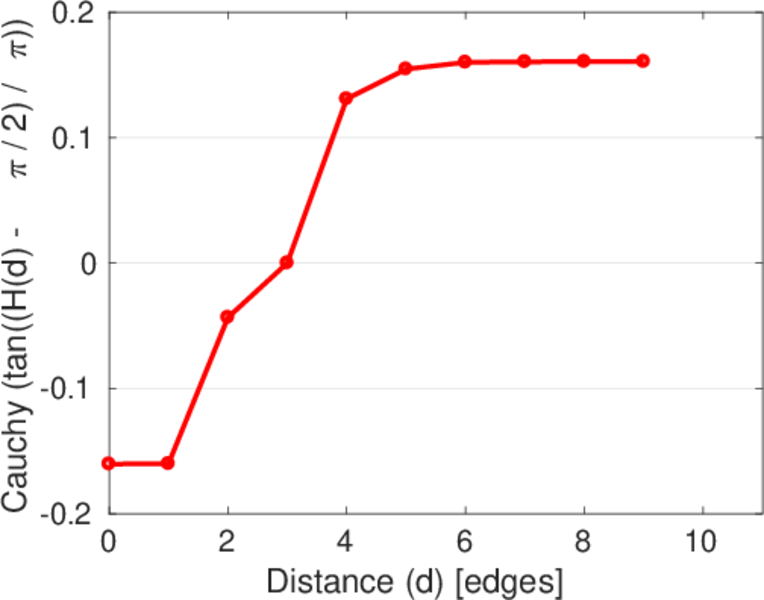
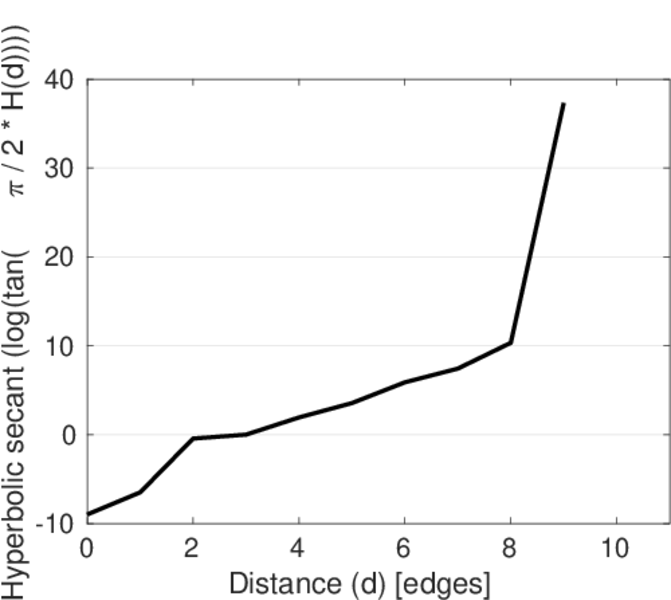
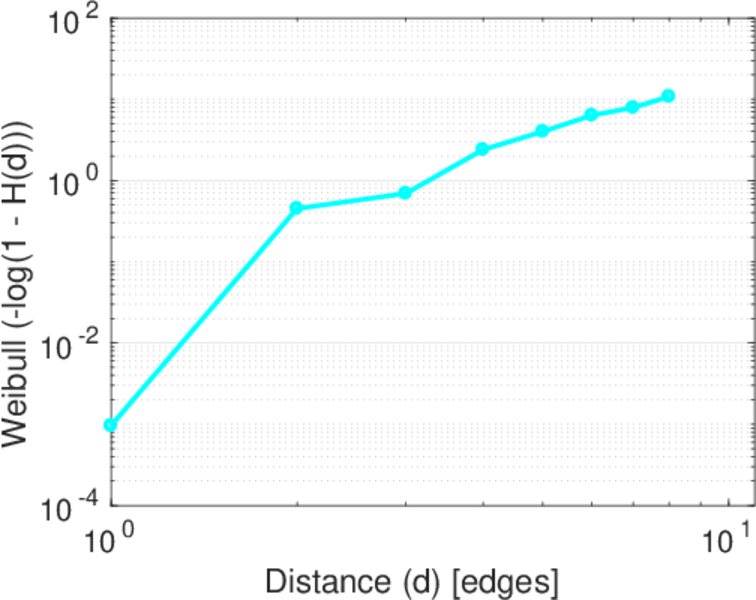
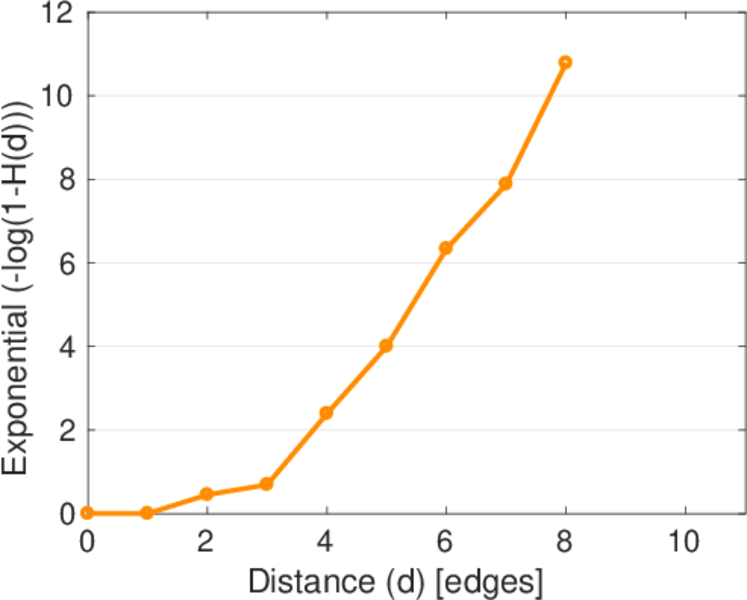
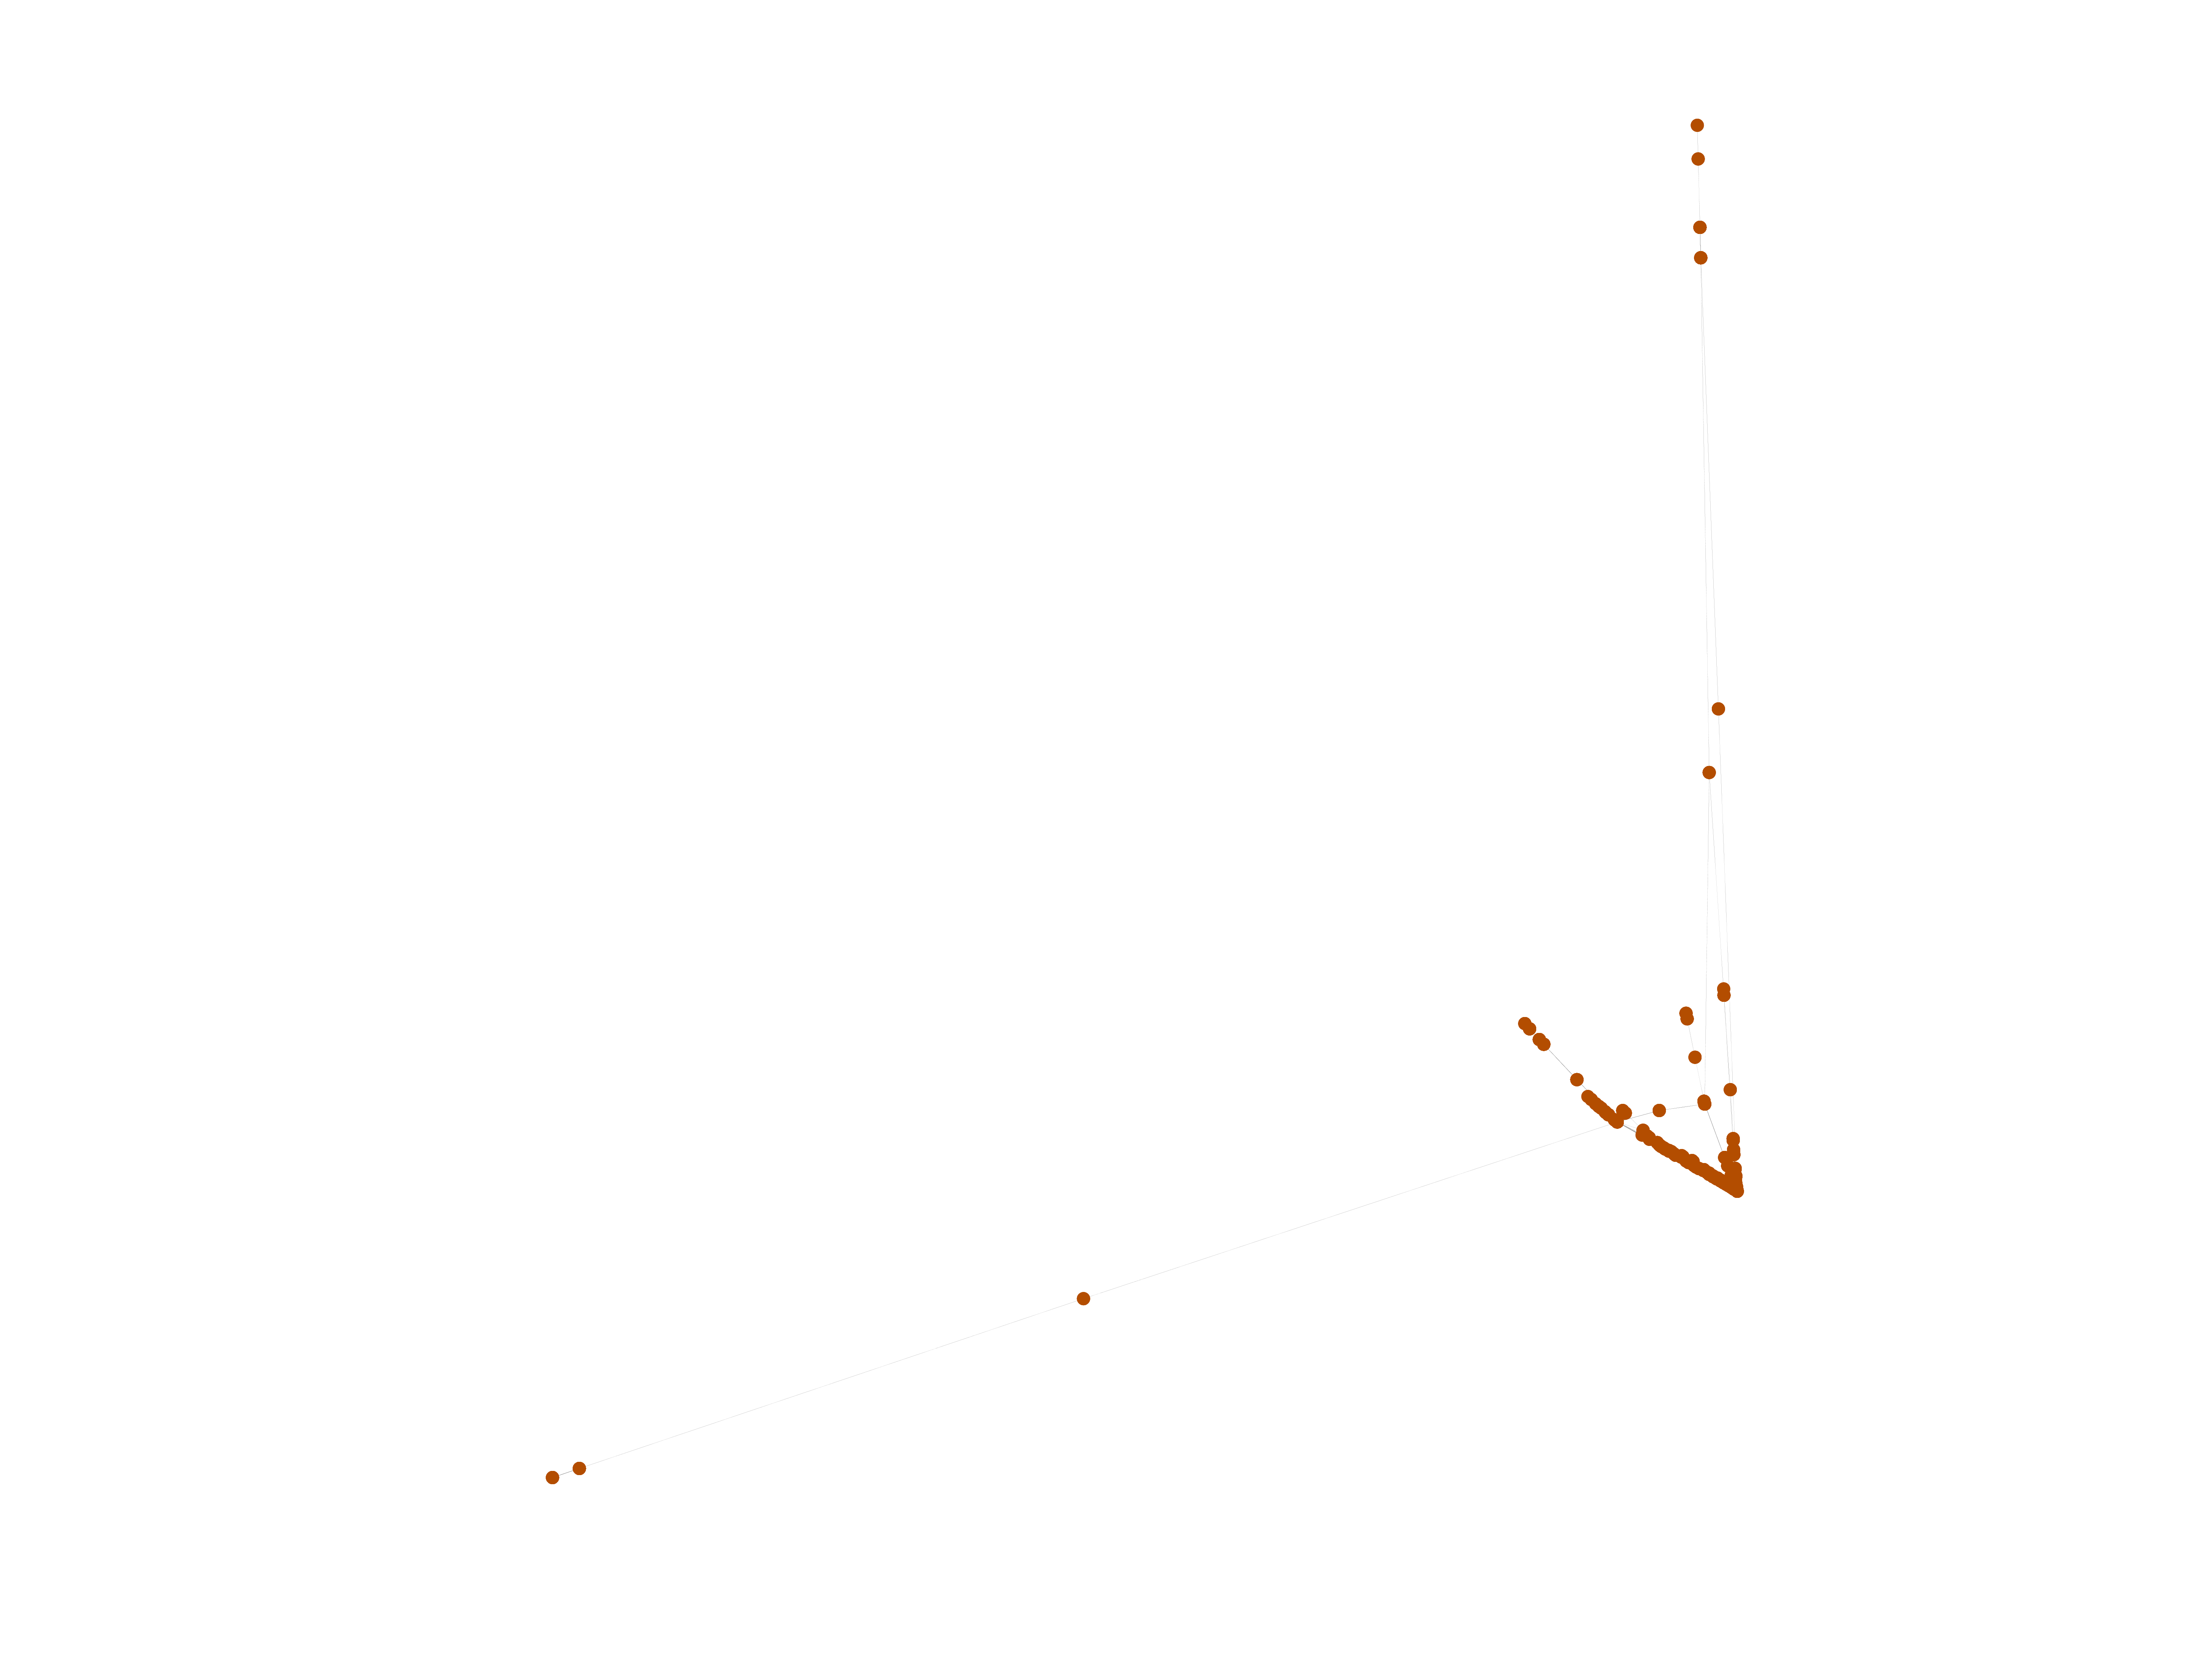
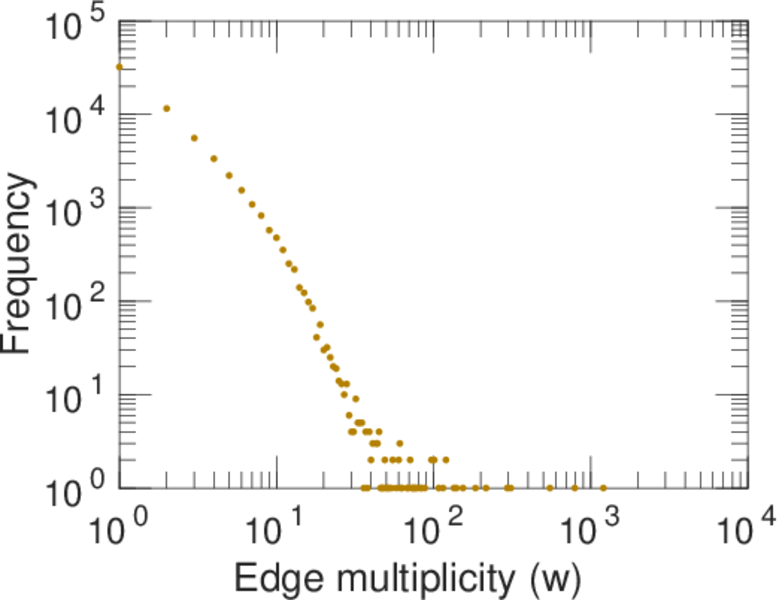
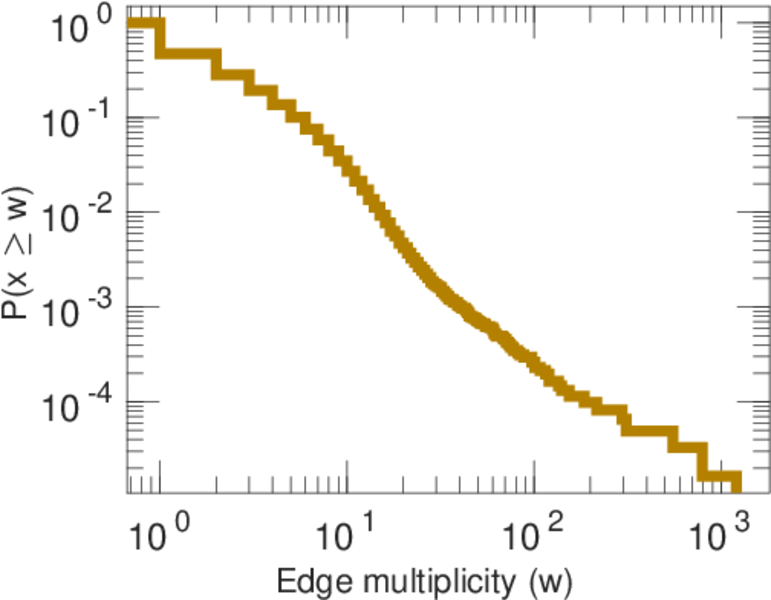
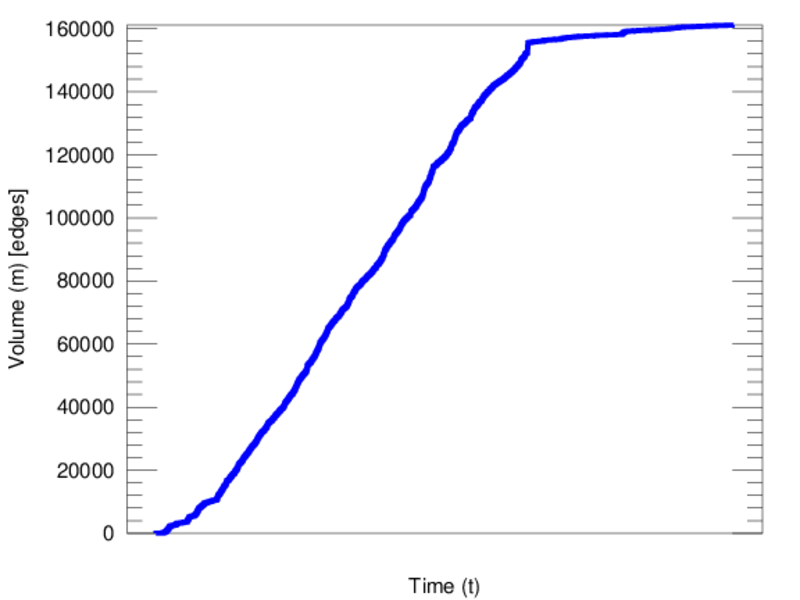
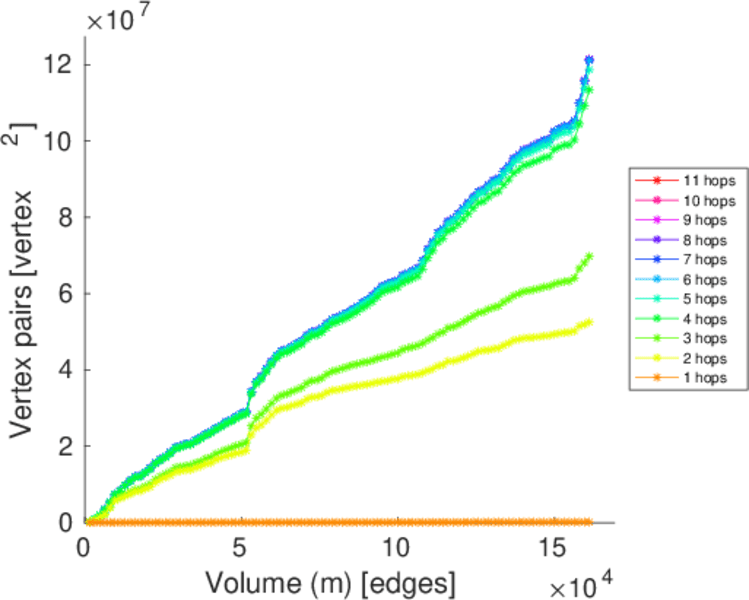
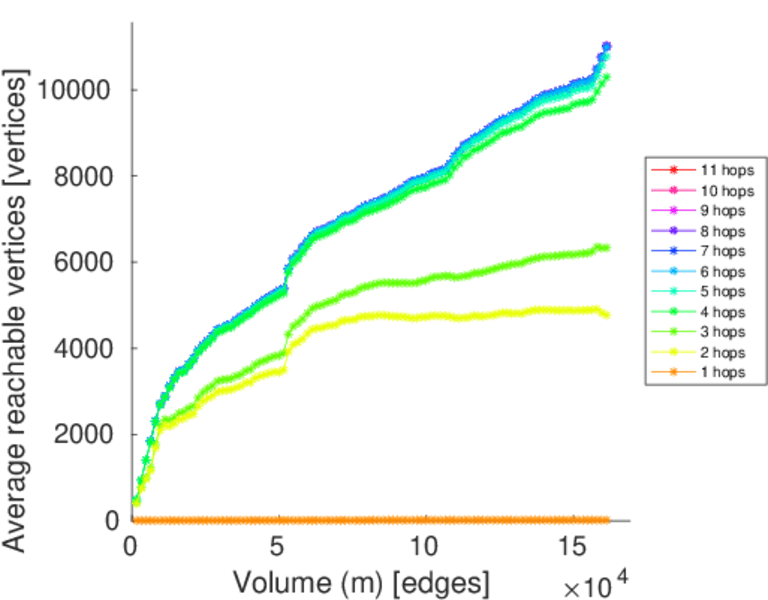
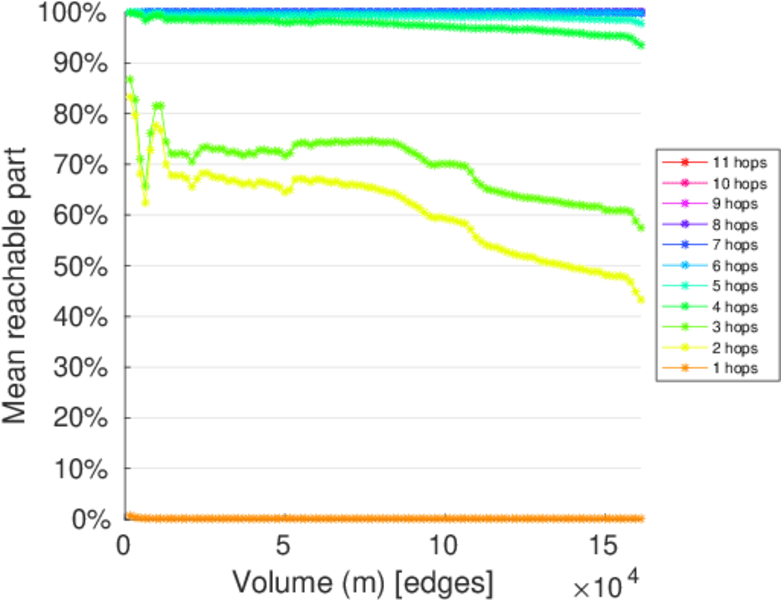
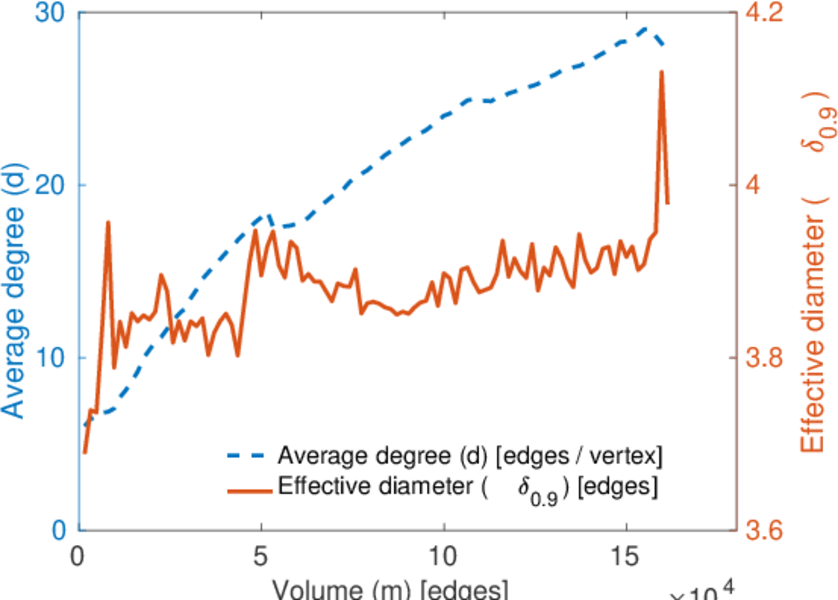
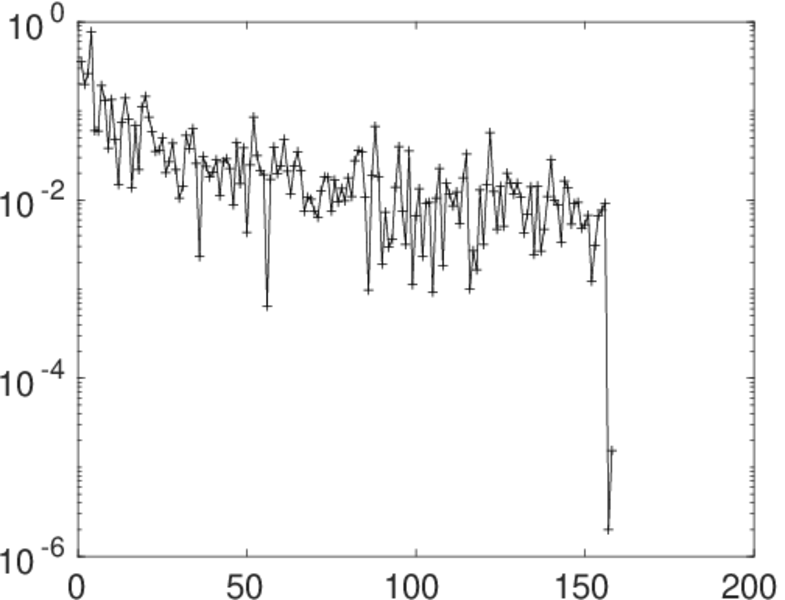
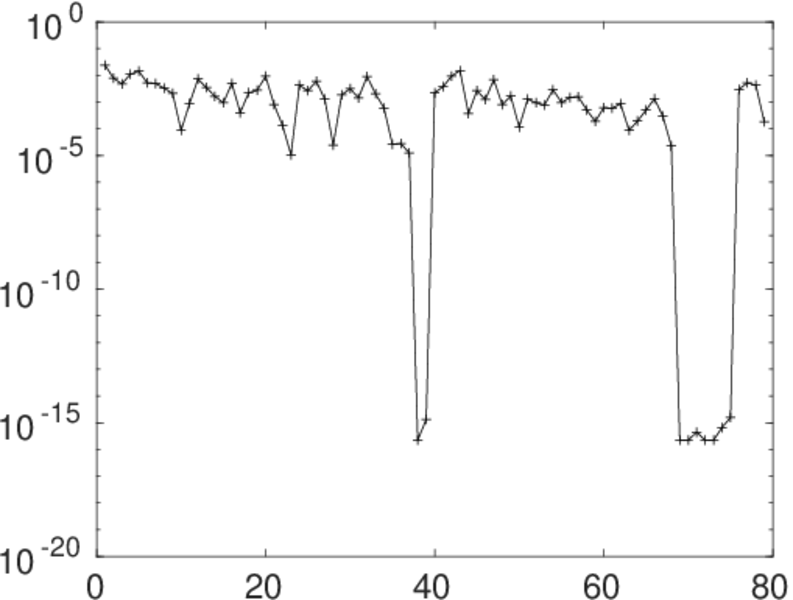
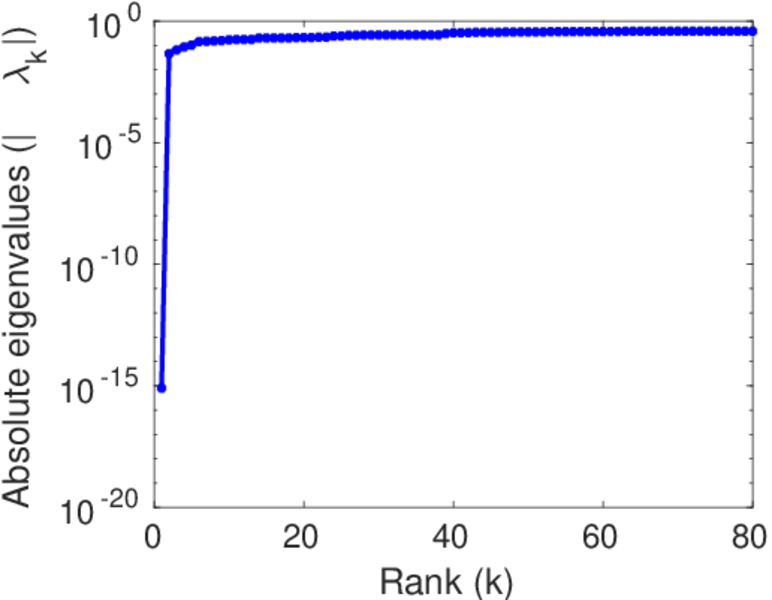
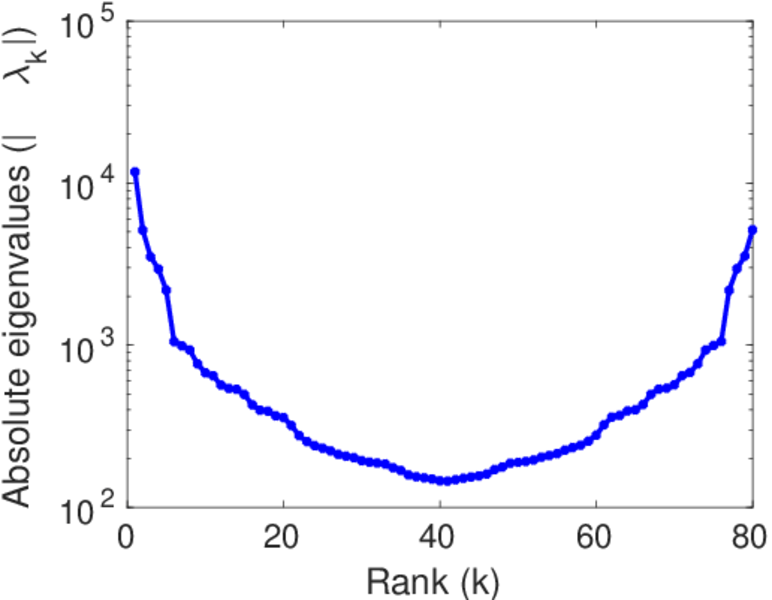
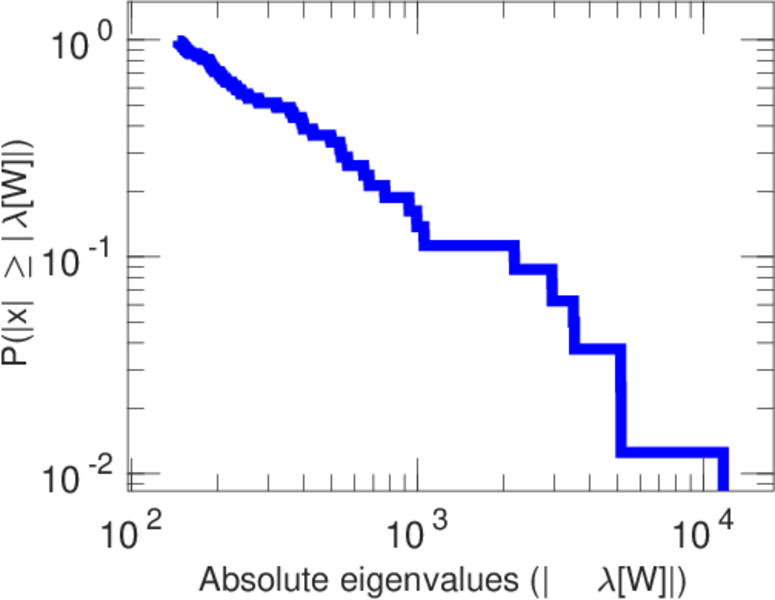
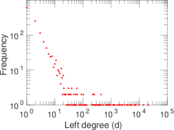
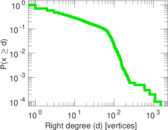
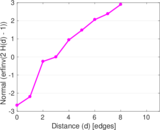
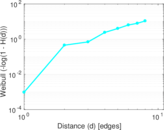
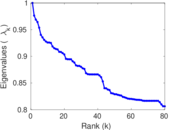
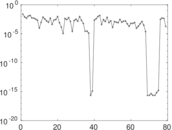
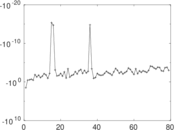
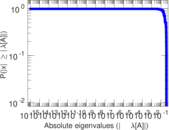
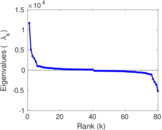
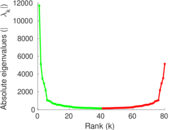
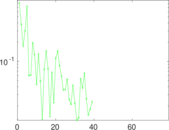
Plots


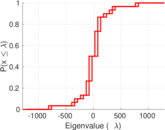
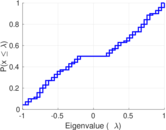

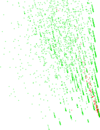
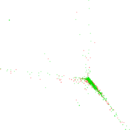
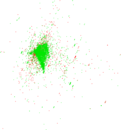


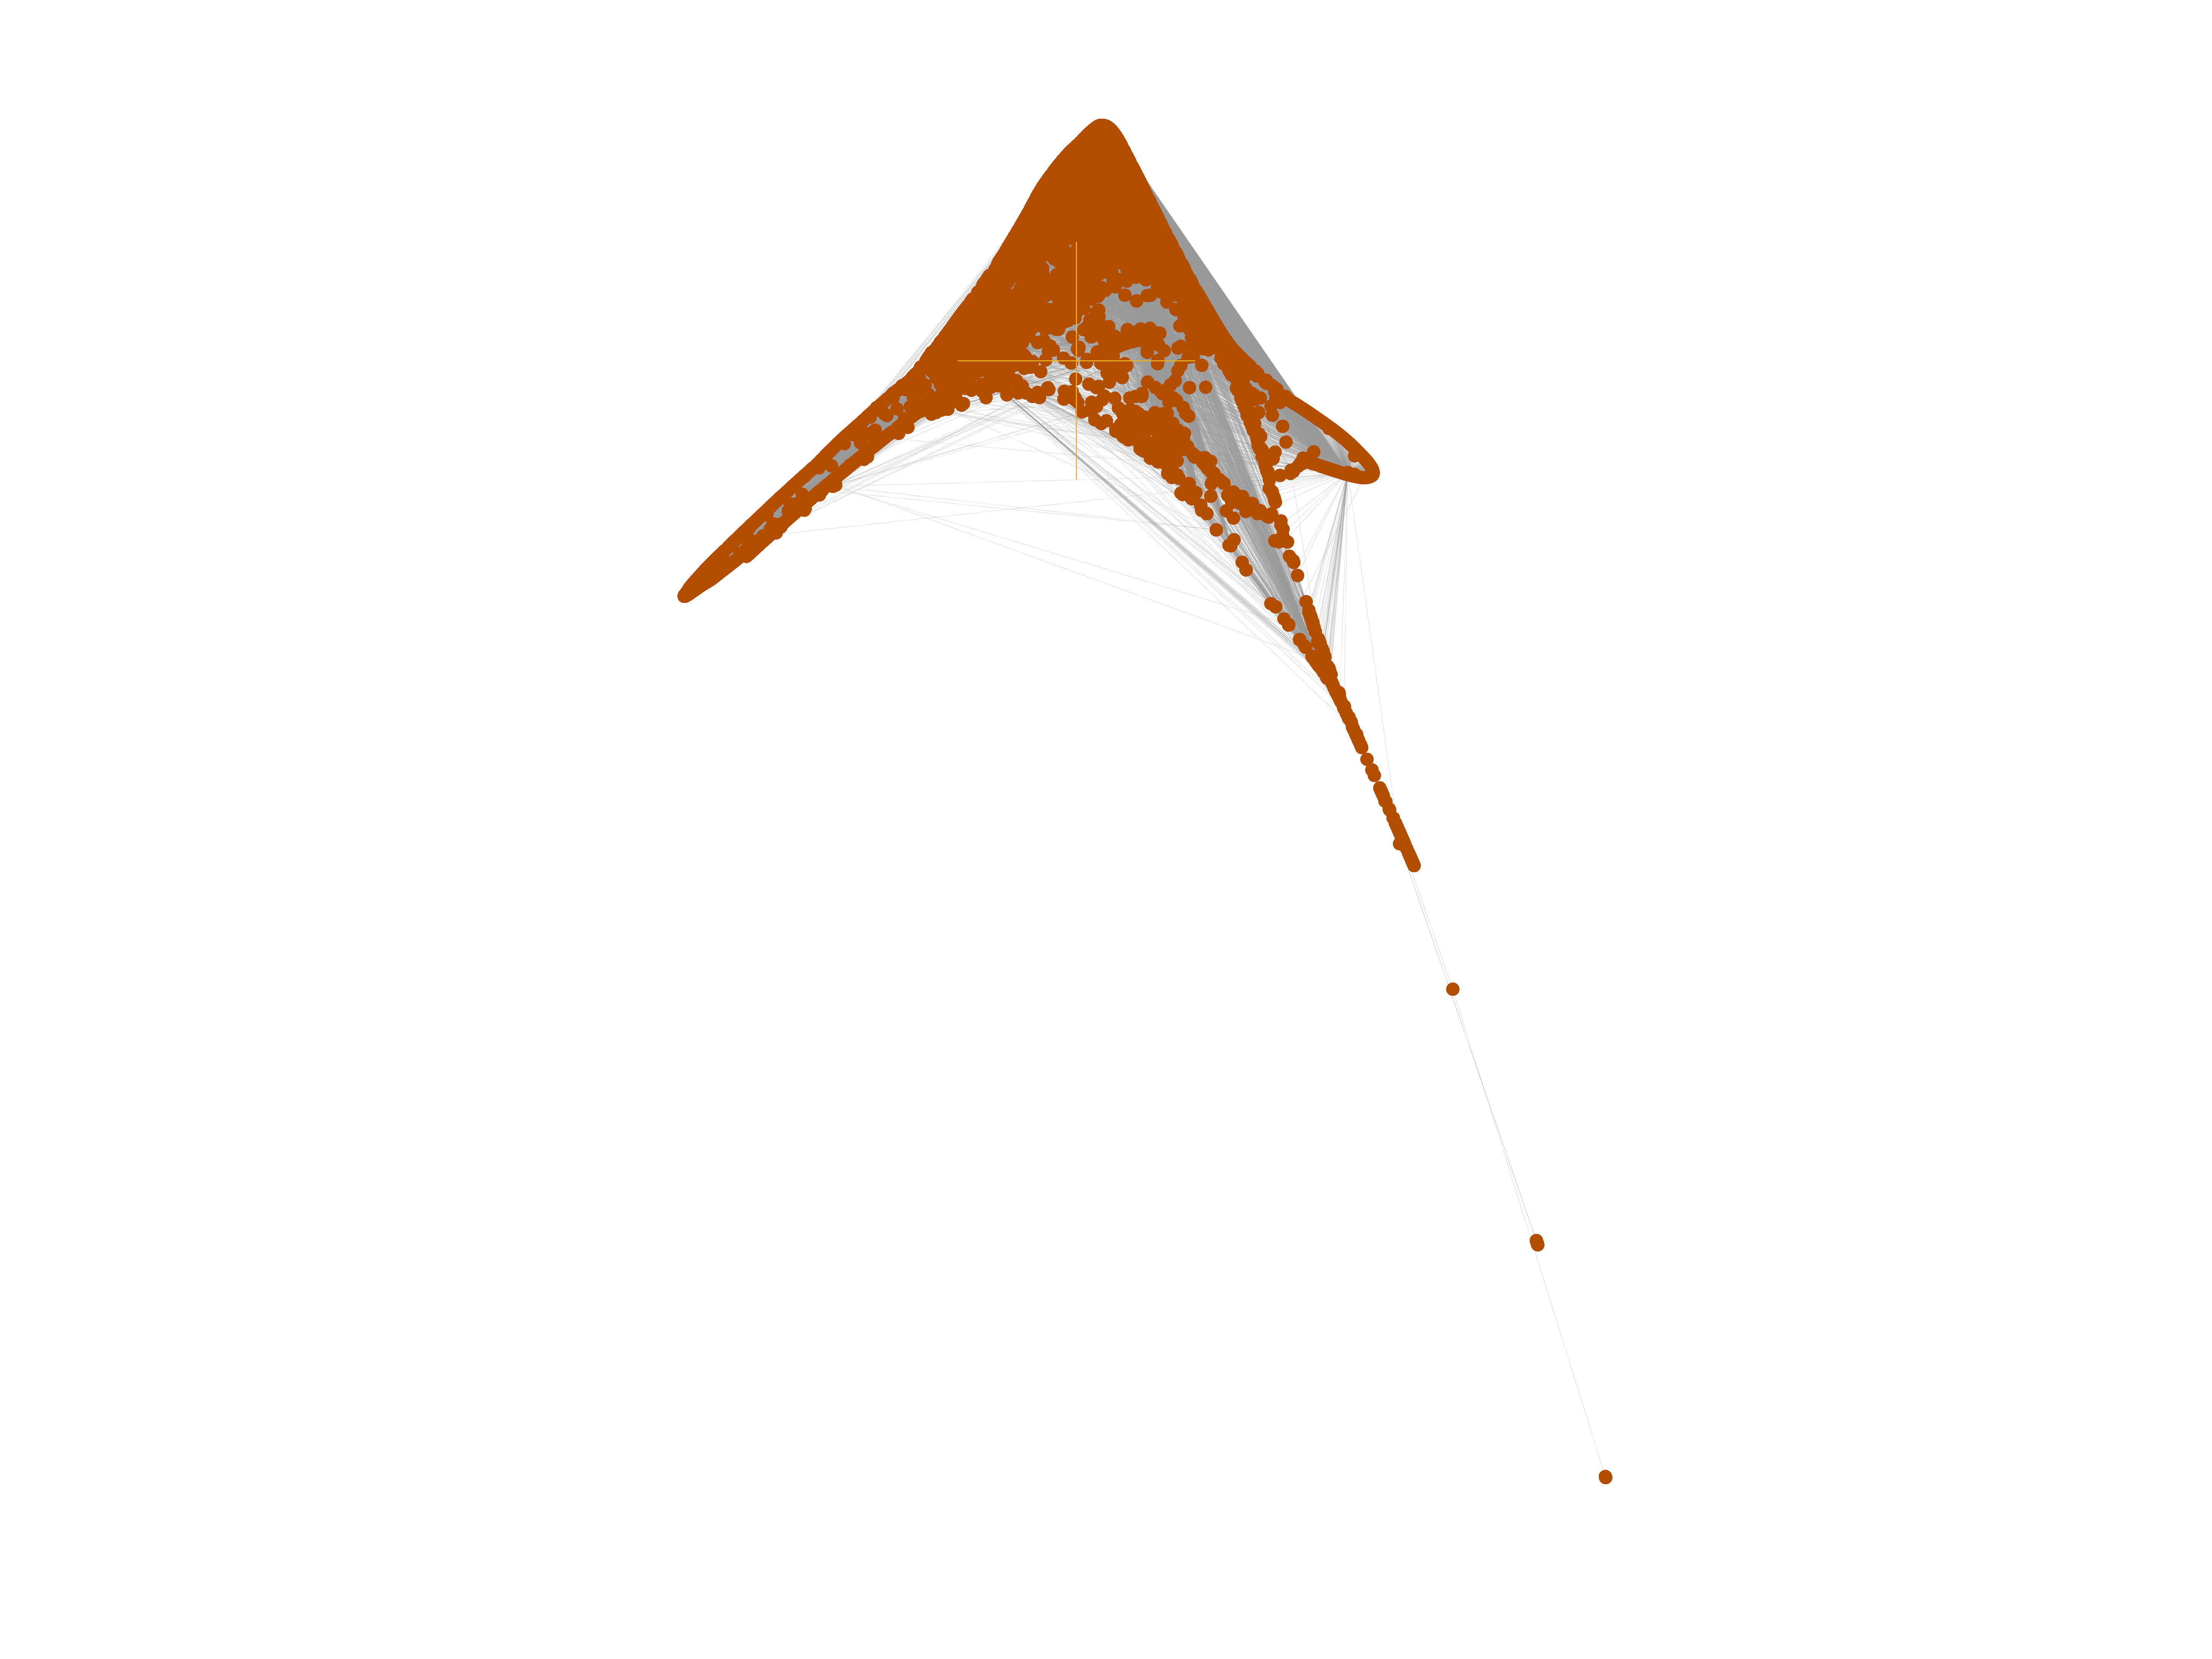
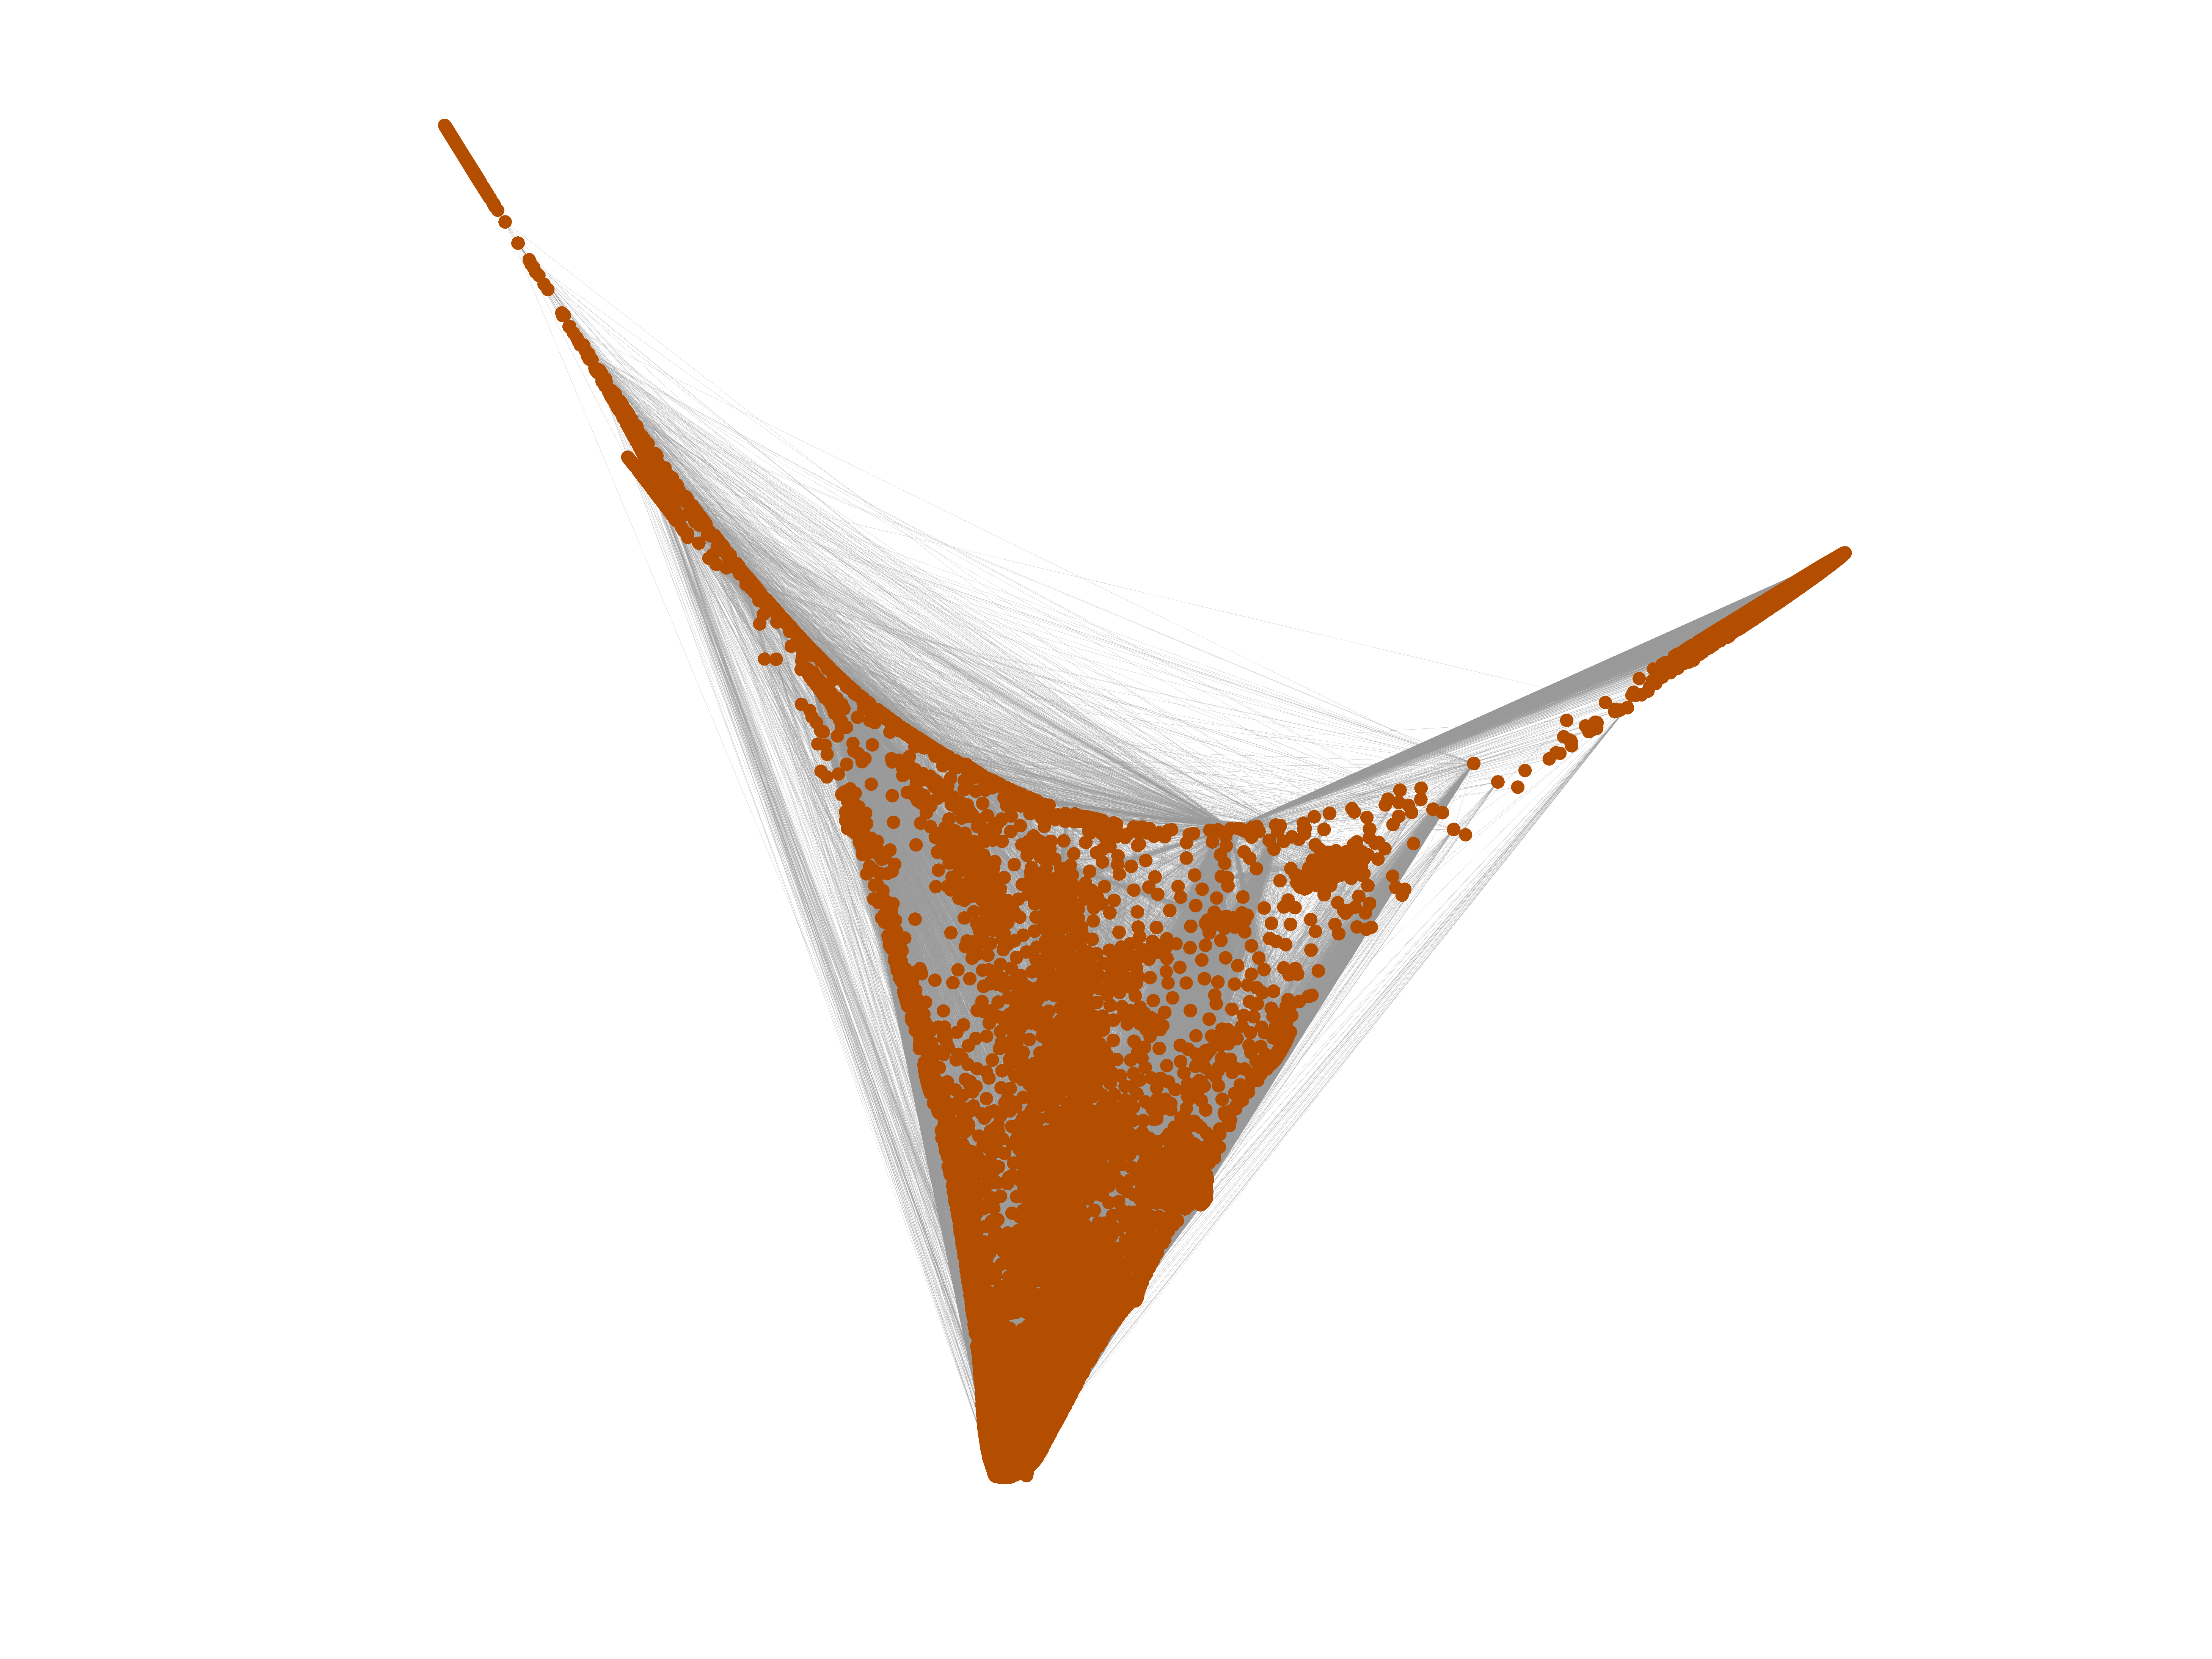
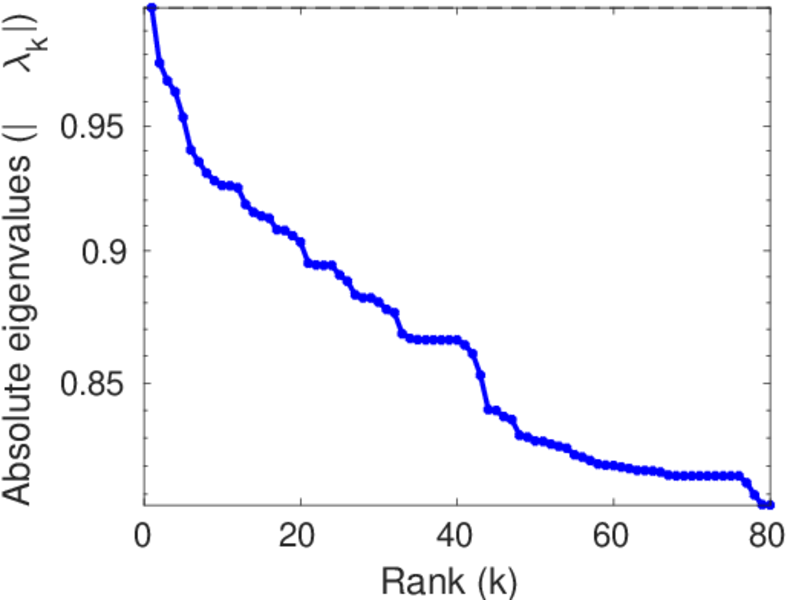
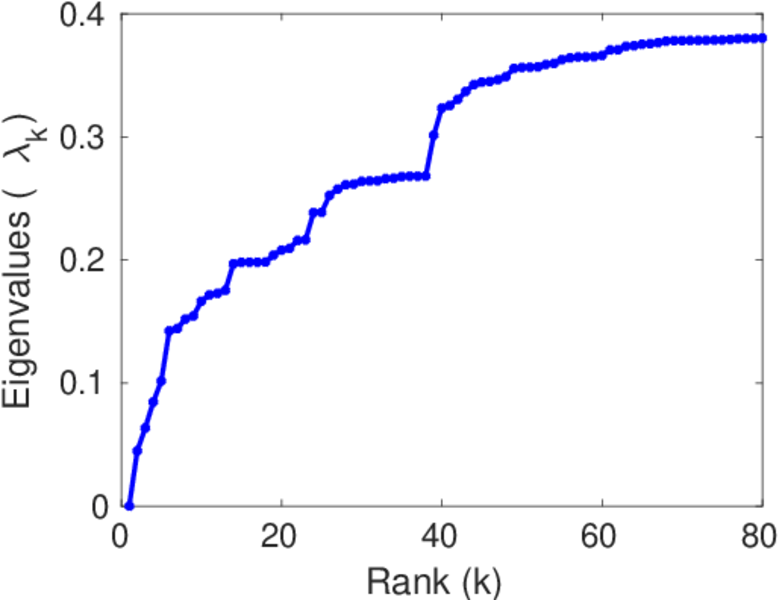
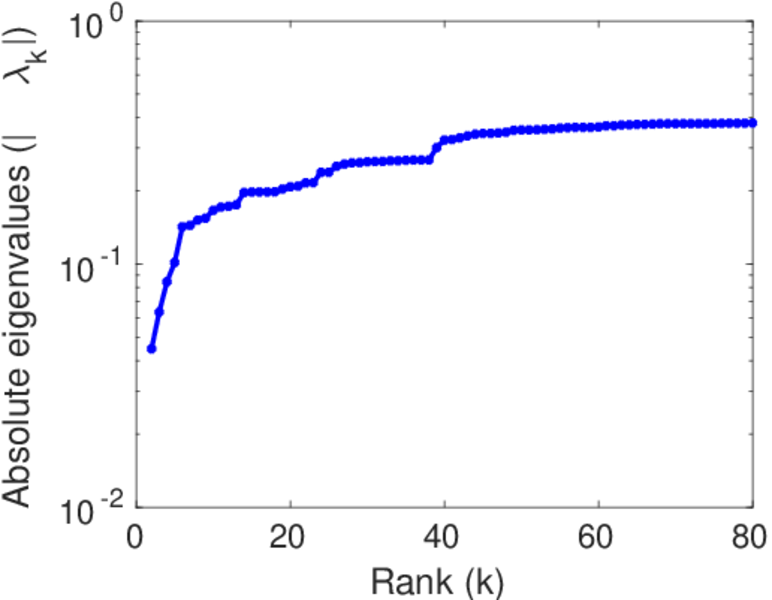
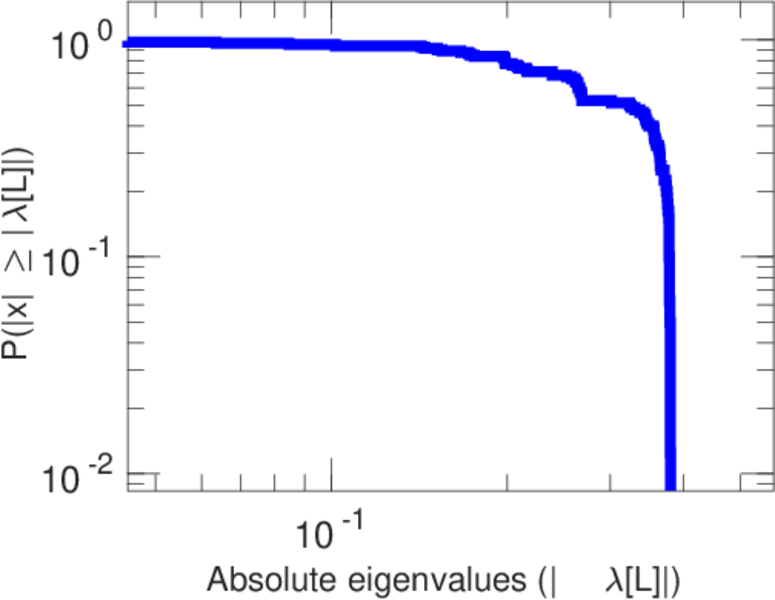
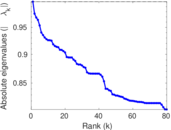
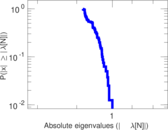
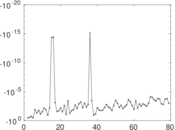
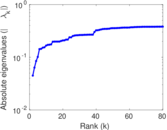
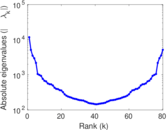
Matrix decompositions plots


Downloads
References
|
[1]
|
Jérôme Kunegis.
KONECT – The Koblenz Network Collection.
In Proc. Int. Conf. on World Wide Web Companion, pages
1343–1350, 2013.
[ http ]
|
|
[2]
|
Wikimedia Foundation.
Wikimedia downloads.
http://dumps.wikimedia.org/, January 2010.
|
 KONECT ‣ Networks ‣
Buy Me a Coffee
KONECT ‣ Networks ‣
Buy Me a Coffee