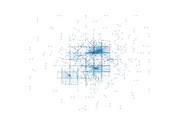
Wiktionary edits (ks)
This is the bipartite edit network of the Kashmiri Wiktionary. It contains
users and pages from the Kashmiri Wiktionary, connected by edit events. Each
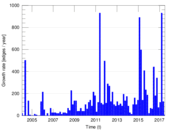
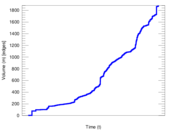
edge represents an edit. The dataset includes the timestamp of each edit.
Metadata
Statistics
| Size | n = | 888
|
| Left size | n1 = | 167
|
| Right size | n2 = | 721
|
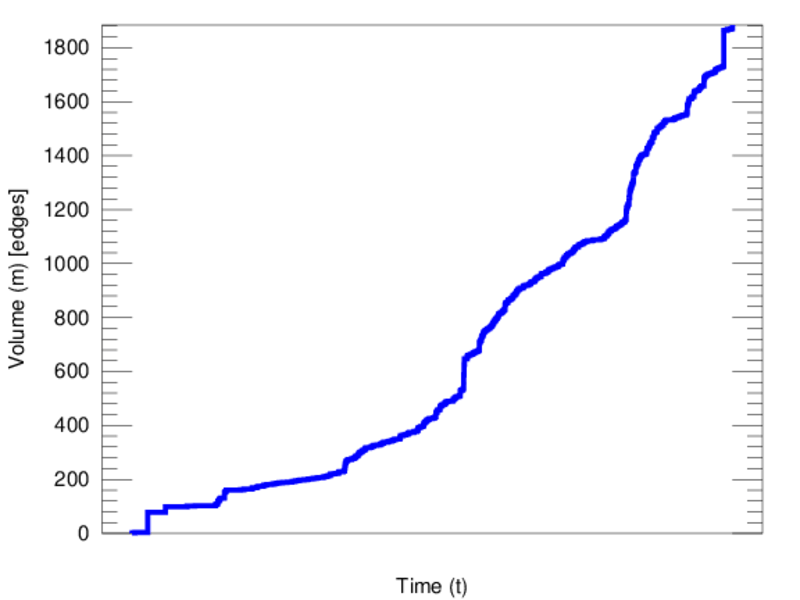
| Volume | m = | 1,884
|
| Unique edge count | m̿ = | 1,156
|
| Wedge count | s = | 40,762
|
| Claw count | z = | 1,835,512
|
| Cross count | x = | 72,026,329
|
| Square count | q = | 7,842
|
| 4-Tour count | T4 = | 228,408
|
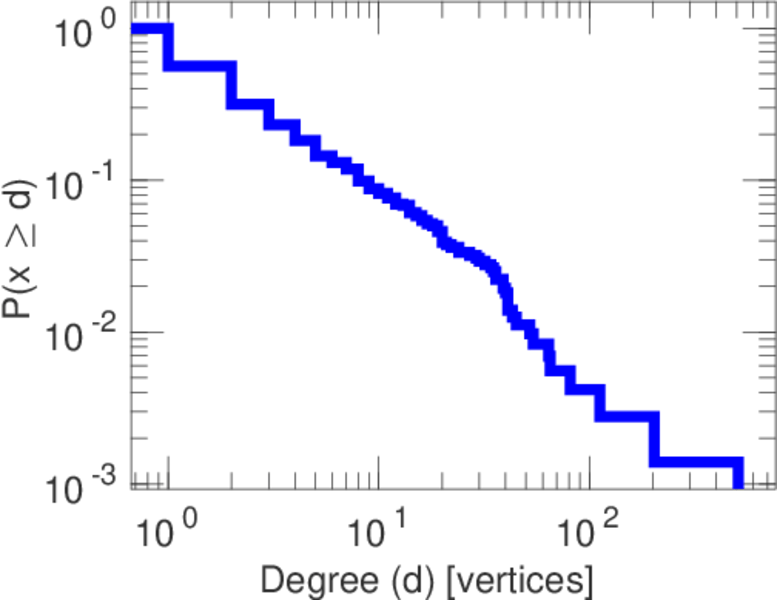
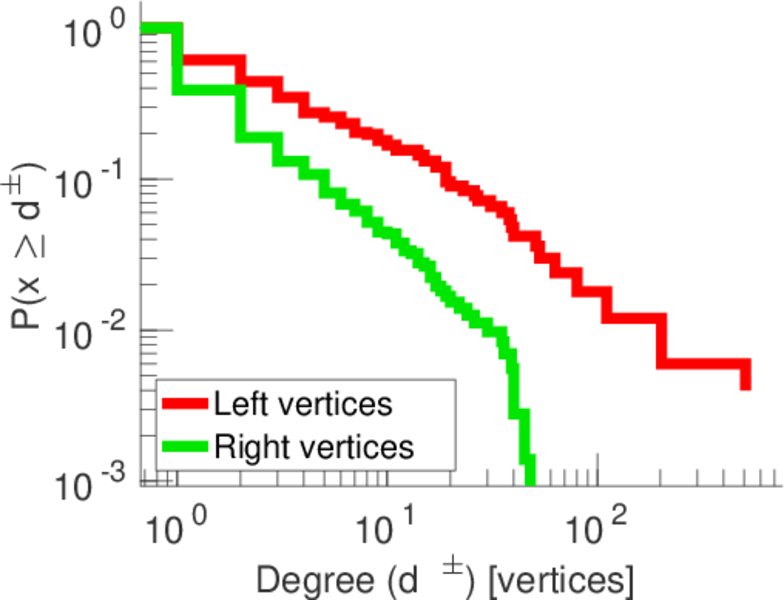
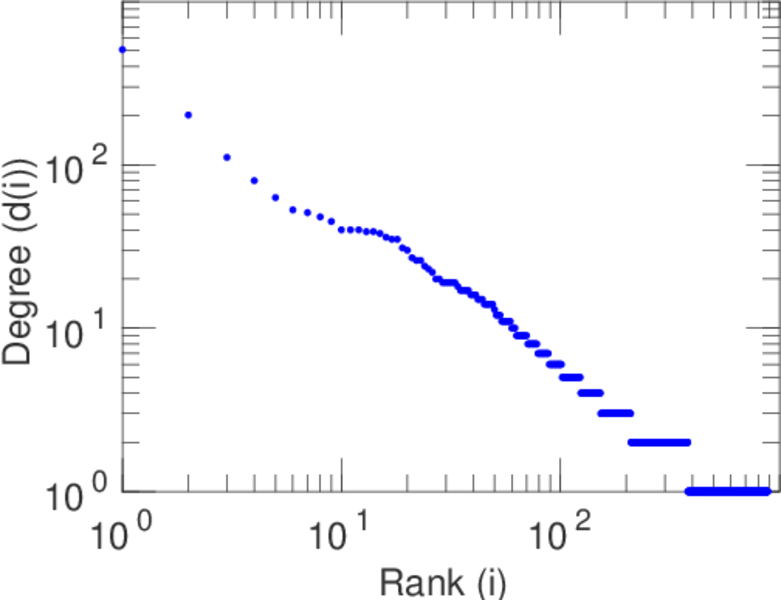
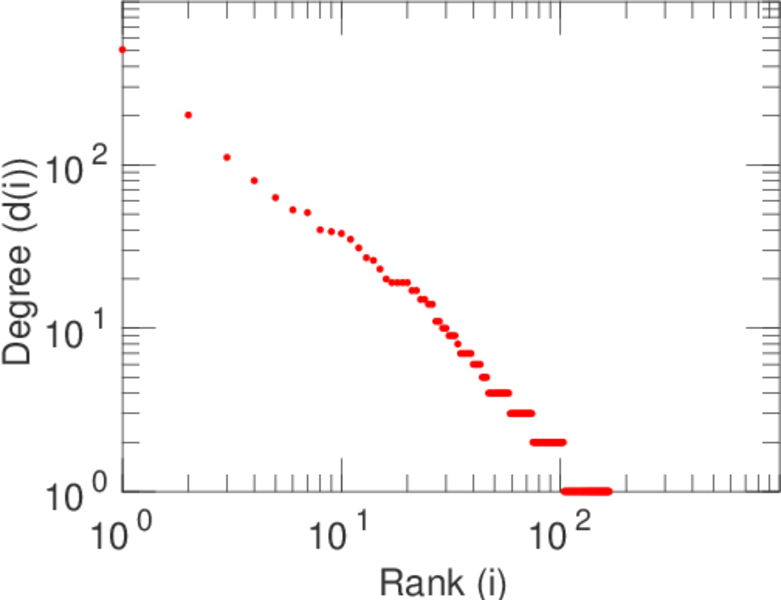
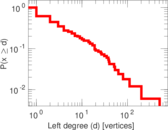
| Maximum degree | dmax = | 508
|
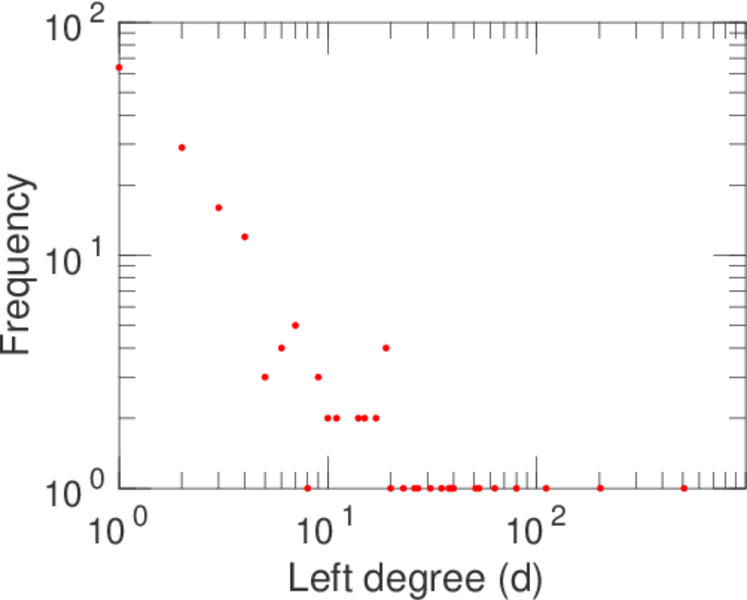
| Maximum left degree | d1max = | 508
|
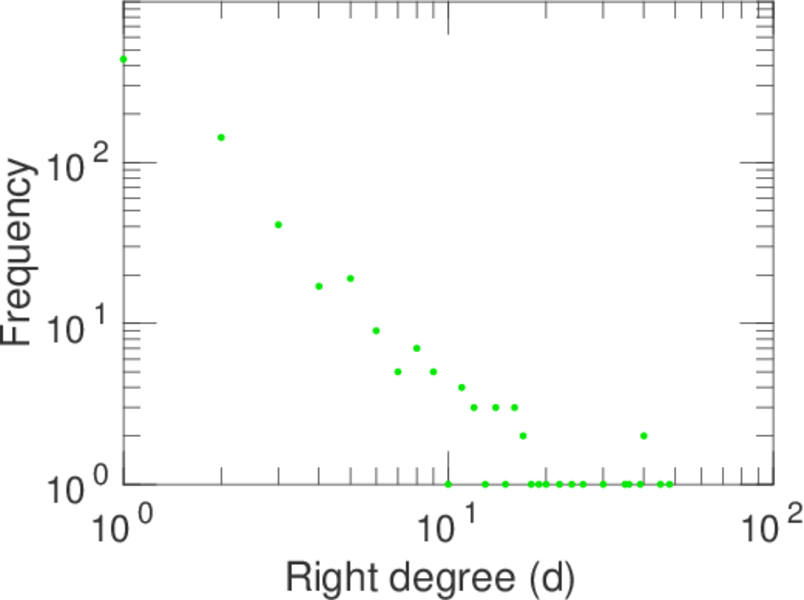
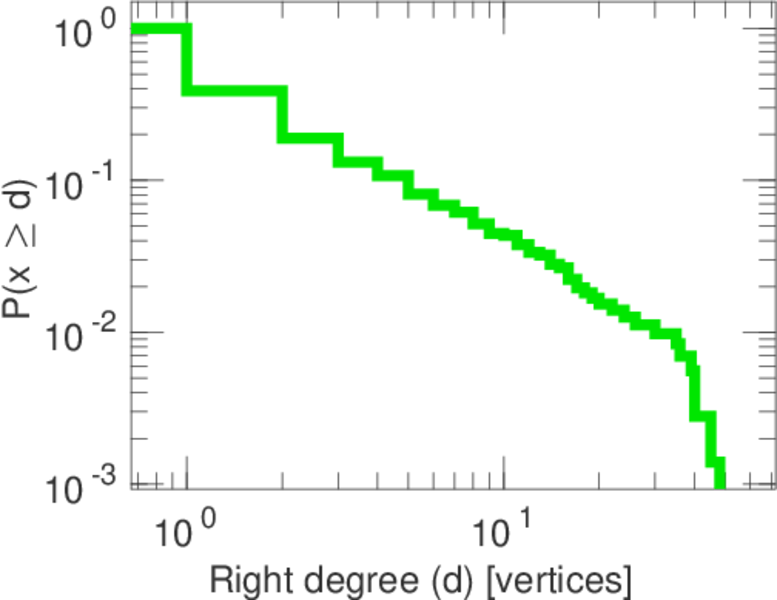
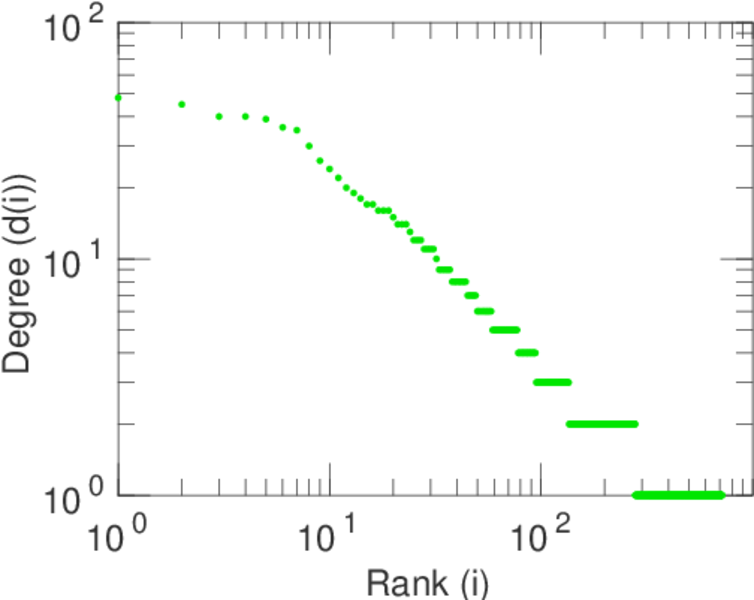
| Maximum right degree | d2max = | 48
|
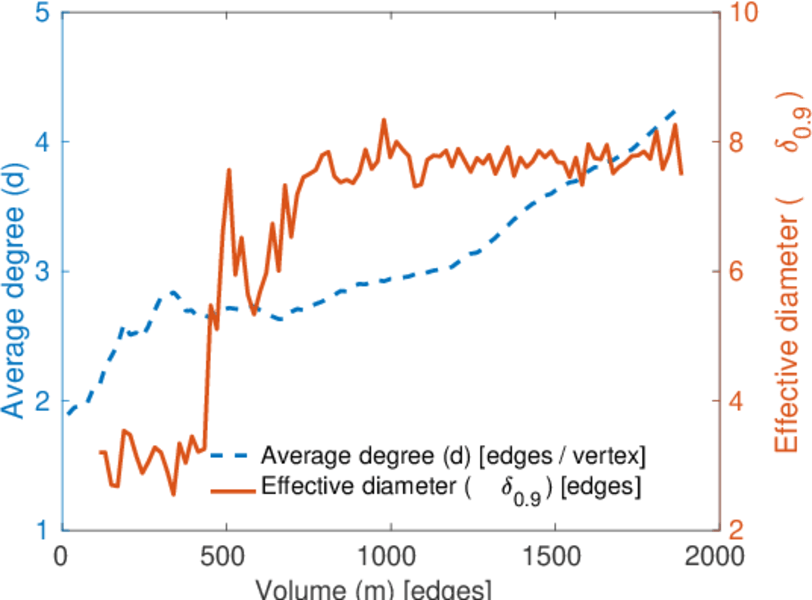
| Average degree | d = | 4.243 24
|
| Average left degree | d1 = | 11.281 4
|
| Average right degree | d2 = | 2.613 04
|
| Fill | p = | 0.009 600 77
|
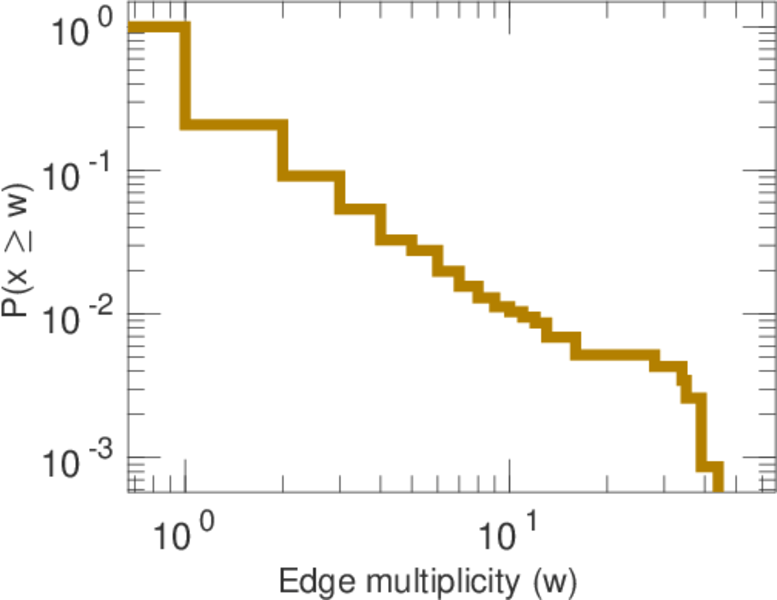
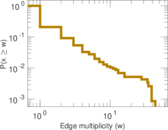
| Average edge multiplicity | m̃ = | 1.629 76
|
| Size of LCC | N = | 694
|
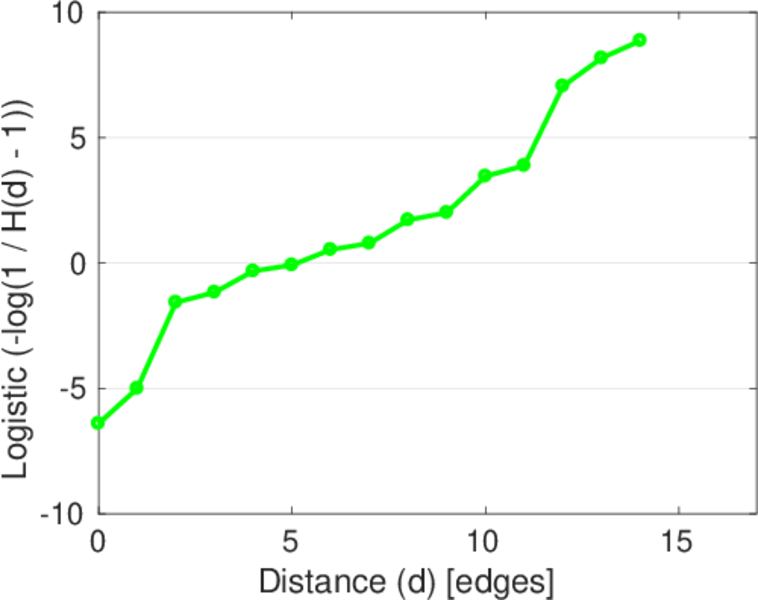
| Diameter | δ = | 15
|
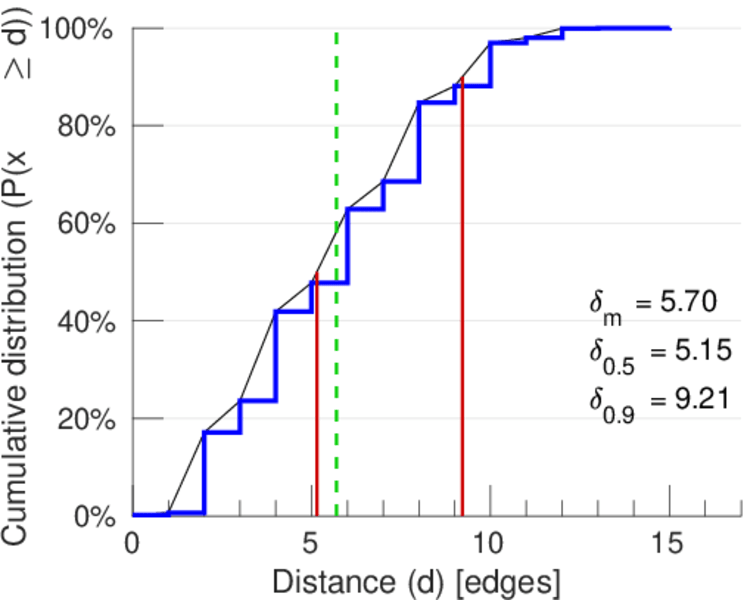
| 50-Percentile effective diameter | δ0.5 = | 5.146 82
|
| 90-Percentile effective diameter | δ0.9 = | 9.213 90
|
| Median distance | δM = | 6
|
| Mean distance | δm = | 5.698 80
|
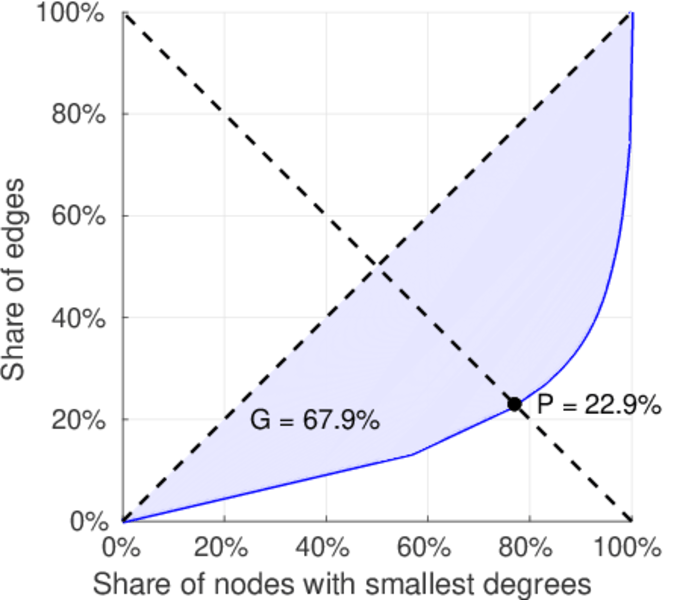
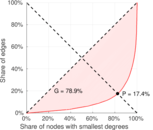
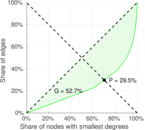
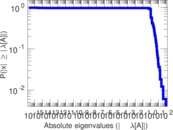
| Gini coefficient | G = | 0.688 041
|
| Balanced inequality ratio | P = | 0.226 380
|
| Left balanced inequality ratio | P1 = | 0.173 567
|
| Right balanced inequality ratio | P2 = | 0.295 117
|
| Relative edge distribution entropy | Her = | 0.844 568
|
| Power law exponent | γ = | 3.462 78
|
| Tail power law exponent | γt = | 2.191 00
|
| Tail power law exponent with p | γ3 = | 2.191 00
|
| p-value | p = | 0.985 000
|
| Left tail power law exponent with p | γ3,1 = | 1.751 00
|
| Left p-value | p1 = | 0.186 000
|
| Right tail power law exponent with p | γ3,2 = | 3.091 00
|
| Right p-value | p2 = | 0.060 000 0
|
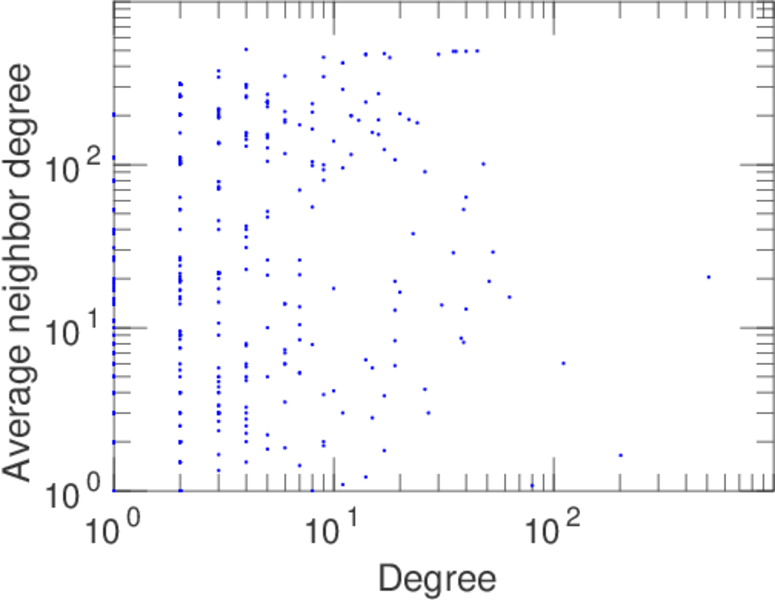
| Degree assortativity | ρ = | −0.209 913
|
| Degree assortativity p-value | pρ = | 5.603 74 × 10−13
|
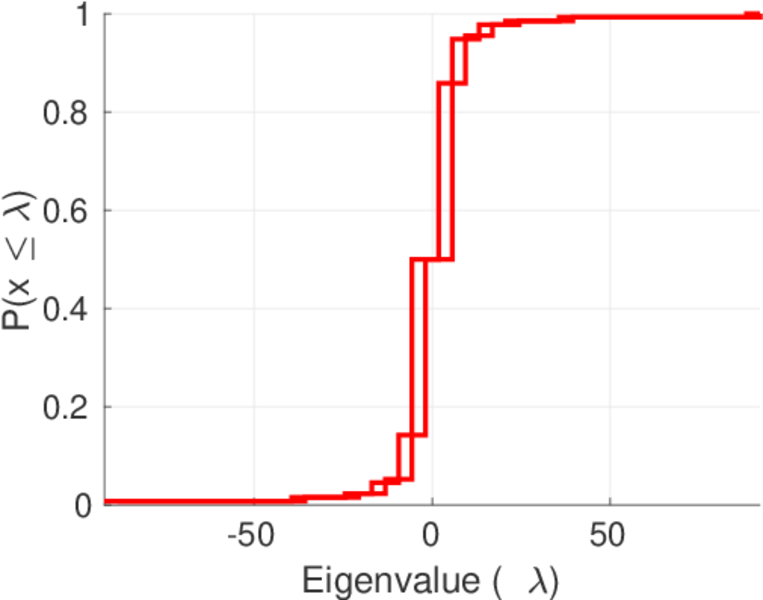
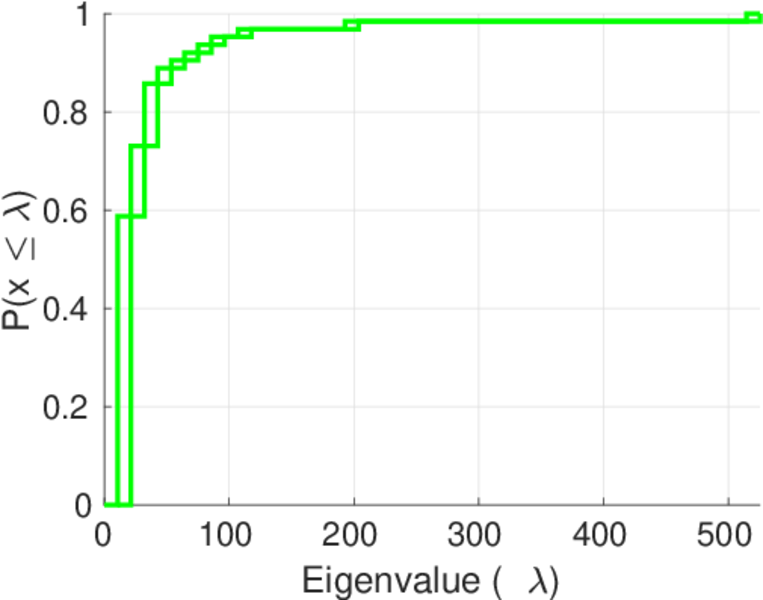
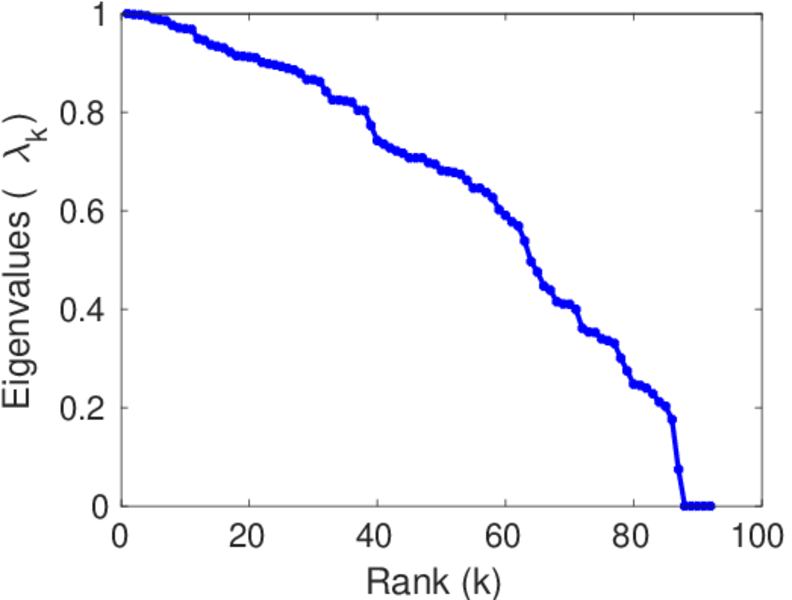
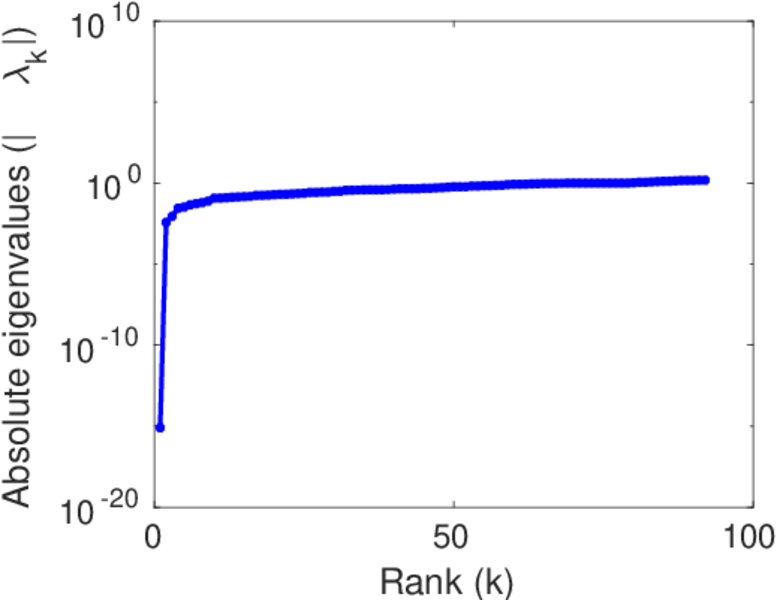
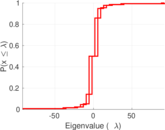
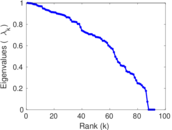
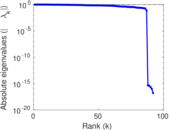
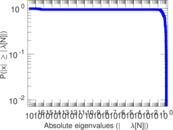
| Spectral norm | α = | 92.063 1
|
| Algebraic connectivity | a = | 0.003 808 25
|
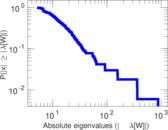
| Spectral separation | |λ1[A] / λ2[A]| = | 2.345 22
|
| Controllability | C = | 561
|
| Relative controllability | Cr = | 0.635 334
|
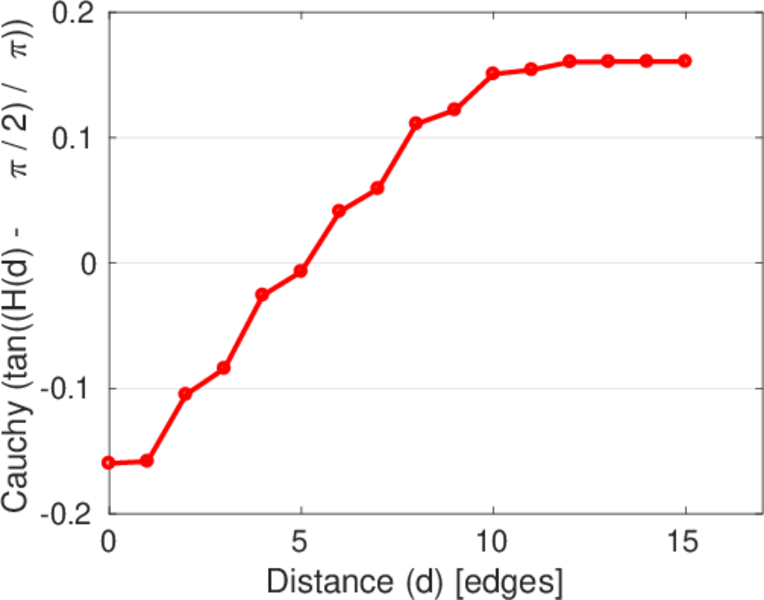
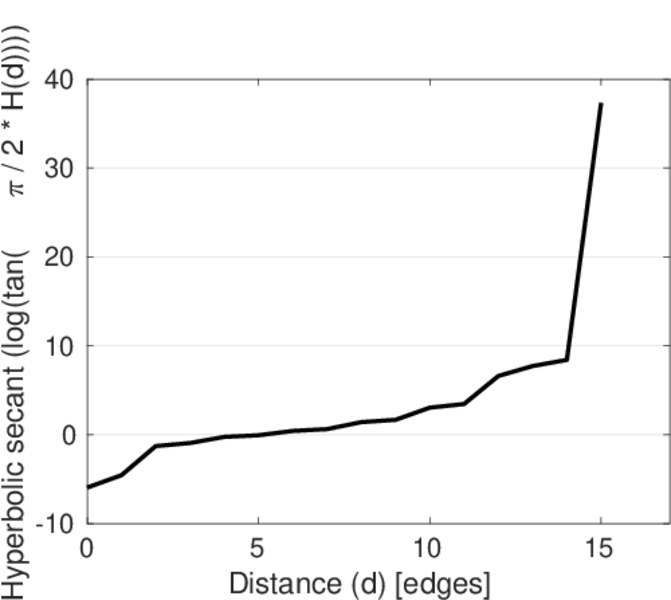
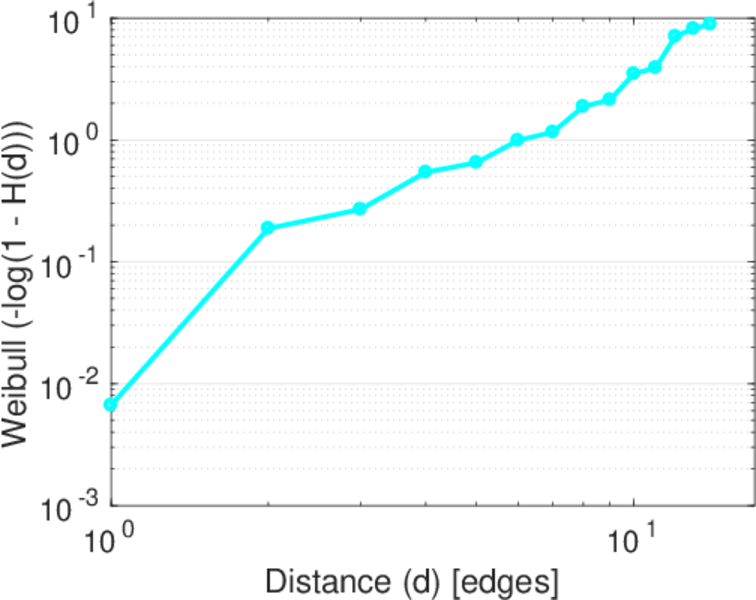
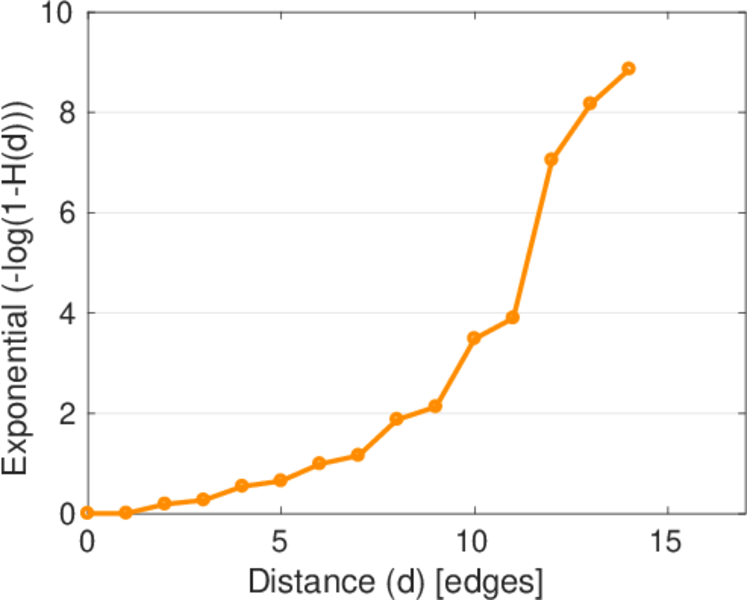
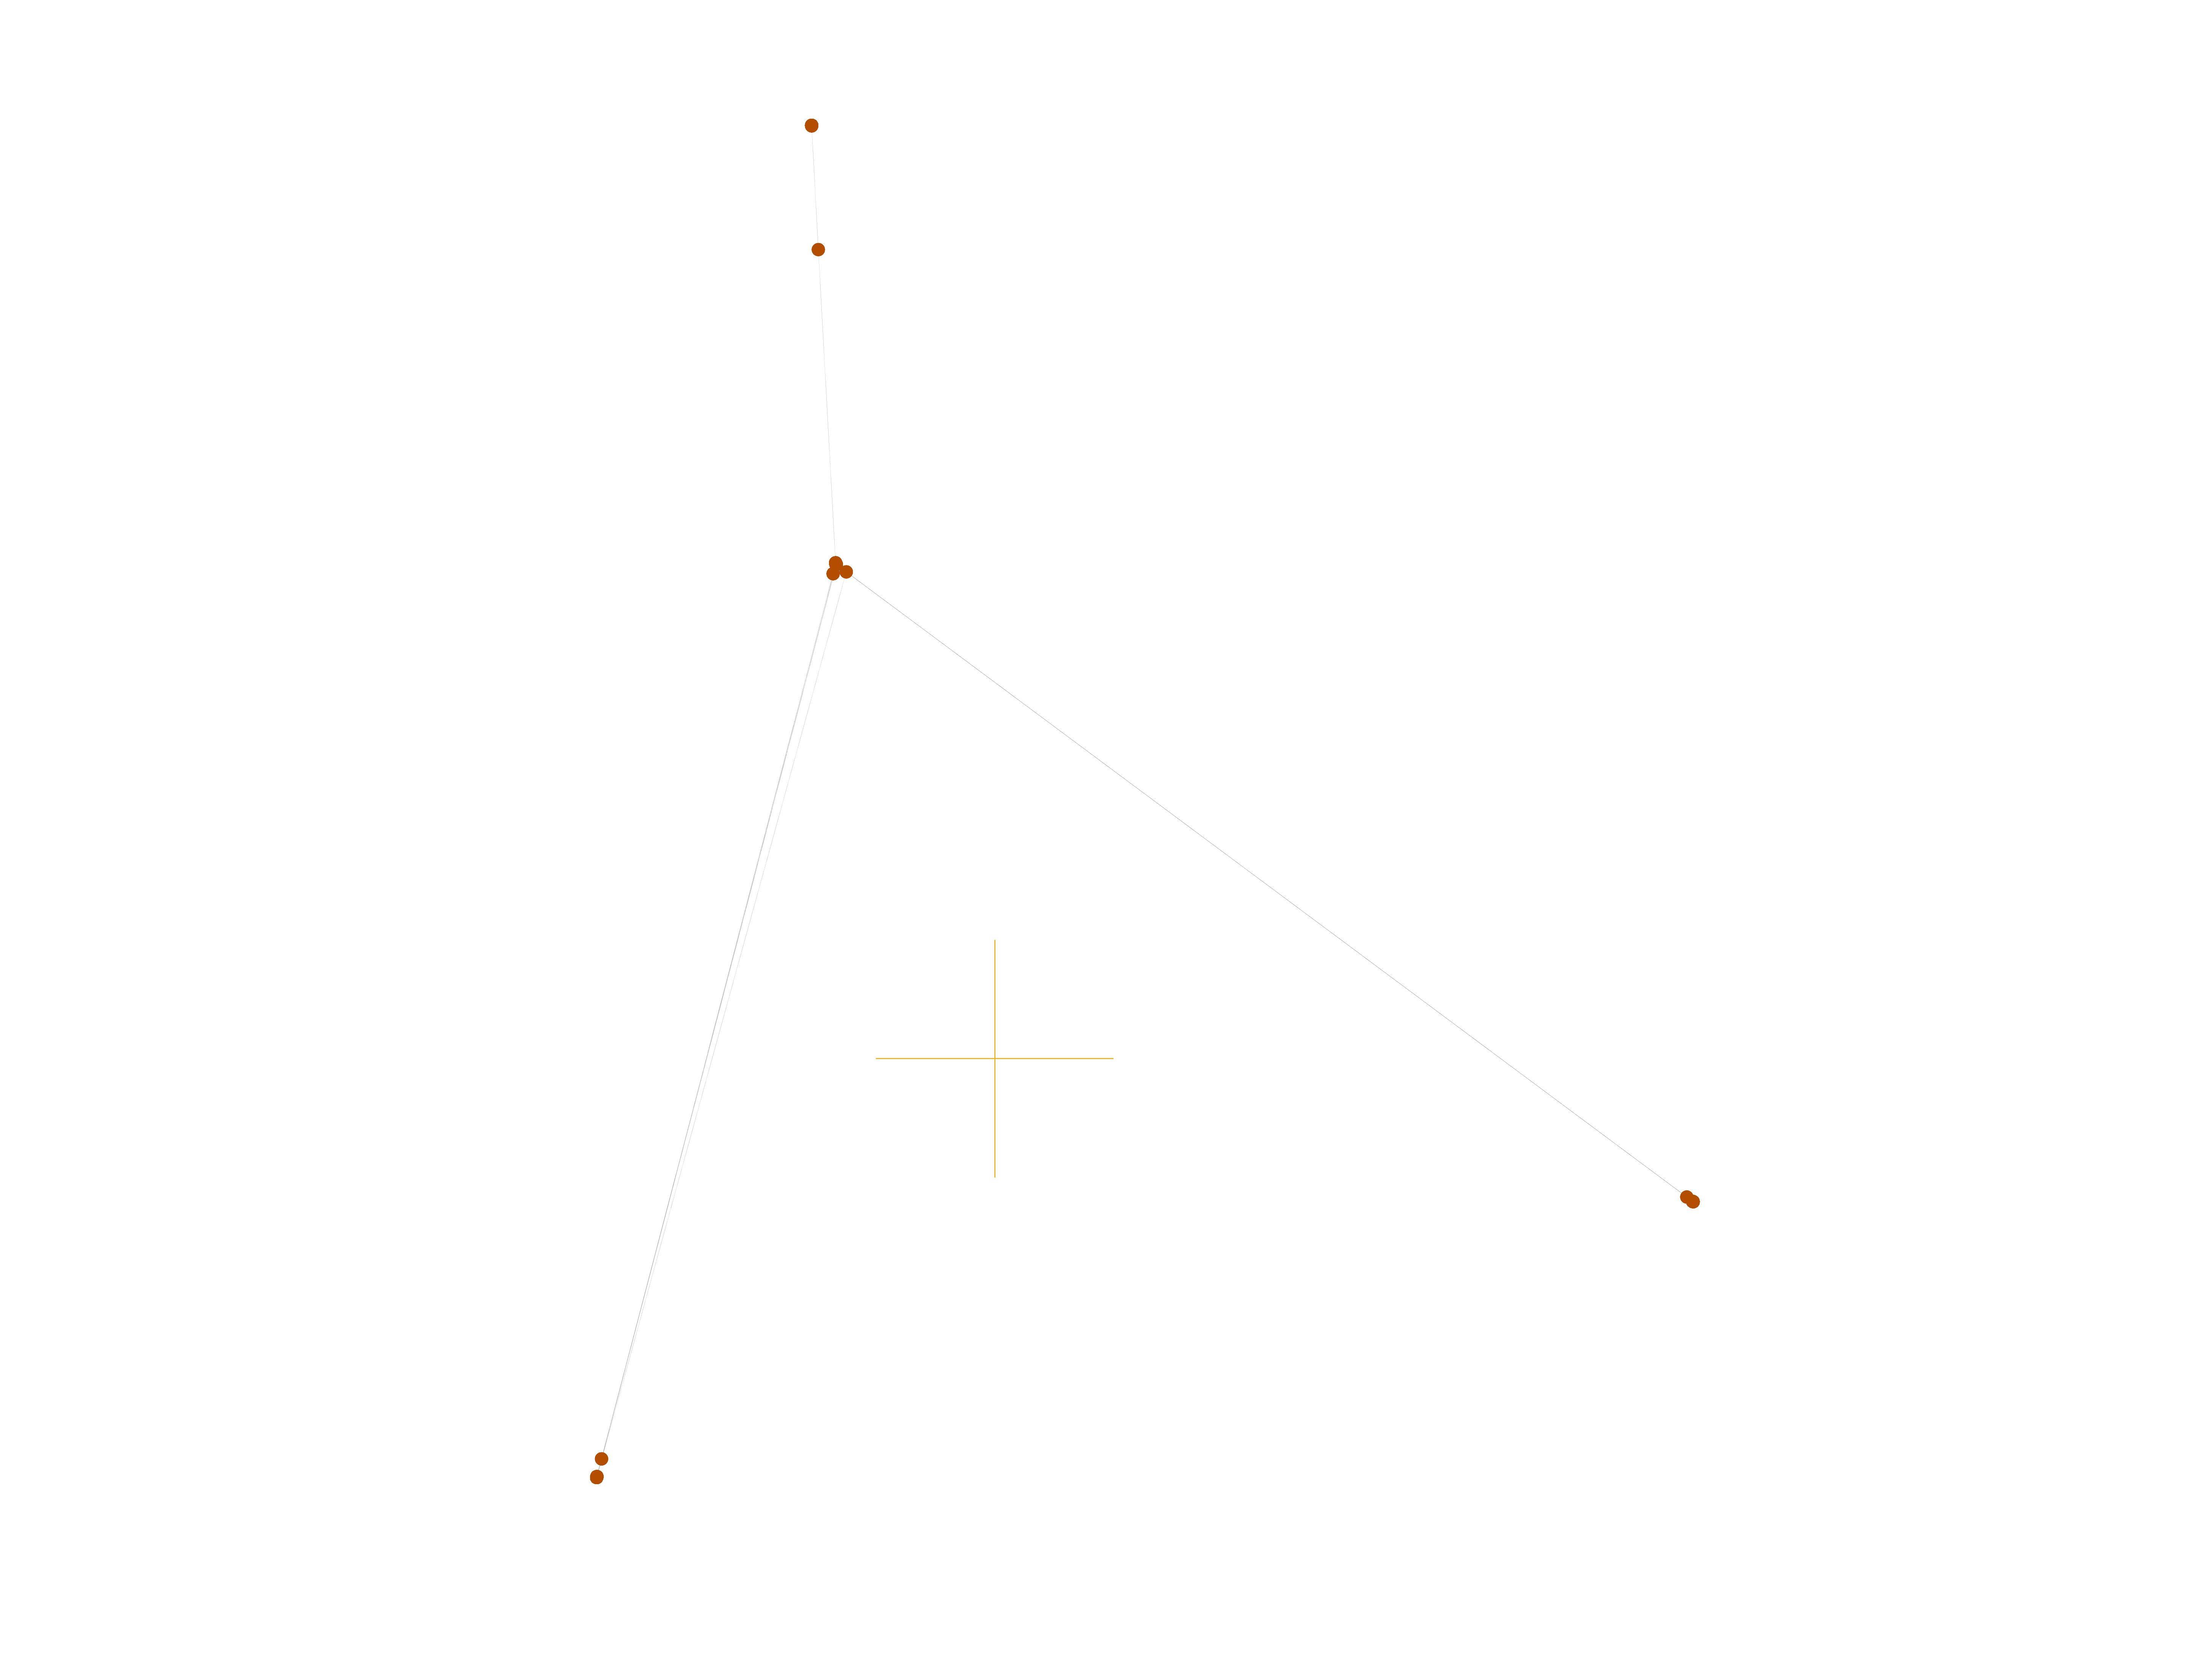
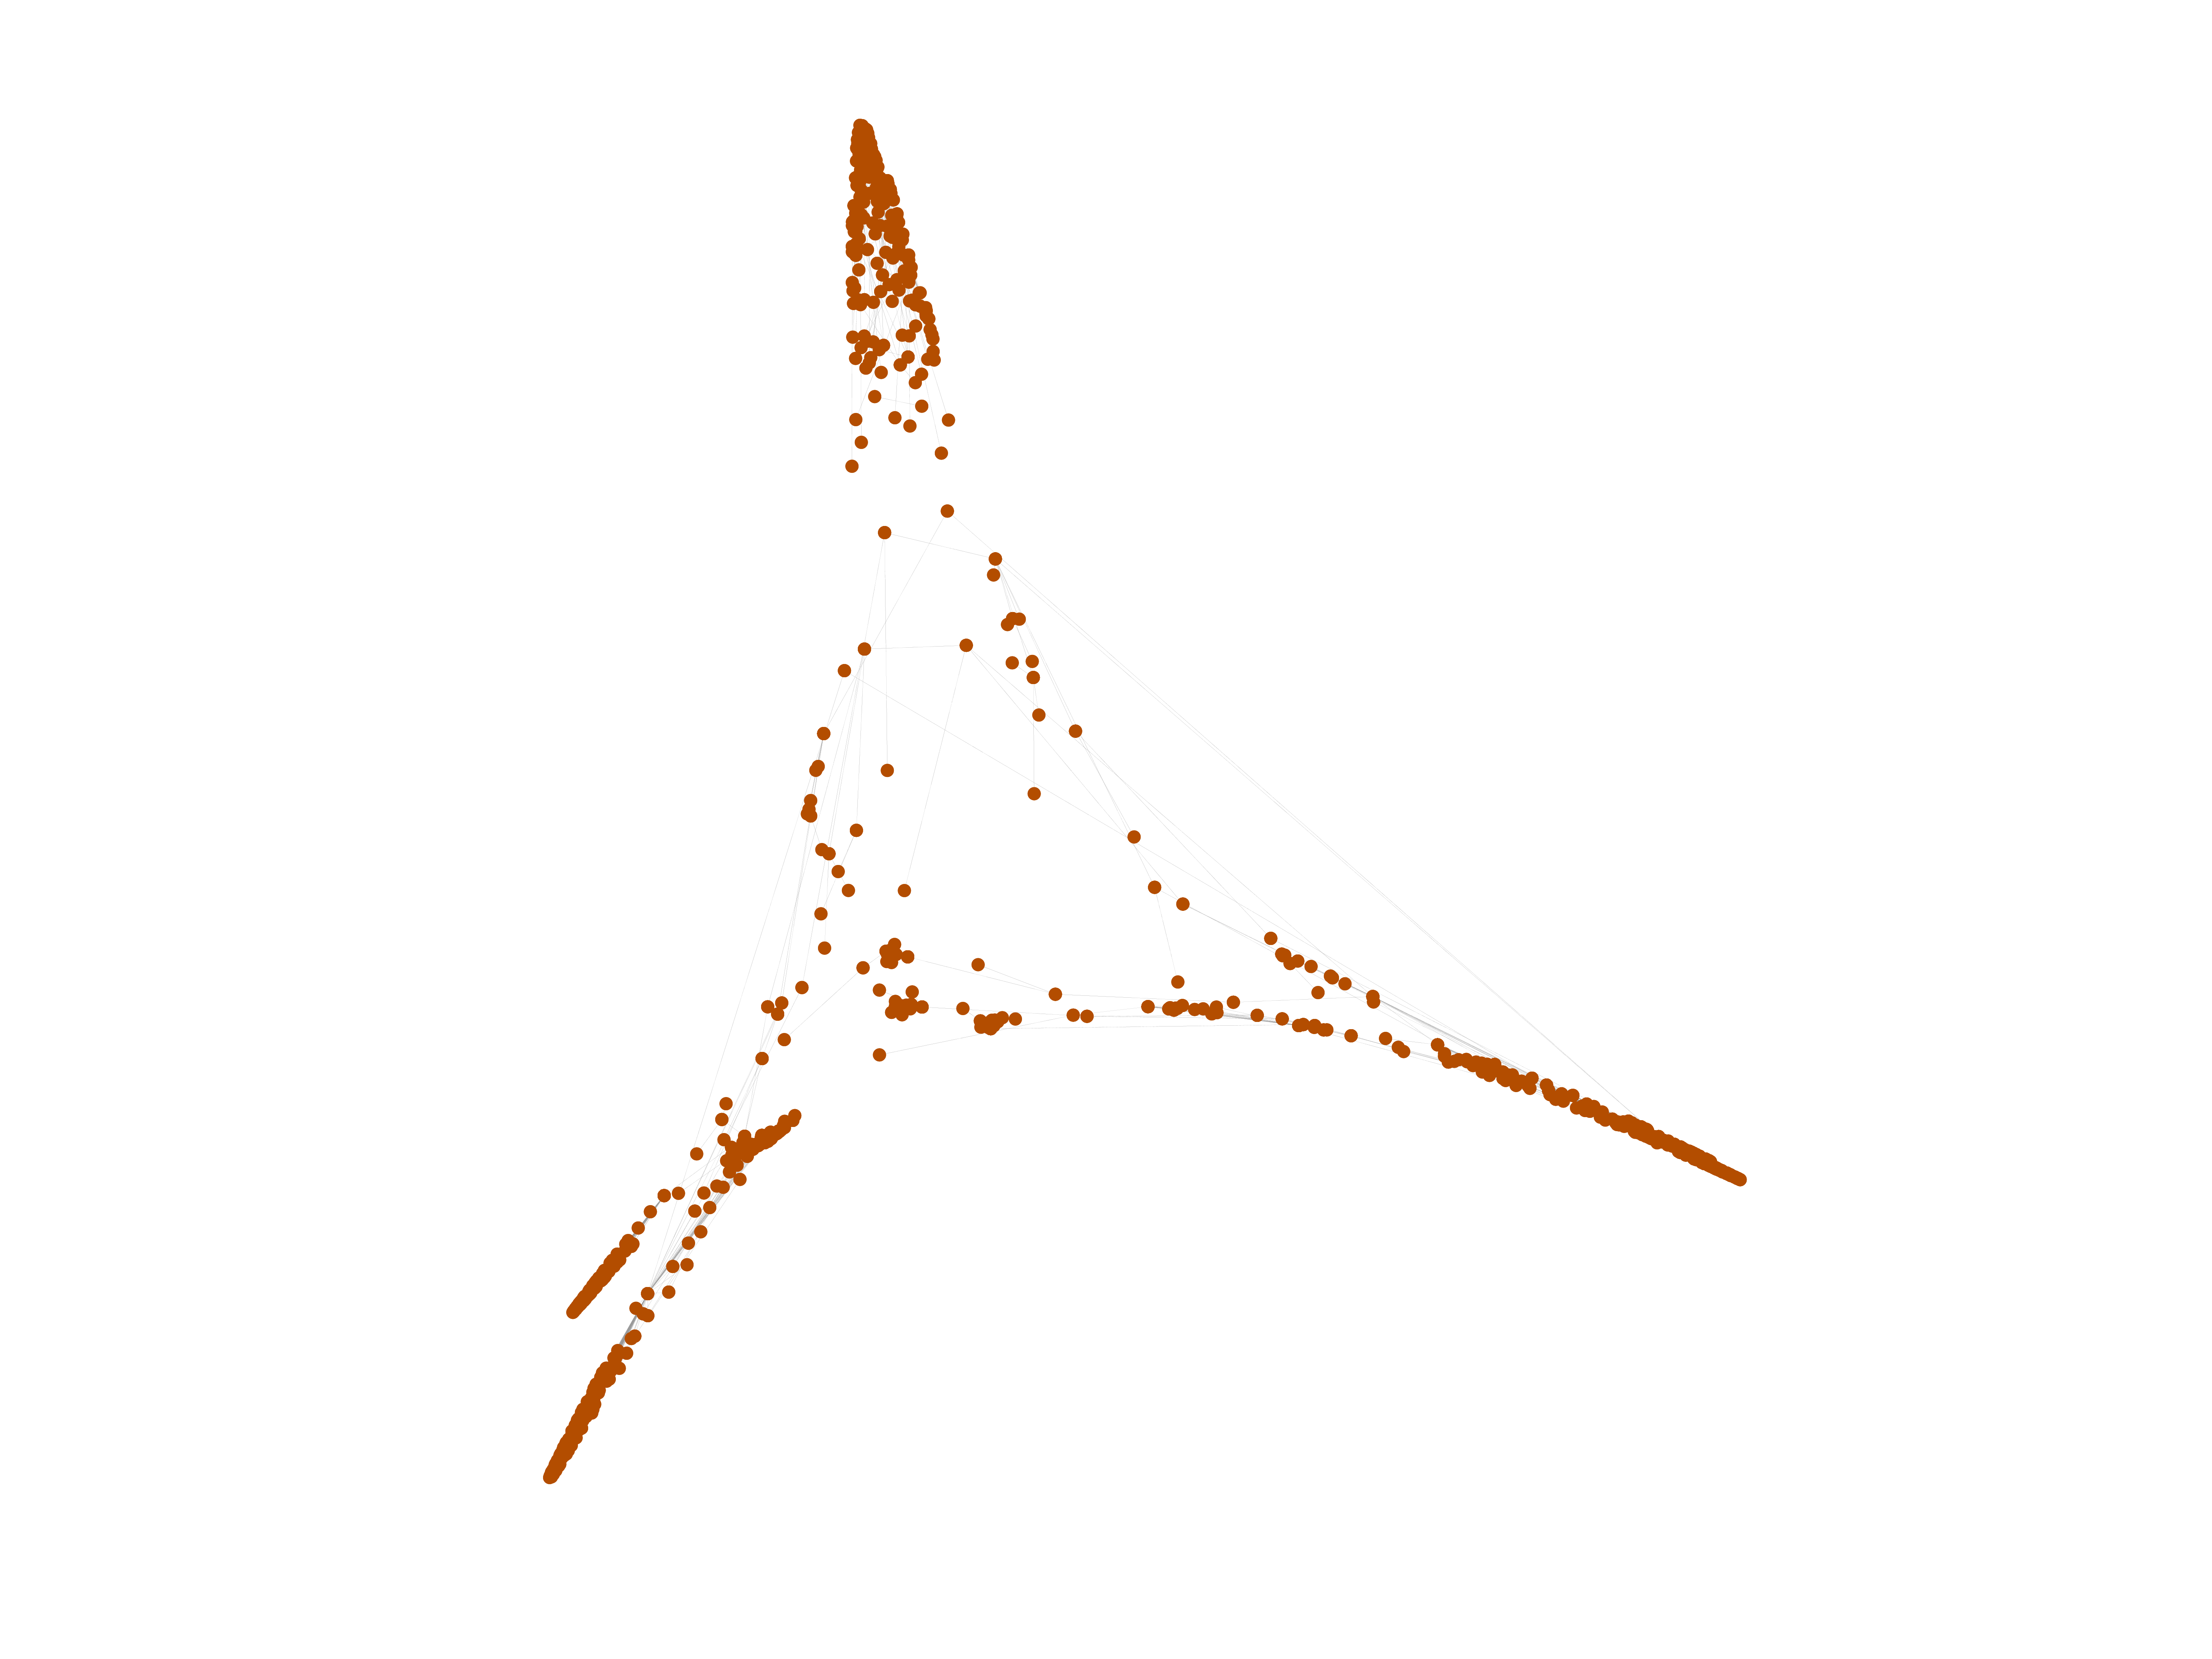
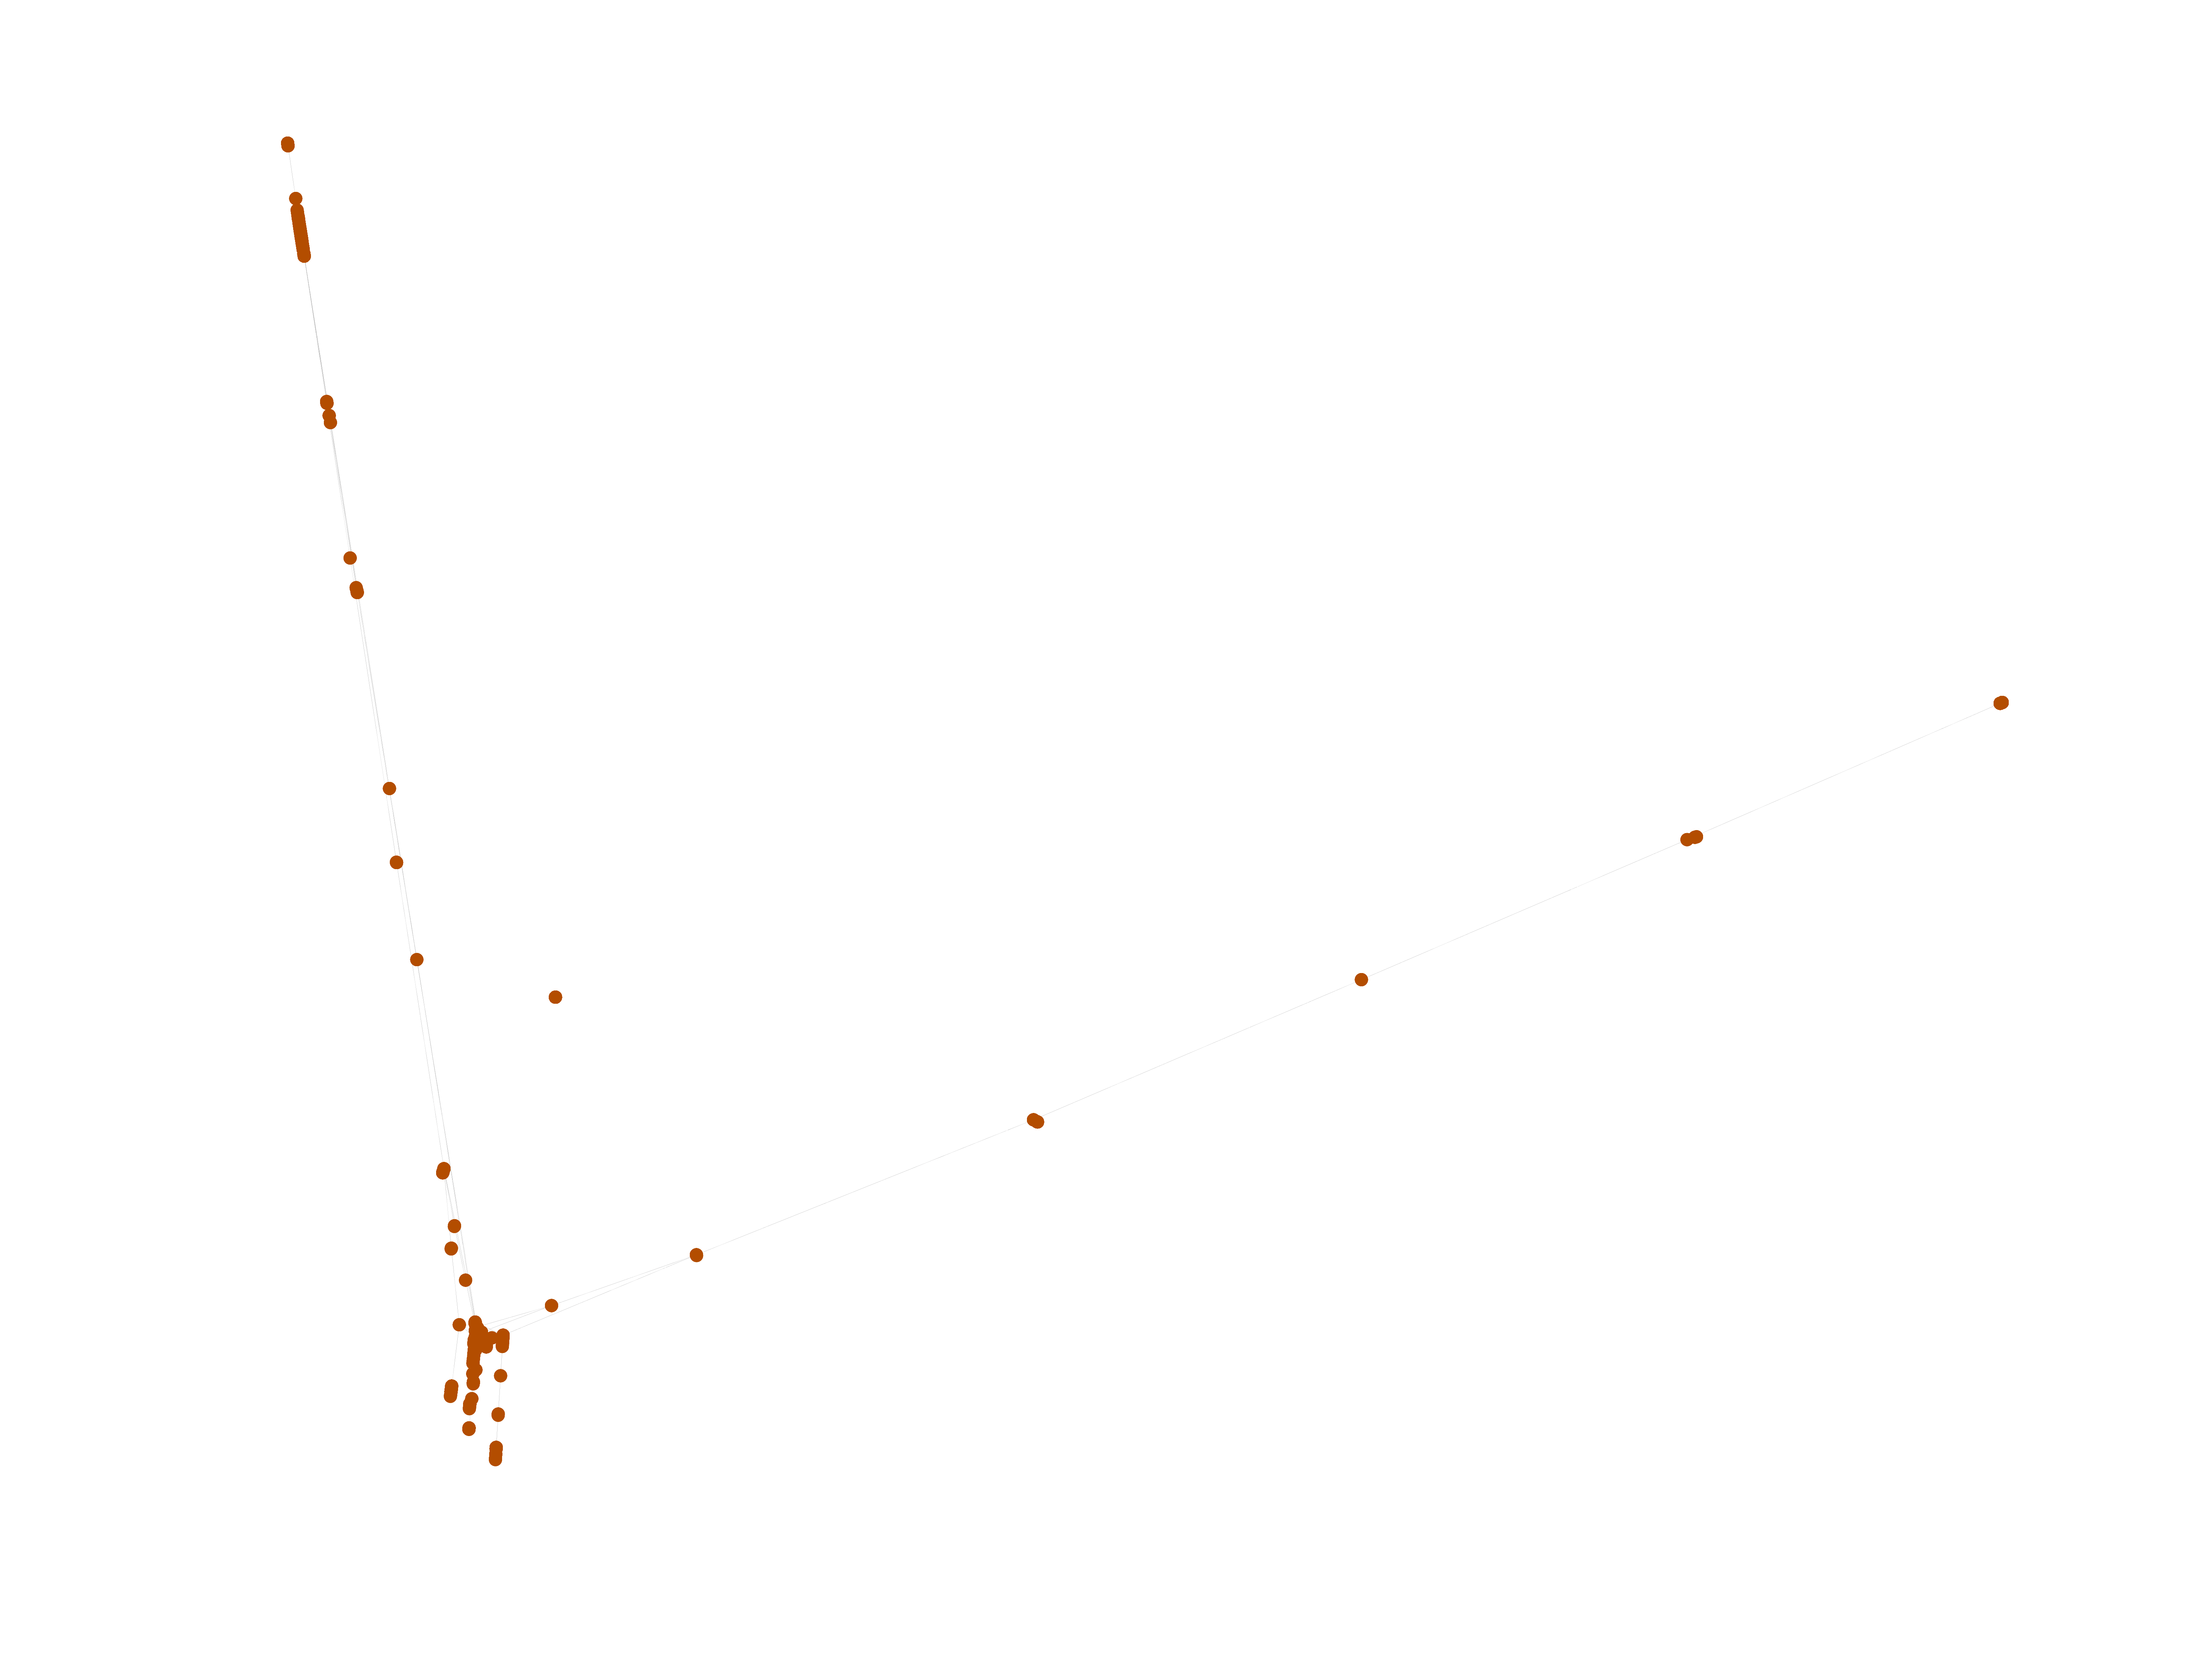
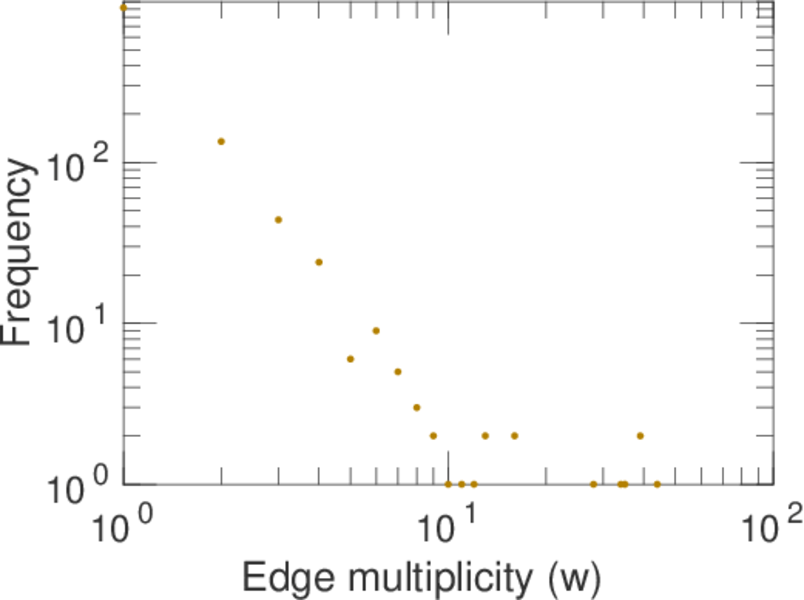
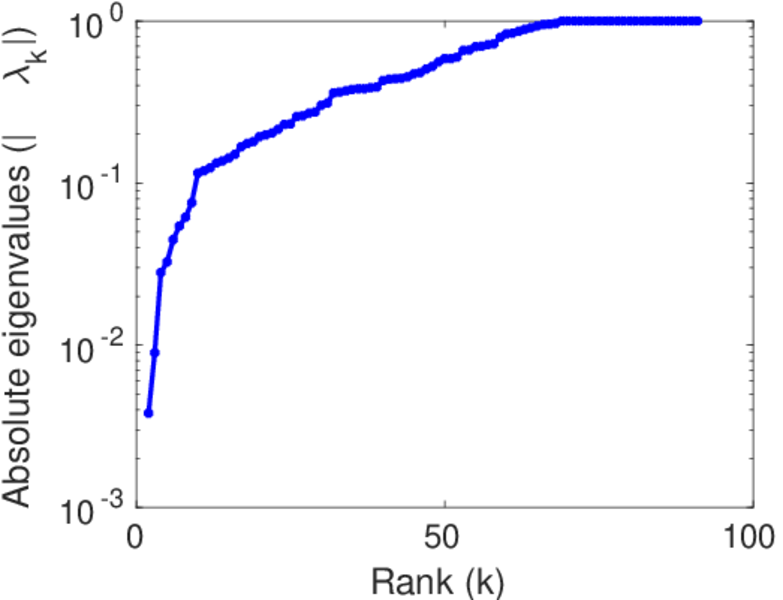
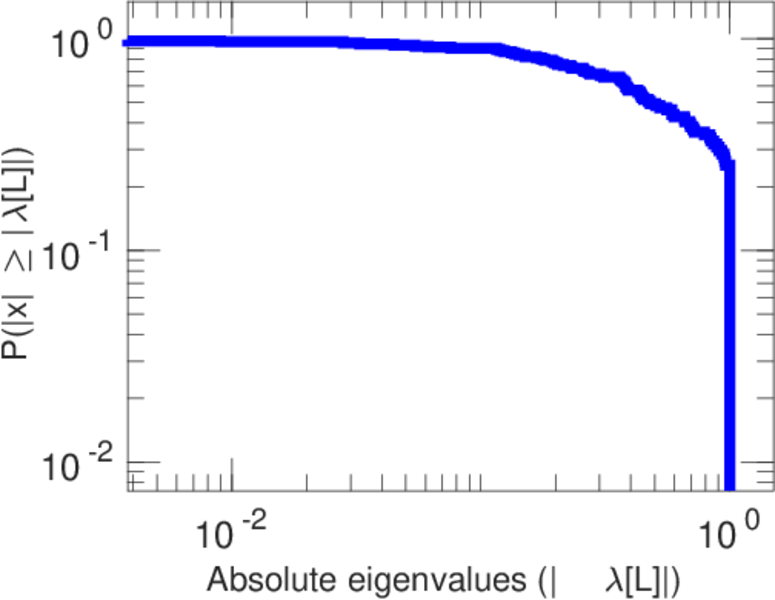
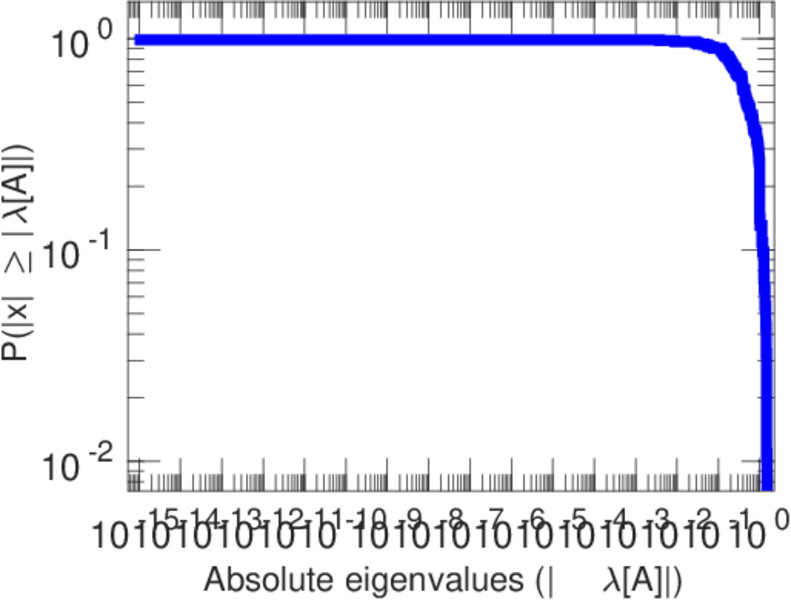
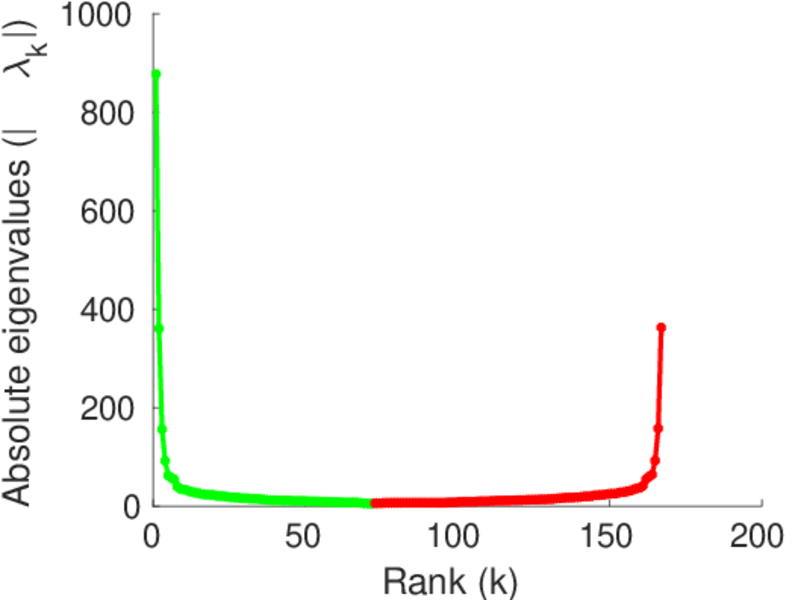
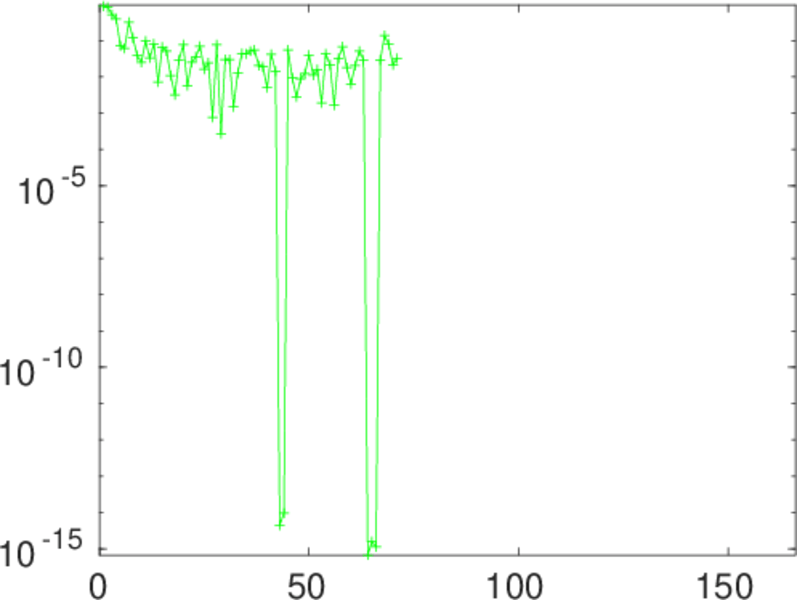
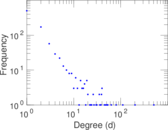
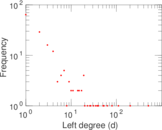
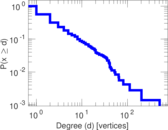
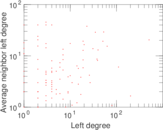
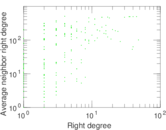
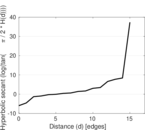
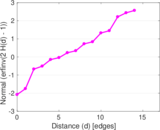
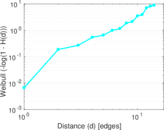
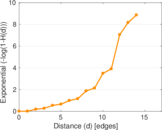
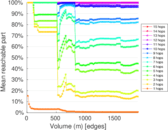
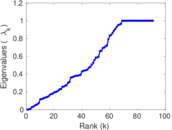
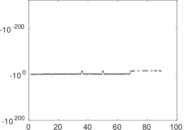
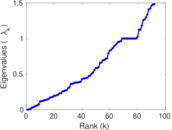
Plots


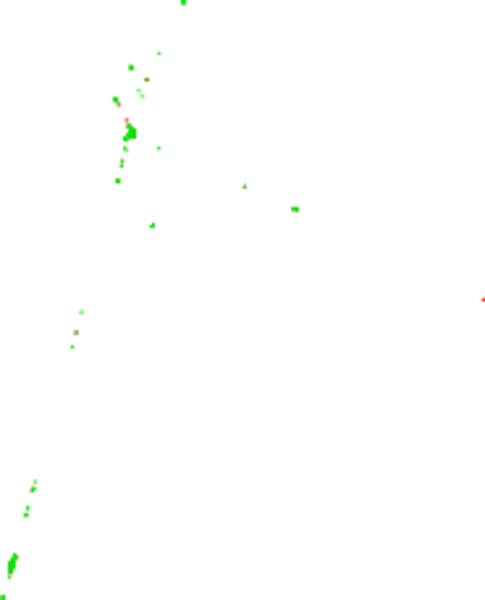
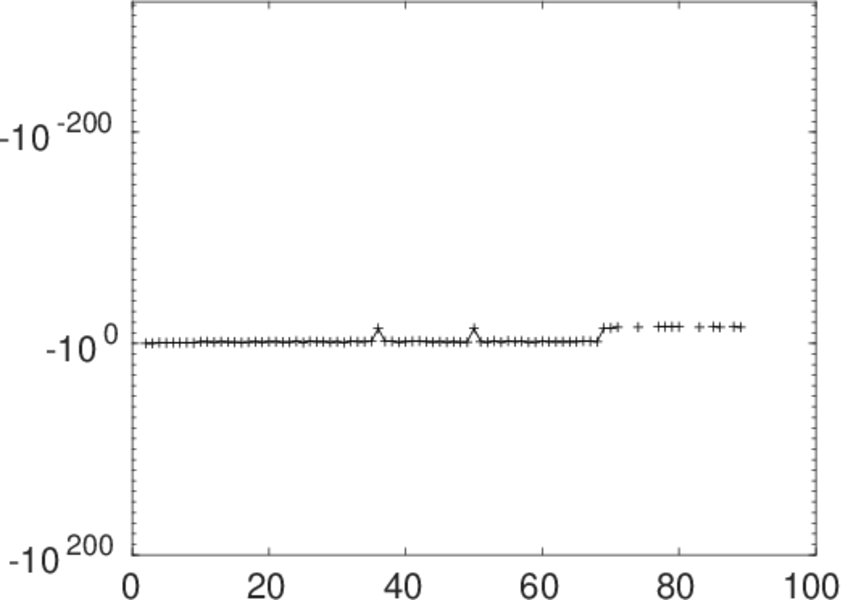
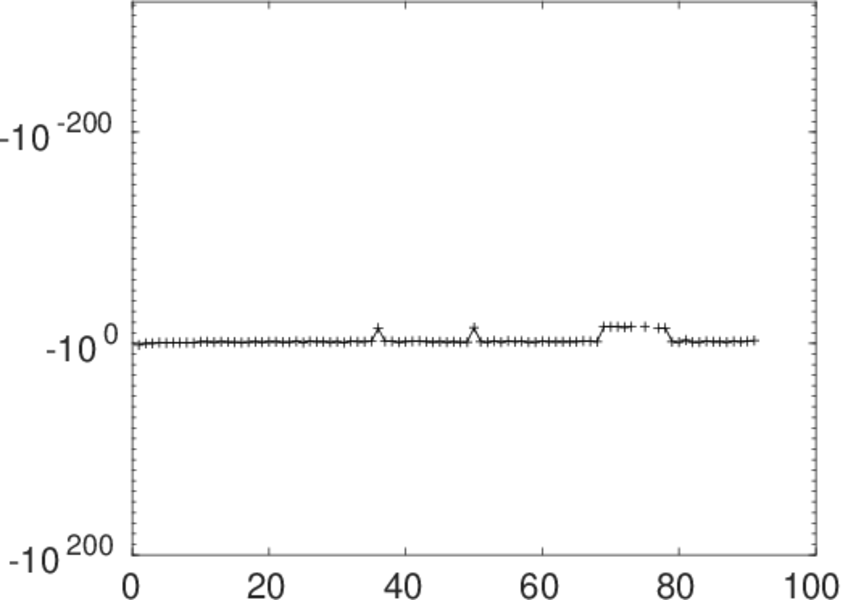
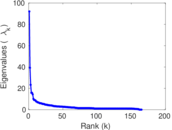
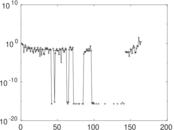
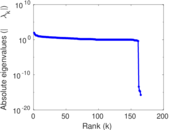
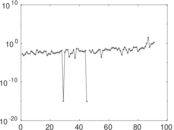
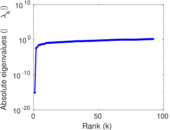
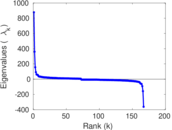
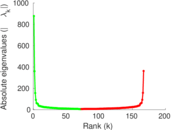
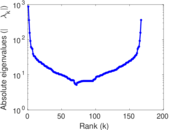
Matrix decompositions plots


Downloads
References
|
[1]
|
Jérôme Kunegis.
KONECT – The Koblenz Network Collection.
In Proc. Int. Conf. on World Wide Web Companion, pages
1343–1350, 2013.
[ http ]
|
|
[2]
|
Wikimedia Foundation.
Wikimedia downloads.
http://dumps.wikimedia.org/, January 2010.
|
 KONECT ‣ Networks ‣
Buy Me a Coffee
KONECT ‣ Networks ‣
Buy Me a Coffee