Wiktionary edits (ku)
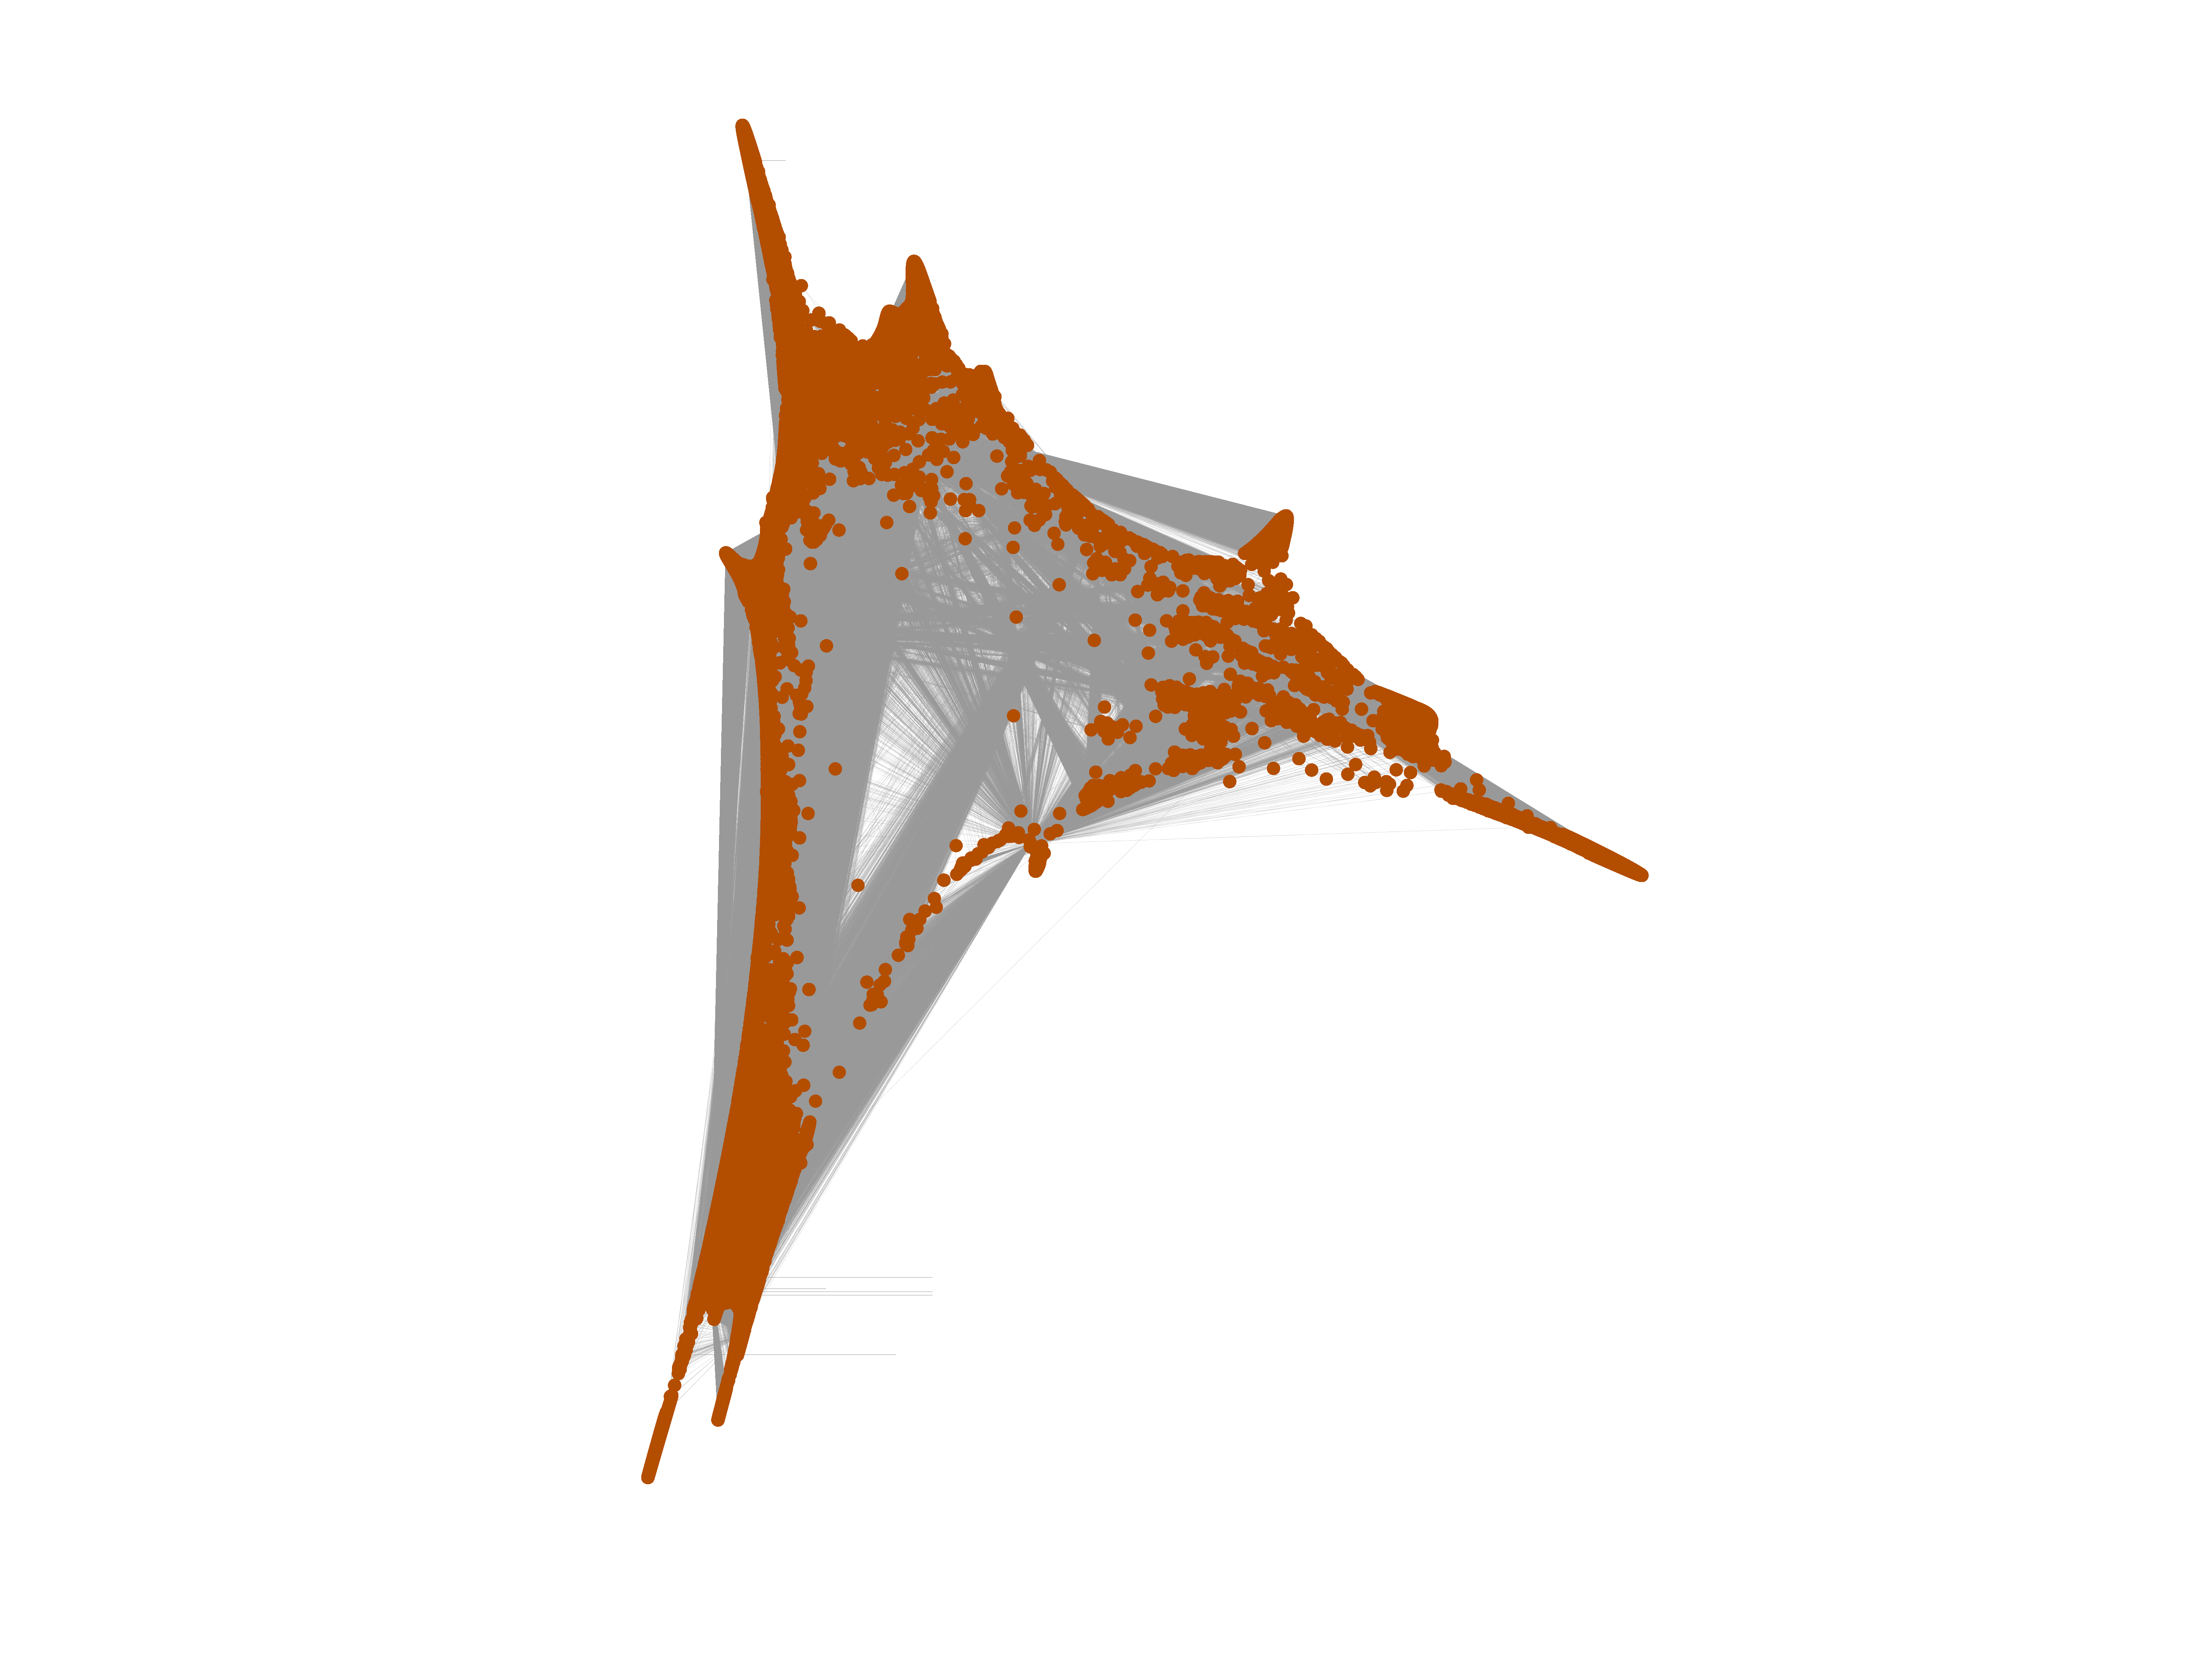
This is the bipartite edit network of the Kurdish Wiktionary. It contains users
and pages from the Kurdish Wiktionary, connected by edit events. Each edge
represents an edit. The dataset includes the timestamp of each edit.
Metadata
Statistics
| Size | n = | 530,893
|
| Left size | n1 = | 672
|
| Right size | n2 = | 530,221
|
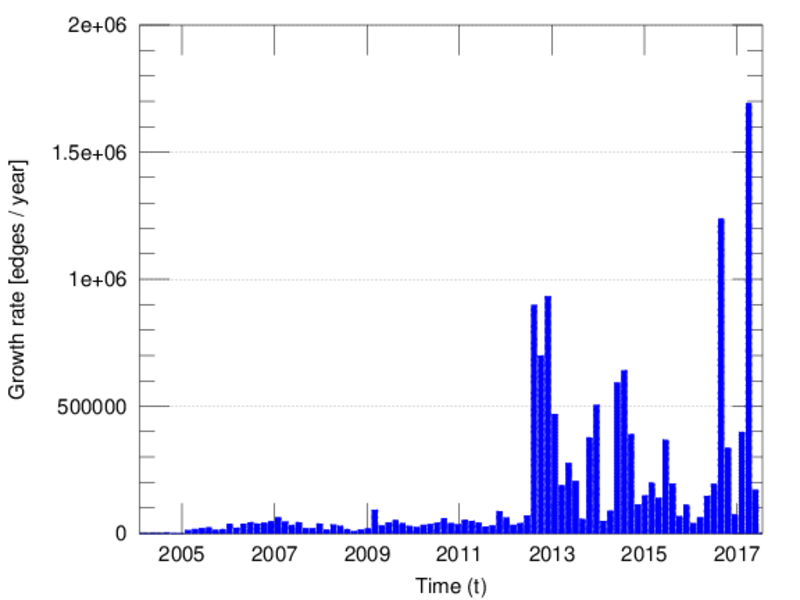
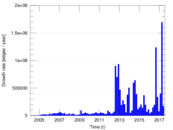
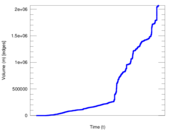
| Volume | m = | 2,071,885
|
| Unique edge count | m̿ = | 1,293,446
|
| Wedge count | s = | 111,026,283,459
|
| Cross count | x = | 6.671 91 × 1020
|
| Square count | q = | 35,235,448,060
|
| 4-Tour count | T4 = | 725,992,858,328
|
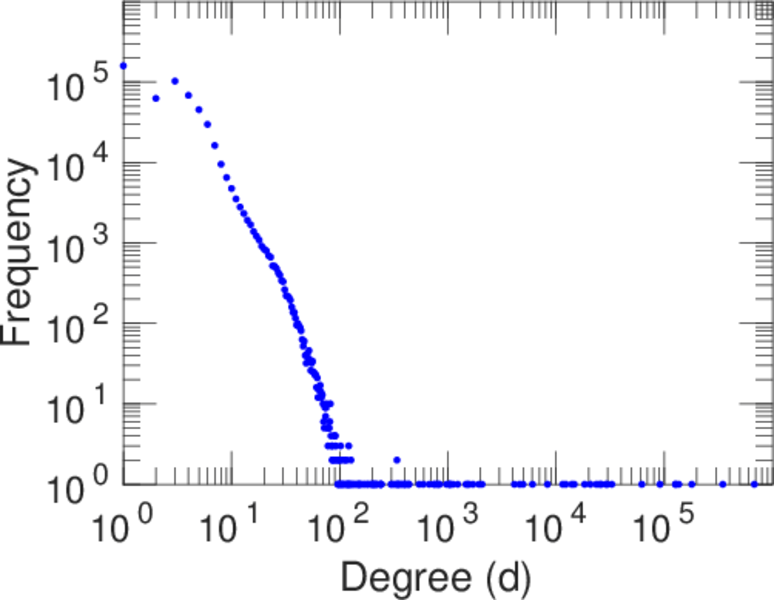
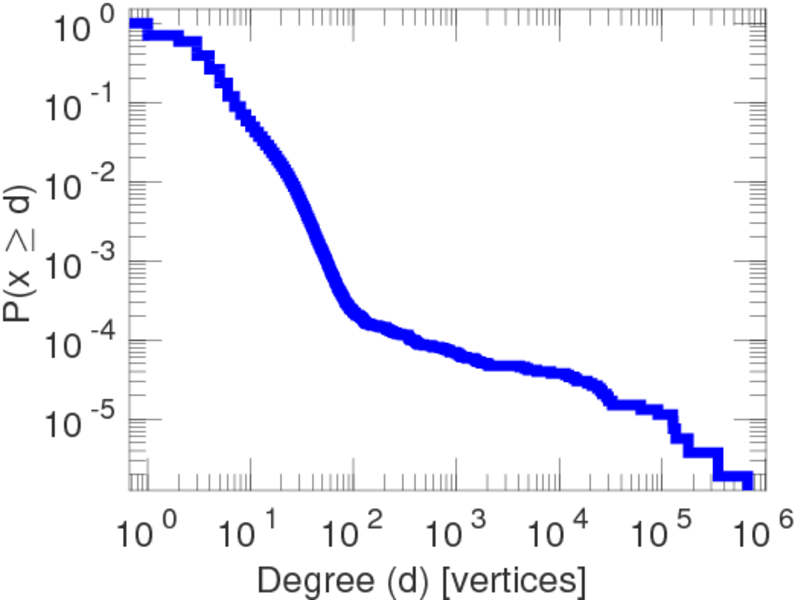
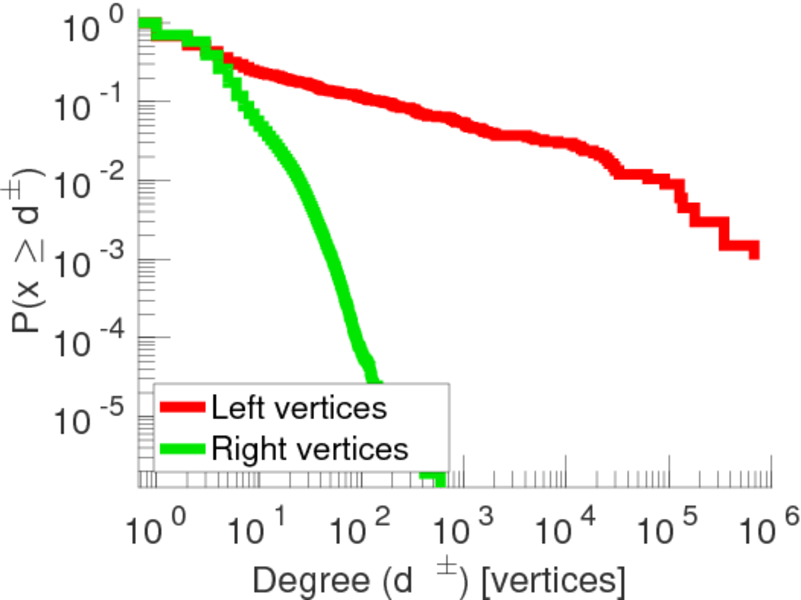
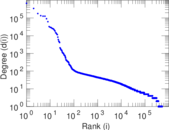
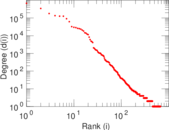
| Maximum degree | dmax = | 680,878
|
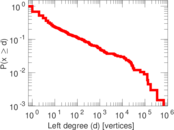
| Maximum left degree | d1max = | 680,878
|
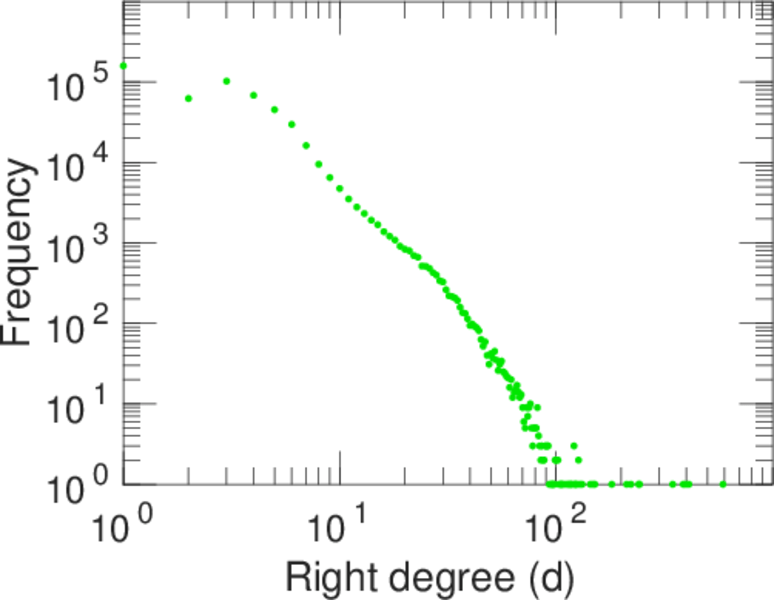
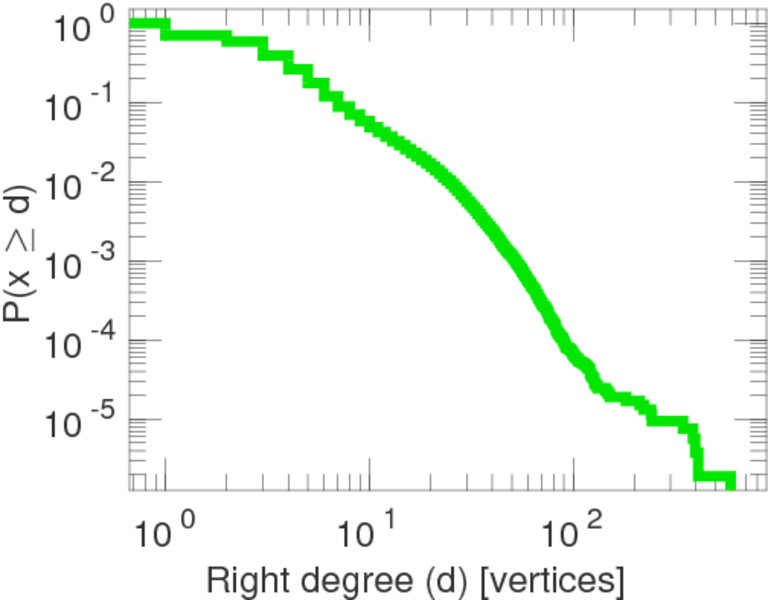
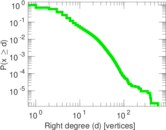
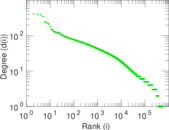
| Maximum right degree | d2max = | 591
|
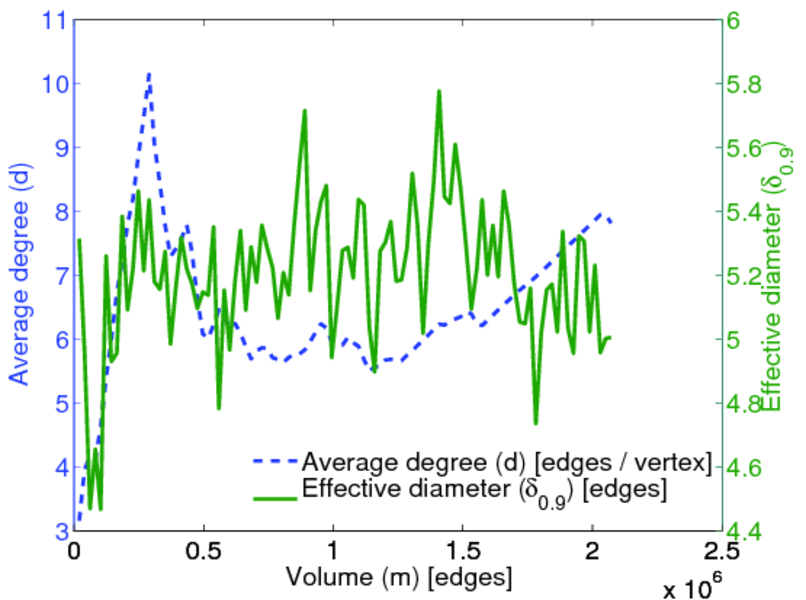
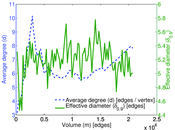
| Average degree | d = | 7.805 28
|
| Average left degree | d1 = | 3,083.16
|
| Average right degree | d2 = | 3.907 59
|
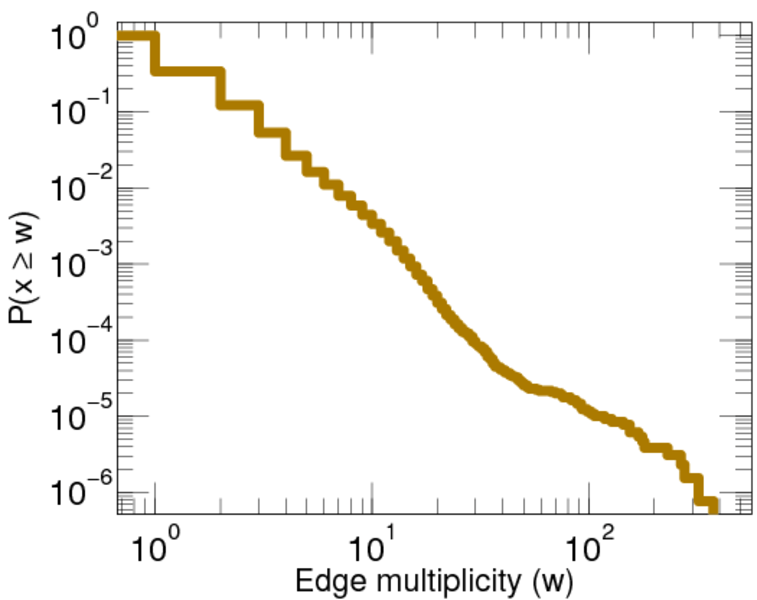
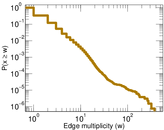
| Average edge multiplicity | m̃ = | 1.601 83
|
| Size of LCC | N = | 529,942
|
| Diameter | δ = | 12
|
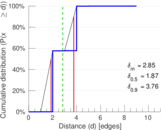
| 50-Percentile effective diameter | δ0.5 = | 1.867 26
|
| 90-Percentile effective diameter | δ0.9 = | 3.764 42
|
| Median distance | δM = | 2
|
| Mean distance | δm = | 2.846 91
|
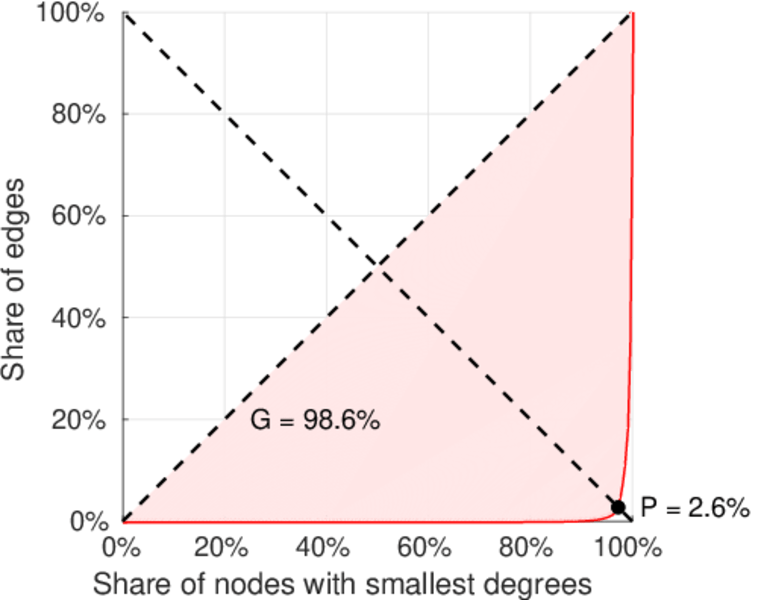
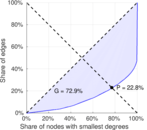
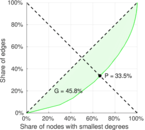
| Gini coefficient | G = | 0.728 943
|
| Balanced inequality ratio | P = | 0.227 795
|
| Left balanced inequality ratio | P1 = | 0.025 768 3
|
| Right balanced inequality ratio | P2 = | 0.335 243
|
| Relative edge distribution entropy | Her = | 0.638 465
|
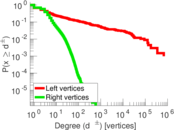
| Tail power law exponent | γt = | 3.451 00
|
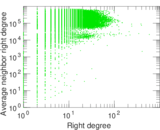
| Degree assortativity | ρ = | −0.395 964
|
| Degree assortativity p-value | pρ = | 0.000 00
|
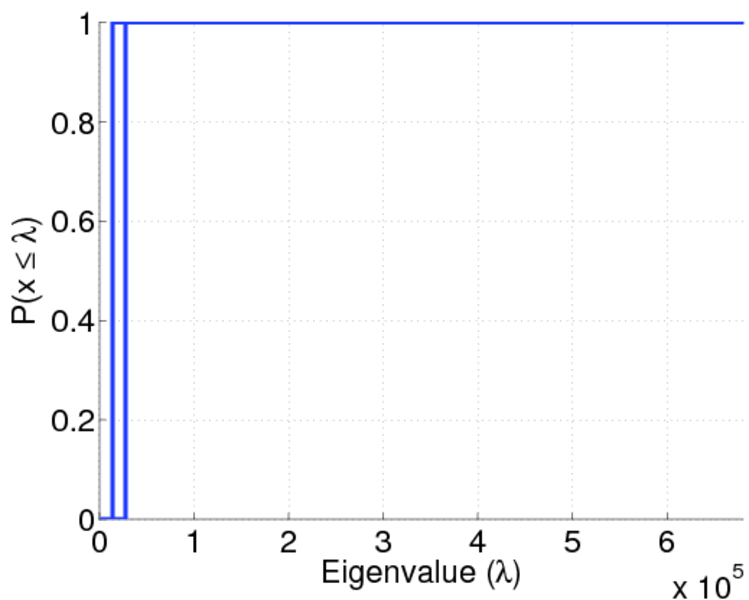
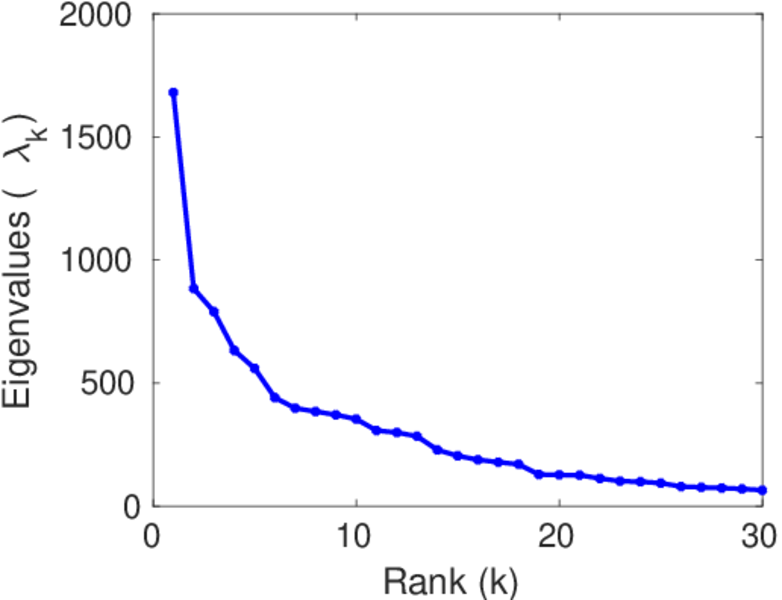
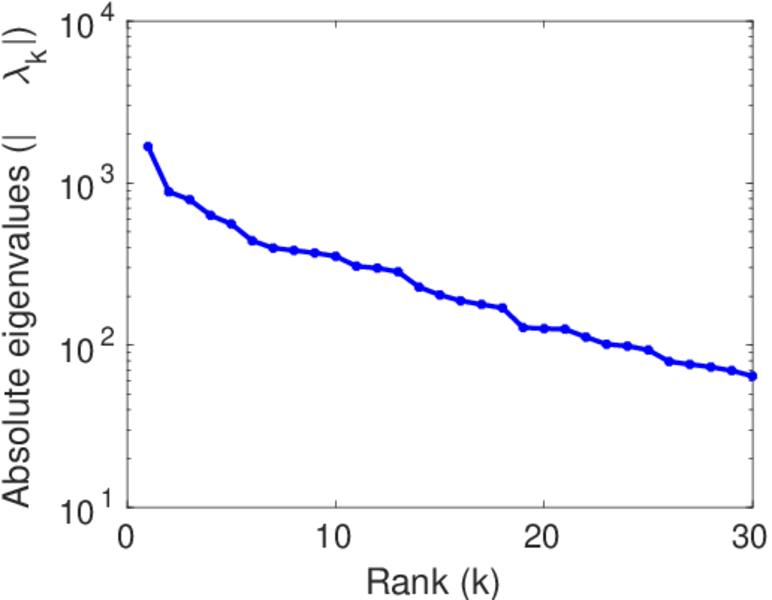
| Spectral norm | α = | 1,679.68
|
| Algebraic connectivity | a = | 0.029 311 7
|
| Spectral separation | |λ1[A] / λ2[A]| = | 1.901 62
|
| Controllability | C = | 528,921
|
| Relative controllability | Cr = | 0.997 511
|
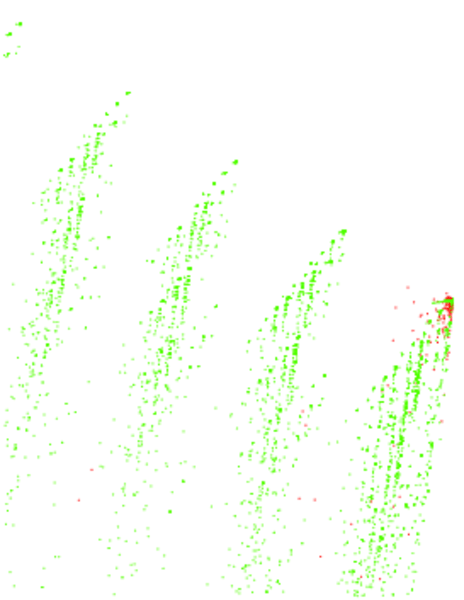
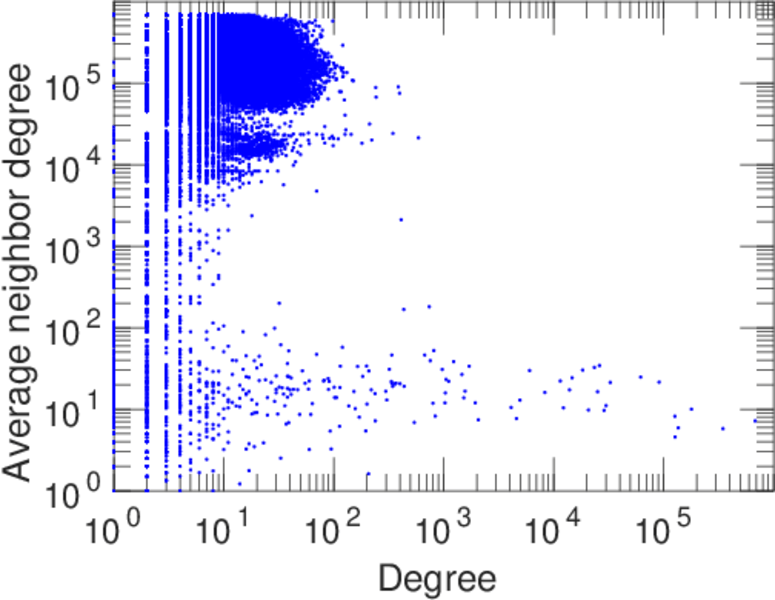
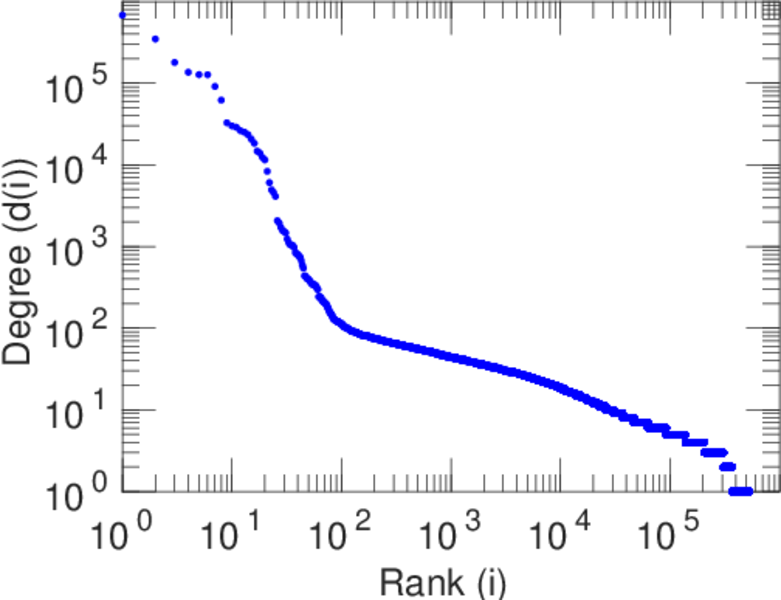
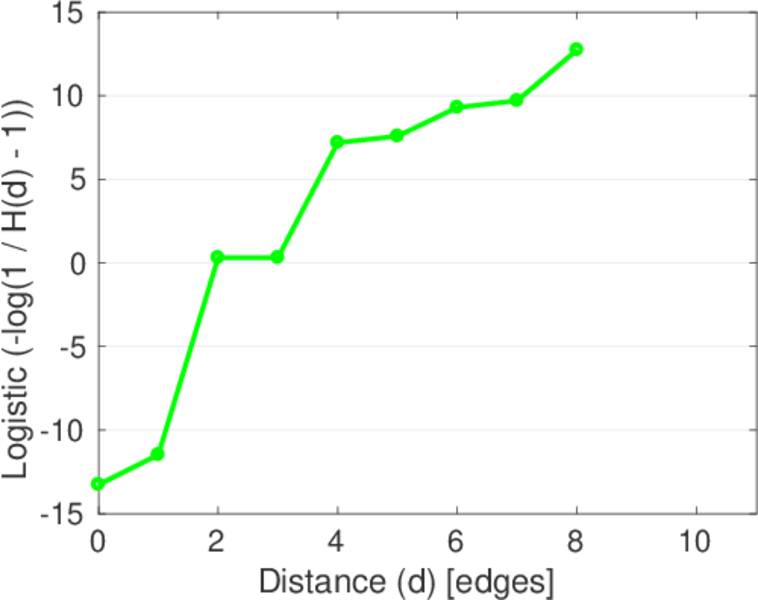
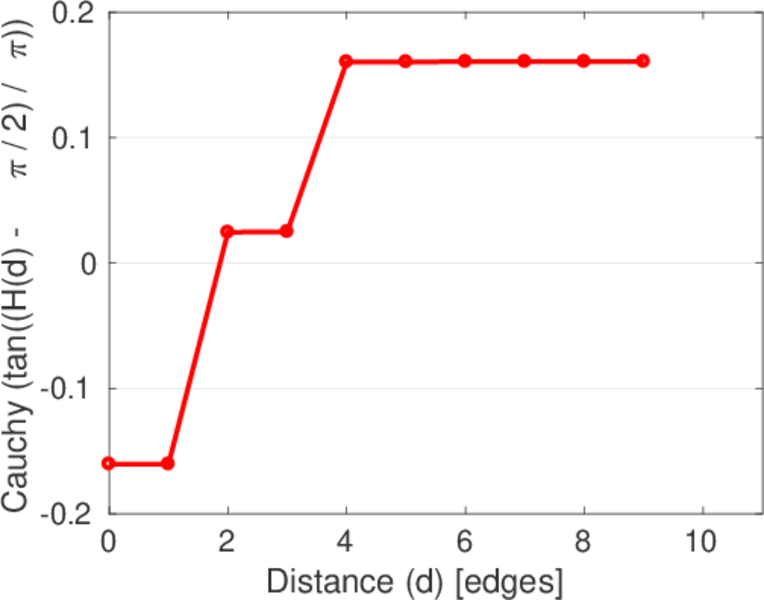
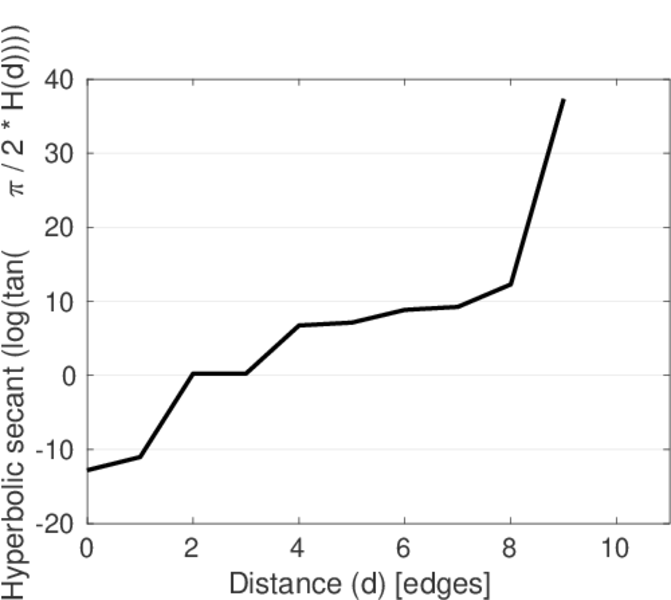
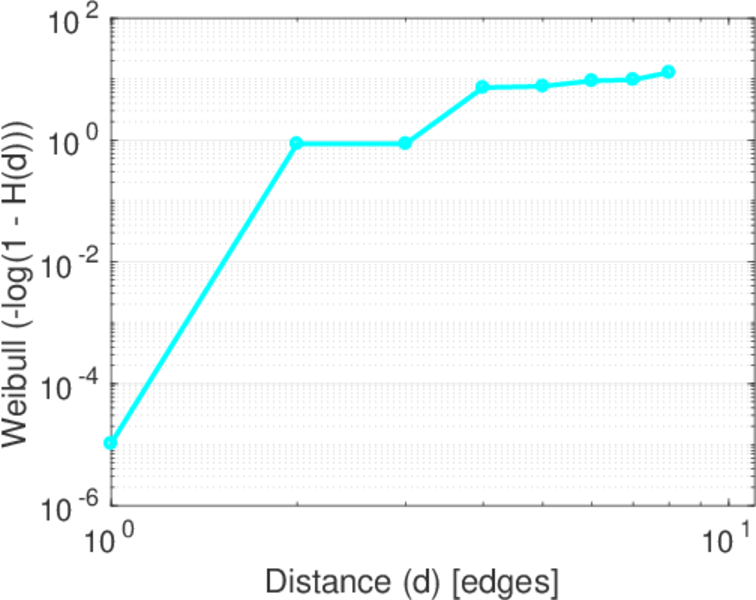
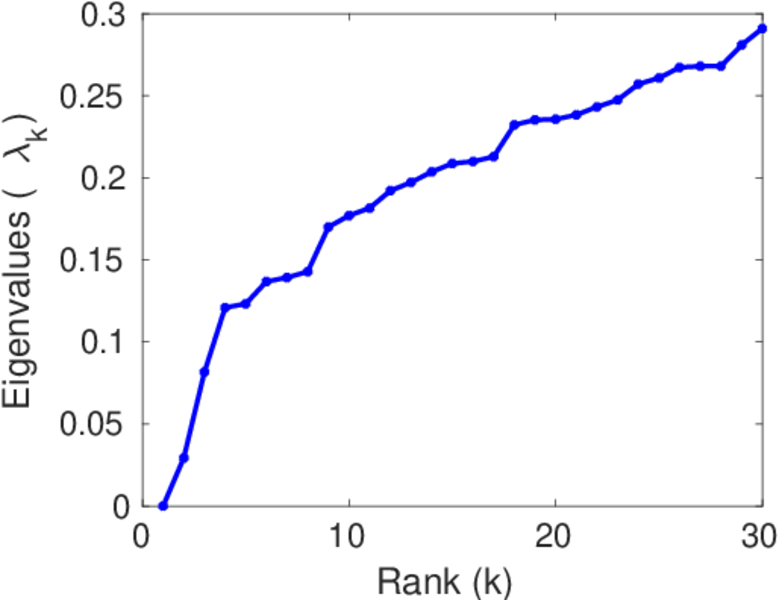
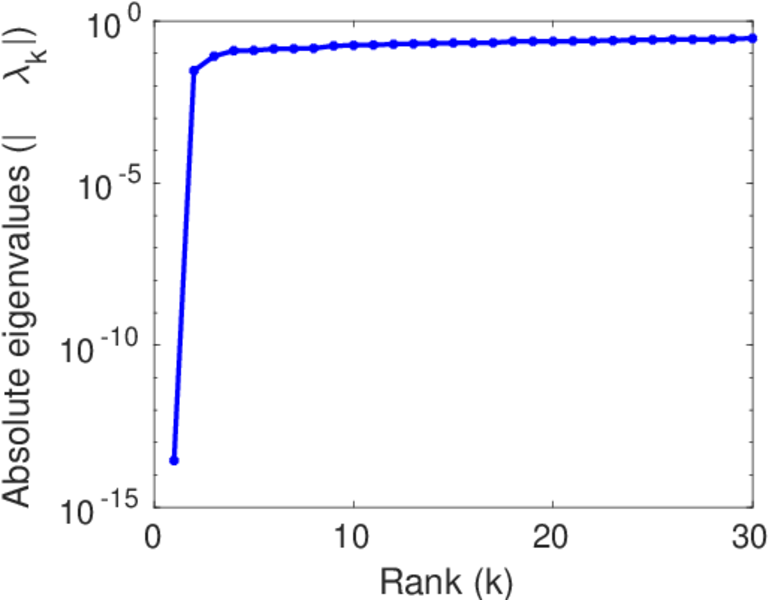
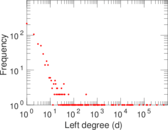
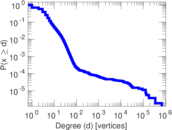
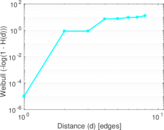
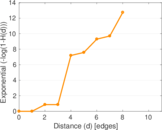
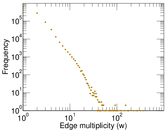
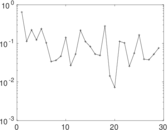
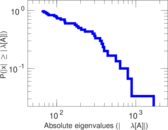
Plots


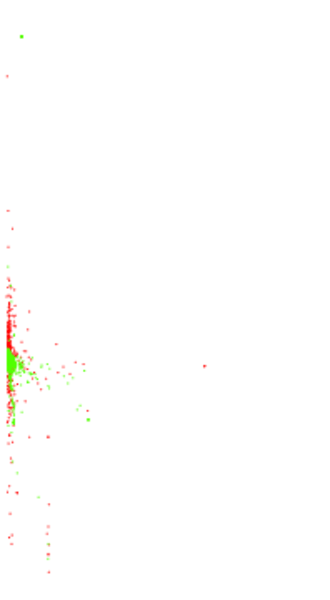
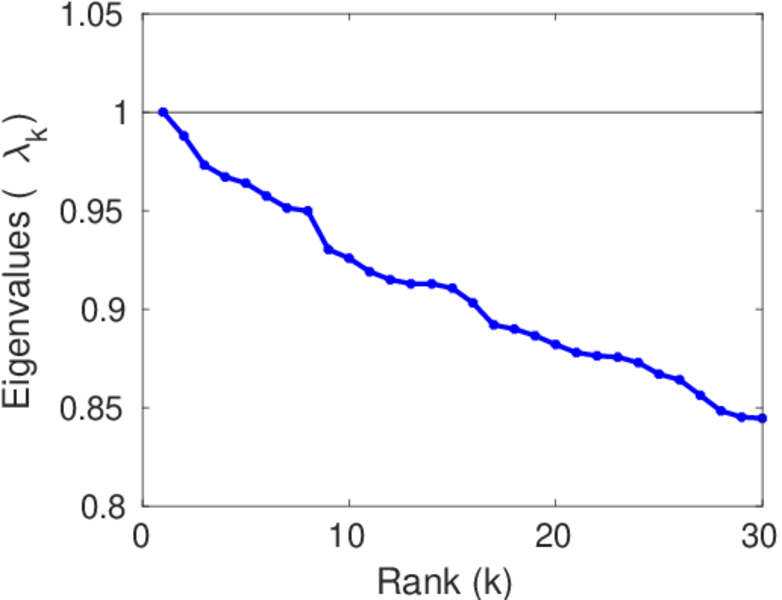
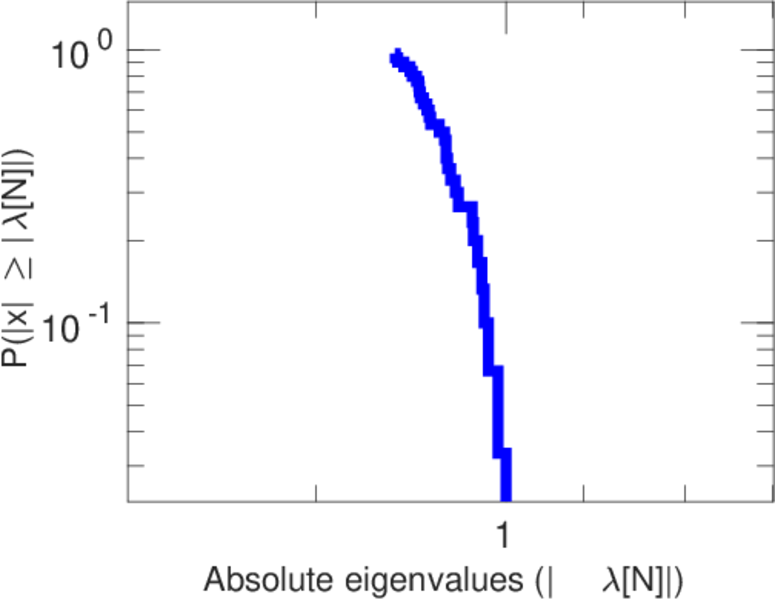
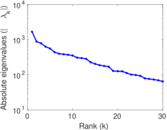
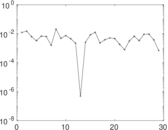
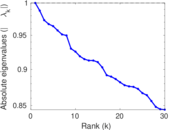
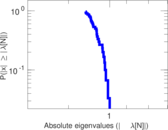
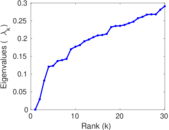
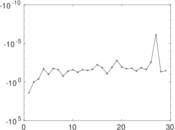
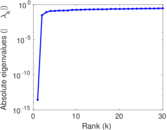
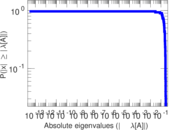
Matrix decompositions plots


Downloads
References
|
[1]
|
Jérôme Kunegis.
KONECT – The Koblenz Network Collection.
In Proc. Int. Conf. on World Wide Web Companion, pages
1343–1350, 2013.
[ http ]
|
|
[2]
|
Wikimedia Foundation.
Wikimedia downloads.
http://dumps.wikimedia.org/, January 2010.
|
 KONECT ‣ Networks ‣
Buy Me a Coffee
KONECT ‣ Networks ‣
Buy Me a Coffee