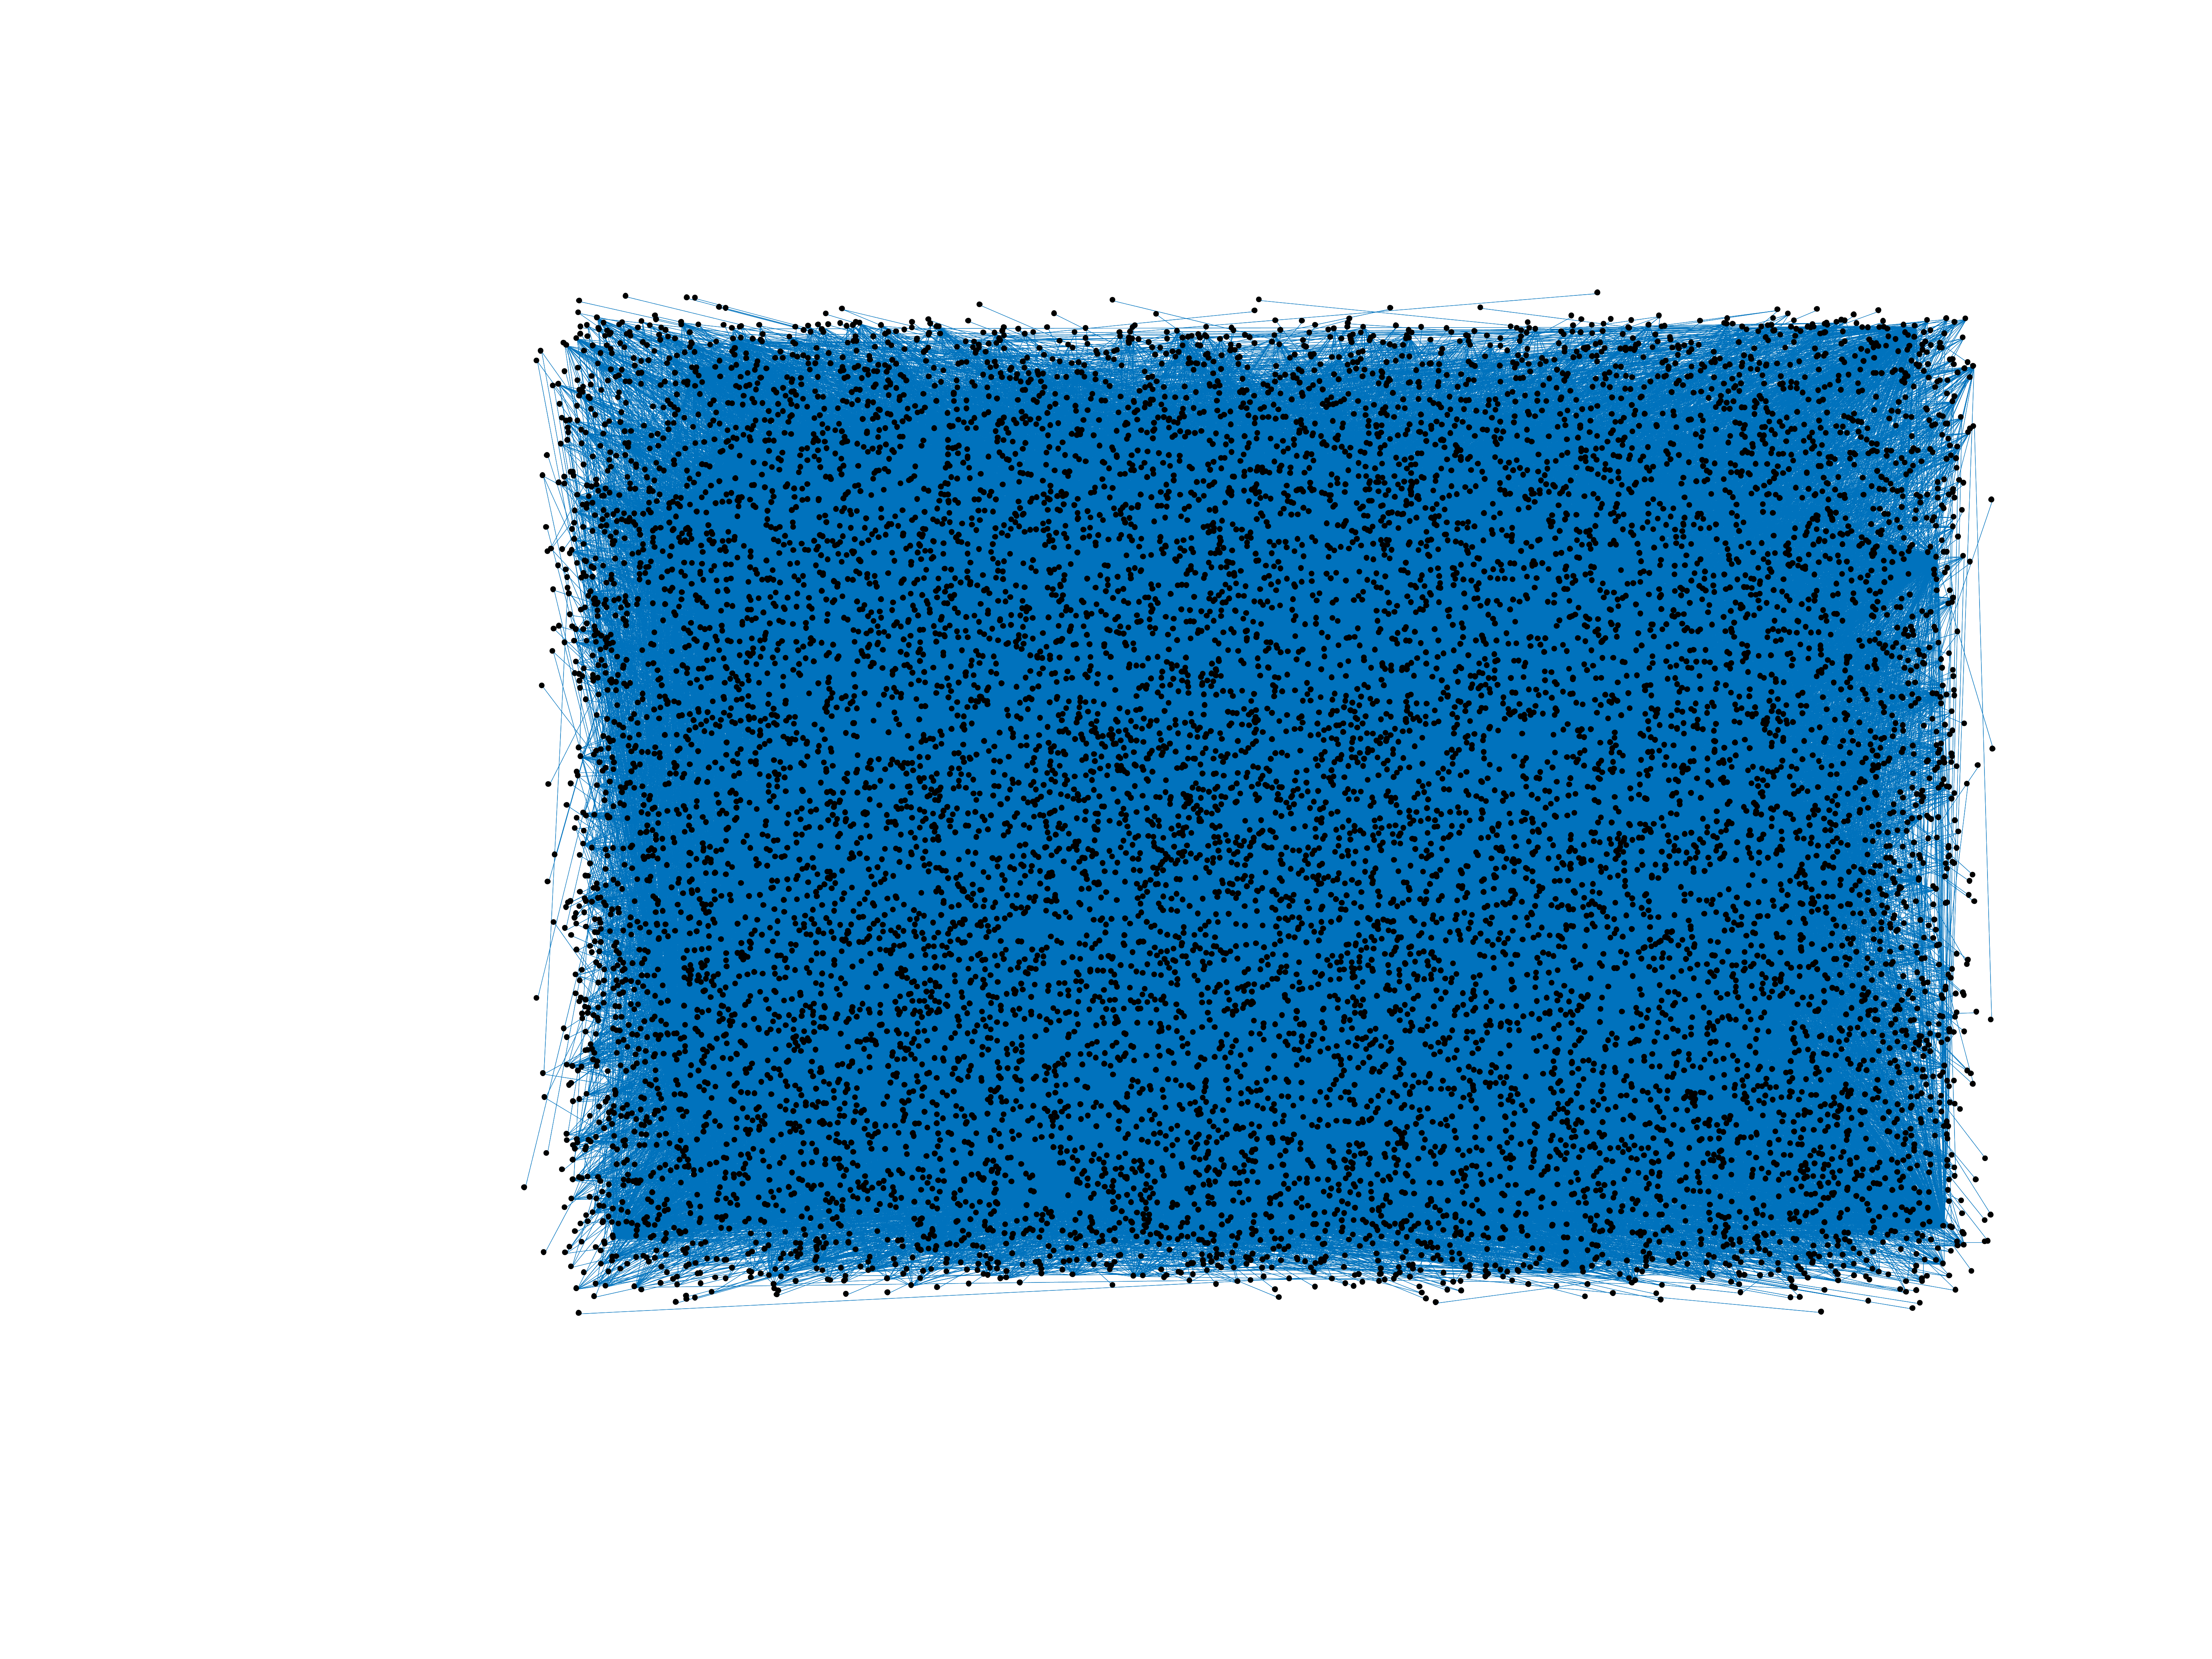
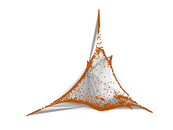
Wikipedia edits (kv)
This is the bipartite edit network of the Komi Wikipedia. It contains users and
pages from the Komi Wikipedia, connected by edit events. Each edge represents
an edit. The dataset includes the timestamp of each edit.
Metadata
Statistics
| Size | n = | 12,240
|
| Left size | n1 = | 985
|
| Right size | n2 = | 11,255
|
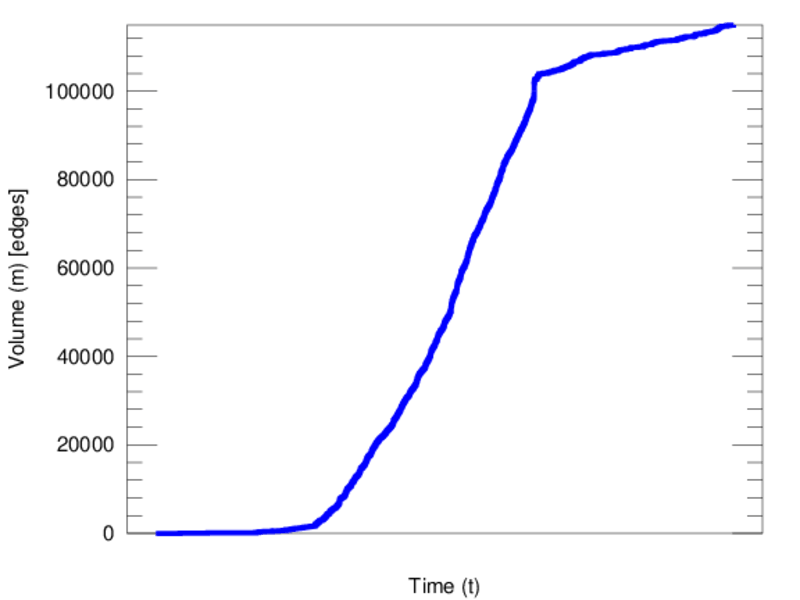
| Volume | m = | 114,939
|
| Unique edge count | m̿ = | 57,323
|
| Wedge count | s = | 47,401,221
|
| Claw count | z = | 43,415,409,376
|
| Cross count | x = | 36,716,033,012,356
|
| Square count | q = | 89,889,059
|
| 4-Tour count | T4 = | 908,878,230
|
| Maximum degree | dmax = | 11,717
|
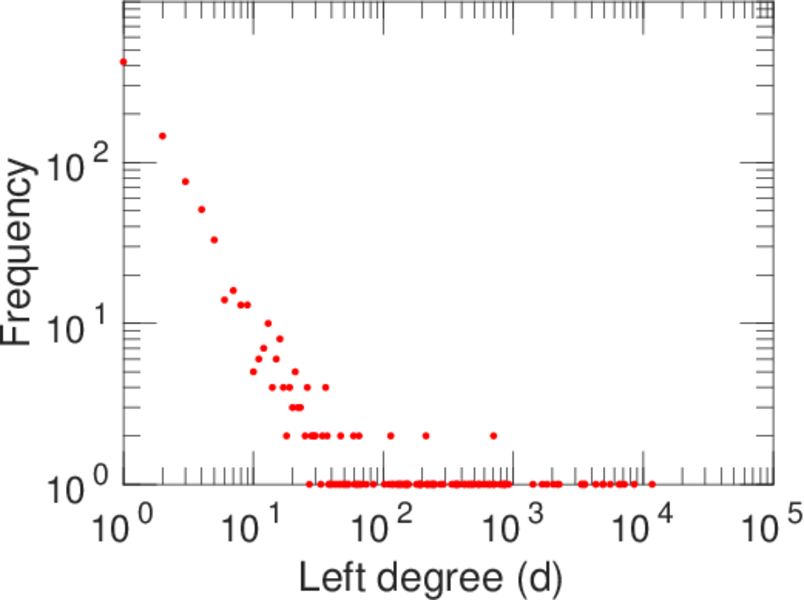
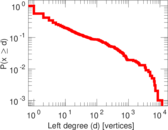
| Maximum left degree | d1max = | 11,717
|
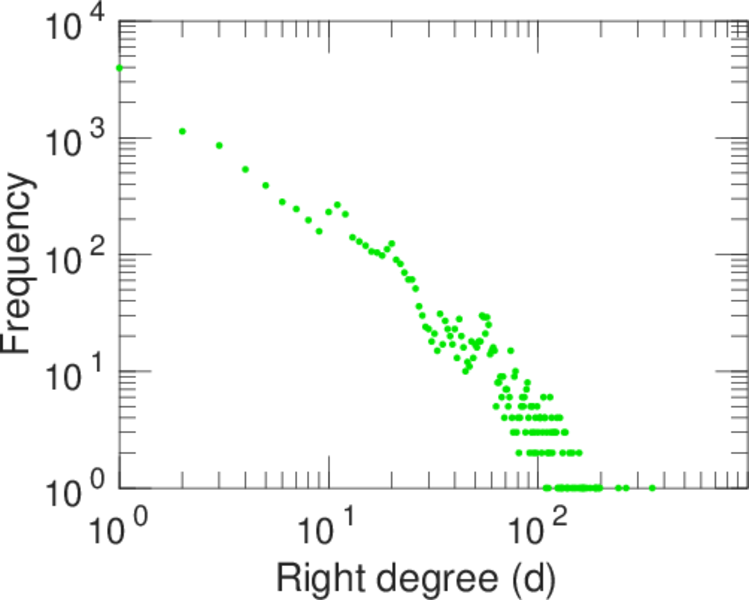
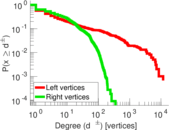
| Maximum right degree | d2max = | 351
|
| Average degree | d = | 18.780 9
|
| Average left degree | d1 = | 116.689
|
| Average right degree | d2 = | 10.212 3
|
| Fill | p = | 0.005 170 67
|
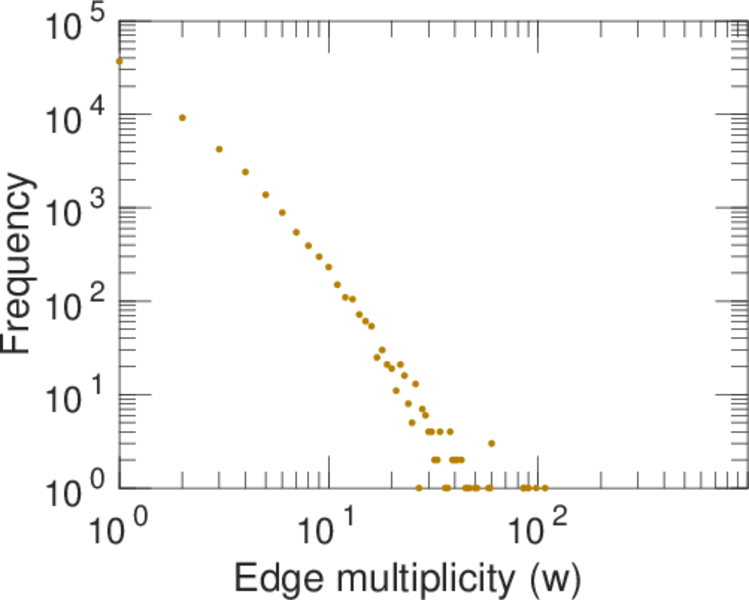
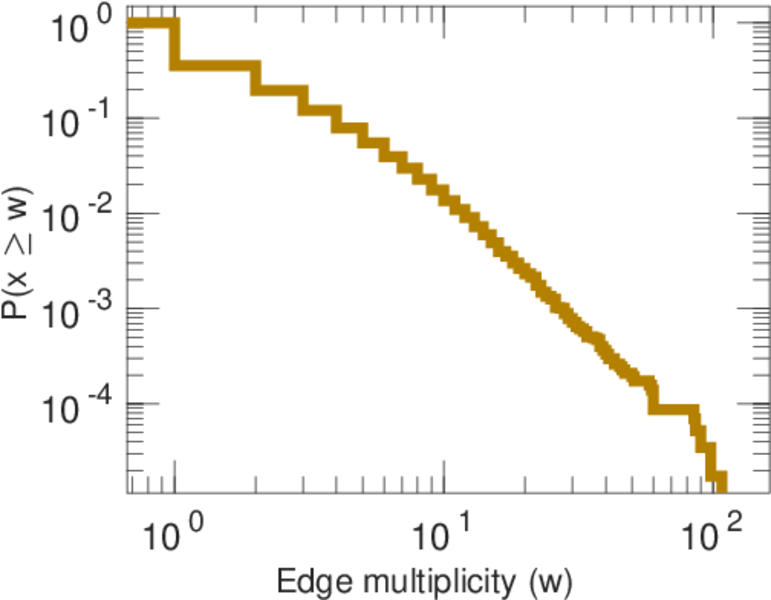
| Average edge multiplicity | m̃ = | 2.005 11
|
| Size of LCC | N = | 11,369
|
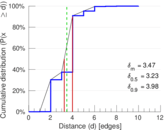
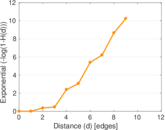
| Diameter | δ = | 13
|
| 50-Percentile effective diameter | δ0.5 = | 3.234 09
|
| 90-Percentile effective diameter | δ0.9 = | 3.983 55
|
| Median distance | δM = | 4
|
| Mean distance | δm = | 3.465 61
|
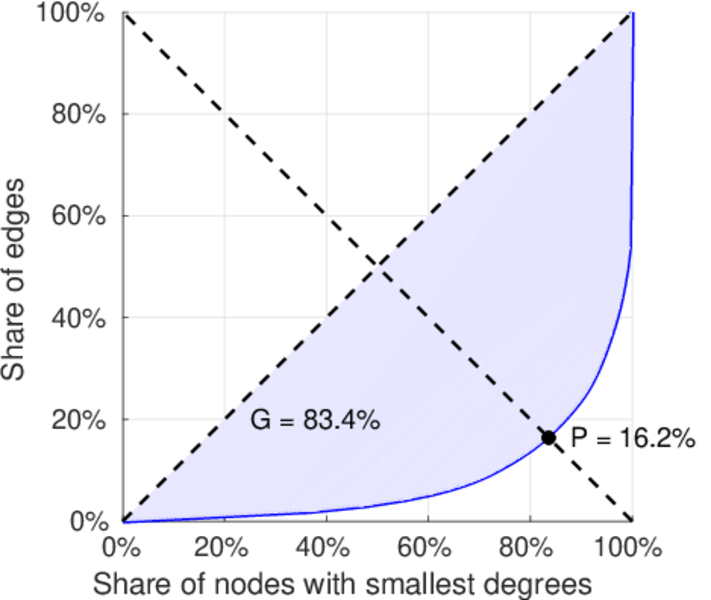
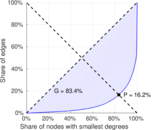
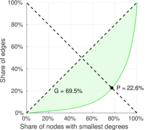
| Gini coefficient | G = | 0.833 692
|
| Balanced inequality ratio | P = | 0.165 053
|
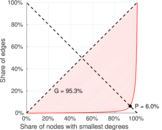
| Left balanced inequality ratio | P1 = | 0.060 031 8
|
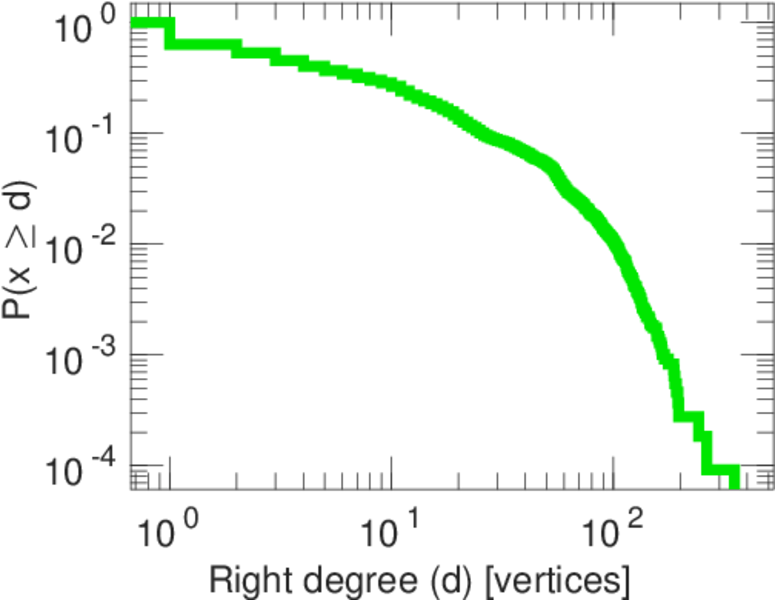
| Right balanced inequality ratio | P2 = | 0.225 668
|
| Relative edge distribution entropy | Her = | 0.756 700
|
| Power law exponent | γ = | 2.027 99
|
| Tail power law exponent | γt = | 2.591 00
|
| Tail power law exponent with p | γ3 = | 2.591 00
|
| p-value | p = | 0.000 00
|
| Left tail power law exponent with p | γ3,1 = | 1.641 00
|
| Left p-value | p1 = | 0.000 00
|
| Right tail power law exponent with p | γ3,2 = | 8.911 00
|
| Right p-value | p2 = | 0.591 000
|
| Degree assortativity | ρ = | −0.309 897
|
| Degree assortativity p-value | pρ = | 0.000 00
|
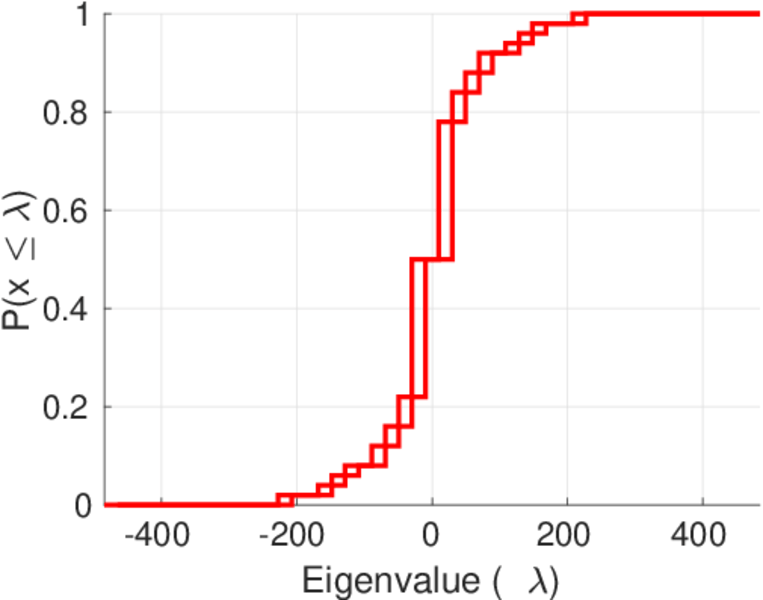
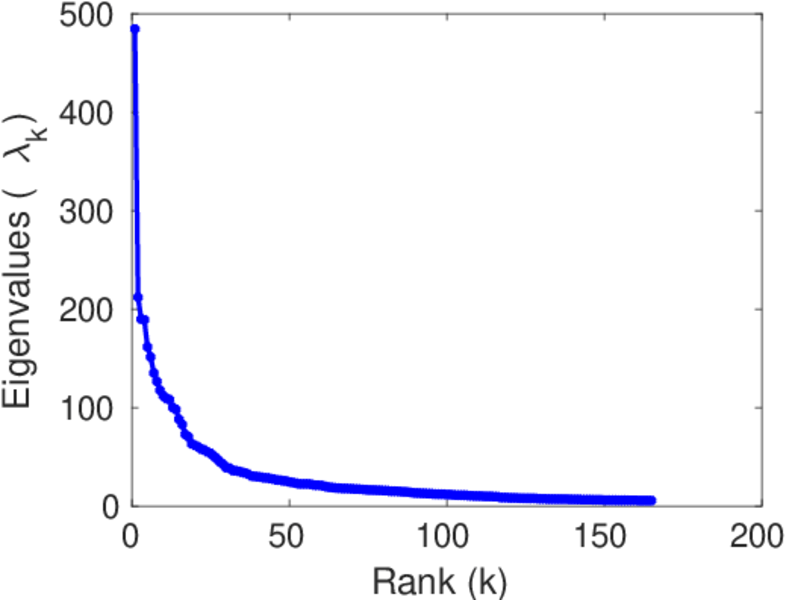
| Spectral norm | α = | 484.485
|
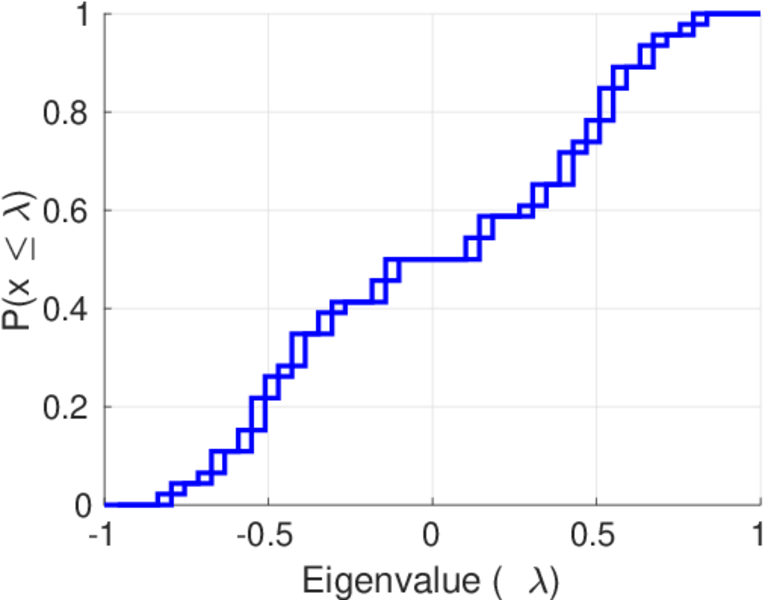
| Algebraic connectivity | a = | 0.026 486 5
|
| Spectral separation | |λ1[A] / λ2[A]| = | 2.284 53
|
| Controllability | C = | 10,020
|
| Relative controllability | Cr = | 0.845 498
|
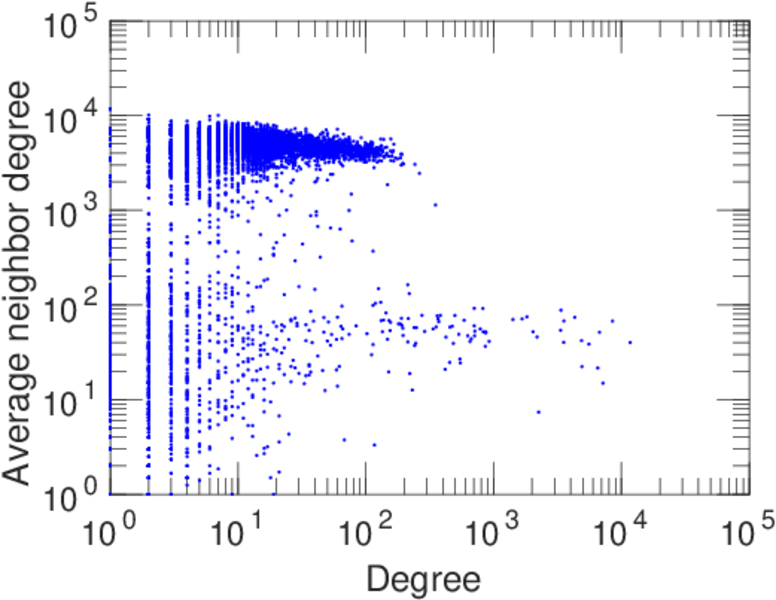
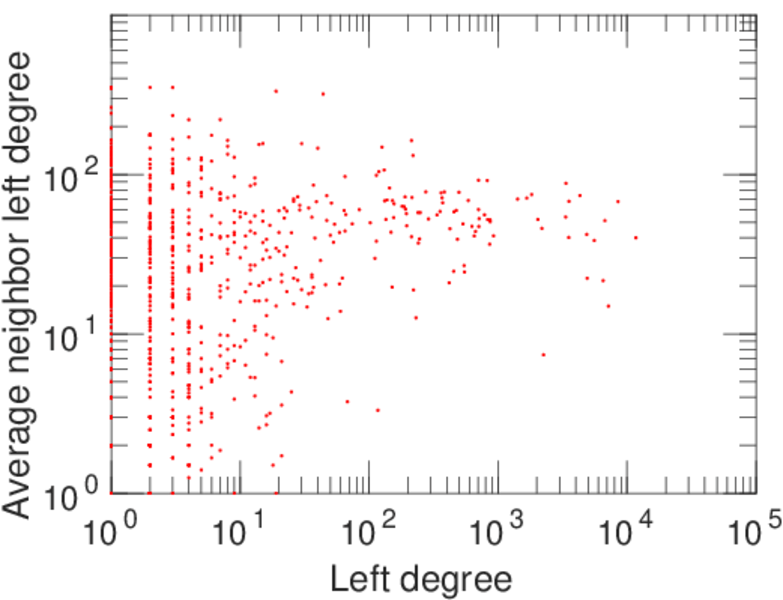
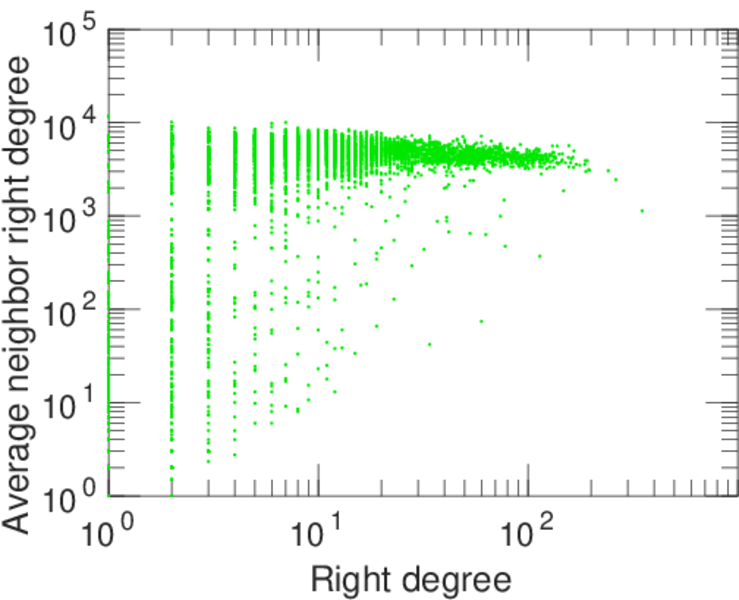
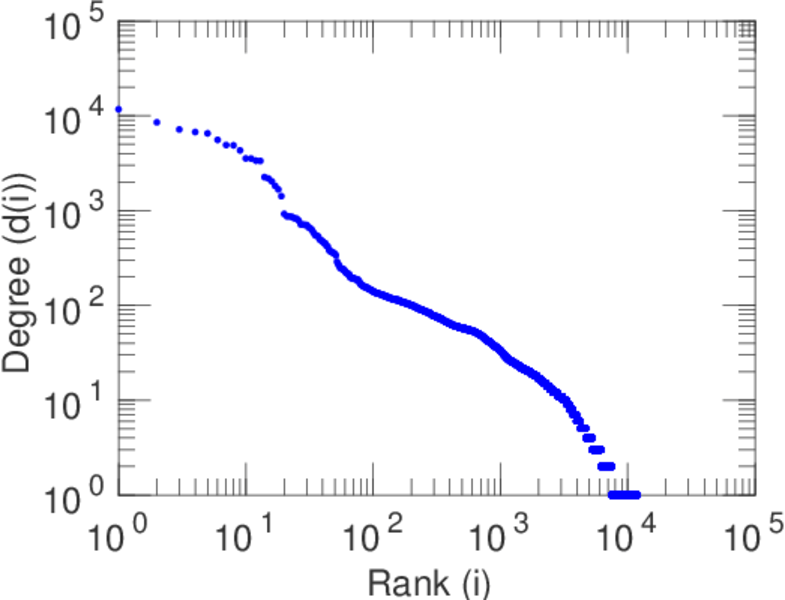
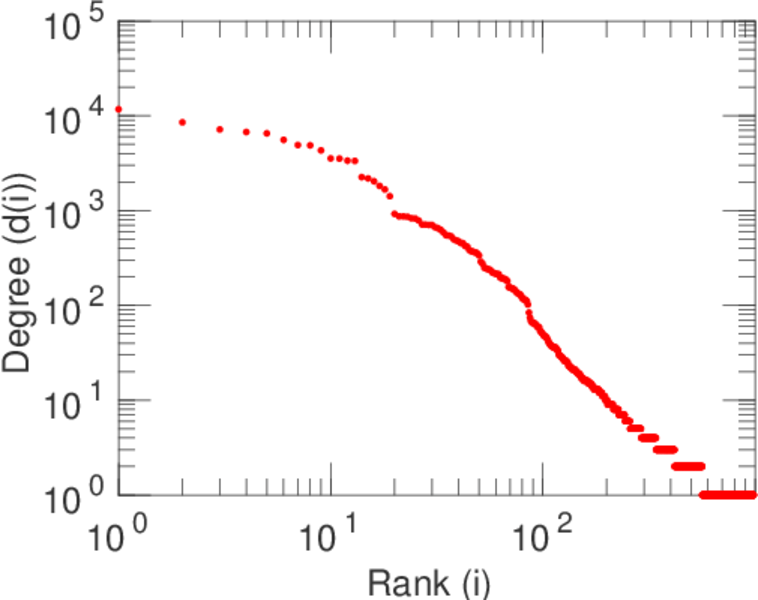
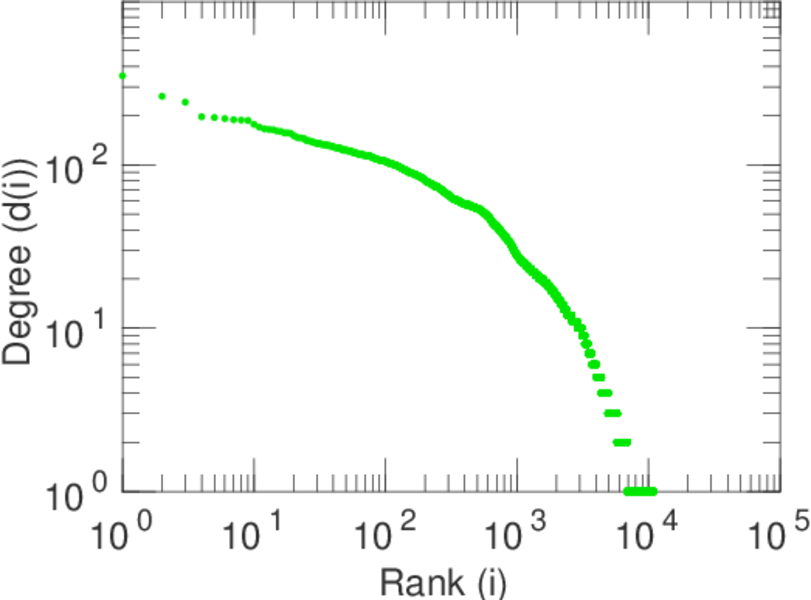
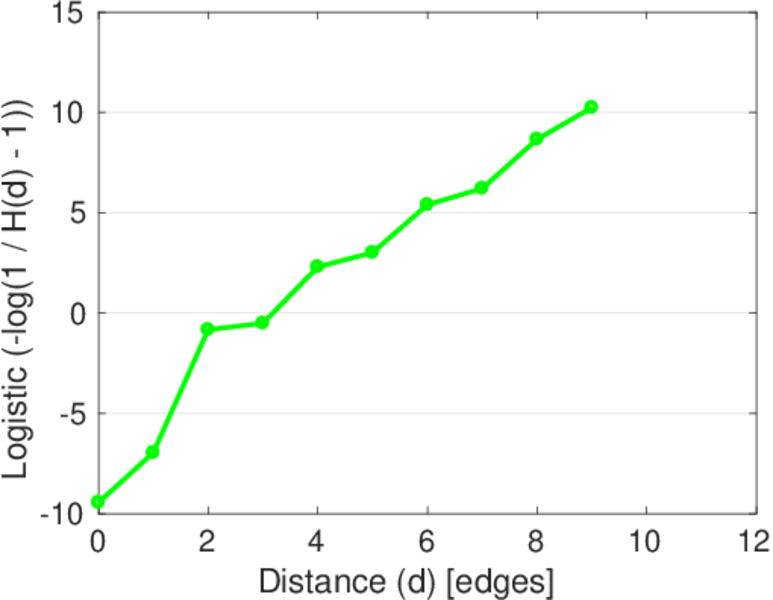
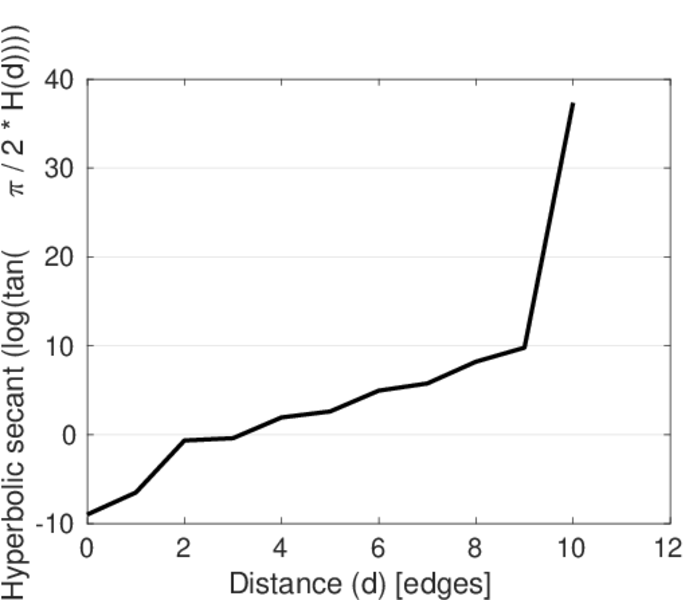
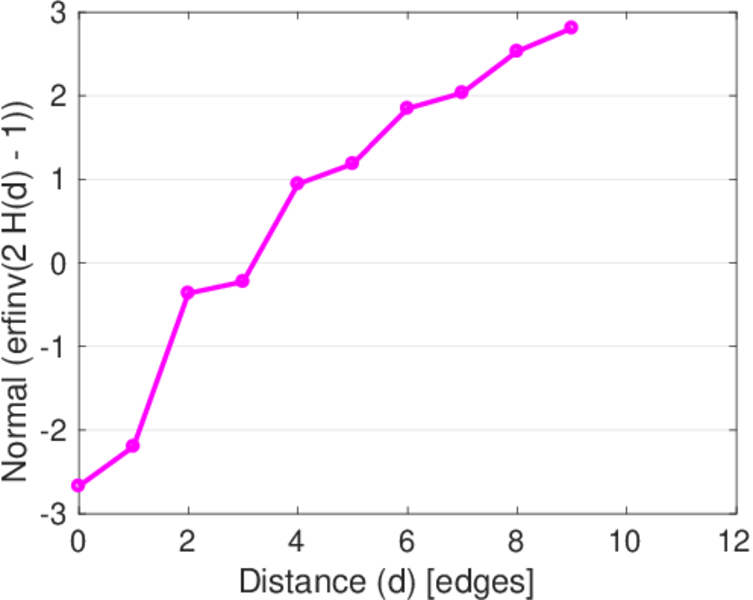
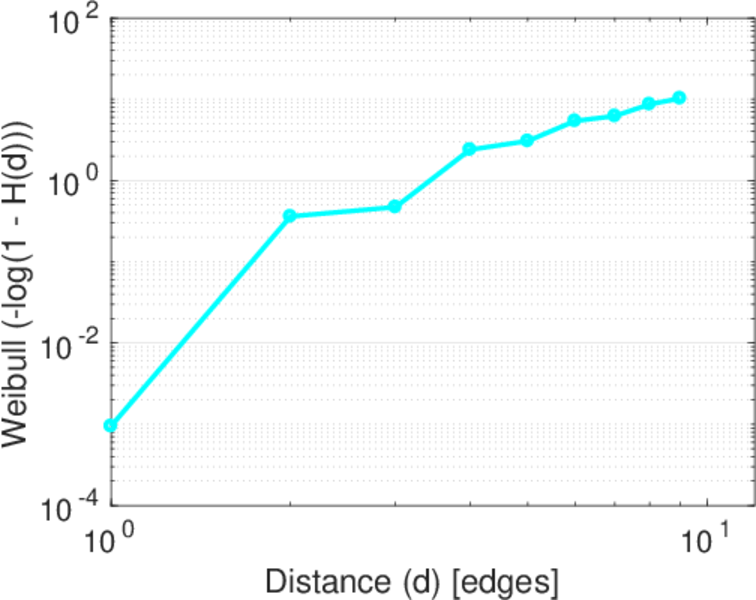
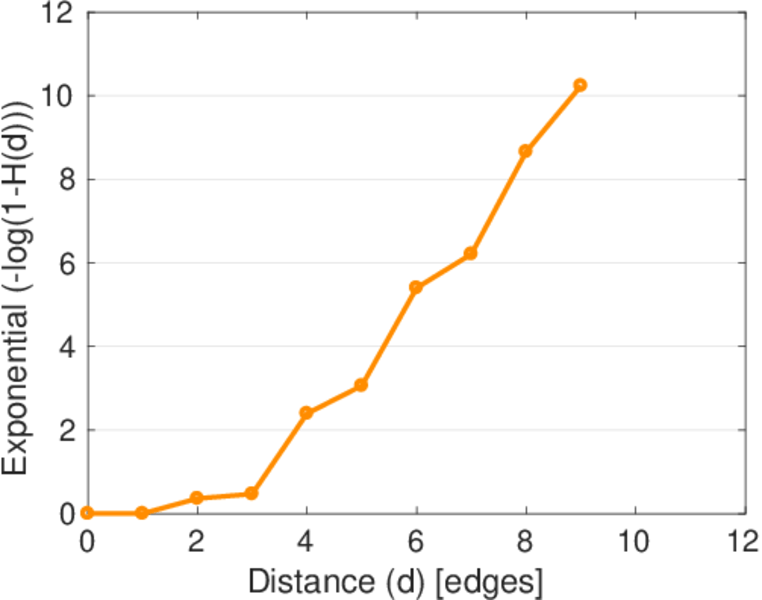
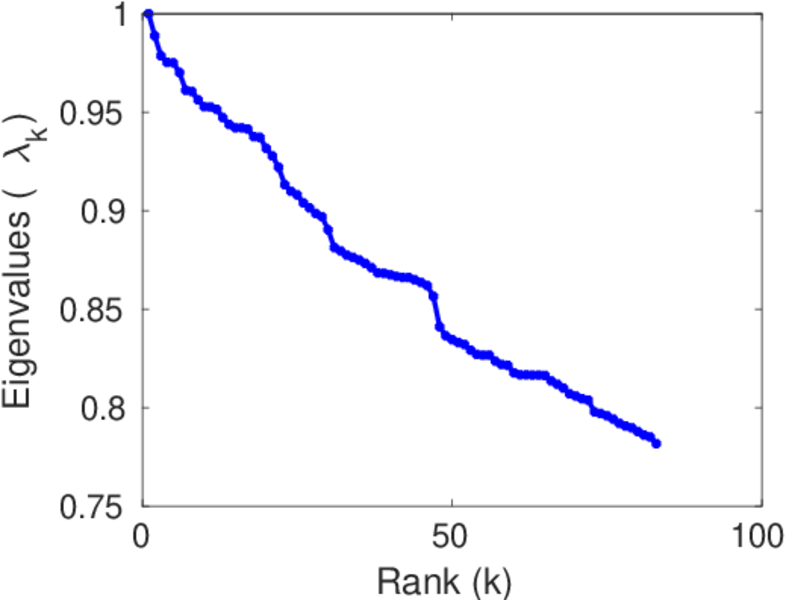
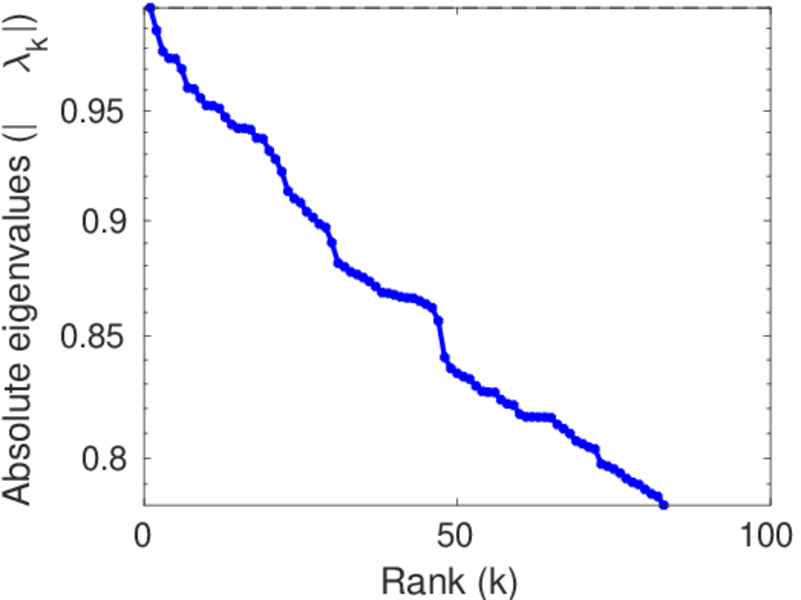
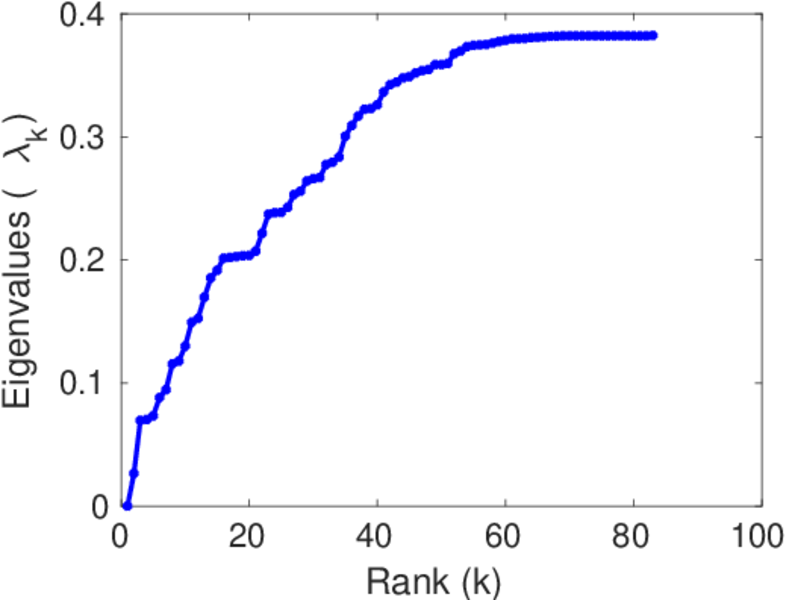
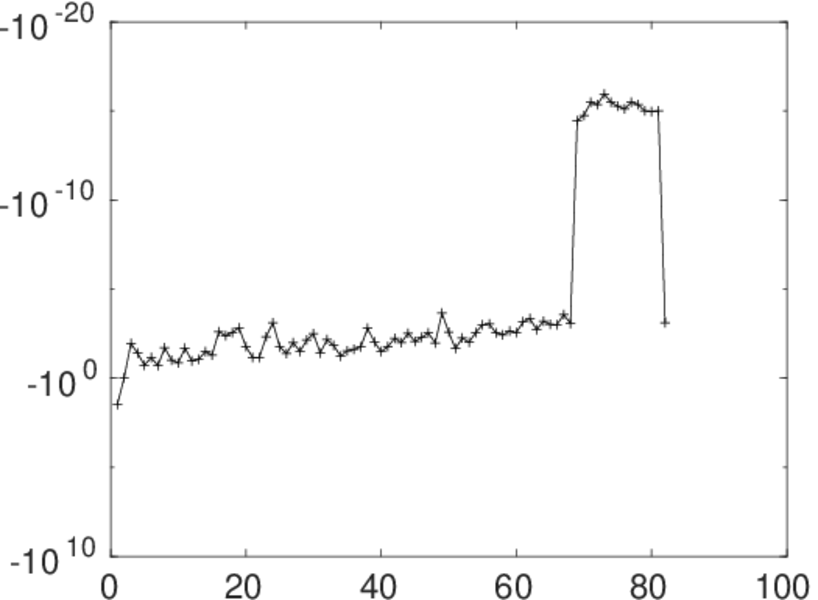
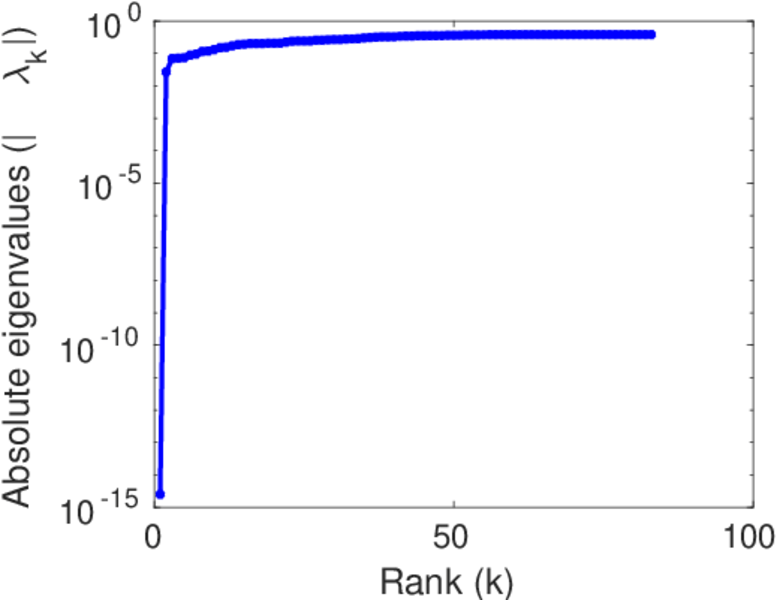
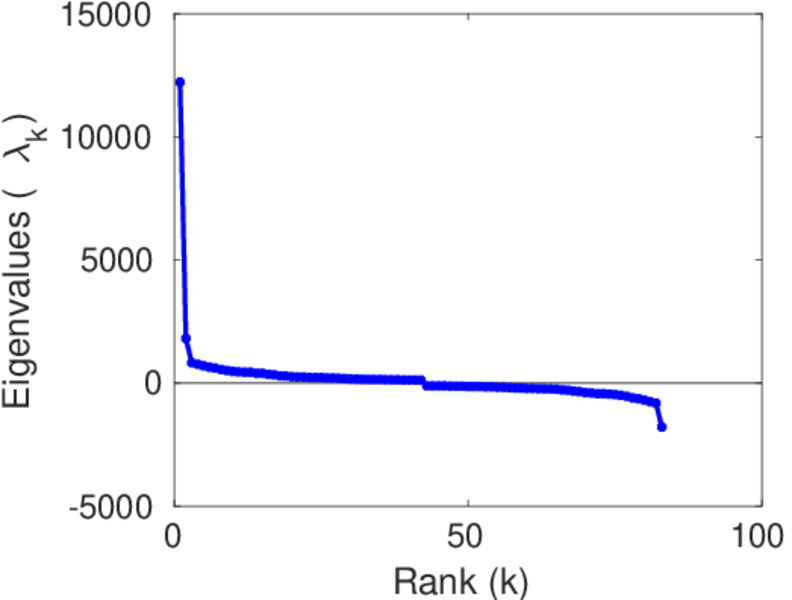
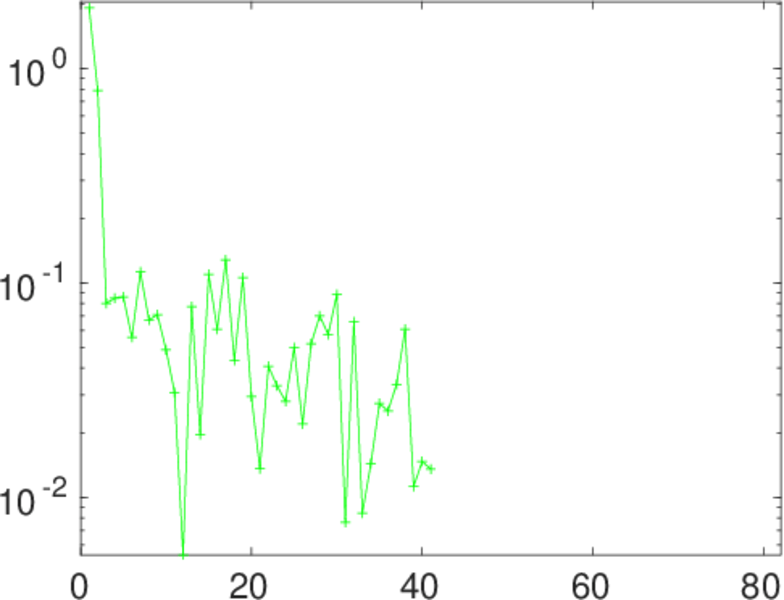
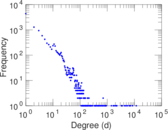
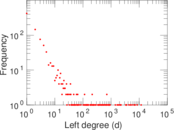
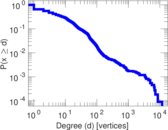
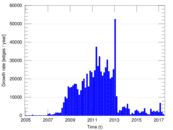
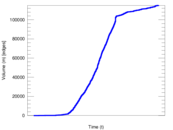
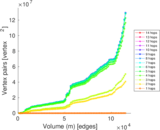
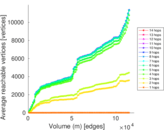
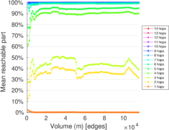
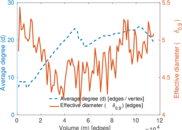
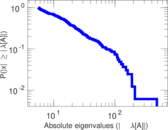
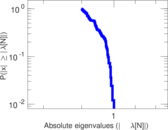
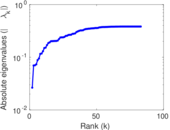
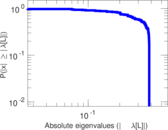
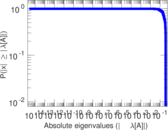
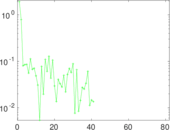
Plots


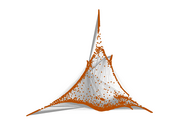


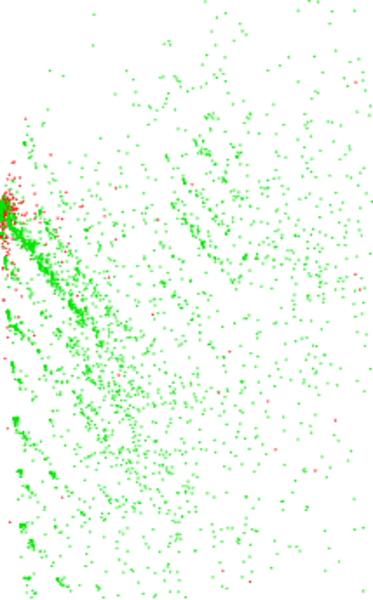
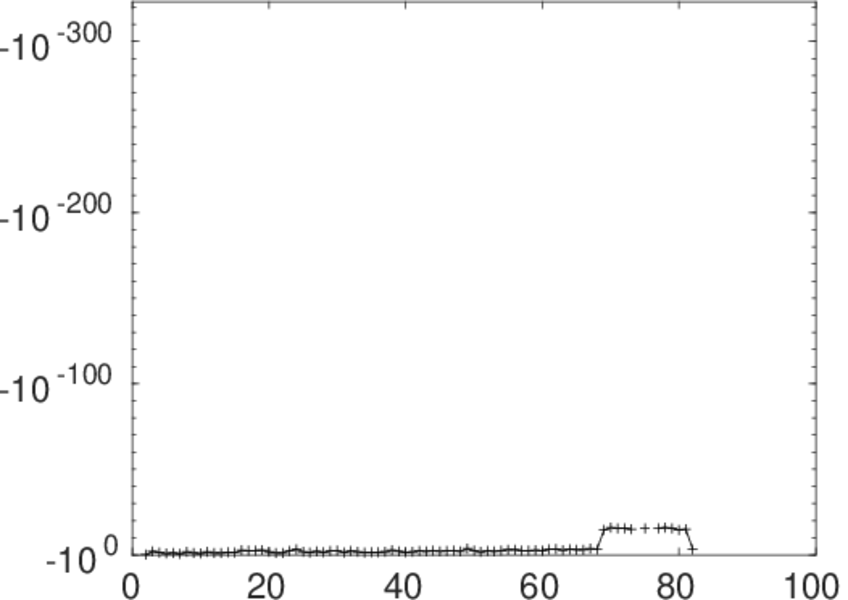
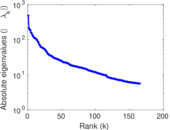
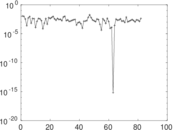
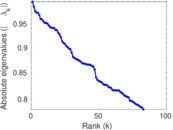
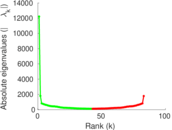
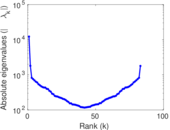
Matrix decompositions plots


Downloads
References
|
[1]
|
Jérôme Kunegis.
KONECT – The Koblenz Network Collection.
In Proc. Int. Conf. on World Wide Web Companion, pages
1343–1350, 2013.
[ http ]
|
|
[2]
|
Wikimedia Foundation.
Wikimedia downloads.
http://dumps.wikimedia.org/, January 2010.
|
 KONECT ‣ Networks ‣
Buy Me a Coffee
KONECT ‣ Networks ‣
Buy Me a Coffee