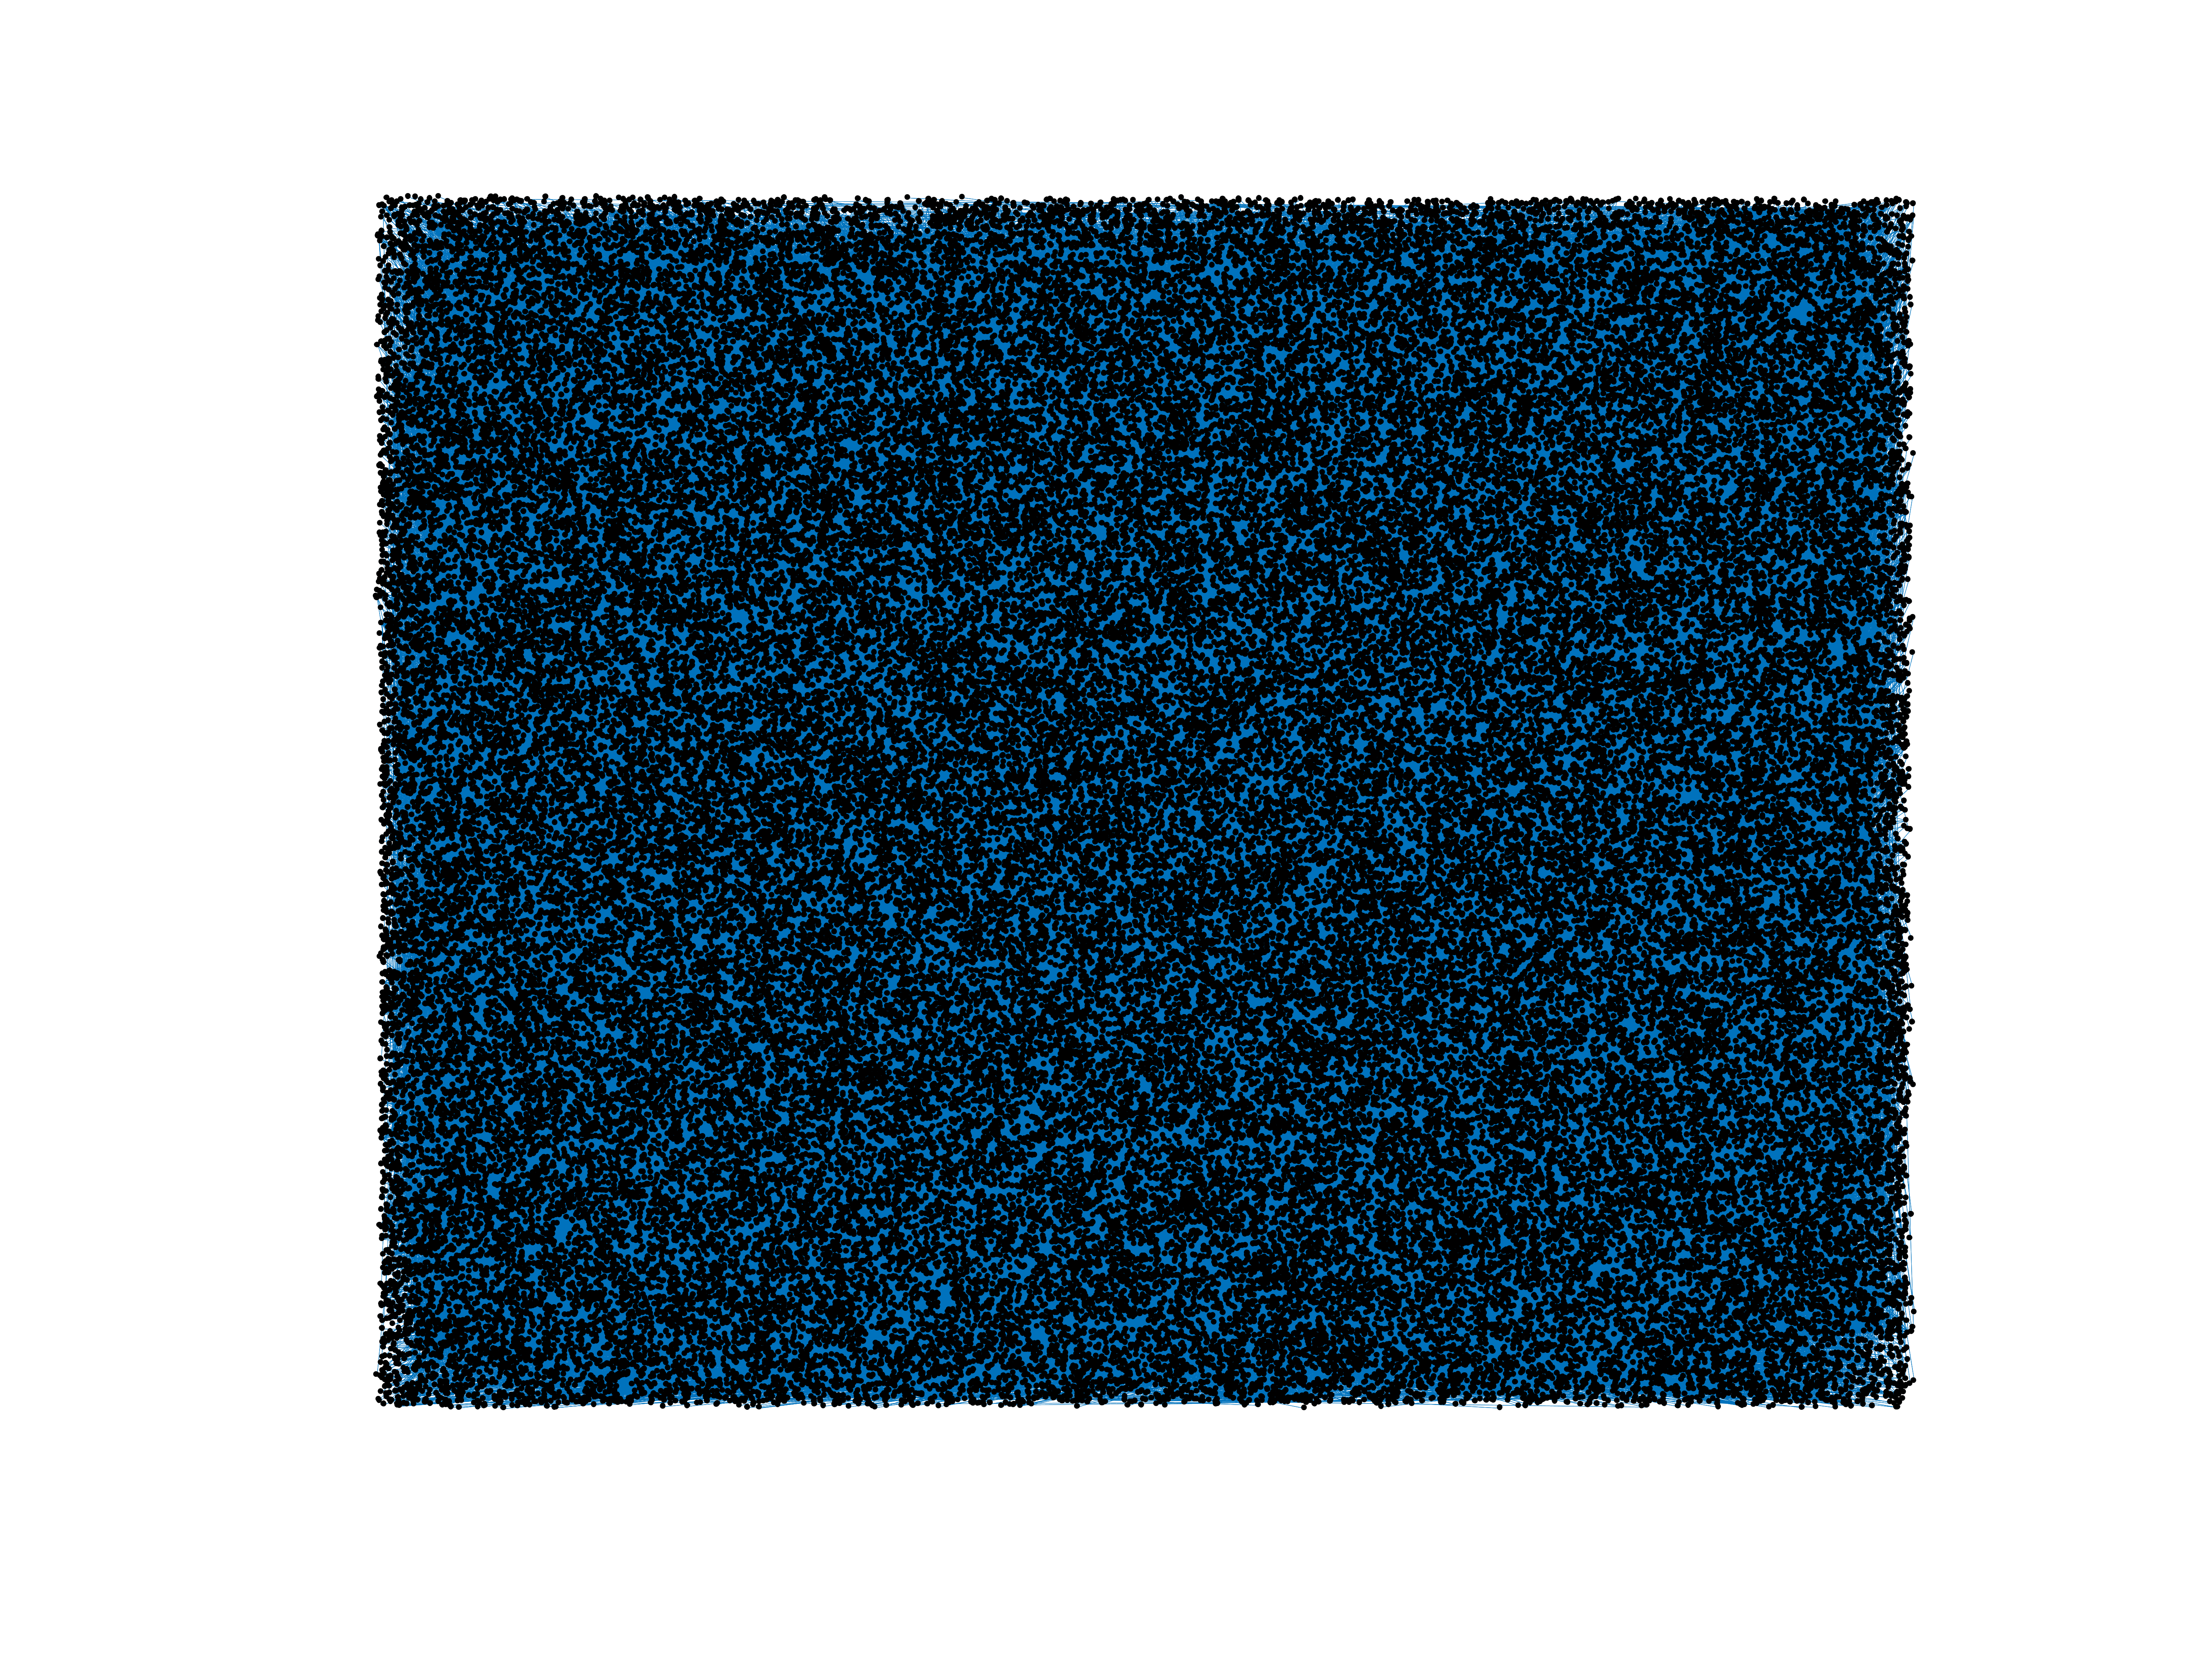
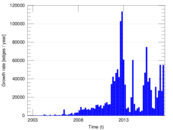
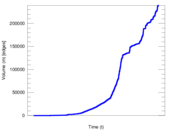
Wikipedia edits (ky)
This is the bipartite edit network of the Kyrgyz Wikipedia. It contains users
and pages from the Kyrgyz Wikipedia, connected by edit events. Each edge
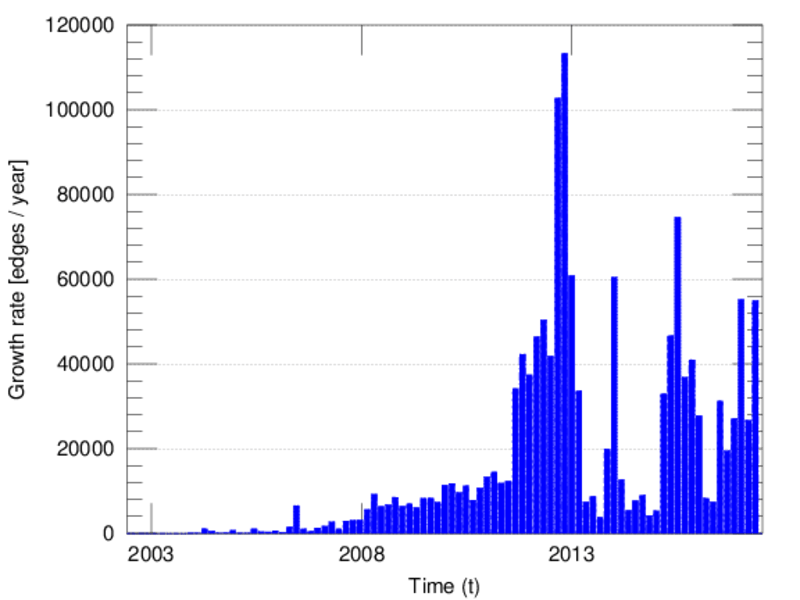
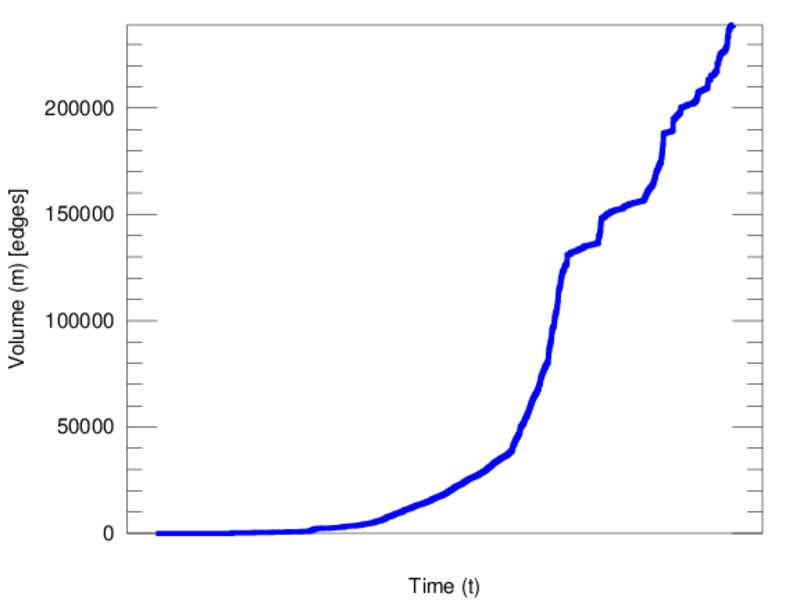
represents an edit. The dataset includes the timestamp of each edit.
Metadata
Statistics
| Size | n = | 89,898
|
| Left size | n1 = | 2,291
|
| Right size | n2 = | 87,607
|
| Volume | m = | 239,048
|
| Unique edge count | m̿ = | 152,880
|
| Wedge count | s = | 1,015,964,436
|
| Claw count | z = | 12,127,250,043,900
|
| Cross count | x = | 122,375,168,352,526,096
|
| Square count | q = | 44,405,616
|
| 4-Tour count | T4 = | 4,419,416,124
|
| Maximum degree | dmax = | 51,371
|
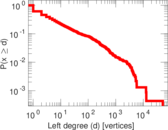
| Maximum left degree | d1max = | 51,371
|
| Maximum right degree | d2max = | 360
|
| Average degree | d = | 5.318 21
|
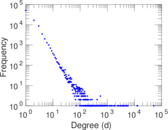
| Average left degree | d1 = | 104.342
|
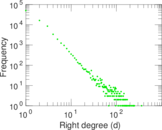
| Average right degree | d2 = | 2.728 64
|
| Fill | p = | 0.000 761 705
|
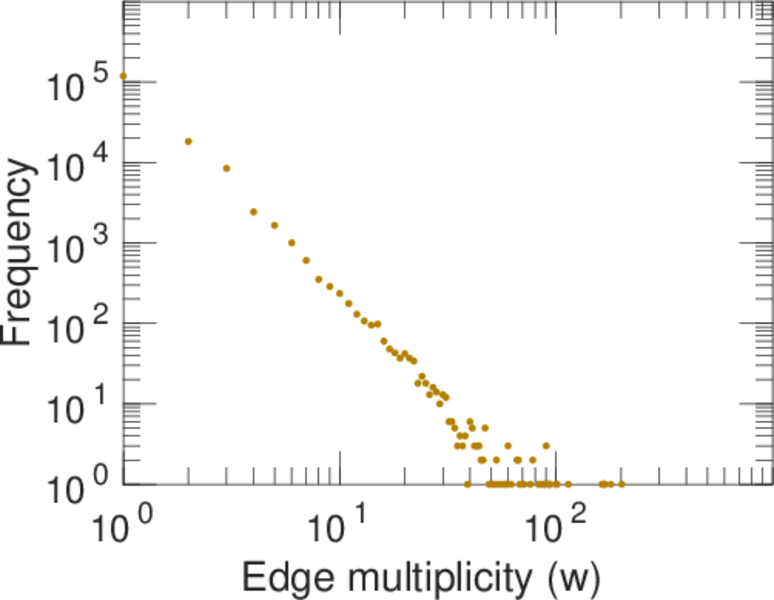
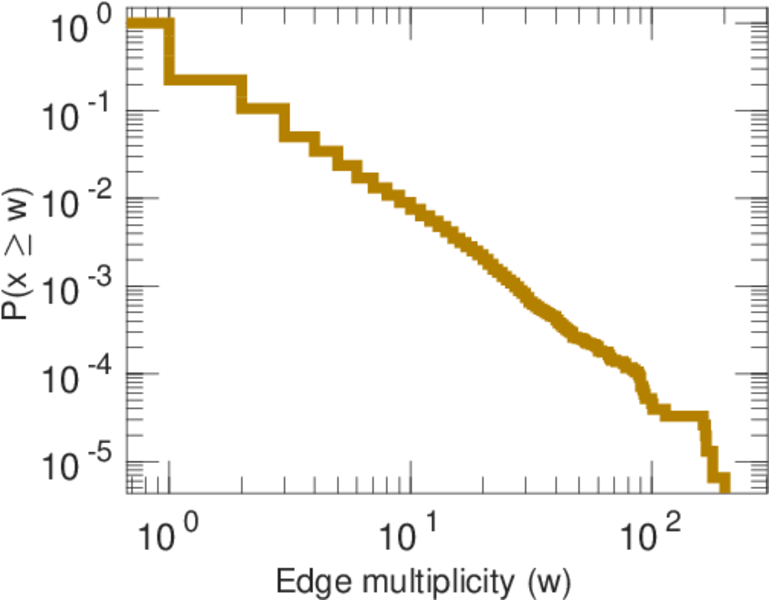
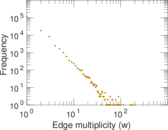
| Average edge multiplicity | m̃ = | 1.563 63
|
| Size of LCC | N = | 88,146
|
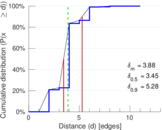
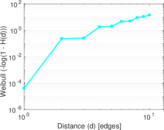
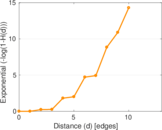
| Diameter | δ = | 14
|
| 50-Percentile effective diameter | δ0.5 = | 3.448 16
|
| 90-Percentile effective diameter | δ0.9 = | 5.276 23
|
| Median distance | δM = | 4
|
| Mean distance | δm = | 3.879 00
|
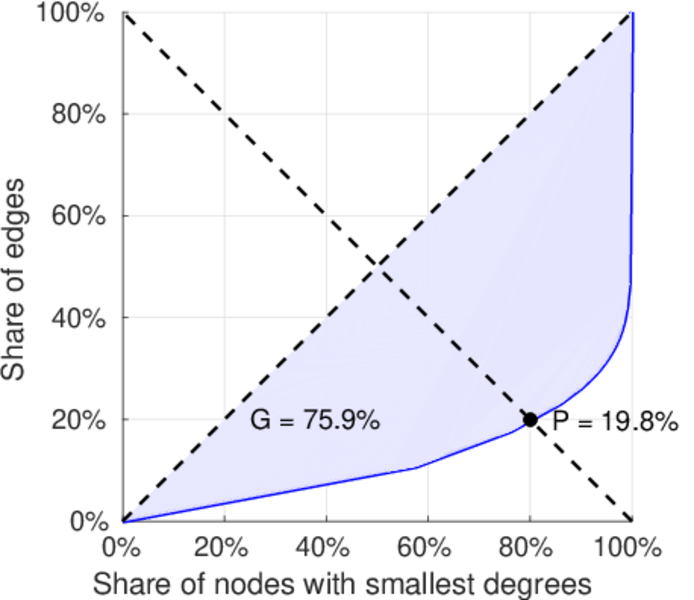
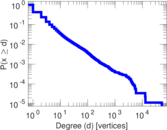
| Gini coefficient | G = | 0.764 426
|
| Balanced inequality ratio | P = | 0.193 390
|
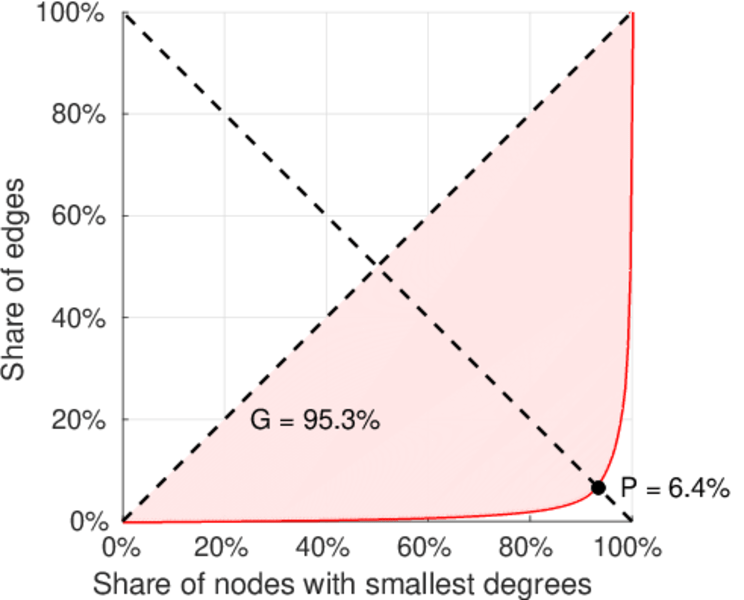
| Left balanced inequality ratio | P1 = | 0.064 234 0
|
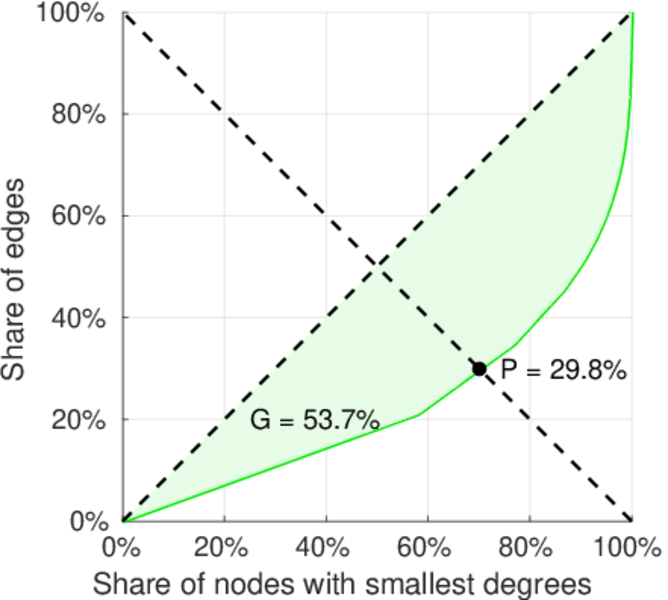
| Right balanced inequality ratio | P2 = | 0.297 635
|
| Relative edge distribution entropy | Her = | 0.717 490
|
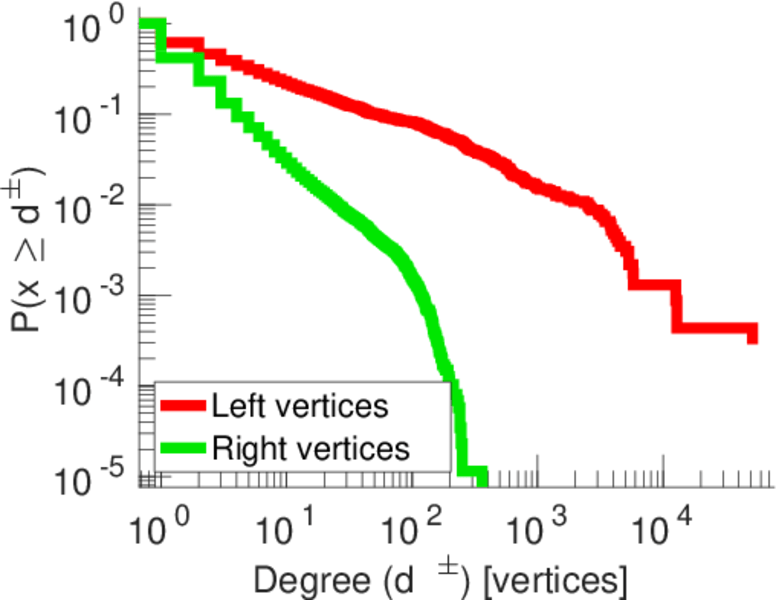
| Power law exponent | γ = | 4.051 71
|
| Tail power law exponent | γt = | 2.401 00
|
| Tail power law exponent with p | γ3 = | 2.401 00
|
| p-value | p = | 0.000 00
|
| Left tail power law exponent with p | γ3,1 = | 1.661 00
|
| Left p-value | p1 = | 0.000 00
|
| Right tail power law exponent with p | γ3,2 = | 2.611 00
|
| Right p-value | p2 = | 0.000 00
|
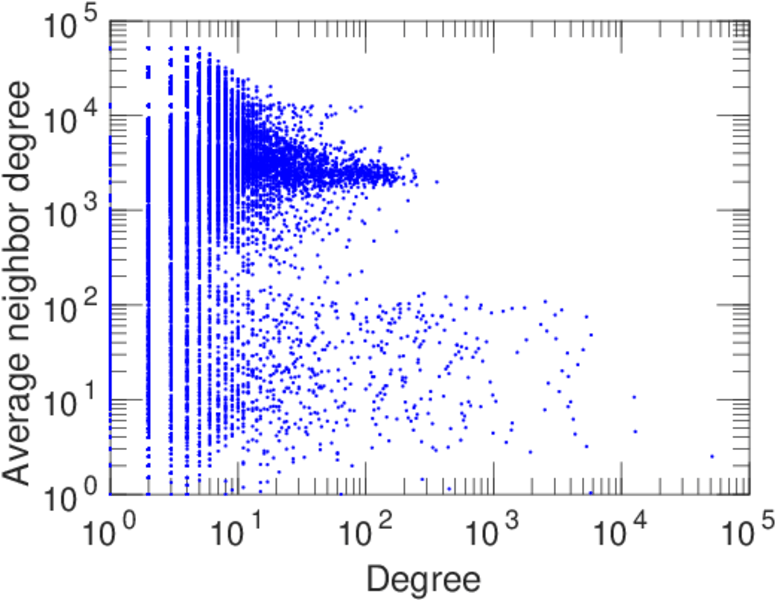
| Degree assortativity | ρ = | −0.294 590
|
| Degree assortativity p-value | pρ = | 0.000 00
|
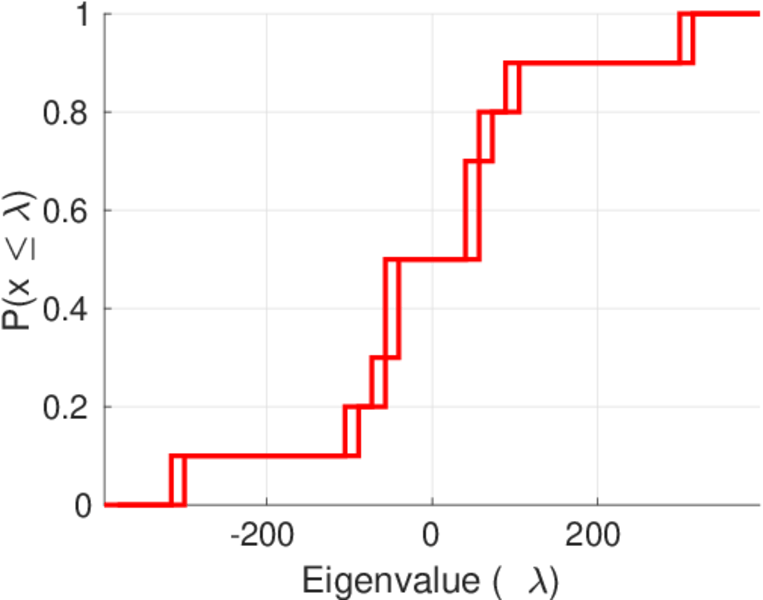
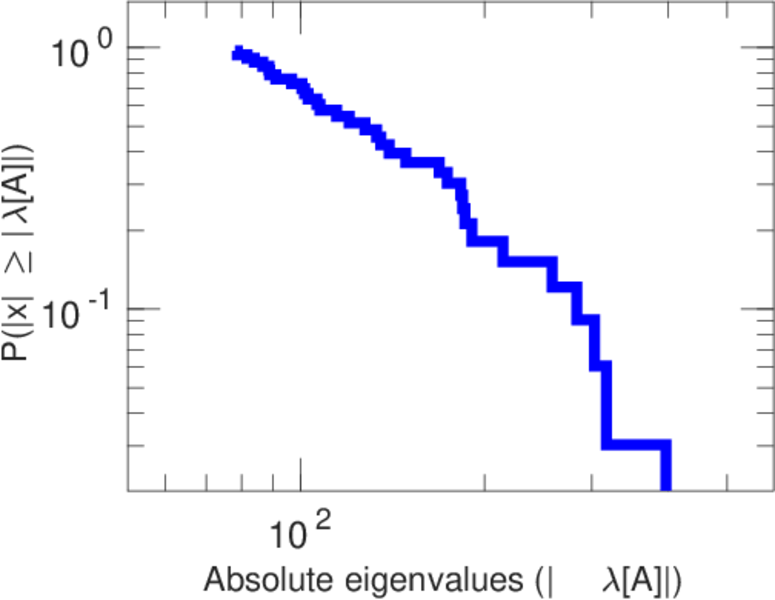
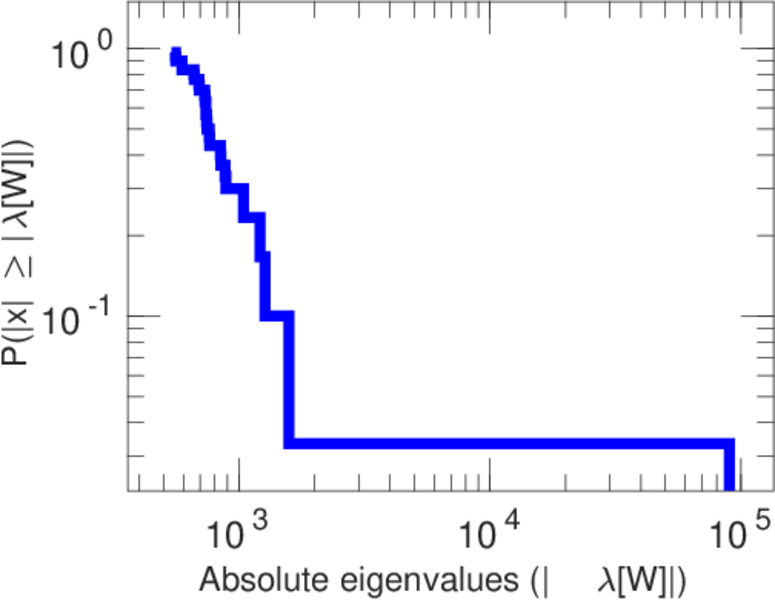
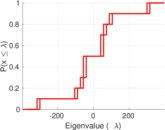
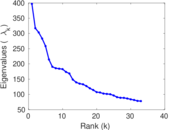
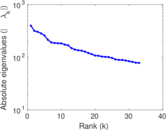
| Spectral norm | α = | 397.018
|
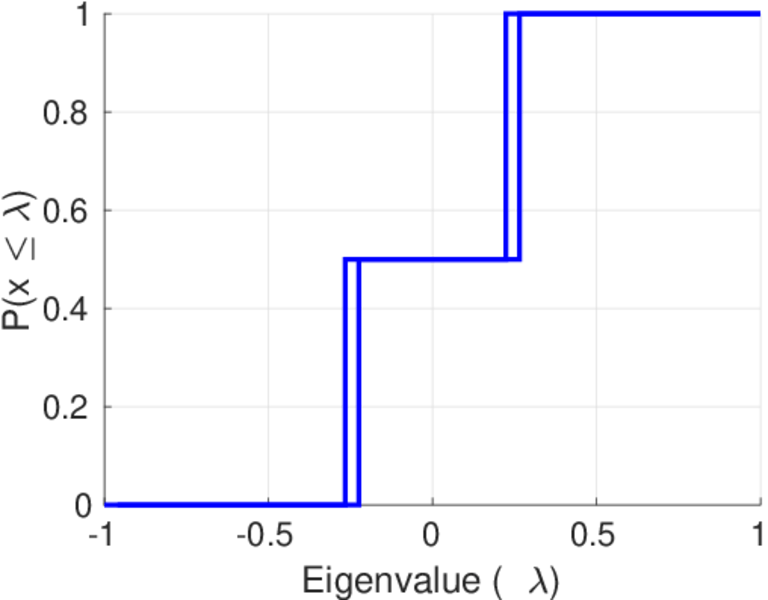
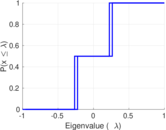
| Algebraic connectivity | a = | 0.012 188 5
|
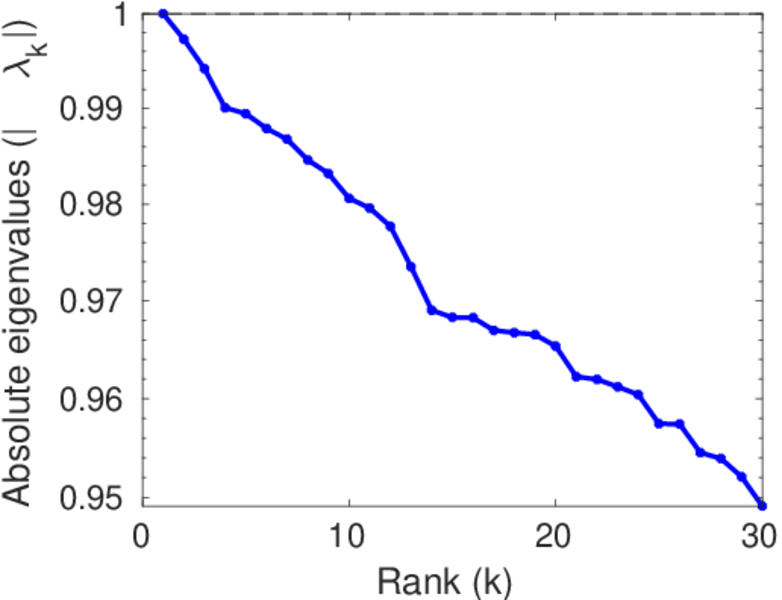
| Spectral separation | |λ1[A] / λ2[A]| = | 1.251 74
|
| Controllability | C = | 84,980
|
| Relative controllability | Cr = | 0.953 204
|
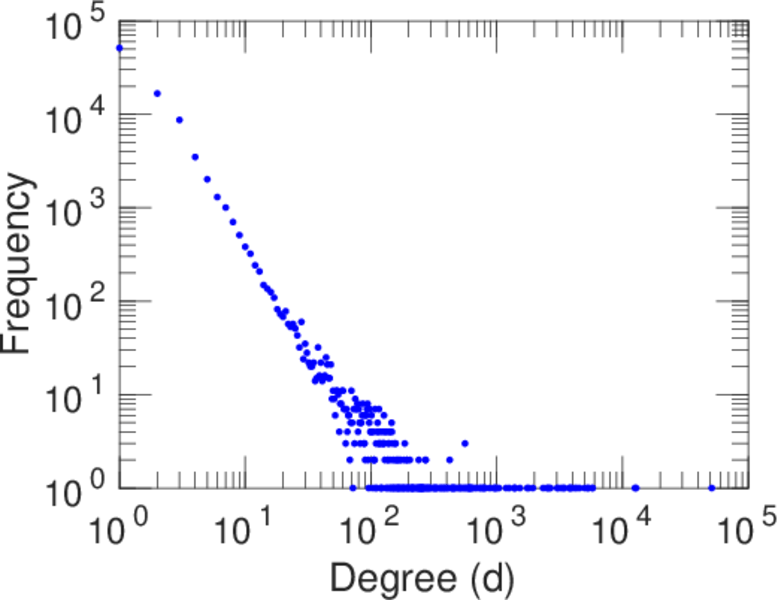
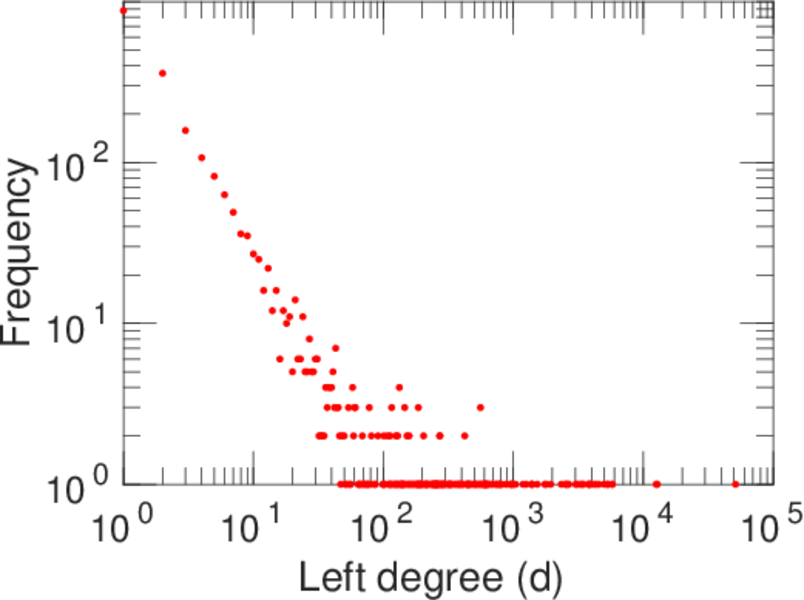
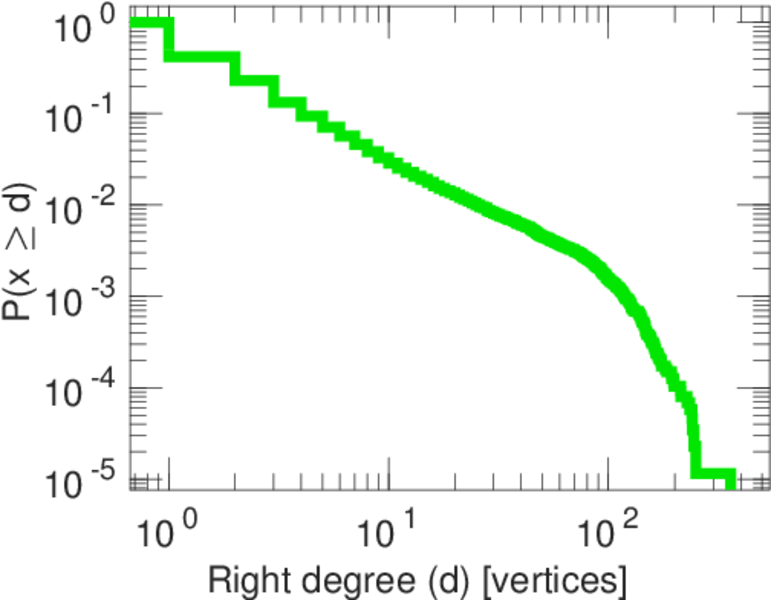
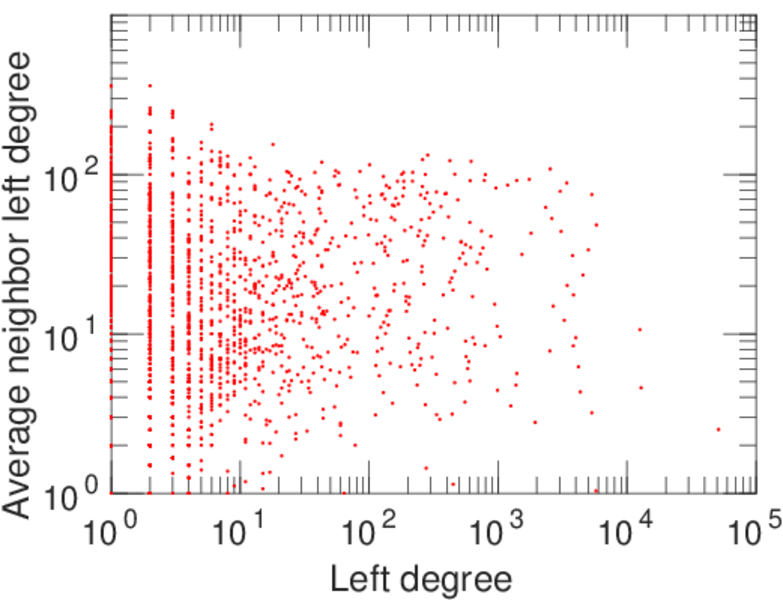
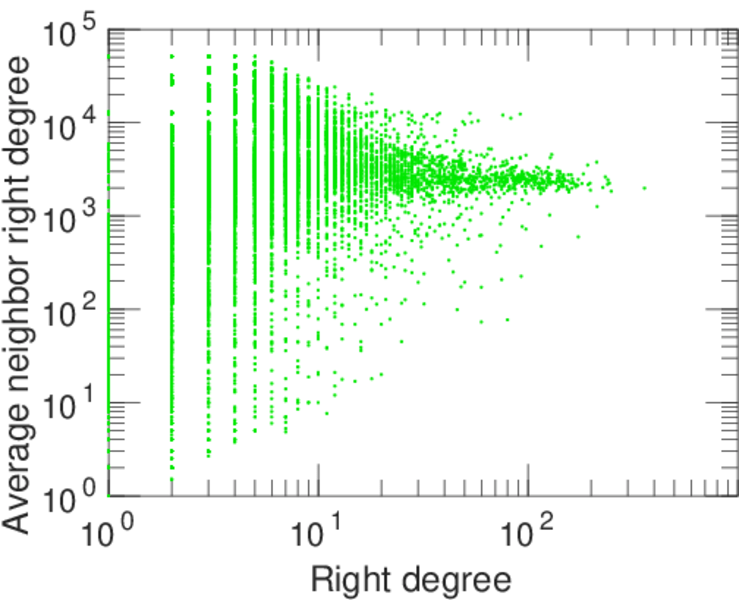
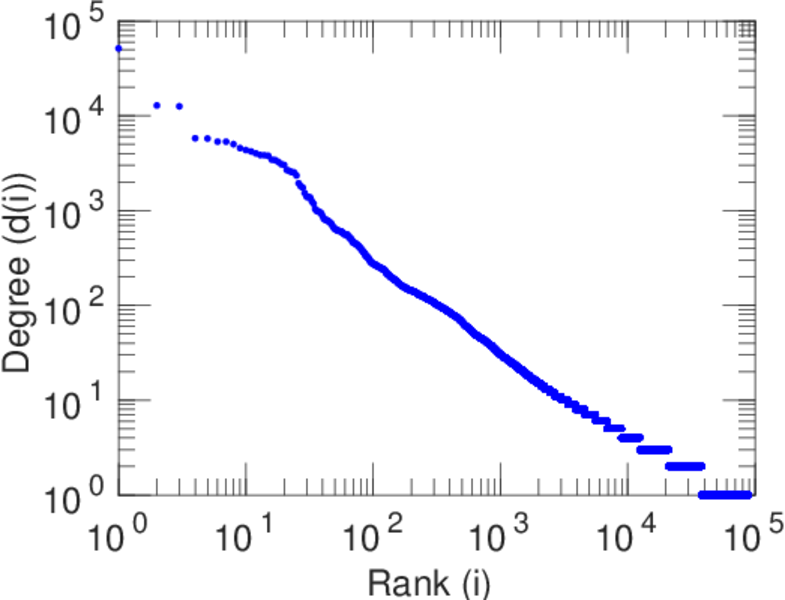
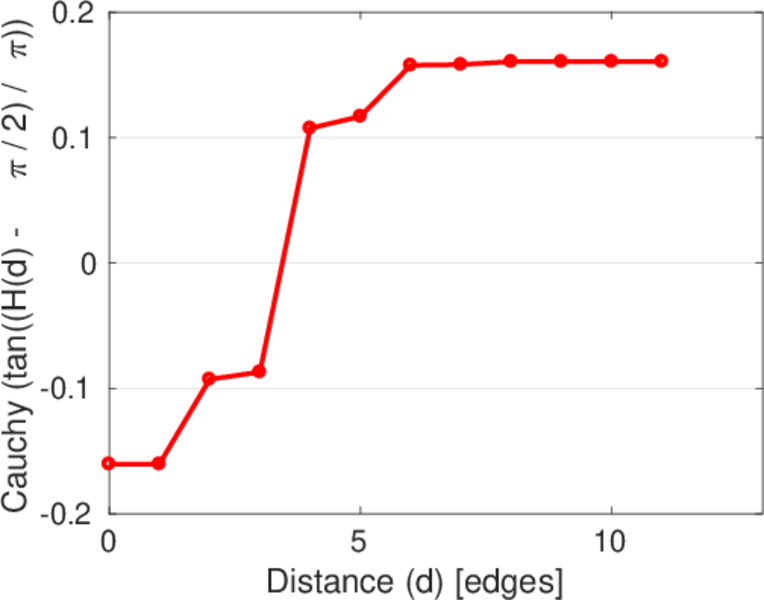
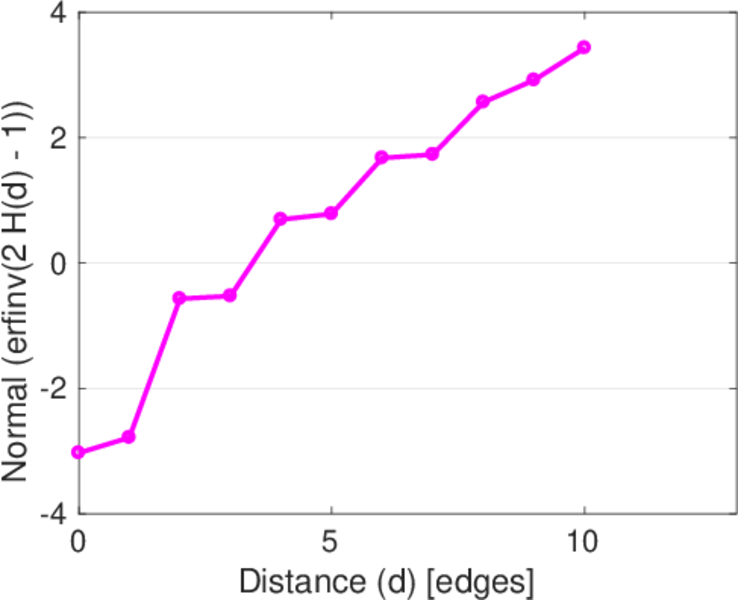
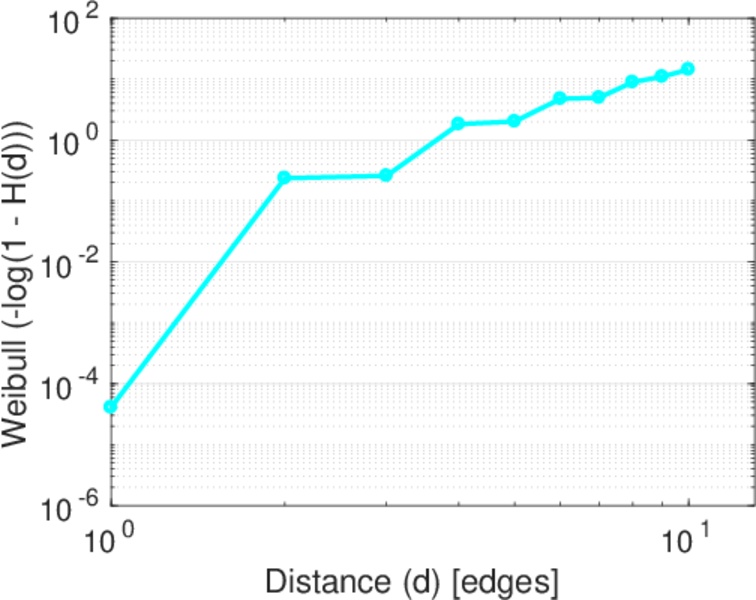
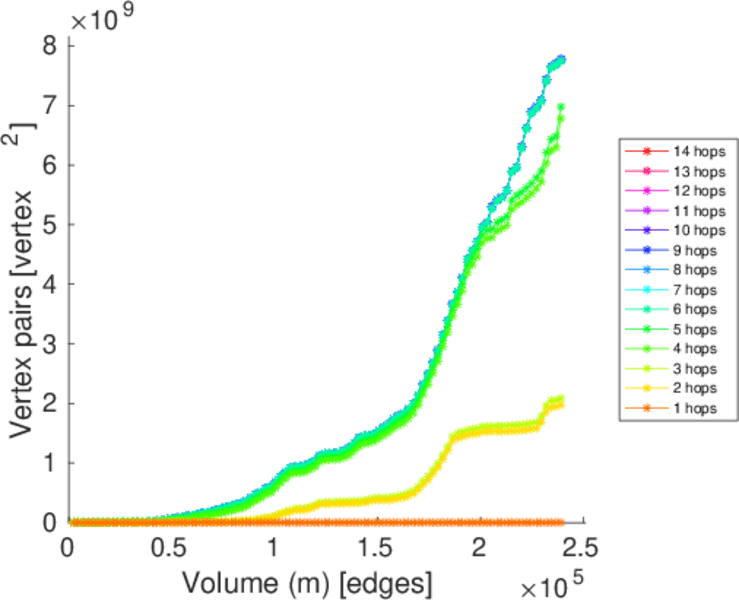
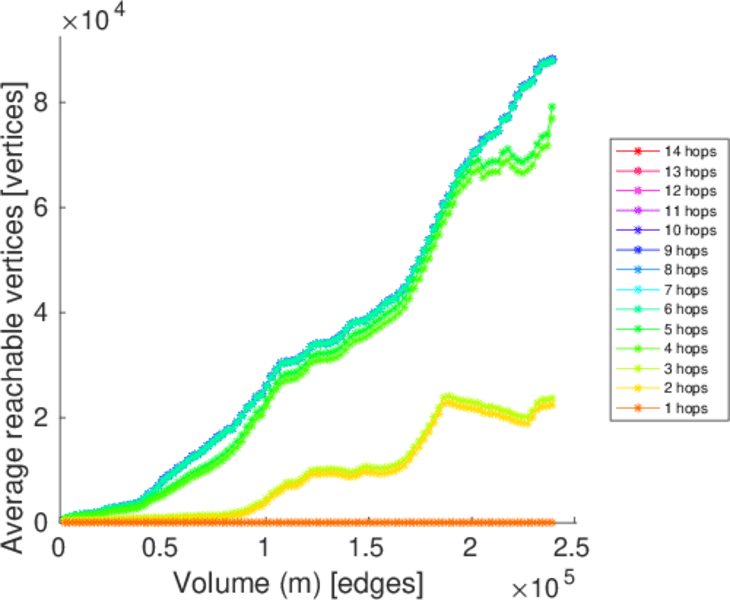
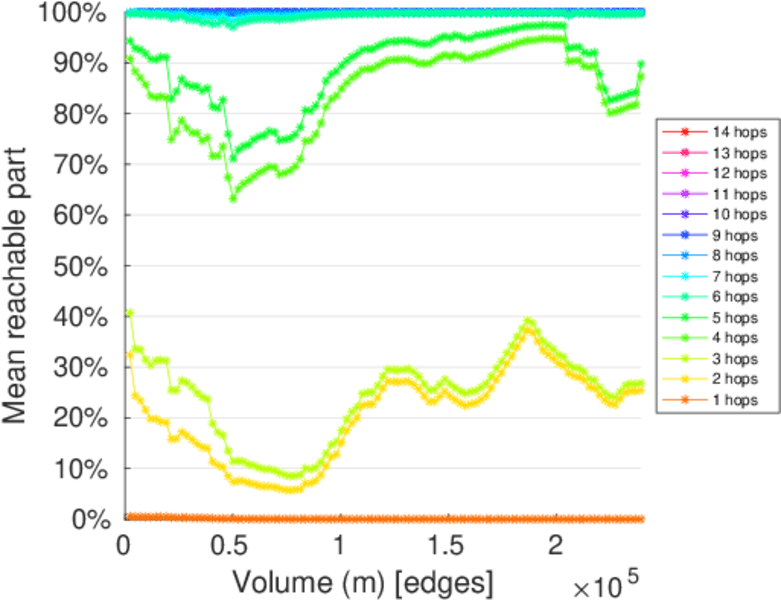
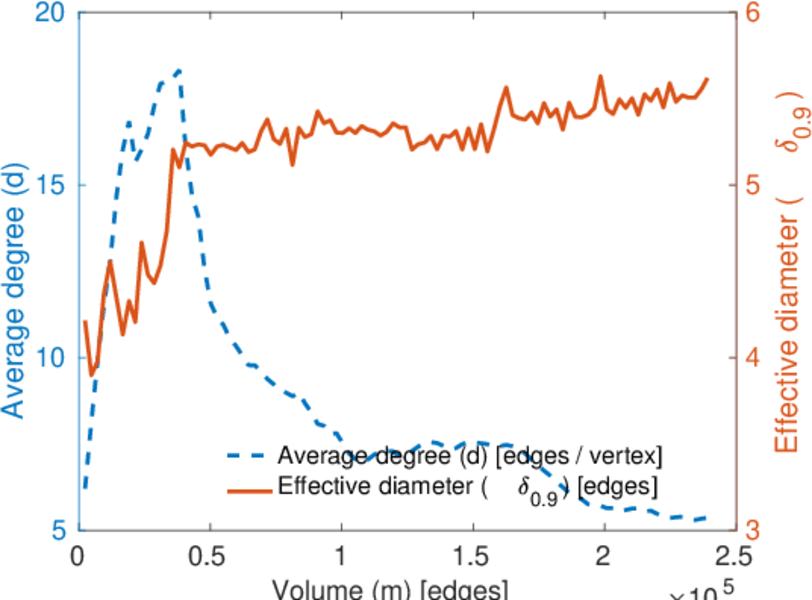
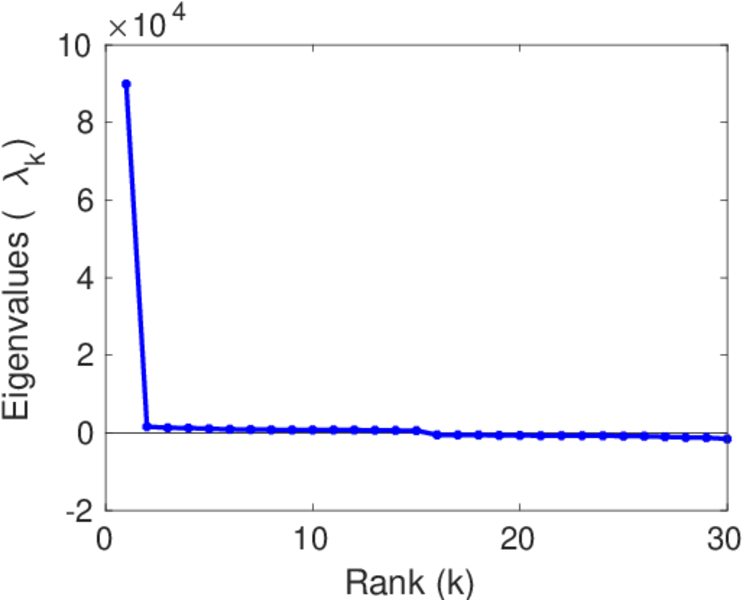
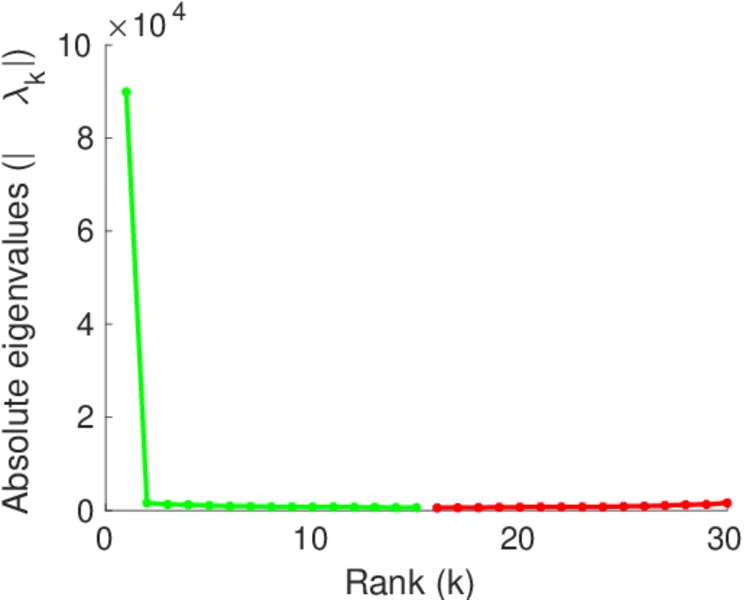
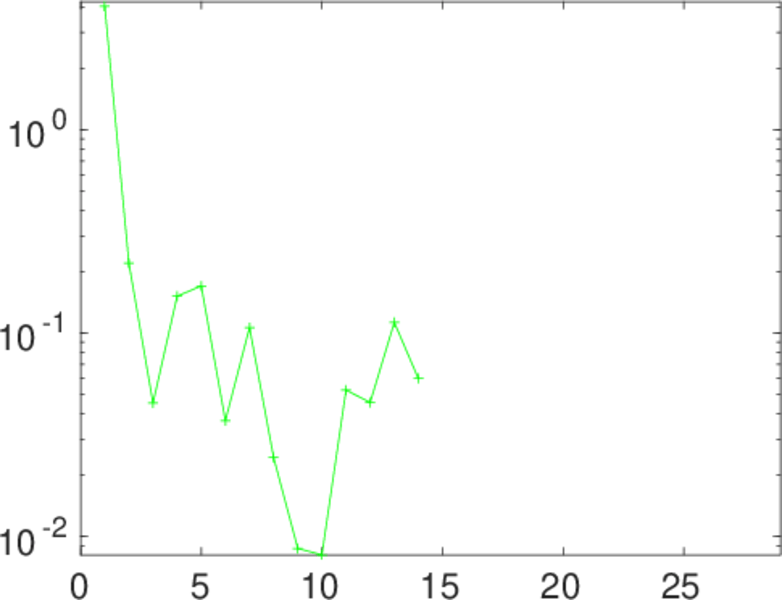
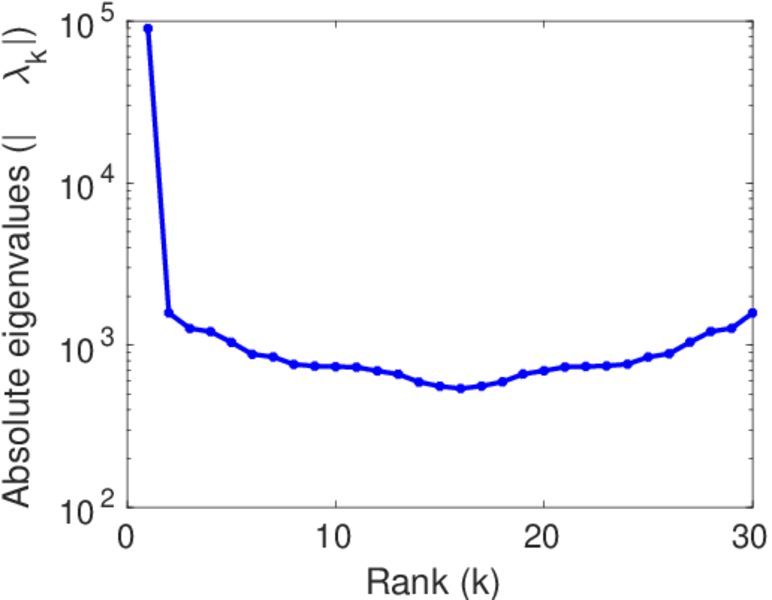
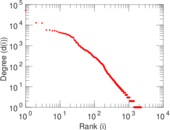
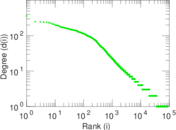
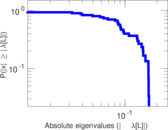
Plots


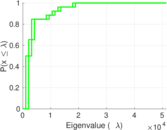


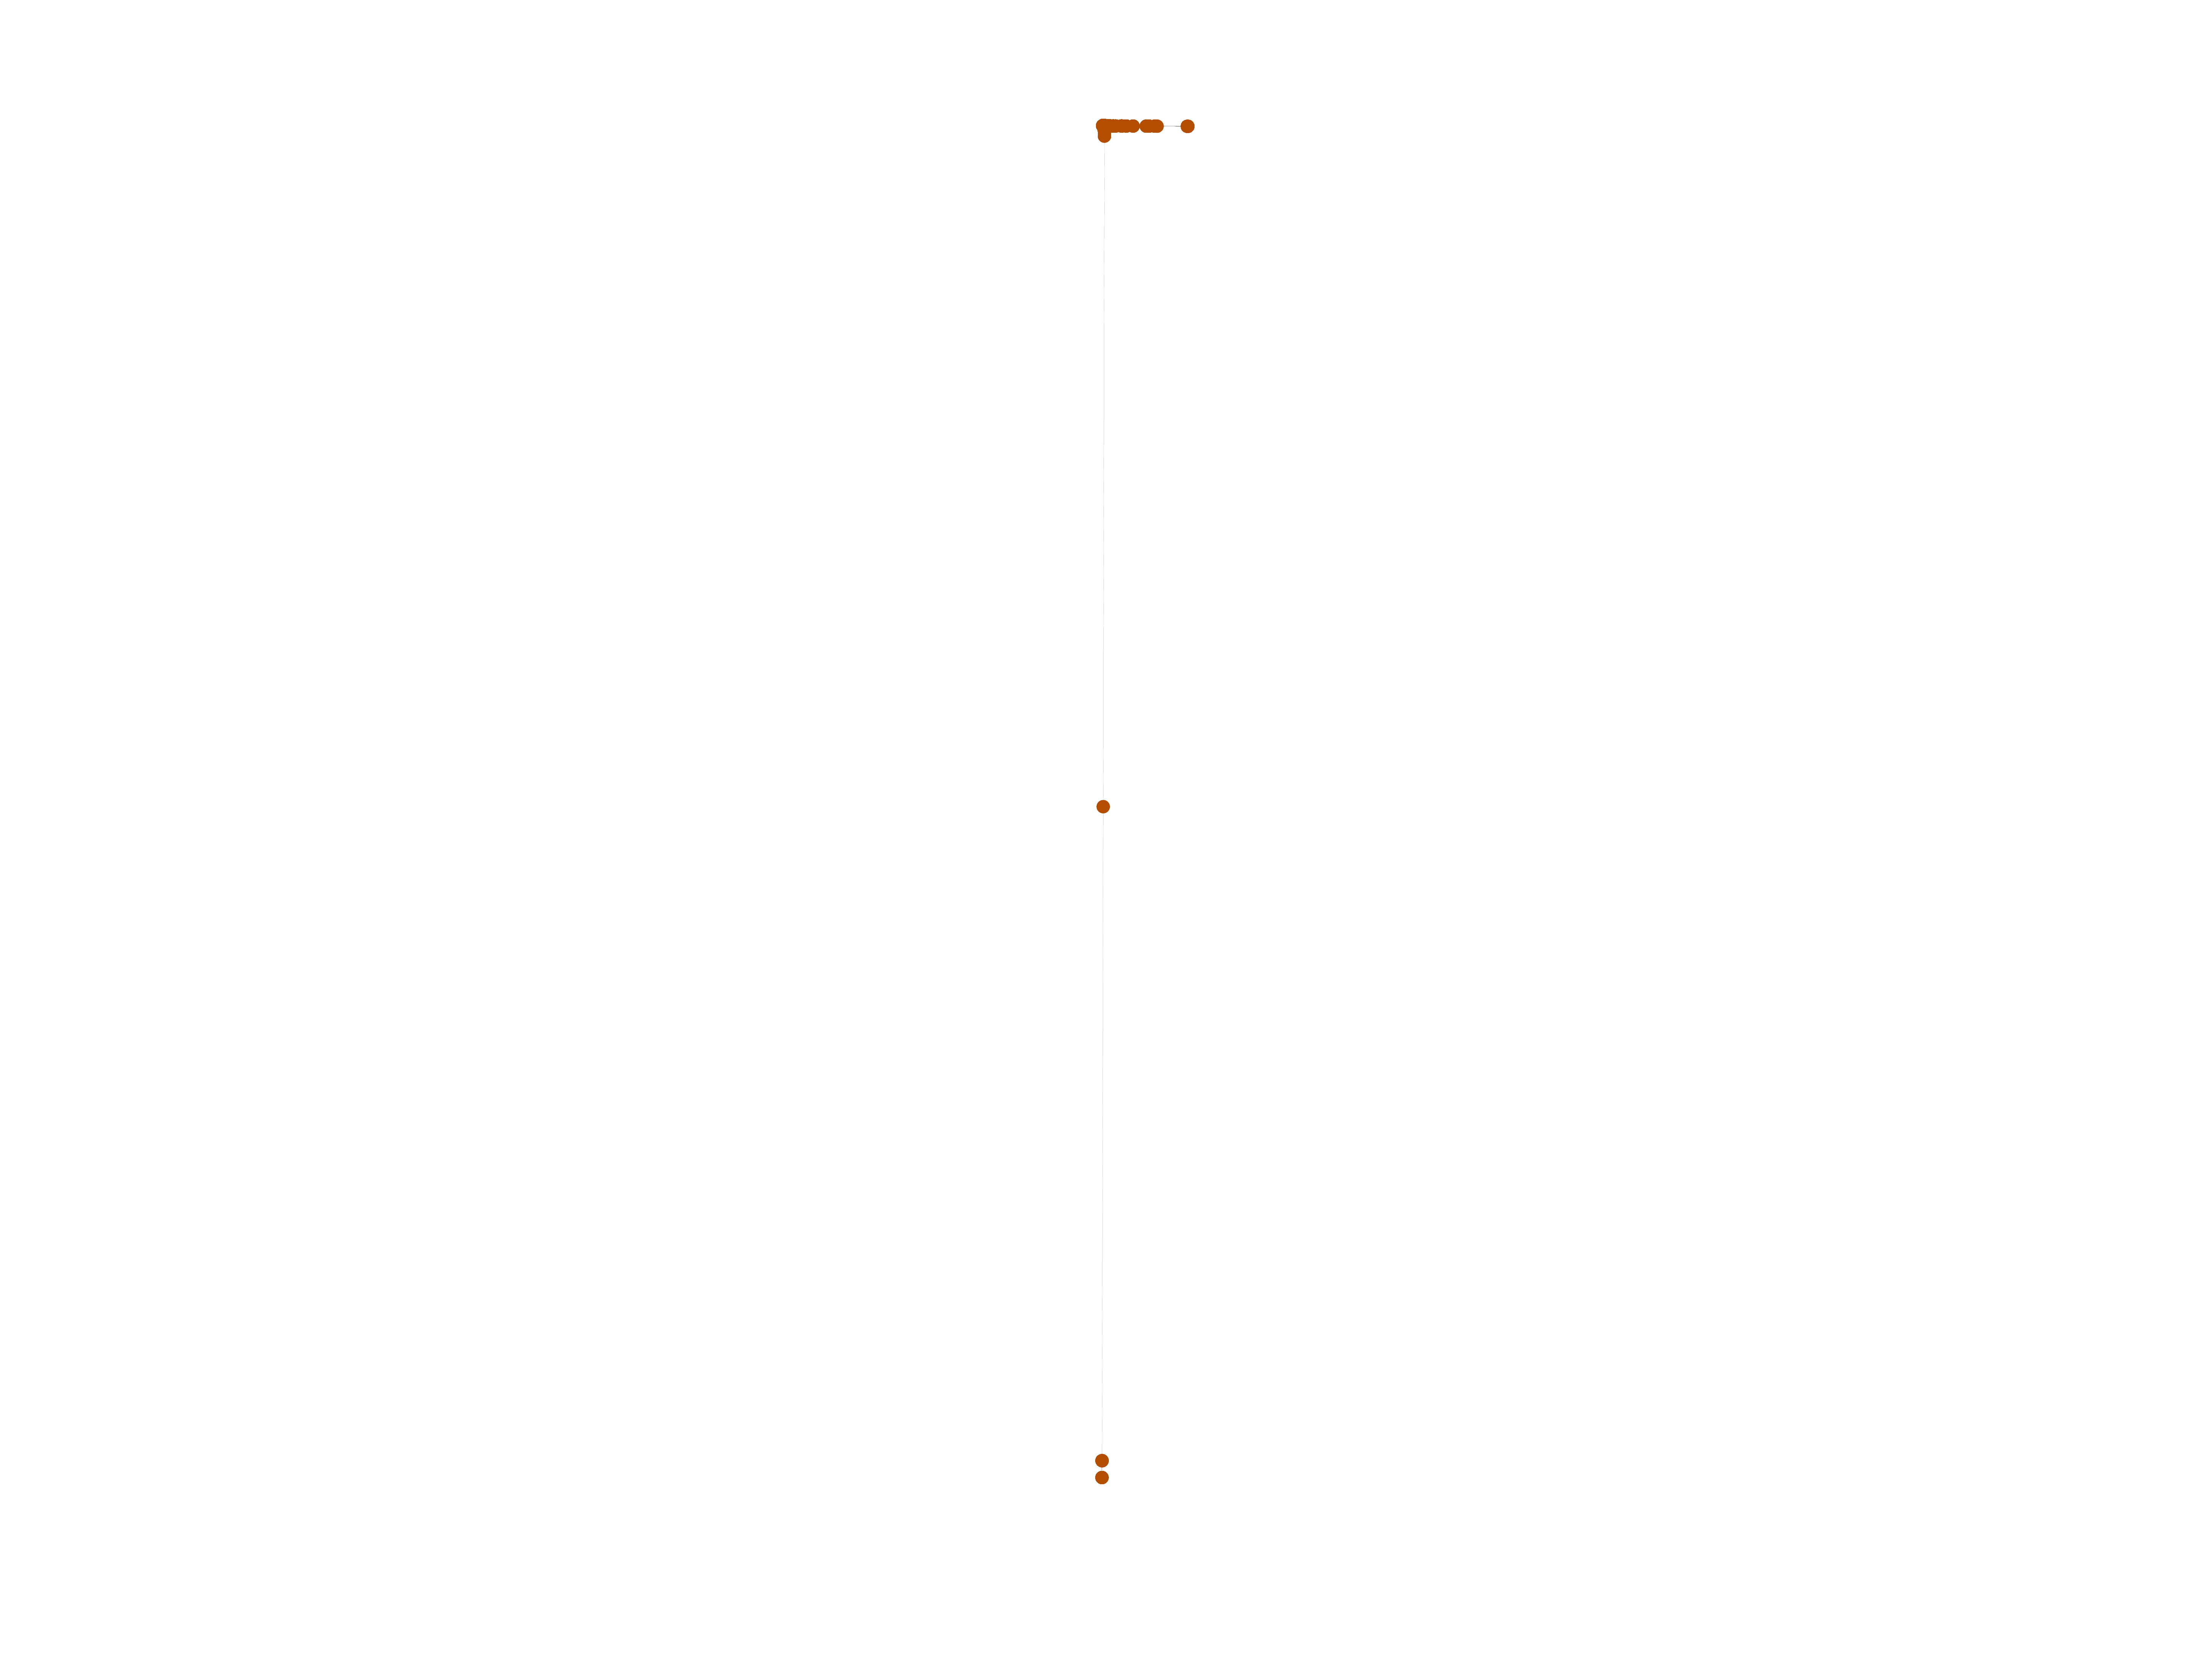
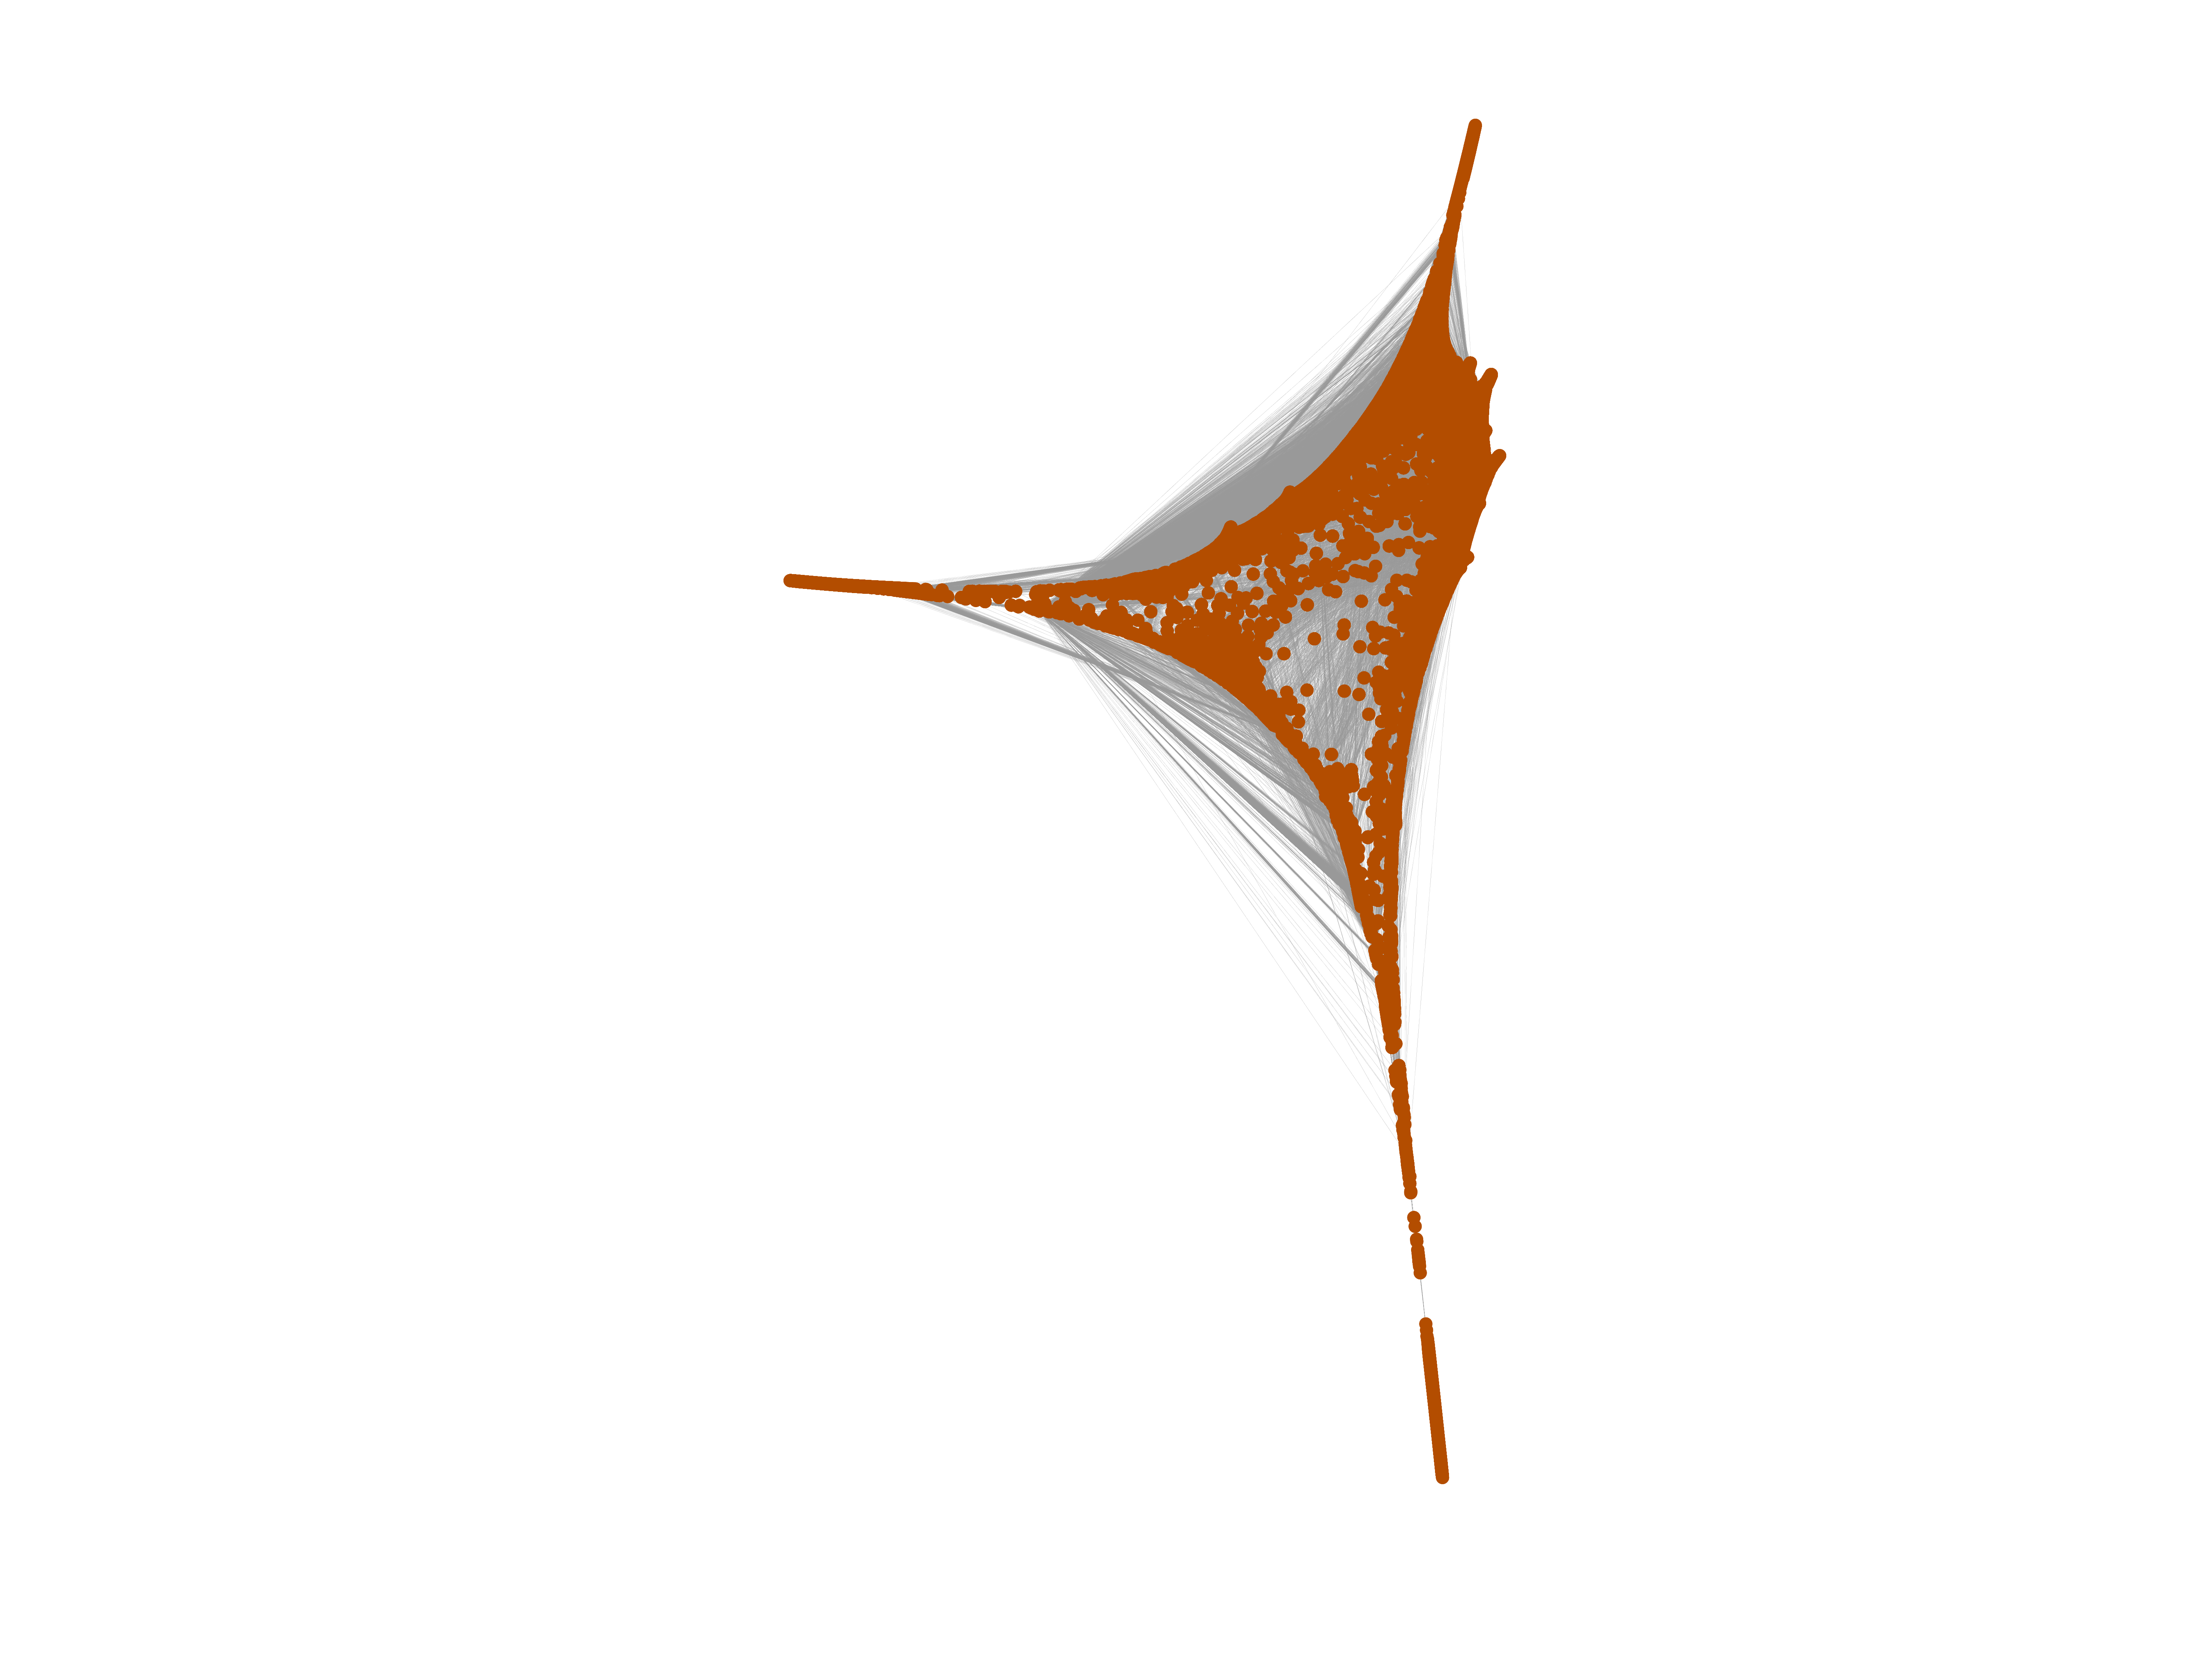
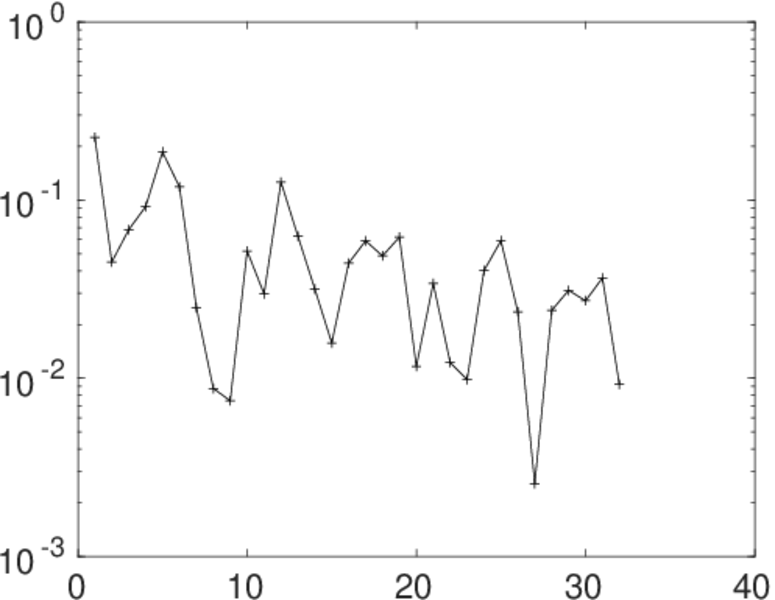
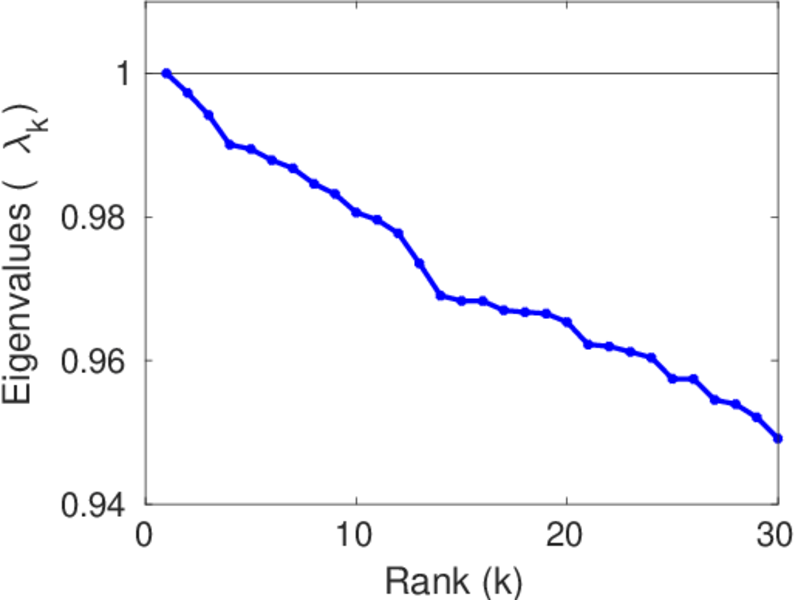
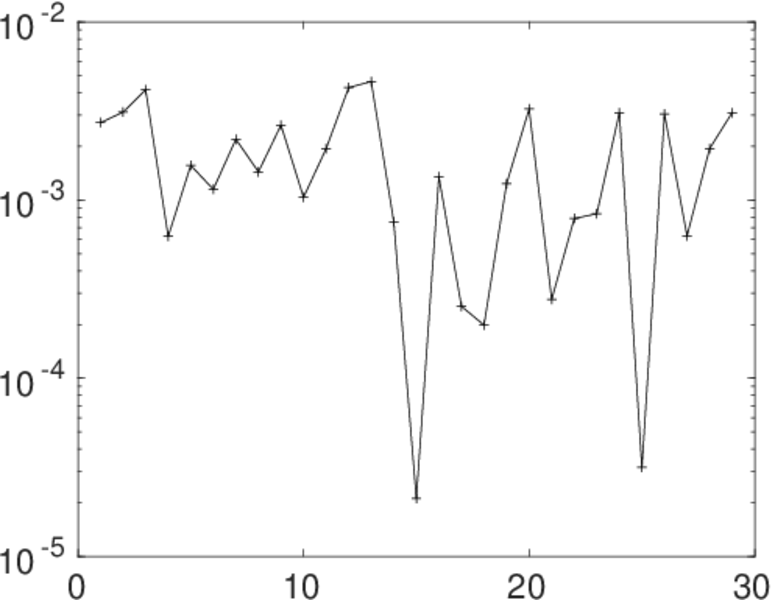
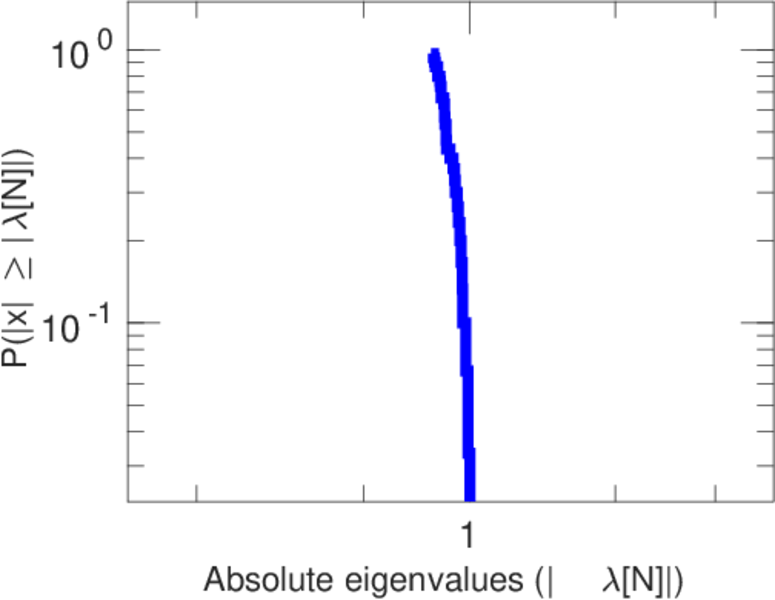
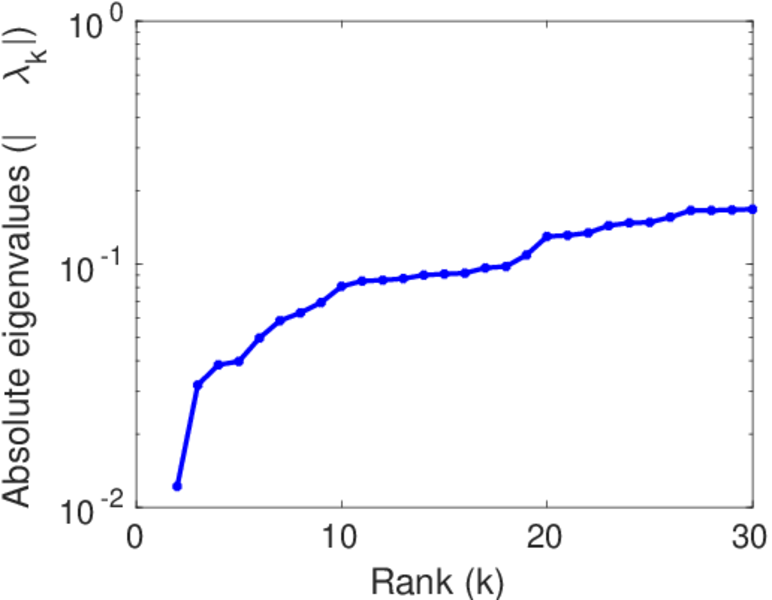
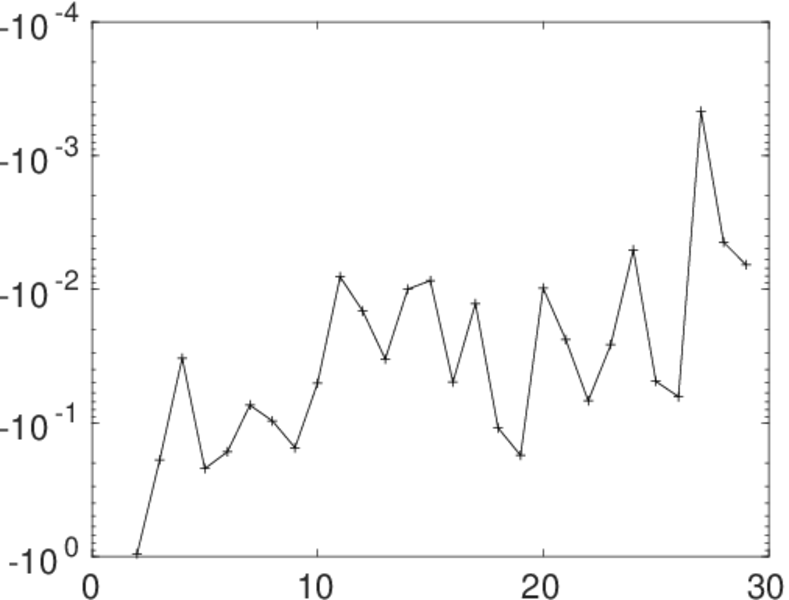
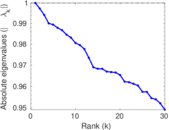
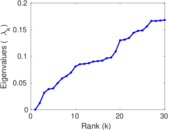
Matrix decompositions plots


Downloads
References
|
[1]
|
Jérôme Kunegis.
KONECT – The Koblenz Network Collection.
In Proc. Int. Conf. on World Wide Web Companion, pages
1343–1350, 2013.
[ http ]
|
|
[2]
|
Wikimedia Foundation.
Wikimedia downloads.
http://dumps.wikimedia.org/, January 2010.
|
 KONECT ‣ Networks ‣
Buy Me a Coffee
KONECT ‣ Networks ‣
Buy Me a Coffee