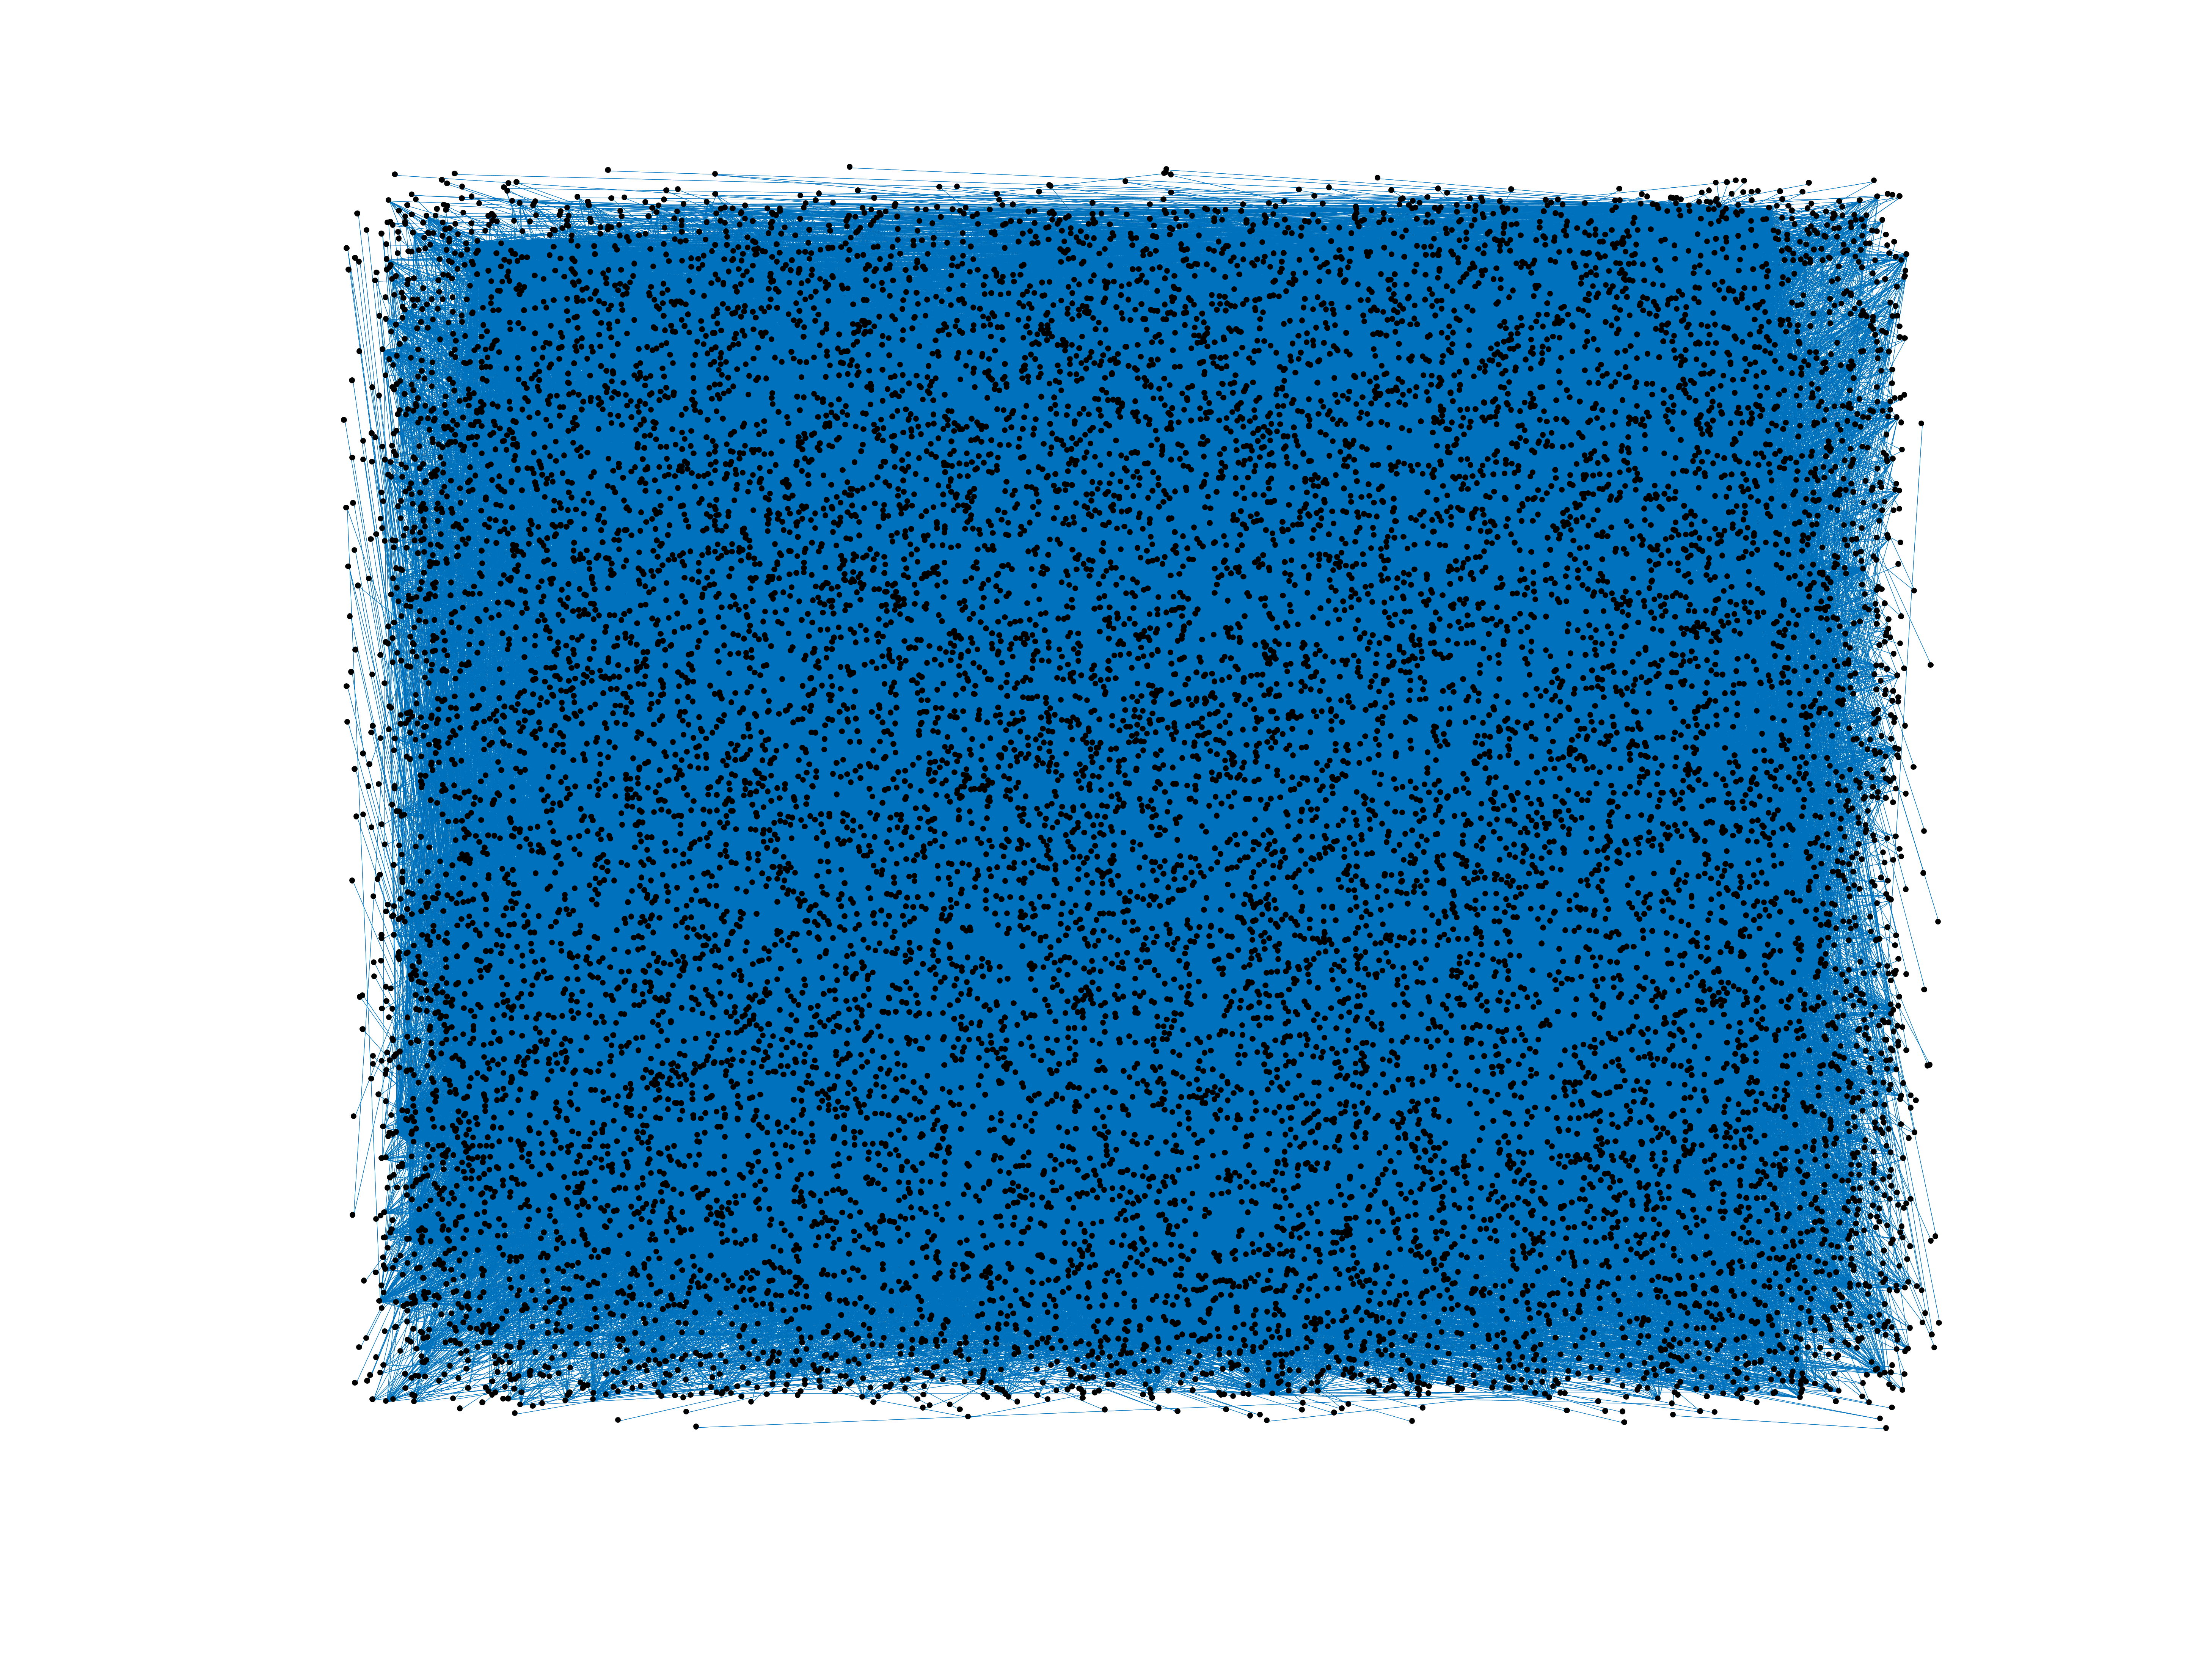
Wikipedia edits (lad)
This is the bipartite edit network of the Ladino Wikipedia. It contains users
and pages from the Ladino Wikipedia, connected by edit events. Each edge
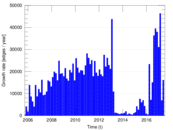
represents an edit. The dataset includes the timestamp of each edit.
Metadata
Statistics
| Size | n = | 15,044
|
| Left size | n1 = | 1,406
|
| Right size | n2 = | 13,638
|
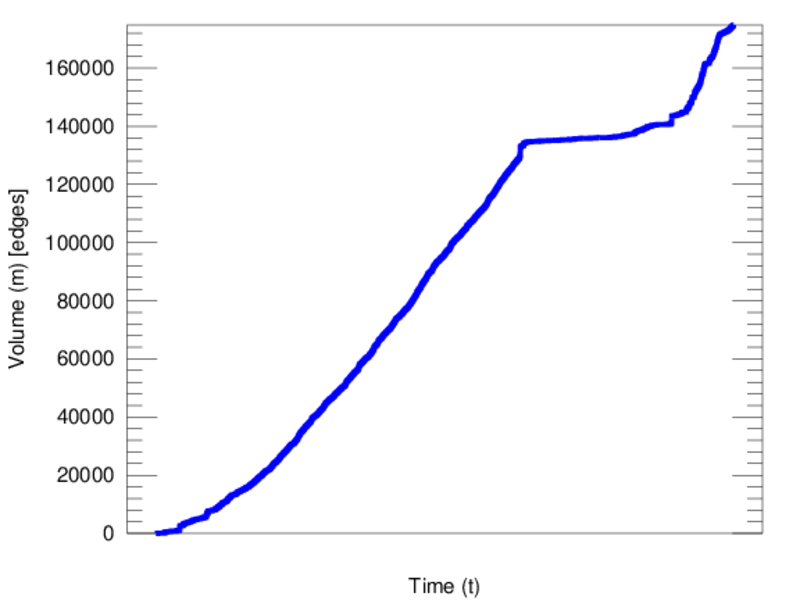
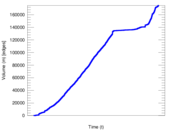
| Volume | m = | 174,807
|
| Unique edge count | m̿ = | 72,407
|
| Wedge count | s = | 60,172,819
|
| Claw count | z = | 57,642,275,619
|
| Cross count | x = | 51,431,766,552,268
|
| Square count | q = | 130,208,998
|
| 4-Tour count | T4 = | 1,282,535,050
|
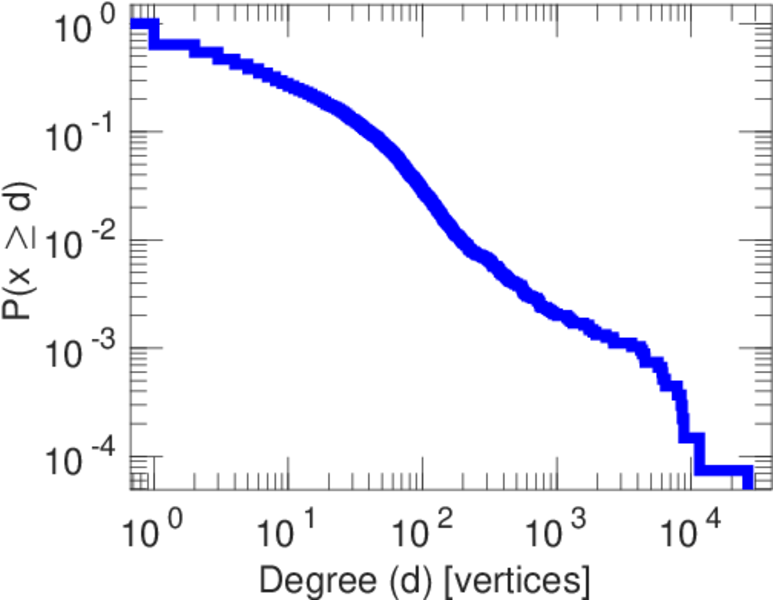
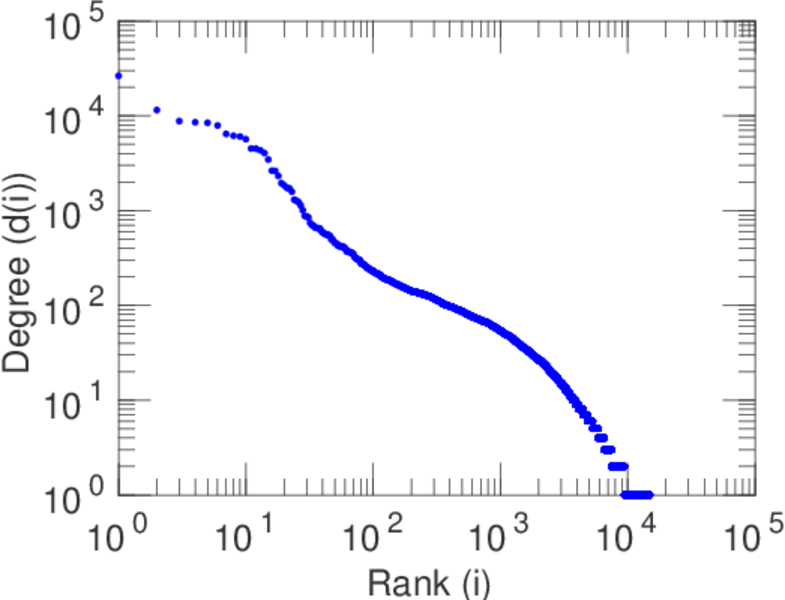
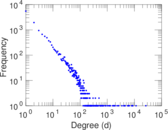
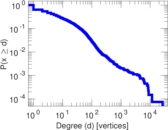
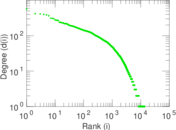
| Maximum degree | dmax = | 26,383
|
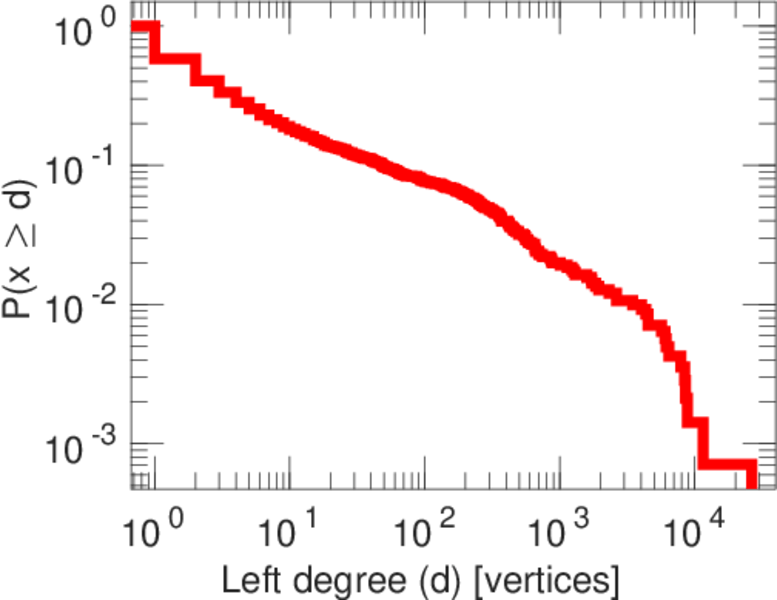
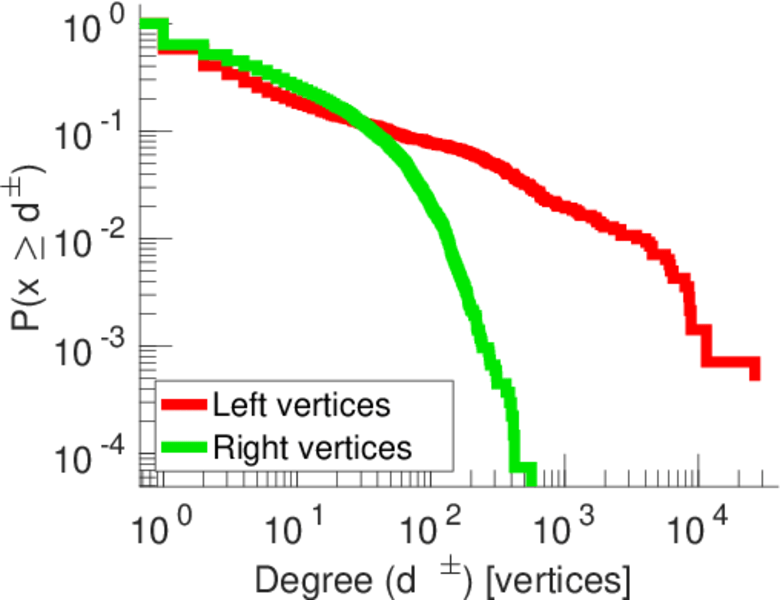
| Maximum left degree | d1max = | 26,383
|
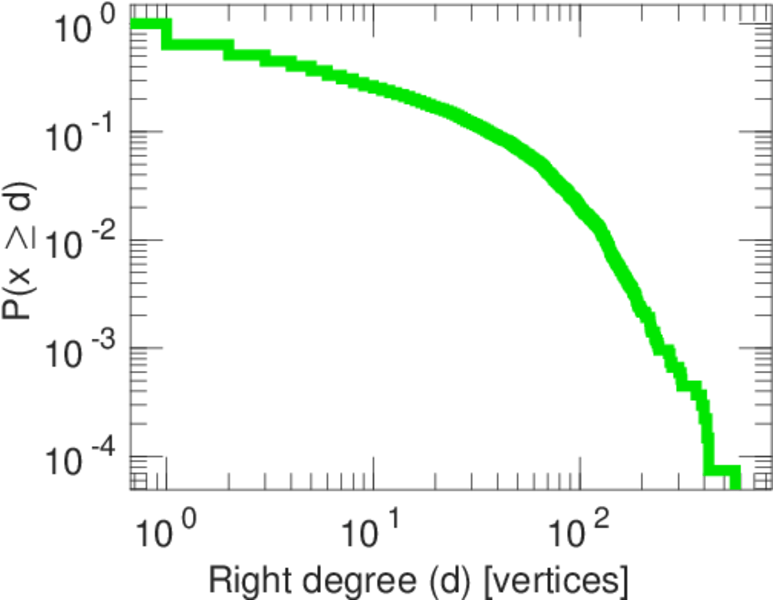
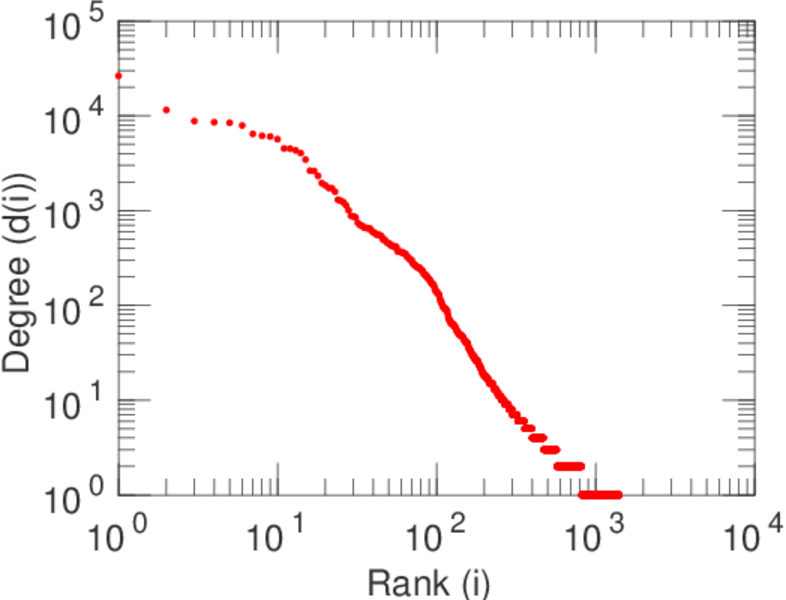
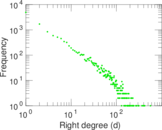
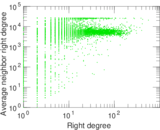
| Maximum right degree | d2max = | 565
|
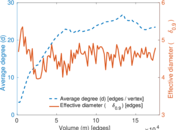
| Average degree | d = | 23.239 4
|
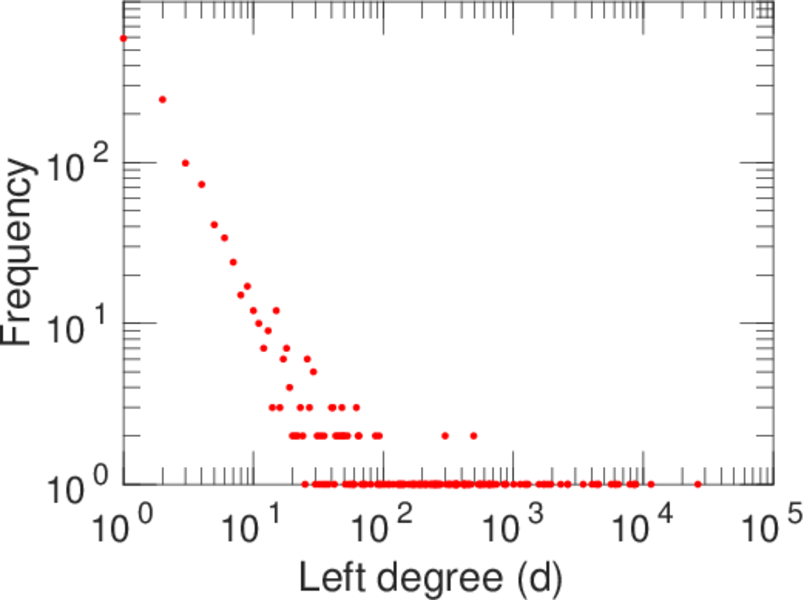
| Average left degree | d1 = | 124.329
|
| Average right degree | d2 = | 12.817 6
|
| Fill | p = | 0.003 776 11
|
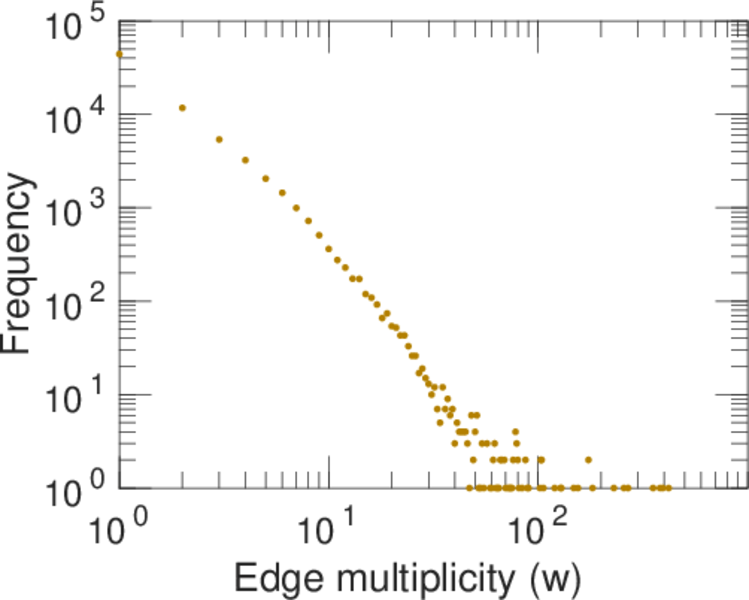
| Average edge multiplicity | m̃ = | 2.414 23
|
| Size of LCC | N = | 14,351
|
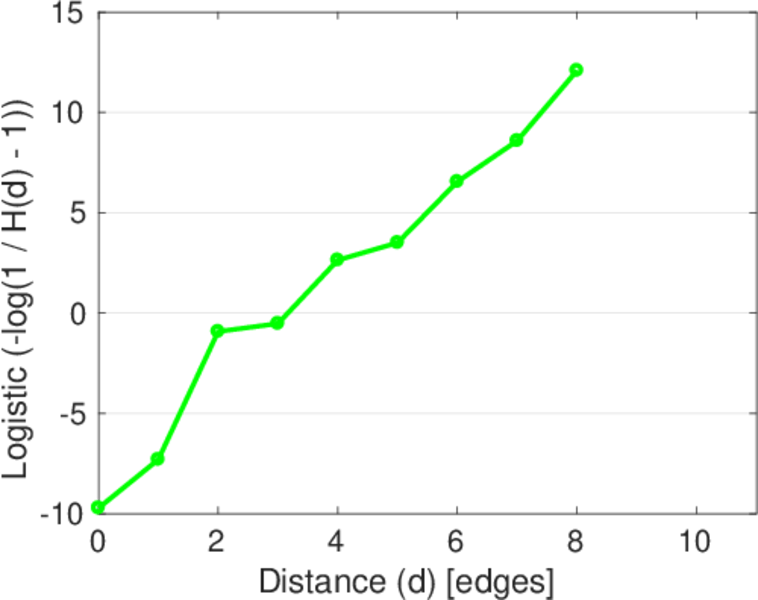
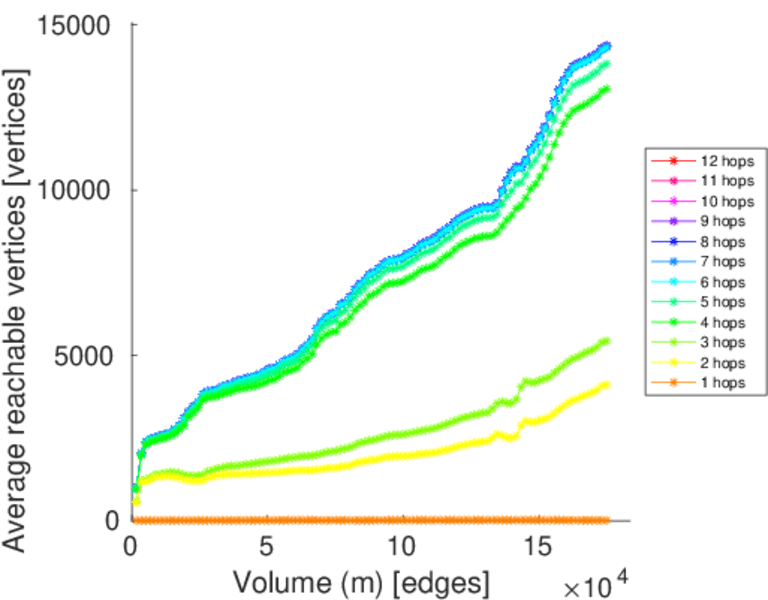
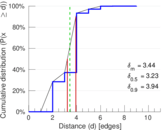
| Diameter | δ = | 11
|
| 50-Percentile effective diameter | δ0.5 = | 3.228 95
|
| 90-Percentile effective diameter | δ0.9 = | 3.941 07
|
| Median distance | δM = | 4
|
| Mean distance | δm = | 3.441 29
|
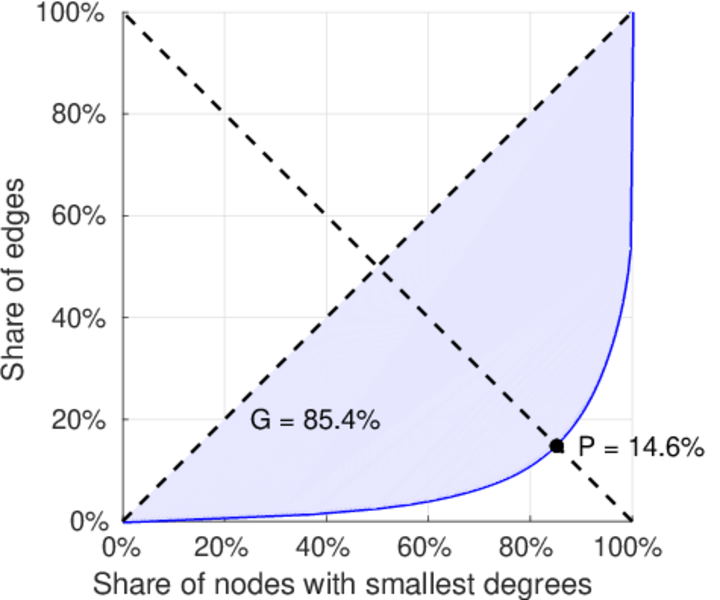
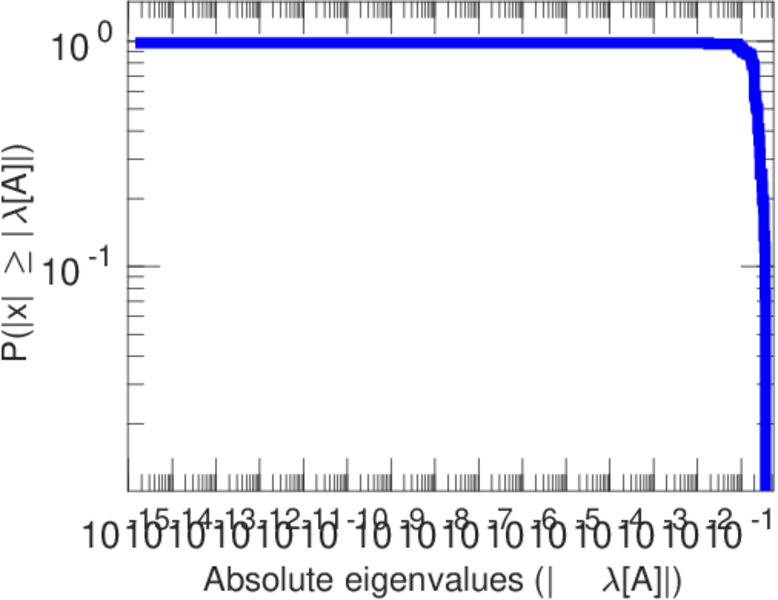
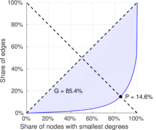
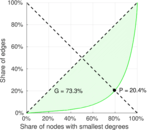
| Gini coefficient | G = | 0.854 955
|
| Balanced inequality ratio | P = | 0.148 821
|
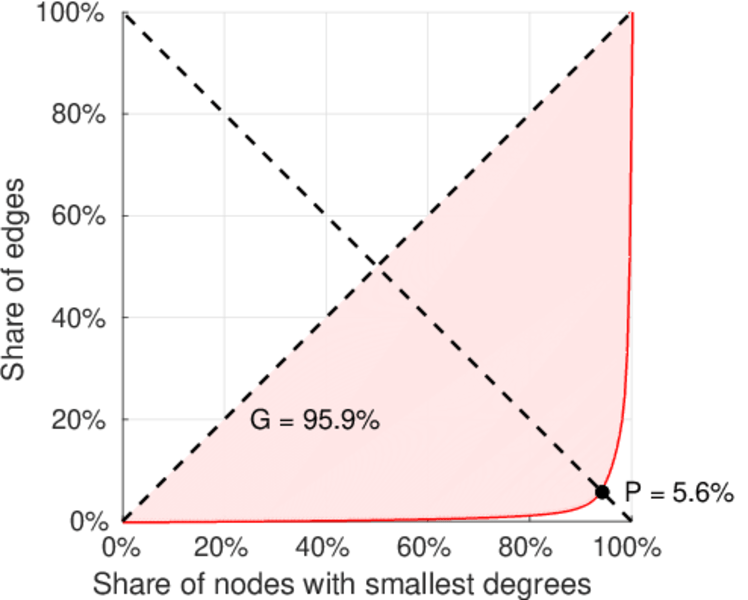
| Left balanced inequality ratio | P1 = | 0.055 793 0
|
| Right balanced inequality ratio | P2 = | 0.203 928
|
| Relative edge distribution entropy | Her = | 0.757 818
|
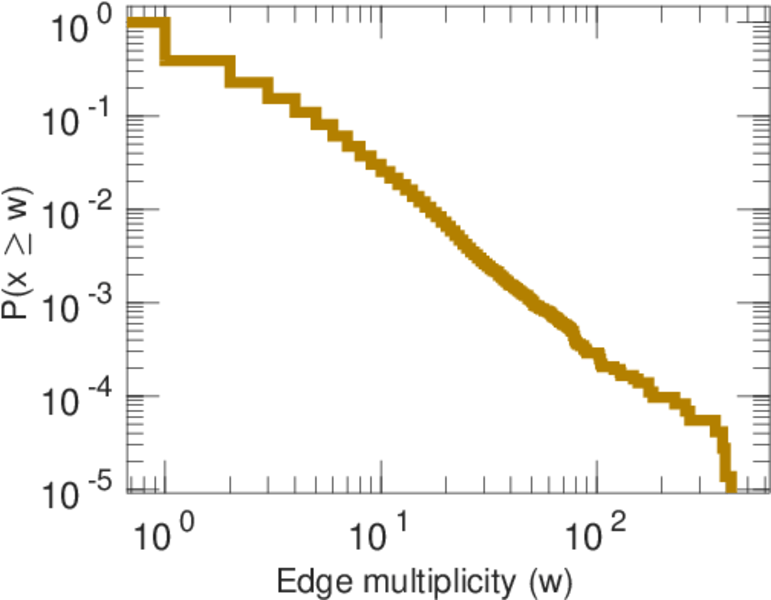
| Power law exponent | γ = | 2.112 85
|
| Tail power law exponent | γt = | 1.731 00
|
| Tail power law exponent with p | γ3 = | 1.731 00
|
| p-value | p = | 0.000 00
|
| Left tail power law exponent with p | γ3,1 = | 1.661 00
|
| Left p-value | p1 = | 0.000 00
|
| Right tail power law exponent with p | γ3,2 = | 1.741 00
|
| Right p-value | p2 = | 0.000 00
|
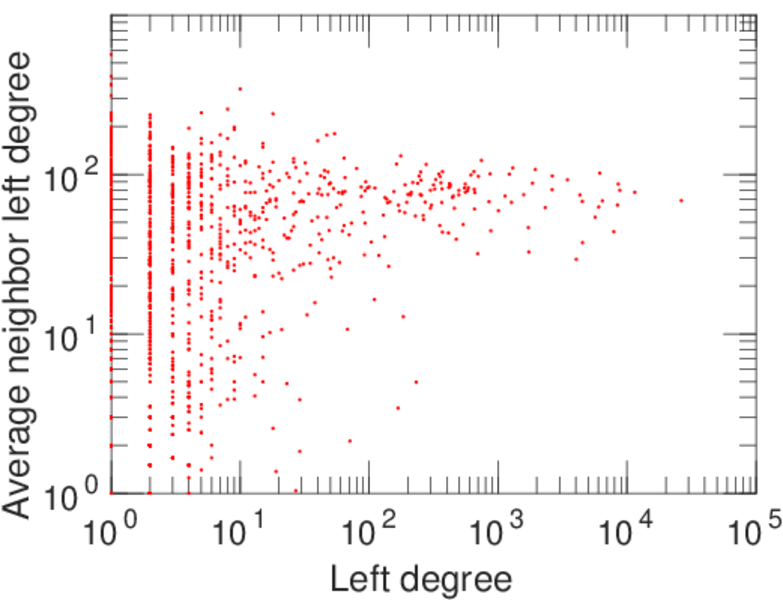
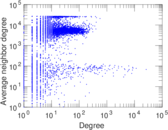
| Degree assortativity | ρ = | −0.371 109
|
| Degree assortativity p-value | pρ = | 0.000 00
|
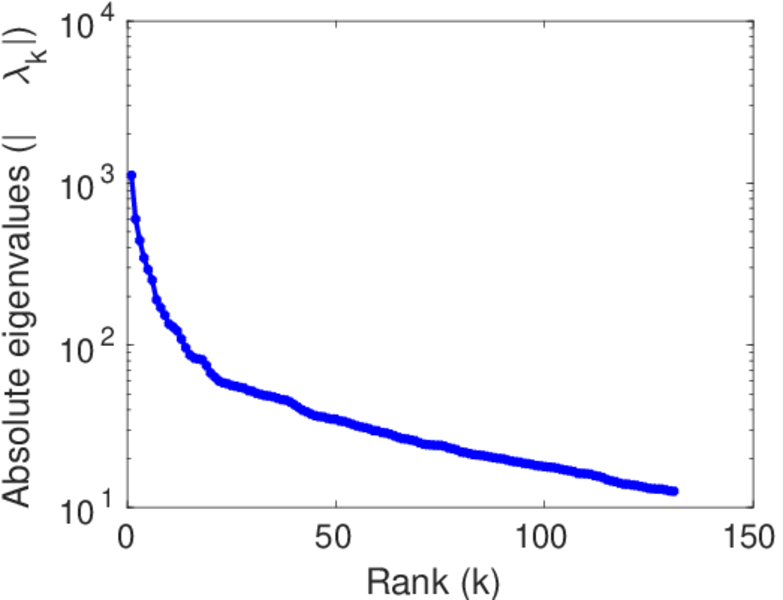
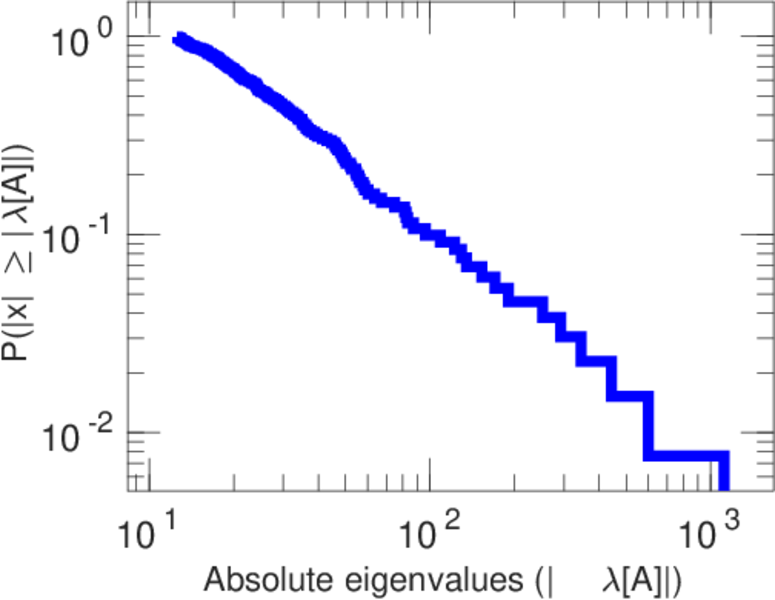
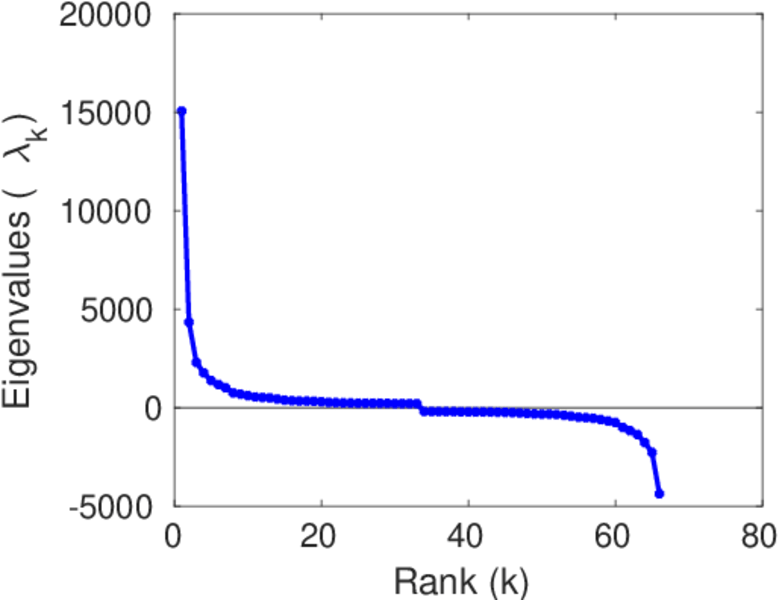
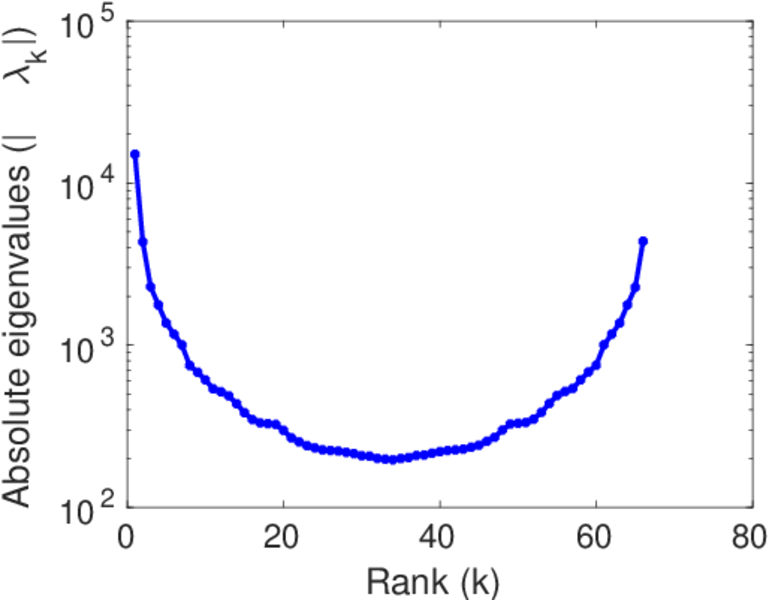
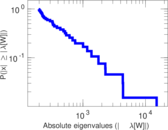
| Spectral norm | α = | 1,115.04
|
| Algebraic connectivity | a = | 0.018 063 8
|
| Spectral separation | |λ1[A] / λ2[A]| = | 1.858 88
|
| Controllability | C = | 12,275
|
| Relative controllability | Cr = | 0.824 434
|
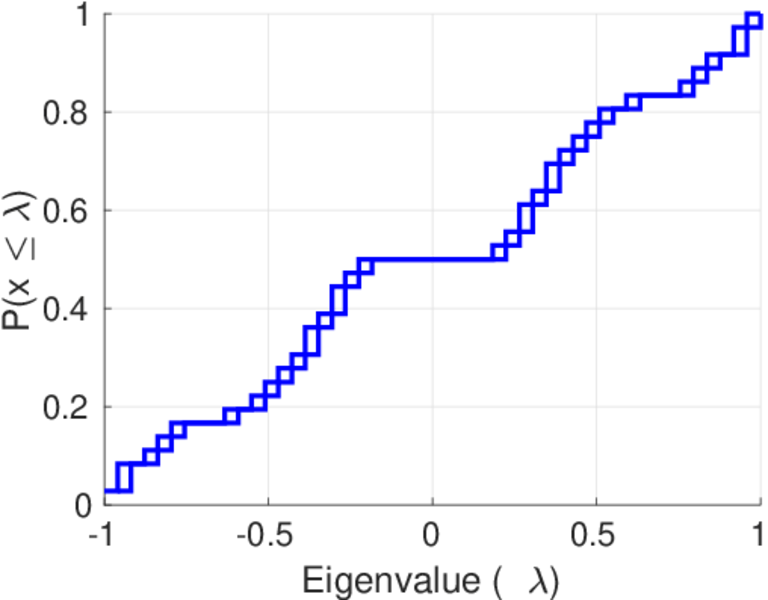
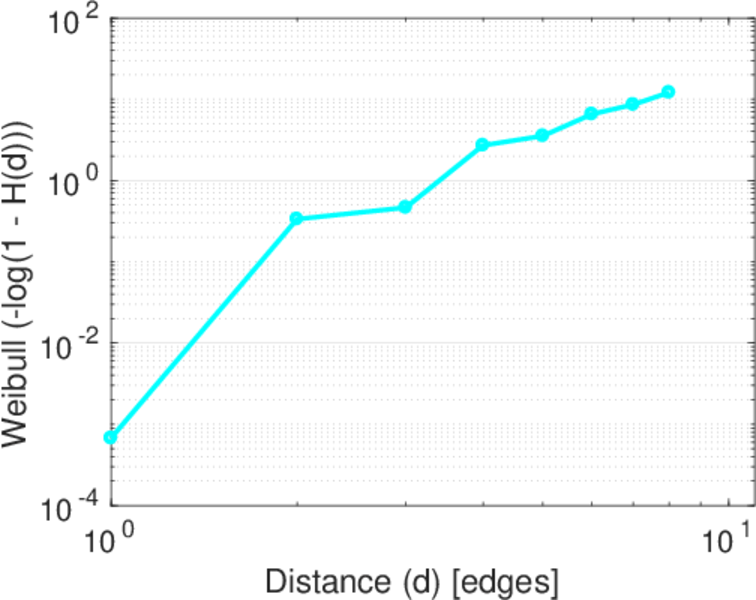
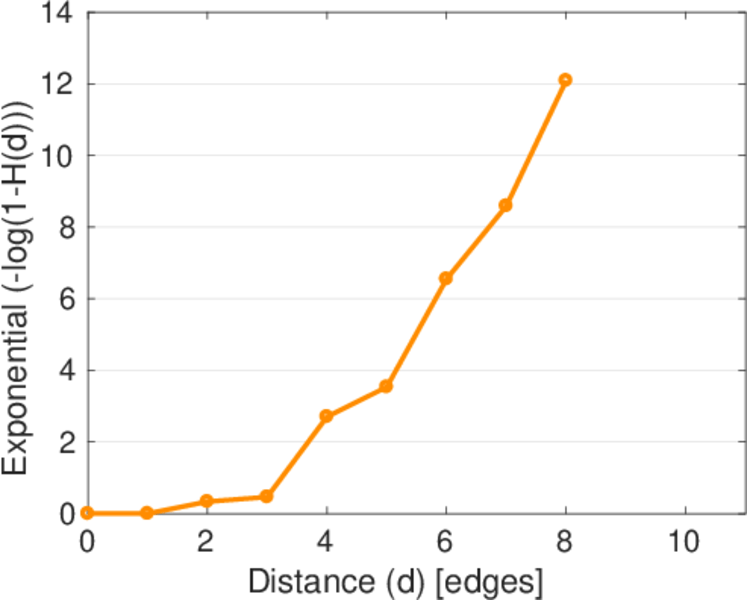
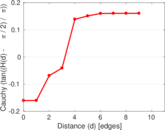
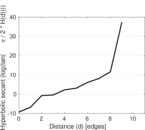
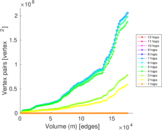
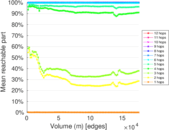
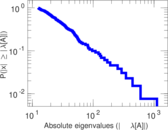
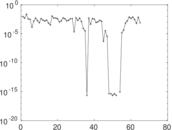
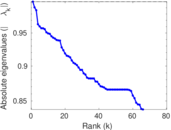
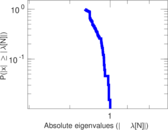
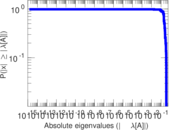
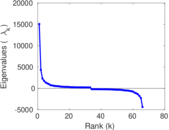
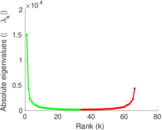
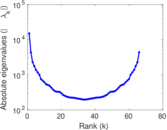
Plots


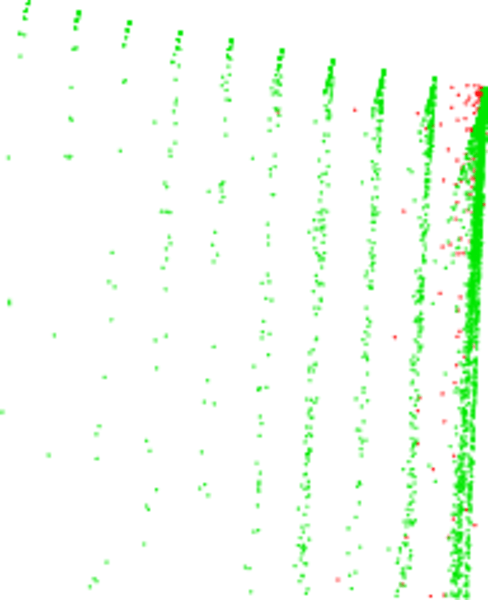
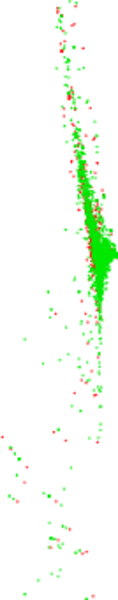
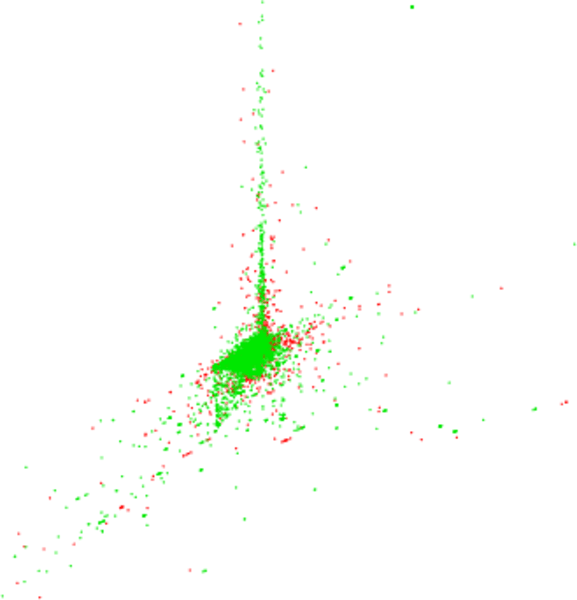
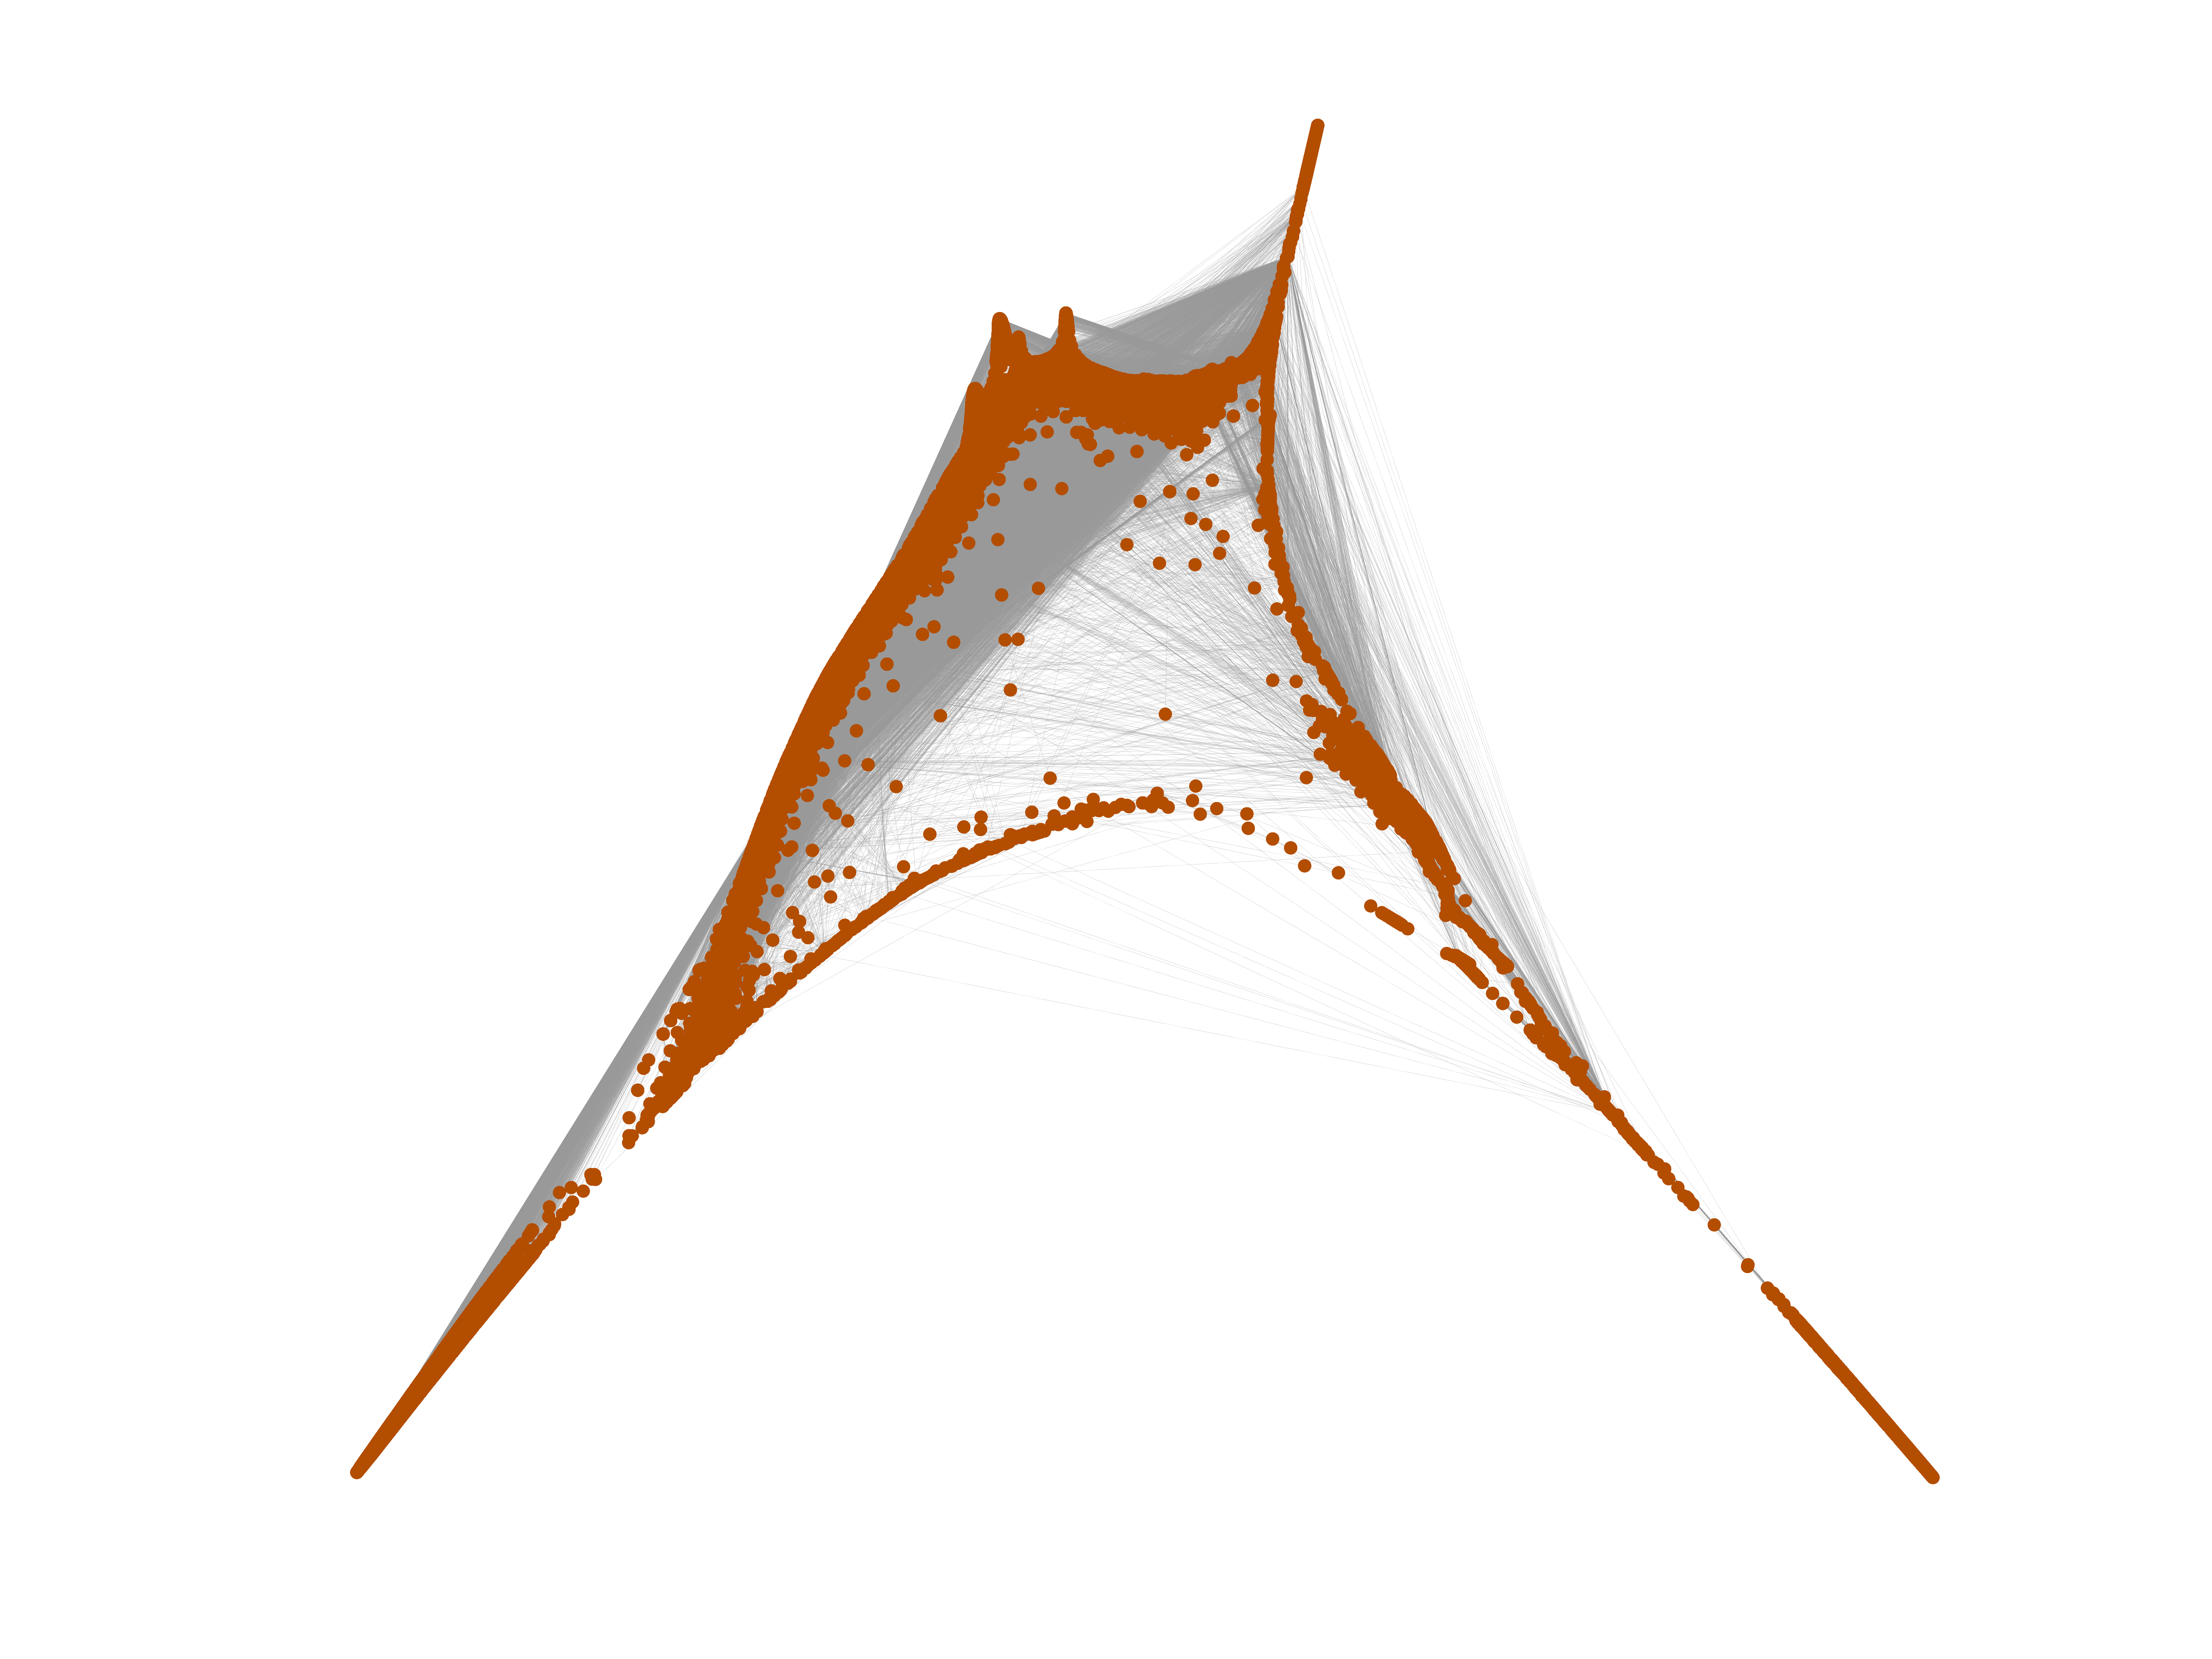
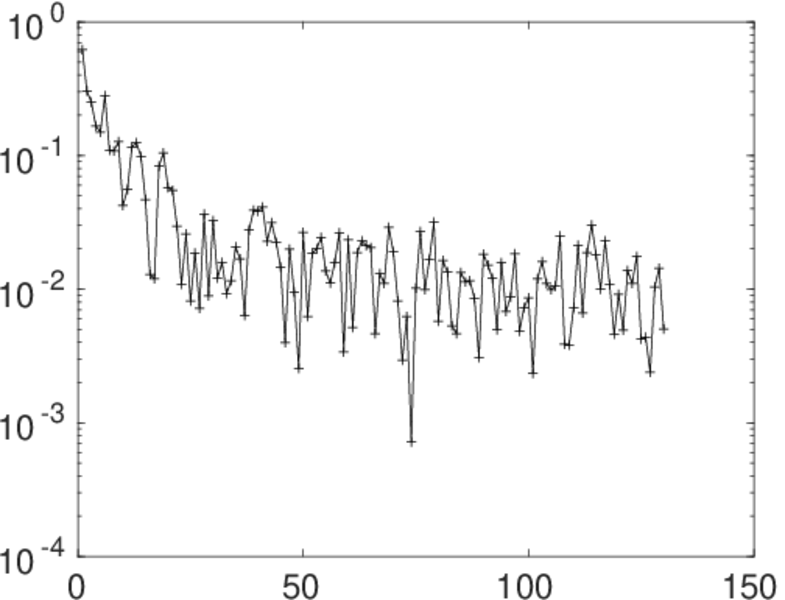
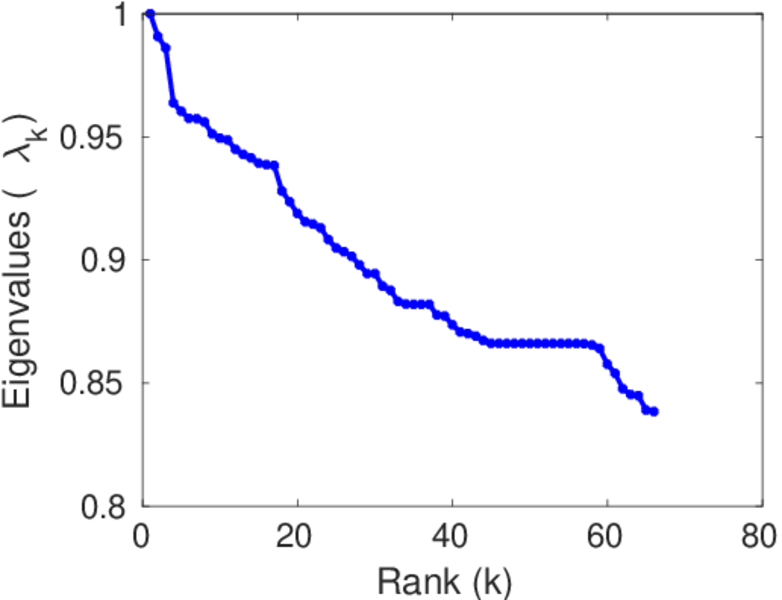
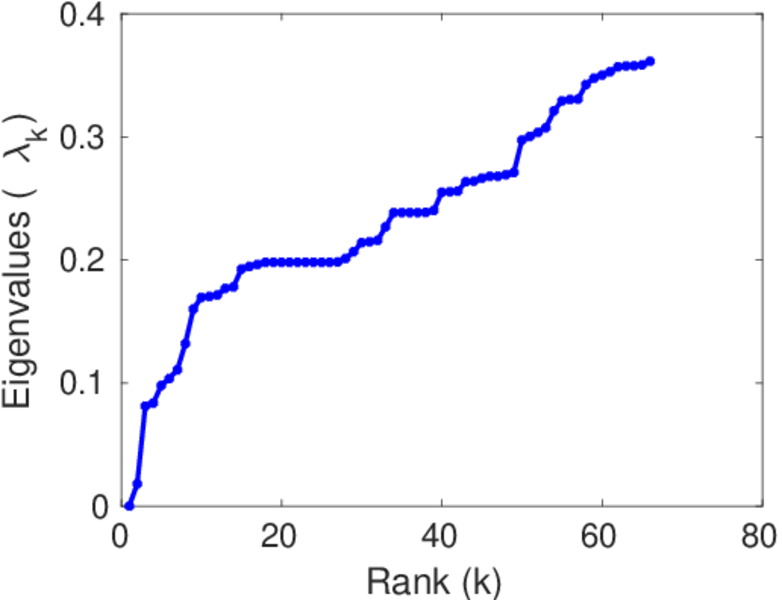
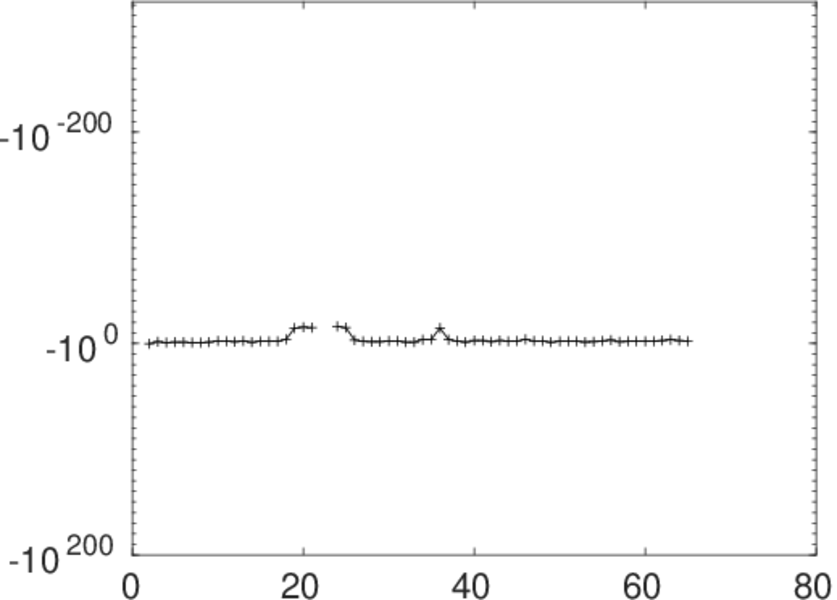
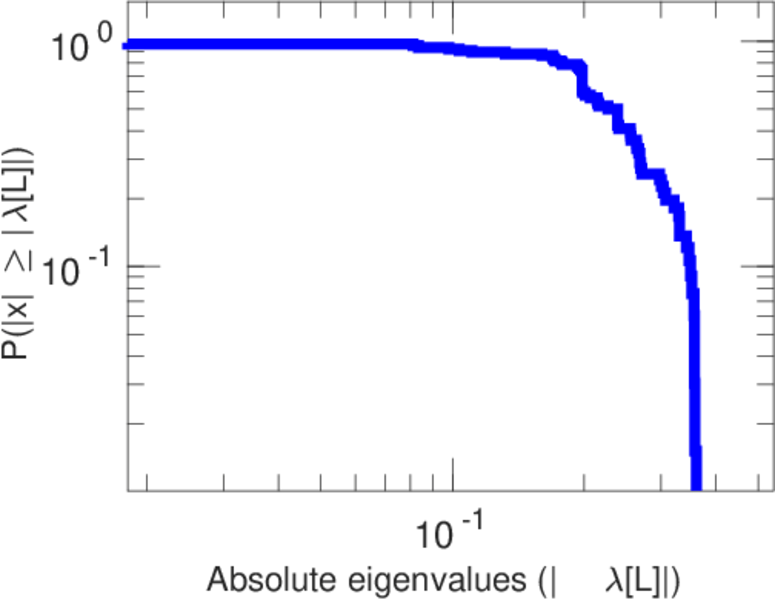
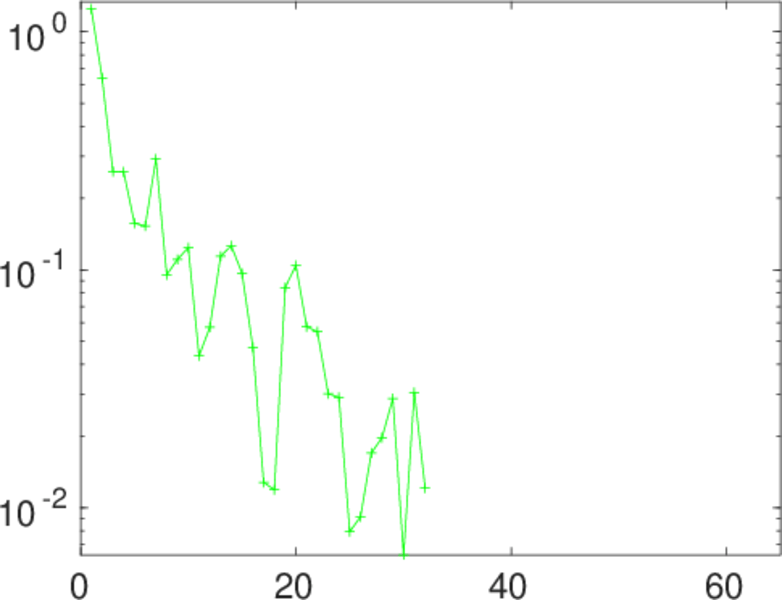
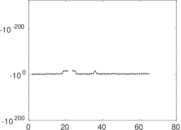
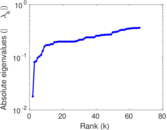
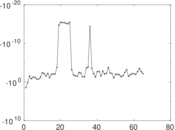
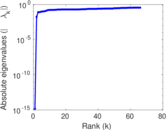
Matrix decompositions plots


Downloads
References
|
[1]
|
Jérôme Kunegis.
KONECT – The Koblenz Network Collection.
In Proc. Int. Conf. on World Wide Web Companion, pages
1343–1350, 2013.
[ http ]
|
|
[2]
|
Wikimedia Foundation.
Wikimedia downloads.
http://dumps.wikimedia.org/, January 2010.
|
 KONECT ‣ Networks ‣
Buy Me a Coffee
KONECT ‣ Networks ‣
Buy Me a Coffee