Wikipedia edits (la)
This is the bipartite edit network of the Latin Wikipedia. It contains users
and pages from the Latin Wikipedia, connected by edit events. Each edge
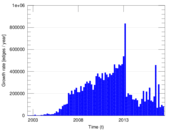
represents an edit. The dataset includes the timestamp of each edit.
Metadata
Statistics
| Size | n = | 256,074
|
| Left size | n1 = | 10,610
|
| Right size | n2 = | 245,464
|
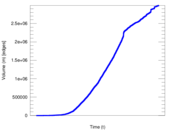
| Volume | m = | 2,989,365
|
| Unique edge count | m̿ = | 1,459,485
|
| Wedge count | s = | 28,217,772,934
|
| Claw count | z = | 654,428,851,241,290
|
| Square count | q = | 40,389,482,804
|
| 4-Tour count | T4 = | 435,993,250,854
|
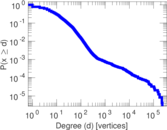
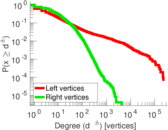
| Maximum degree | dmax = | 231,494
|
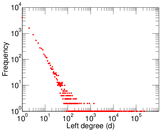
| Maximum left degree | d1max = | 231,494
|
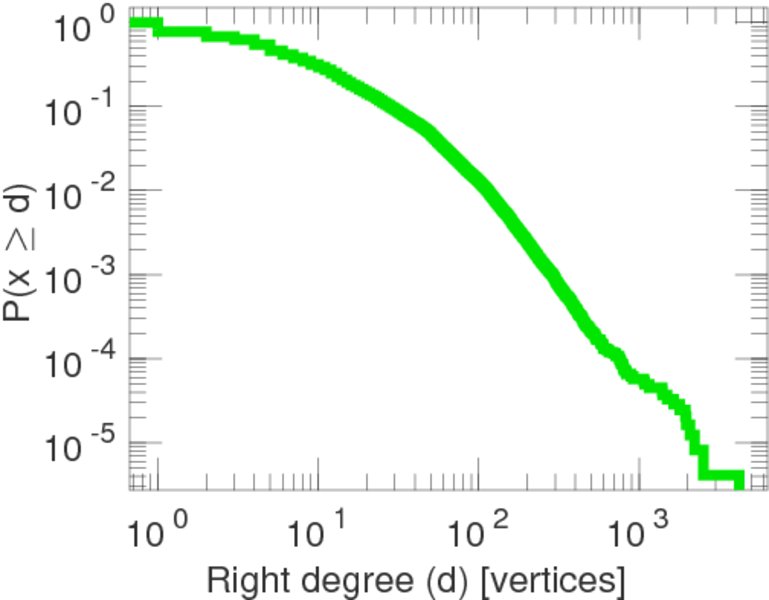
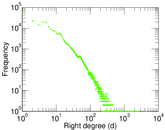
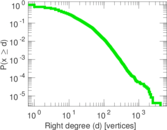
| Maximum right degree | d2max = | 4,204
|
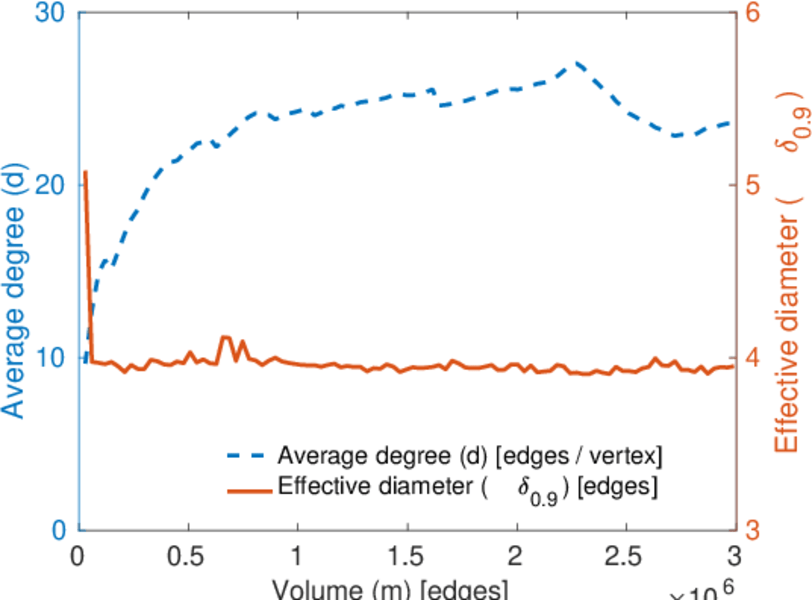
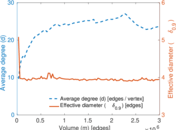
| Average degree | d = | 23.347 7
|
| Average left degree | d1 = | 281.750
|
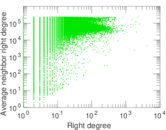
| Average right degree | d2 = | 12.178 4
|
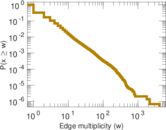
| Average edge multiplicity | m̃ = | 2.048 23
|
| Size of LCC | N = | 251,981
|
| Diameter | δ = | 12
|
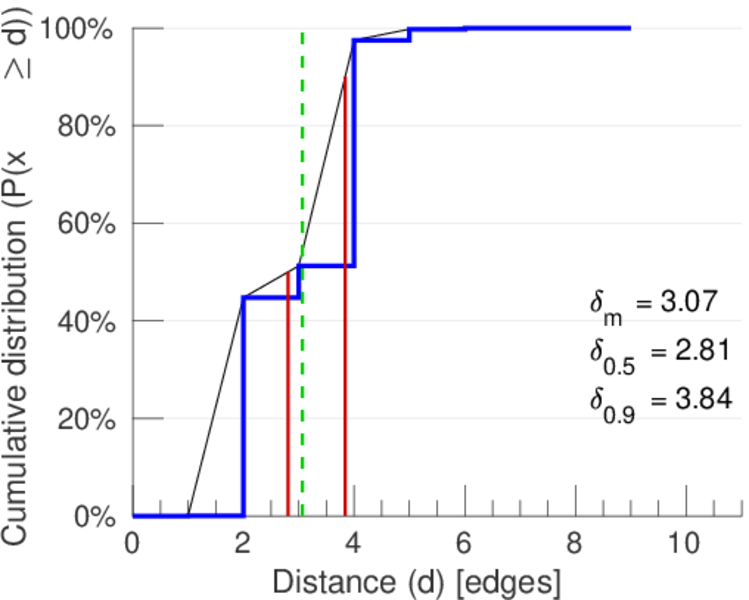
| 50-Percentile effective diameter | δ0.5 = | 2.807 87
|
| 90-Percentile effective diameter | δ0.9 = | 3.837 95
|
| Median distance | δM = | 3
|
| Mean distance | δm = | 3.067 61
|
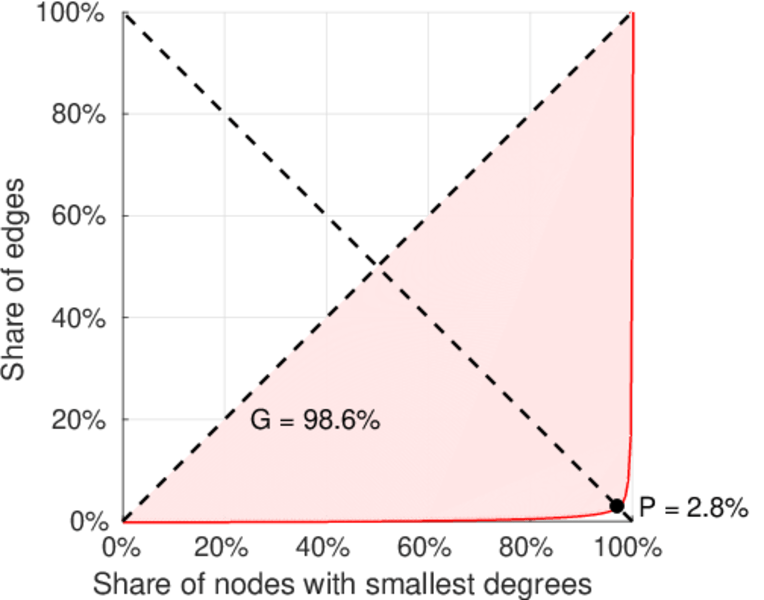
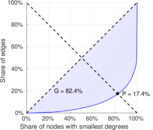
| Gini coefficient | G = | 0.824 765
|
| Balanced inequality ratio | P = | 0.172 676
|
| Left balanced inequality ratio | P1 = | 0.028 267 9
|
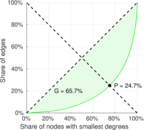
| Right balanced inequality ratio | P2 = | 0.246 885
|
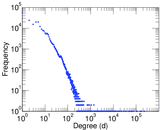
| Power law exponent | γ = | 1.817 49
|
| Tail power law exponent | γt = | 2.651 00
|
| Degree assortativity | ρ = | −0.312 822
|
| Degree assortativity p-value | pρ = | 0.000 00
|
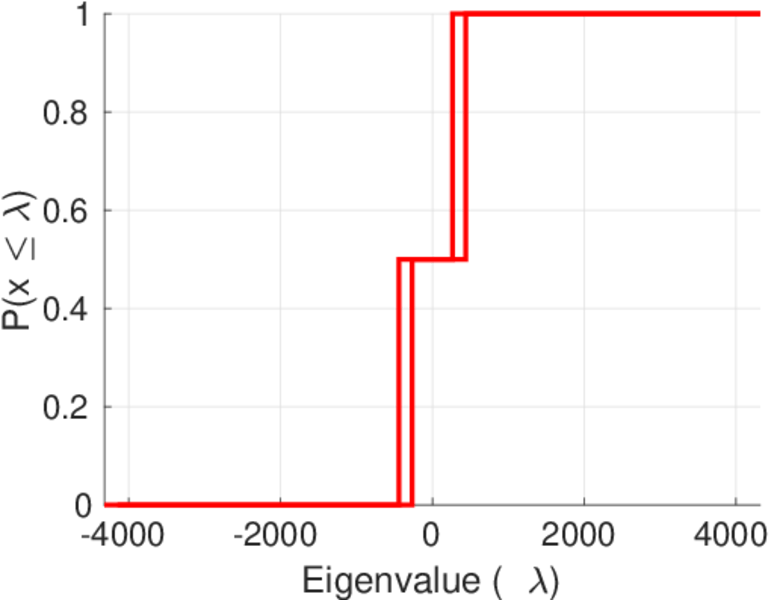
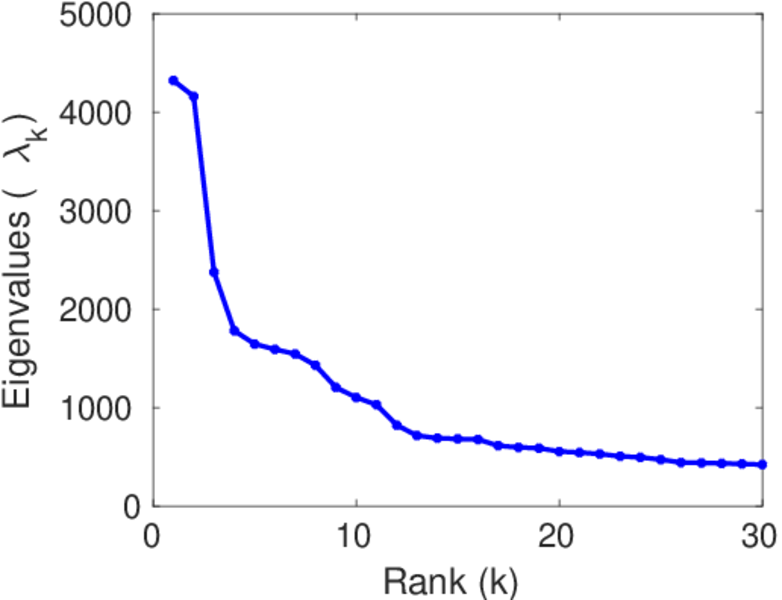
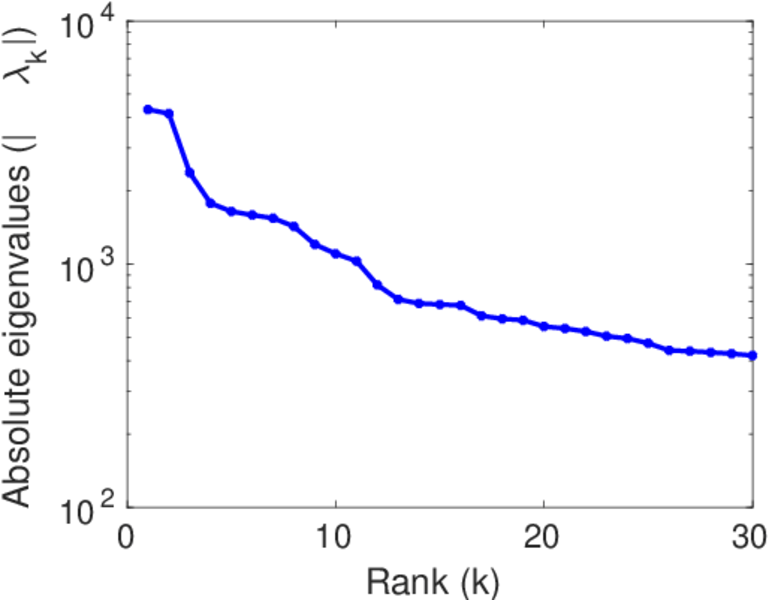
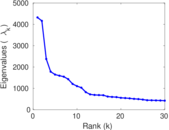
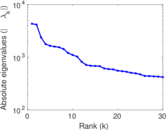
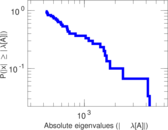
| Spectral norm | α = | 4,321.17
|
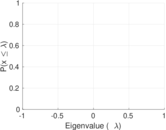
| Algebraic connectivity | a = | 0.050 612 1
|
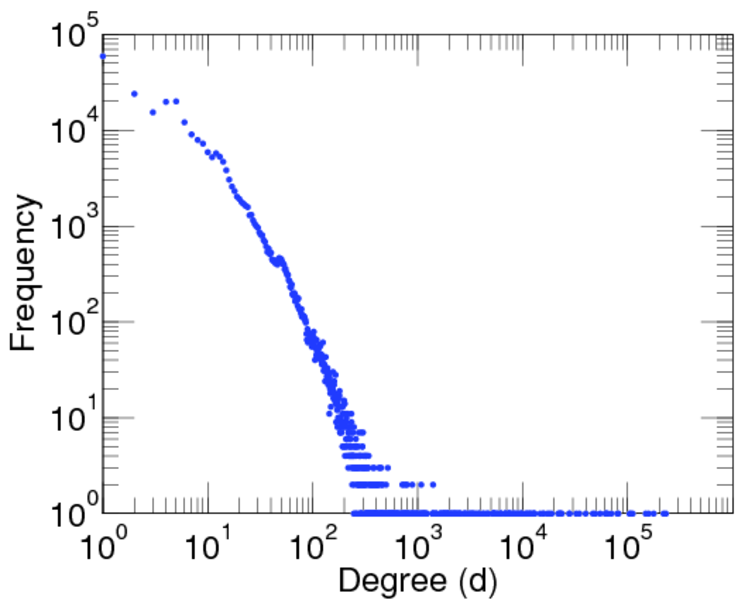
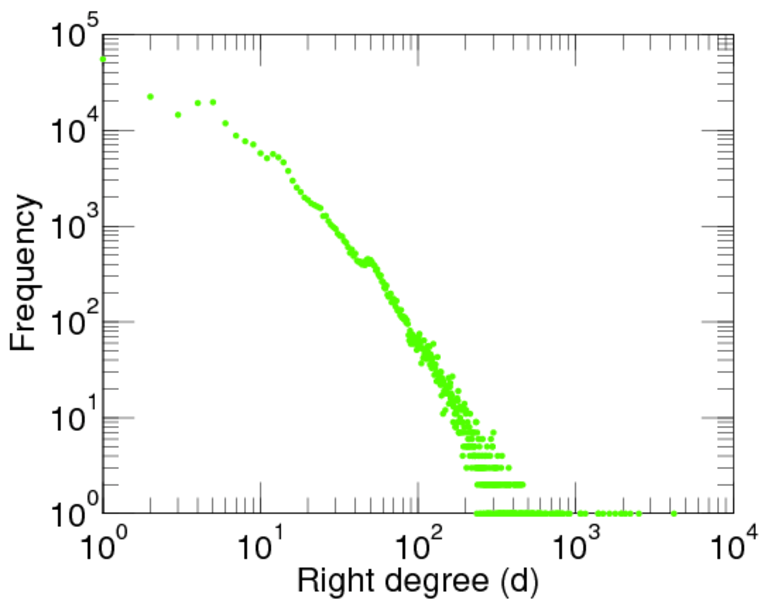
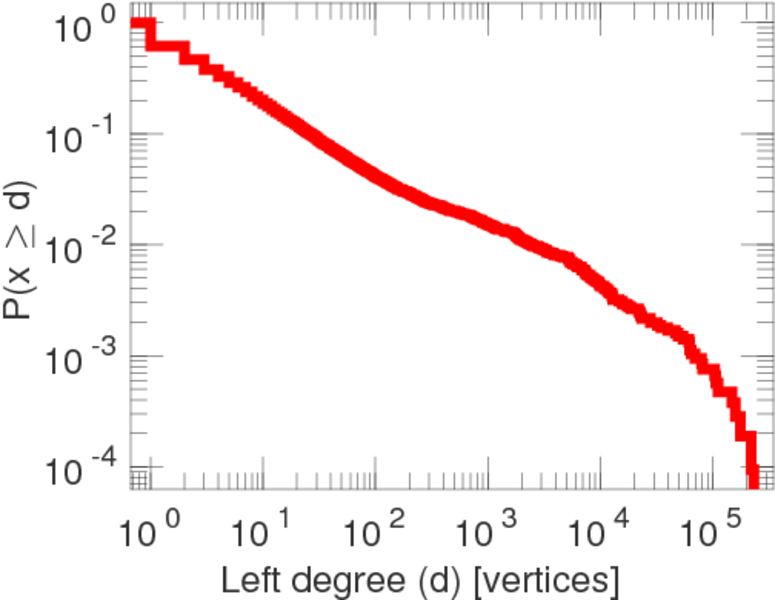
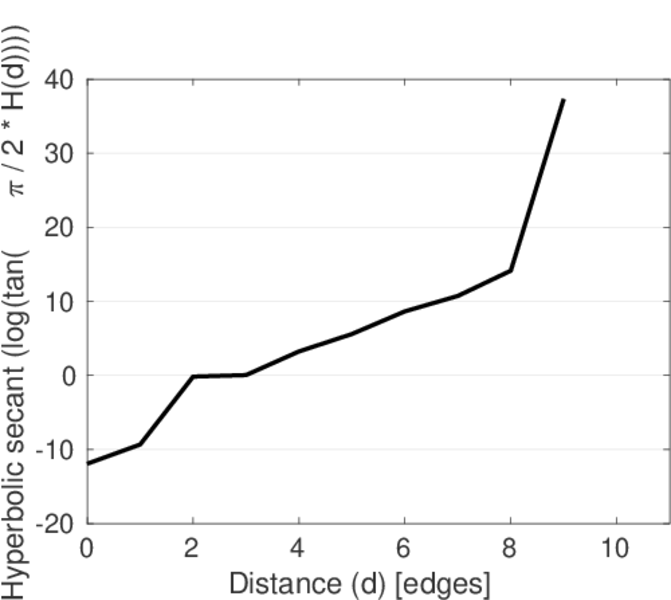
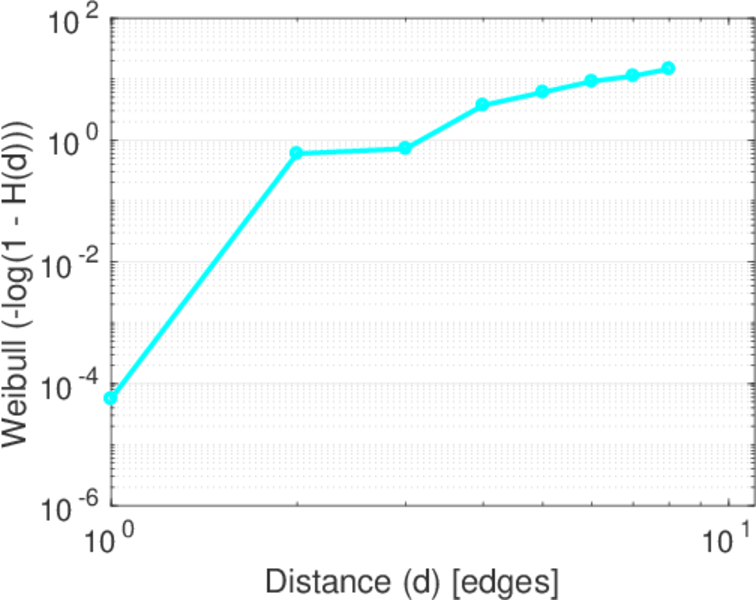
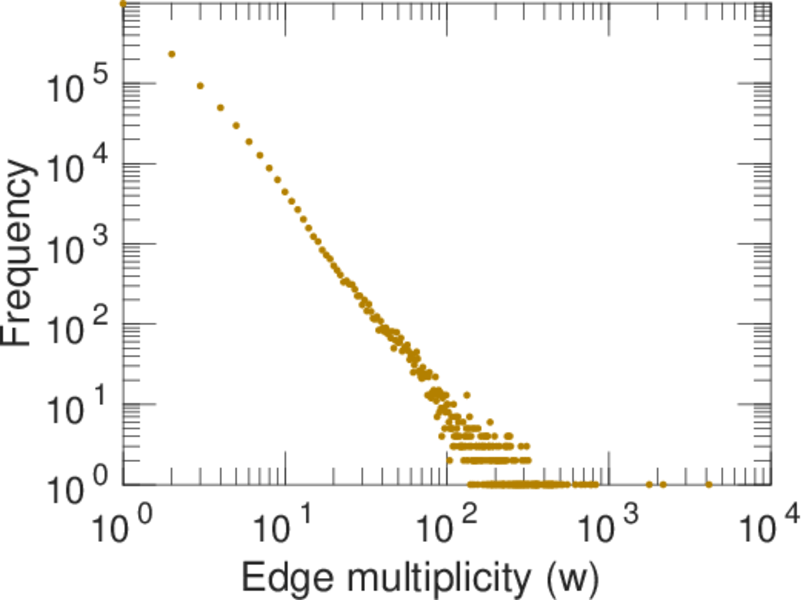
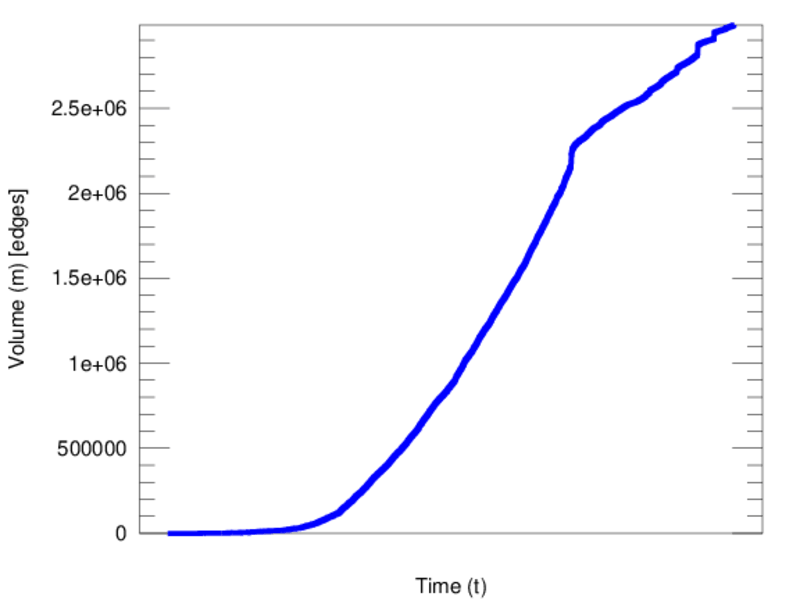
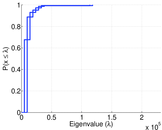
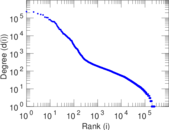
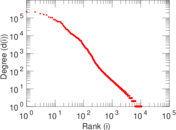
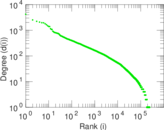
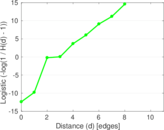
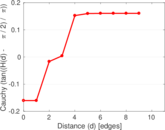
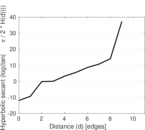
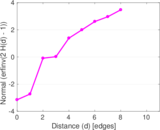
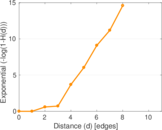
Plots


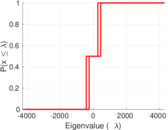


Matrix decompositions plots
Downloads
References
|
[1]
|
Jérôme Kunegis.
KONECT – The Koblenz Network Collection.
In Proc. Int. Conf. on World Wide Web Companion, pages
1343–1350, 2013.
[ http ]
|
|
[2]
|
Wikimedia Foundation.
Wikimedia downloads.
http://dumps.wikimedia.org/, January 2010.
|
 KONECT ‣ Networks ‣
Buy Me a Coffee
KONECT ‣ Networks ‣
Buy Me a Coffee