Wikipedia edits (lbe)
This is the bipartite edit network of the лакку Wikipedia. It contains
users and pages from the лакку Wikipedia, connected by edit events. Each
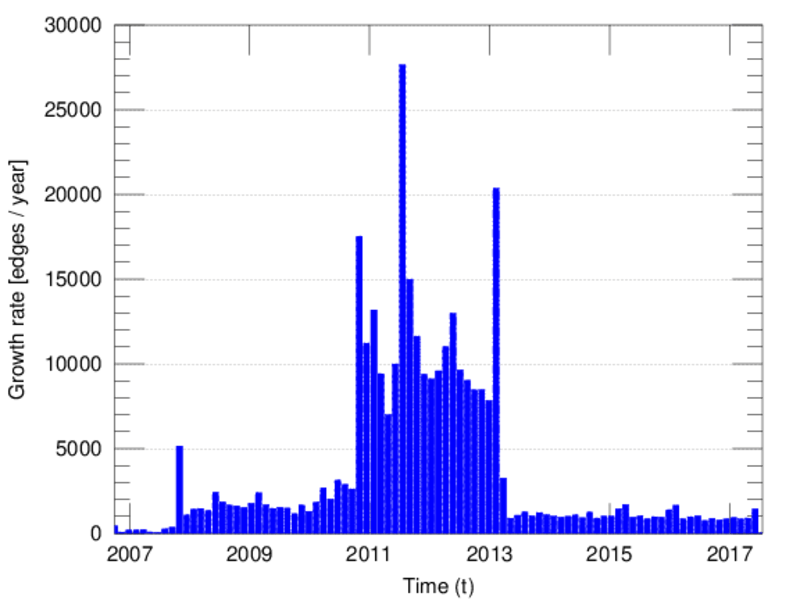
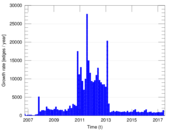
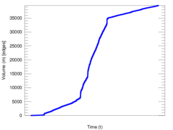
edge represents an edit. The dataset includes the timestamp of each edit.
Metadata
Statistics
| Size | n = | 11,212
|
| Left size | n1 = | 657
|
| Right size | n2 = | 10,555
|
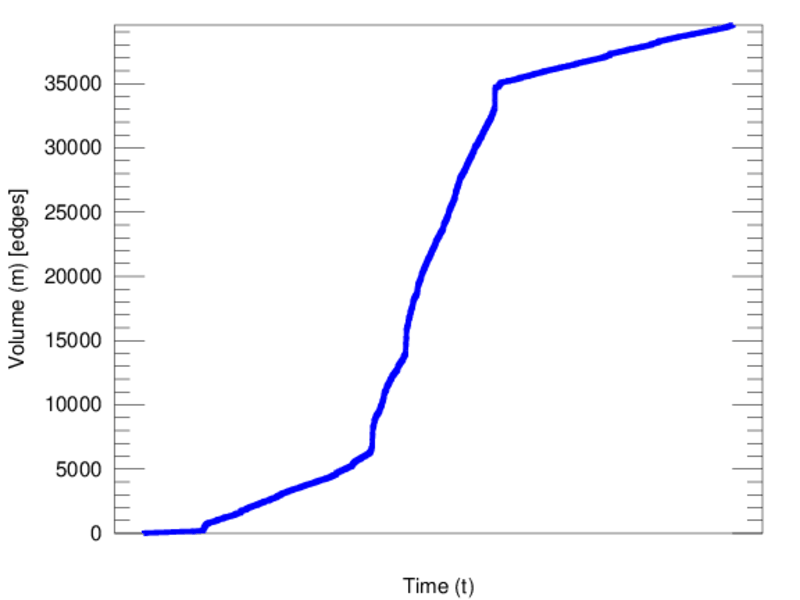
| Volume | m = | 39,548
|
| Unique edge count | m̿ = | 23,854
|
| Wedge count | s = | 19,120,036
|
| Claw count | z = | 20,047,198,159
|
| Cross count | x = | 18,887,520,262,173
|
| Square count | q = | 9,452,961
|
| 4-Tour count | T4 = | 152,164,488
|
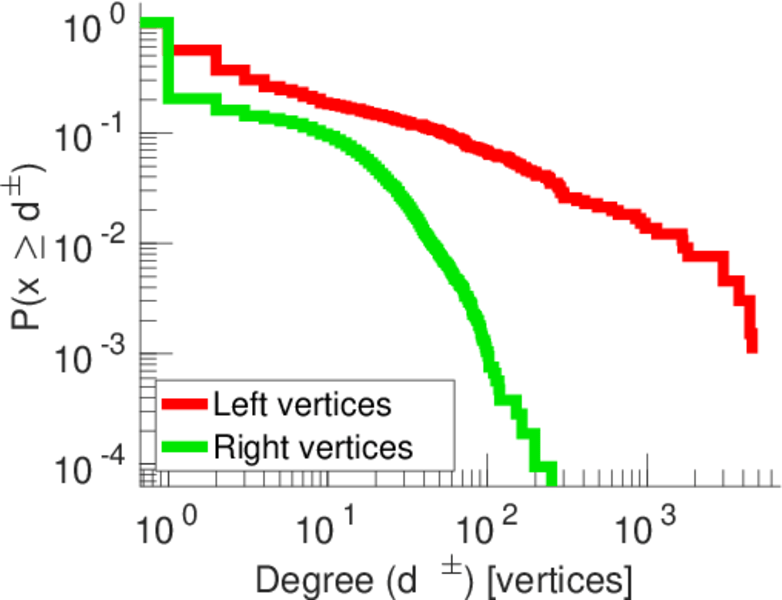
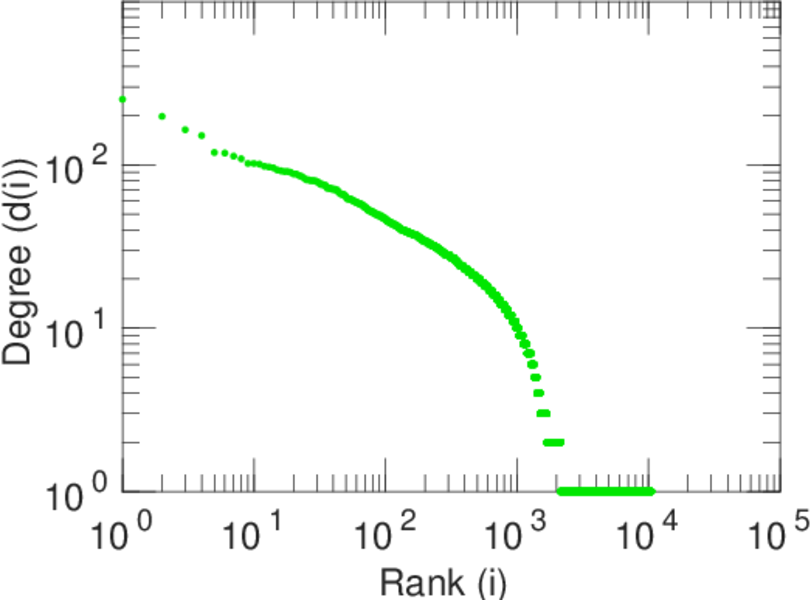
| Maximum degree | dmax = | 4,554
|
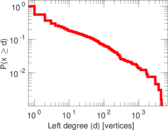
| Maximum left degree | d1max = | 4,554
|
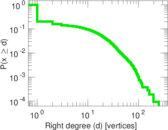
| Maximum right degree | d2max = | 252
|
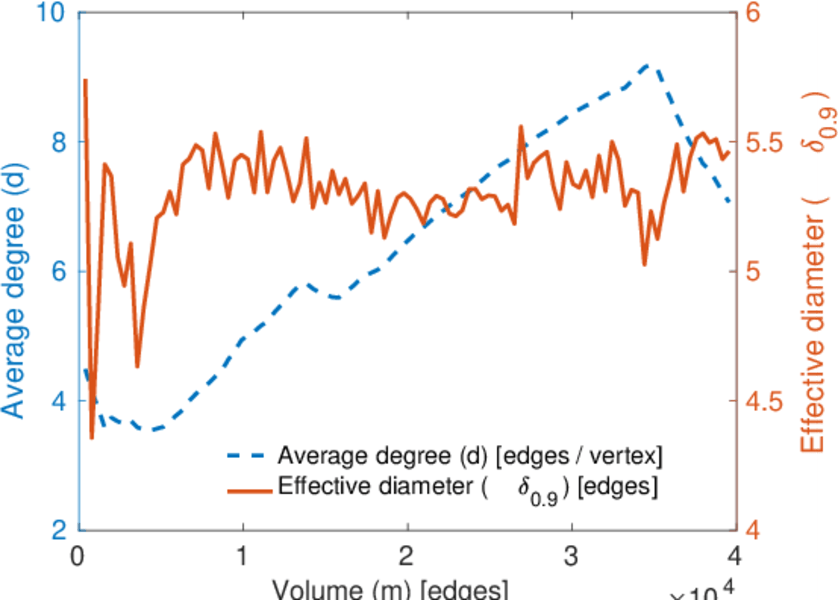
| Average degree | d = | 7.054 58
|
| Average left degree | d1 = | 60.194 8
|
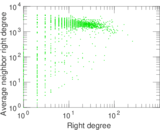
| Average right degree | d2 = | 3.746 85
|
| Fill | p = | 0.003 439 83
|
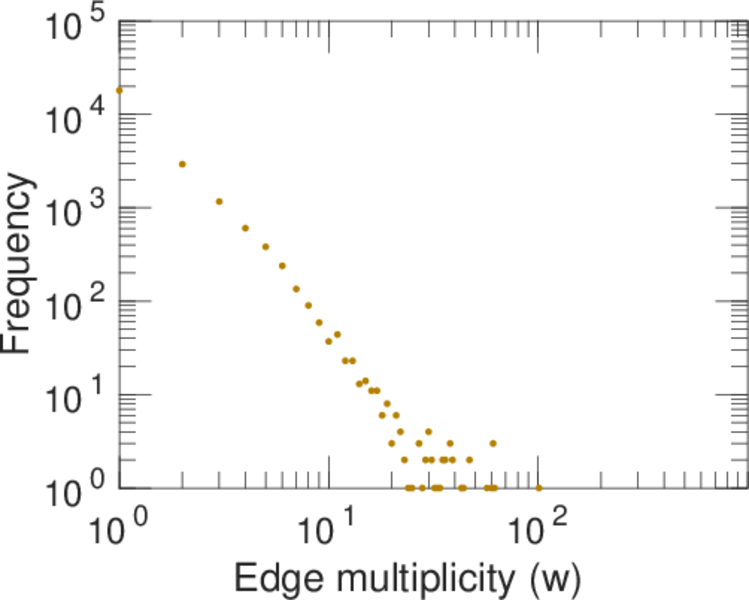
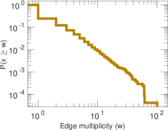
| Average edge multiplicity | m̃ = | 1.657 92
|
| Size of LCC | N = | 10,646
|
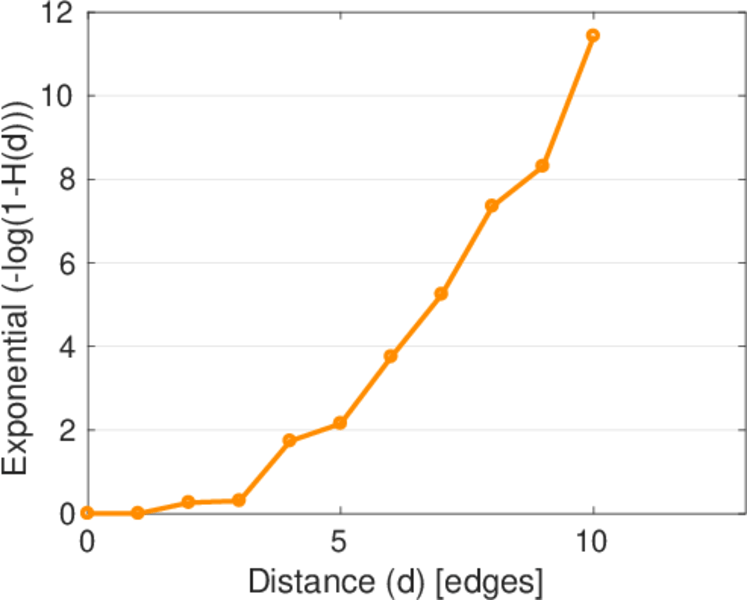
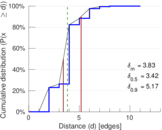
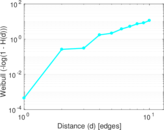
| Diameter | δ = | 13
|
| 50-Percentile effective diameter | δ0.5 = | 3.422 61
|
| 90-Percentile effective diameter | δ0.9 = | 5.174 20
|
| Median distance | δM = | 4
|
| Mean distance | δm = | 3.828 13
|
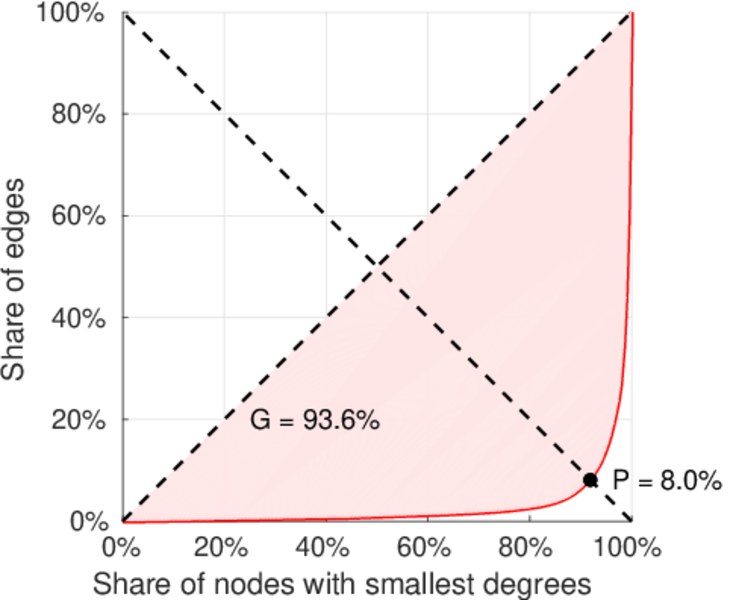
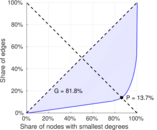
| Gini coefficient | G = | 0.823 504
|
| Balanced inequality ratio | P = | 0.139 704
|
| Left balanced inequality ratio | P1 = | 0.079 523 6
|
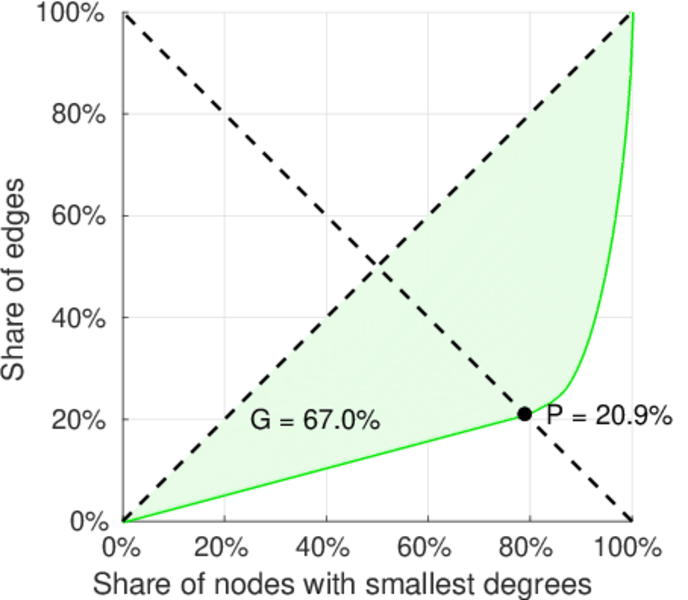
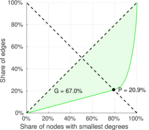
| Right balanced inequality ratio | P2 = | 0.209 088
|
| Relative edge distribution entropy | Her = | 0.730 445
|
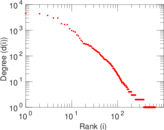
| Power law exponent | γ = | 3.811 70
|
| Tail power law exponent | γt = | 1.821 00
|
| Tail power law exponent with p | γ3 = | 1.821 00
|
| p-value | p = | 0.028 000 0
|
| Left tail power law exponent with p | γ3,1 = | 1.691 00
|
| Left p-value | p1 = | 0.000 00
|
| Right tail power law exponent with p | γ3,2 = | 5.511 00
|
| Right p-value | p2 = | 0.875 000
|
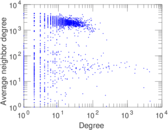
| Degree assortativity | ρ = | −0.588 975
|
| Degree assortativity p-value | pρ = | 0.000 00
|
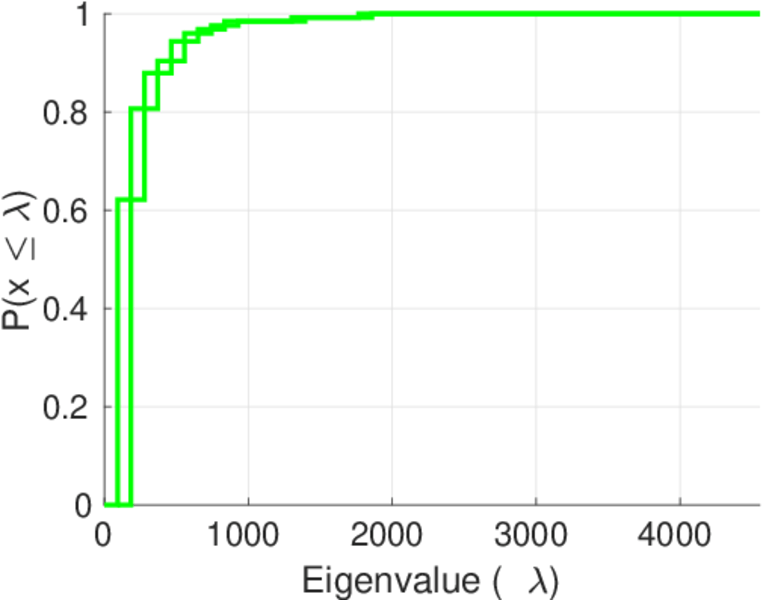
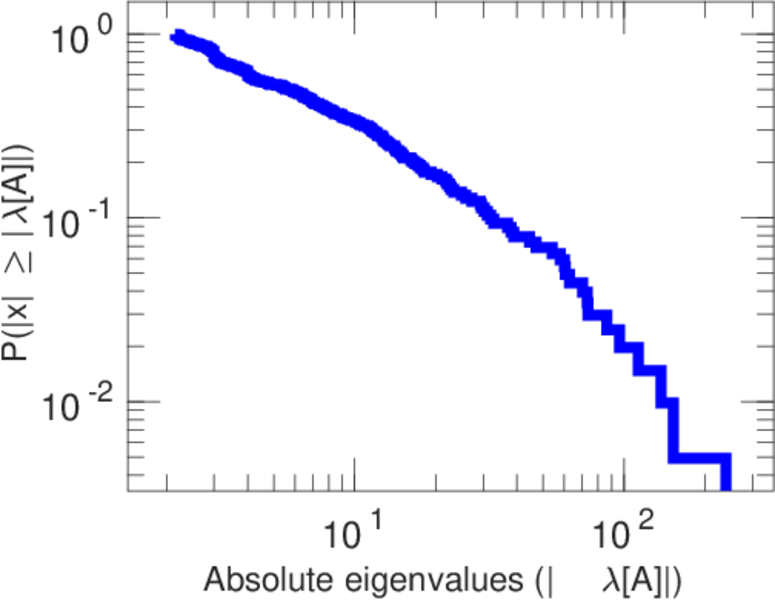
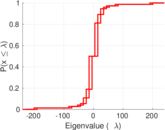
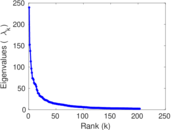
| Spectral norm | α = | 239.532
|
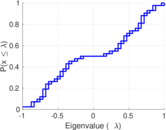
| Algebraic connectivity | a = | 0.004 157 99
|
| Spectral separation | |λ1[A] / λ2[A]| = | 1.572 16
|
| Controllability | C = | 9,976
|
| Relative controllability | Cr = | 0.891 351
|
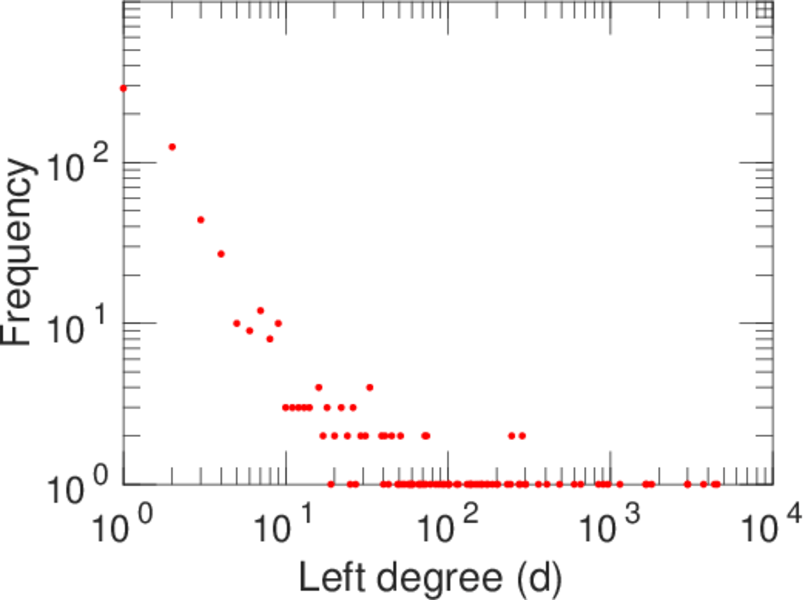
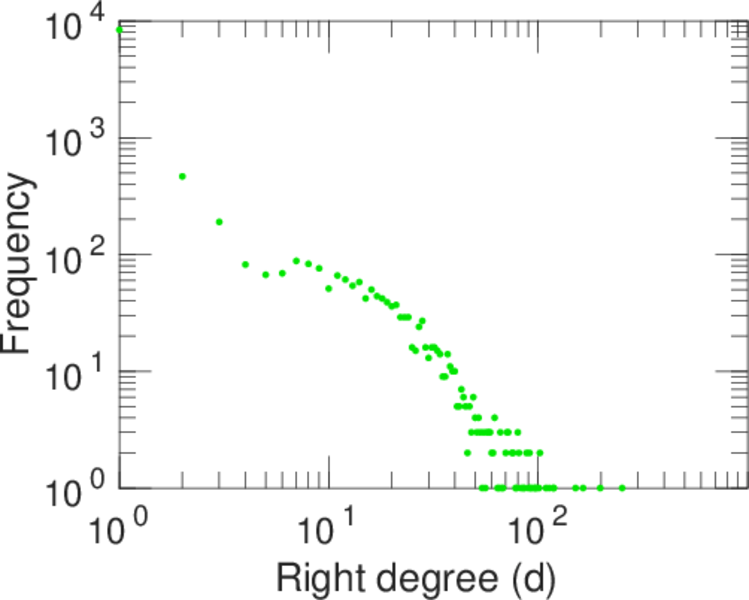
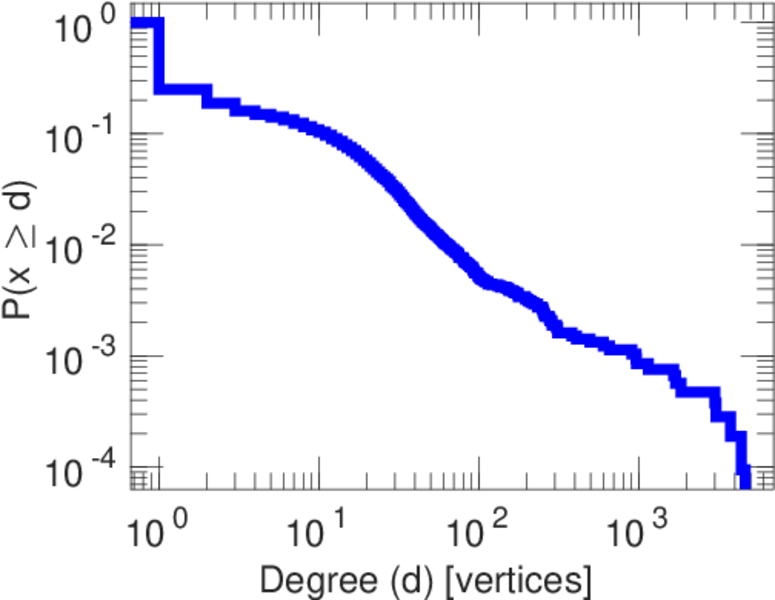
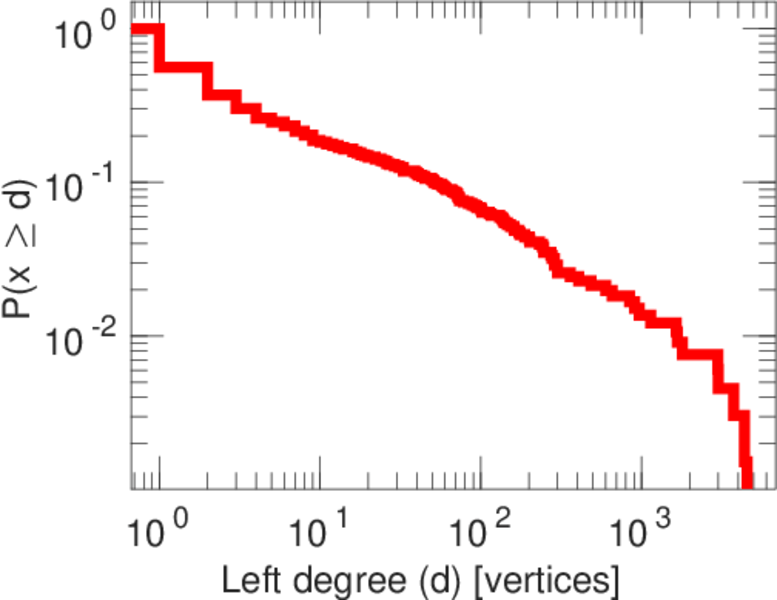
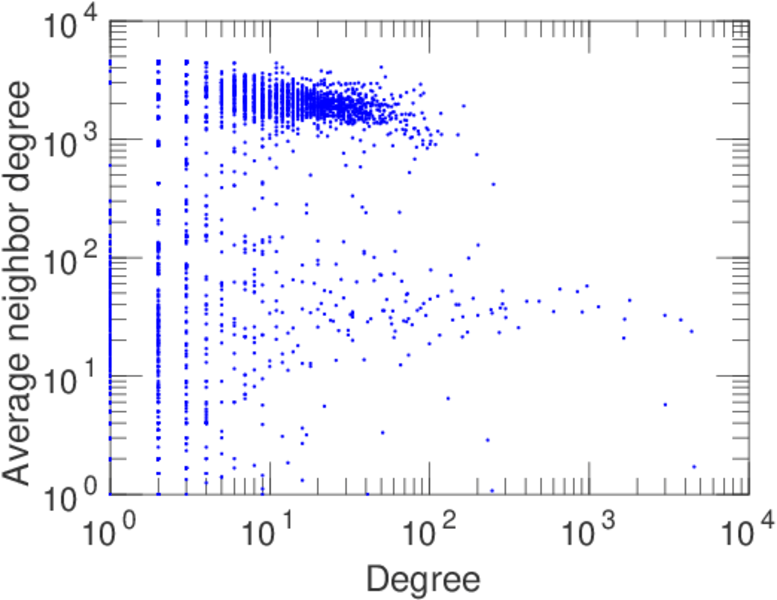
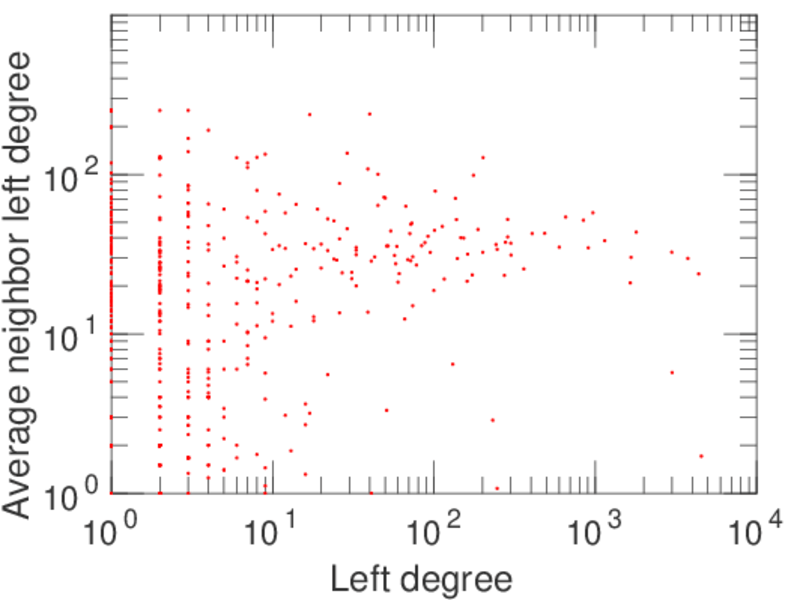
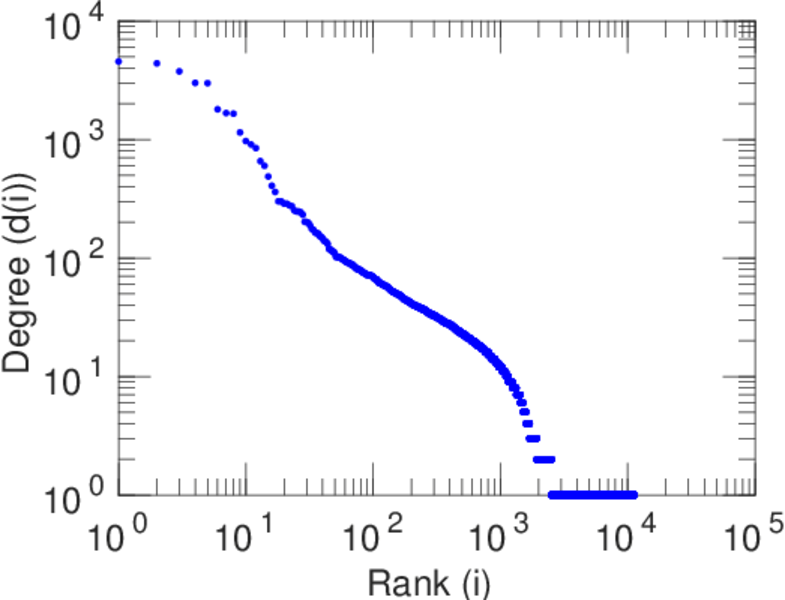
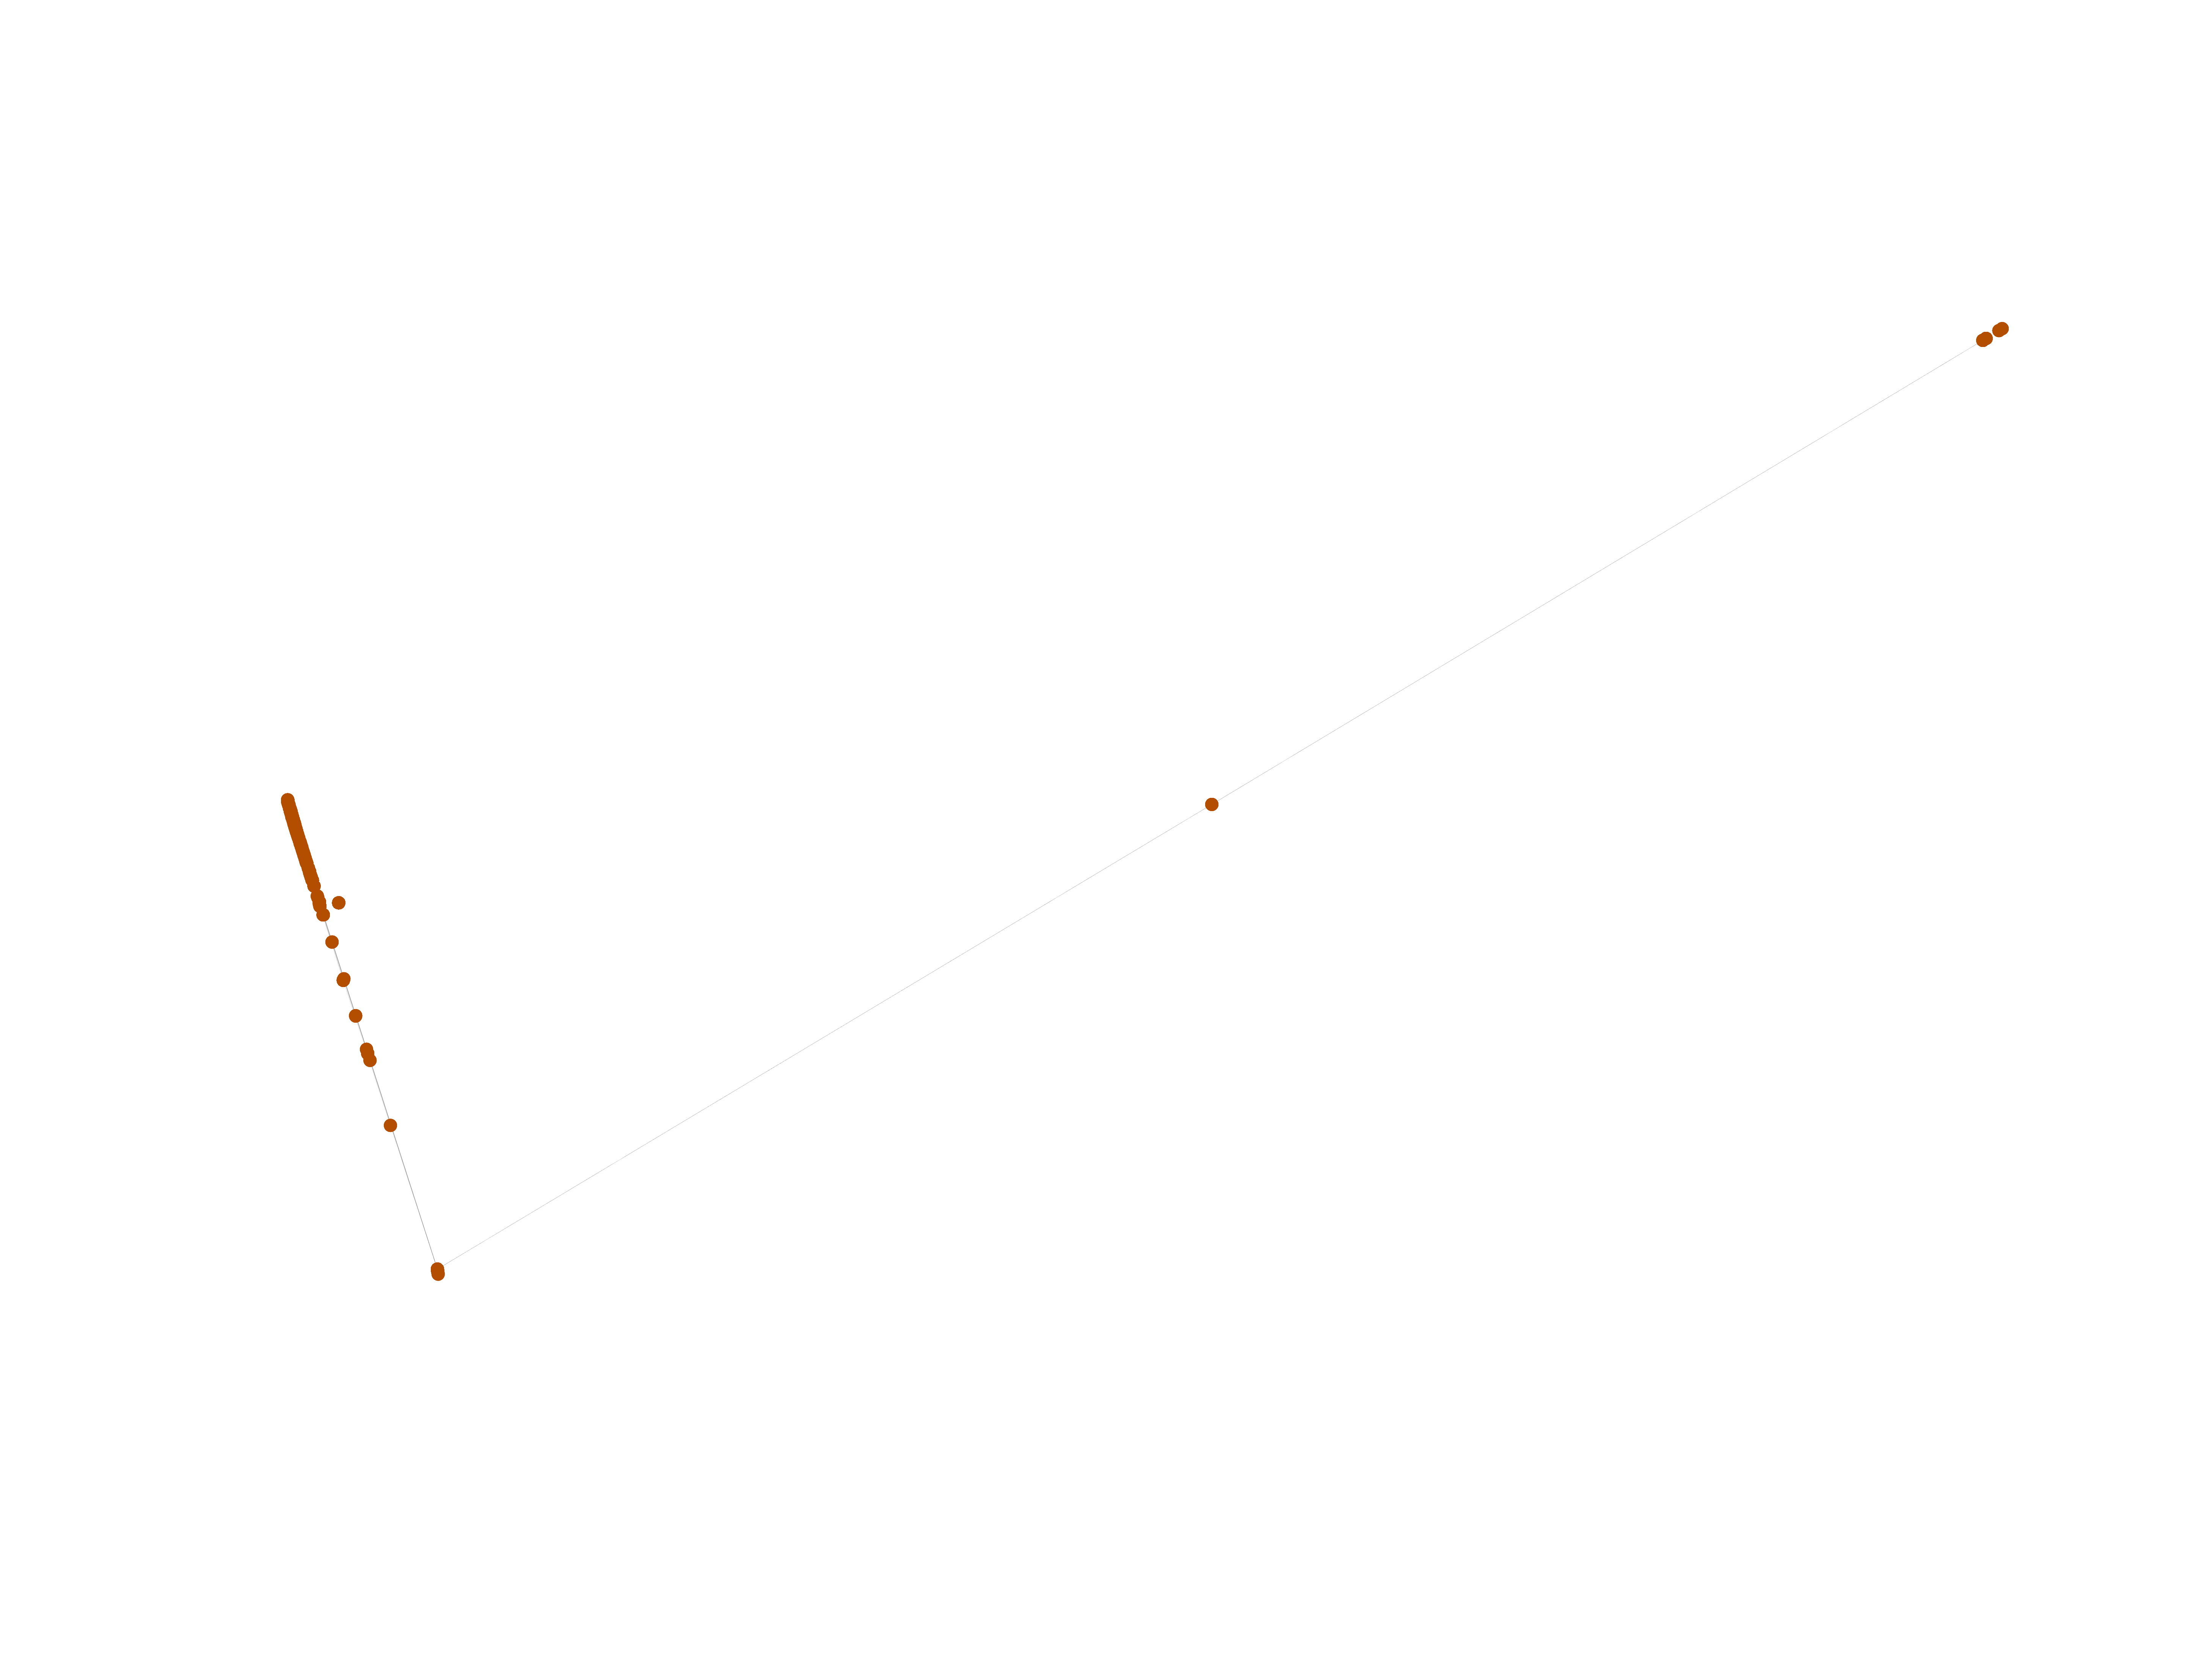
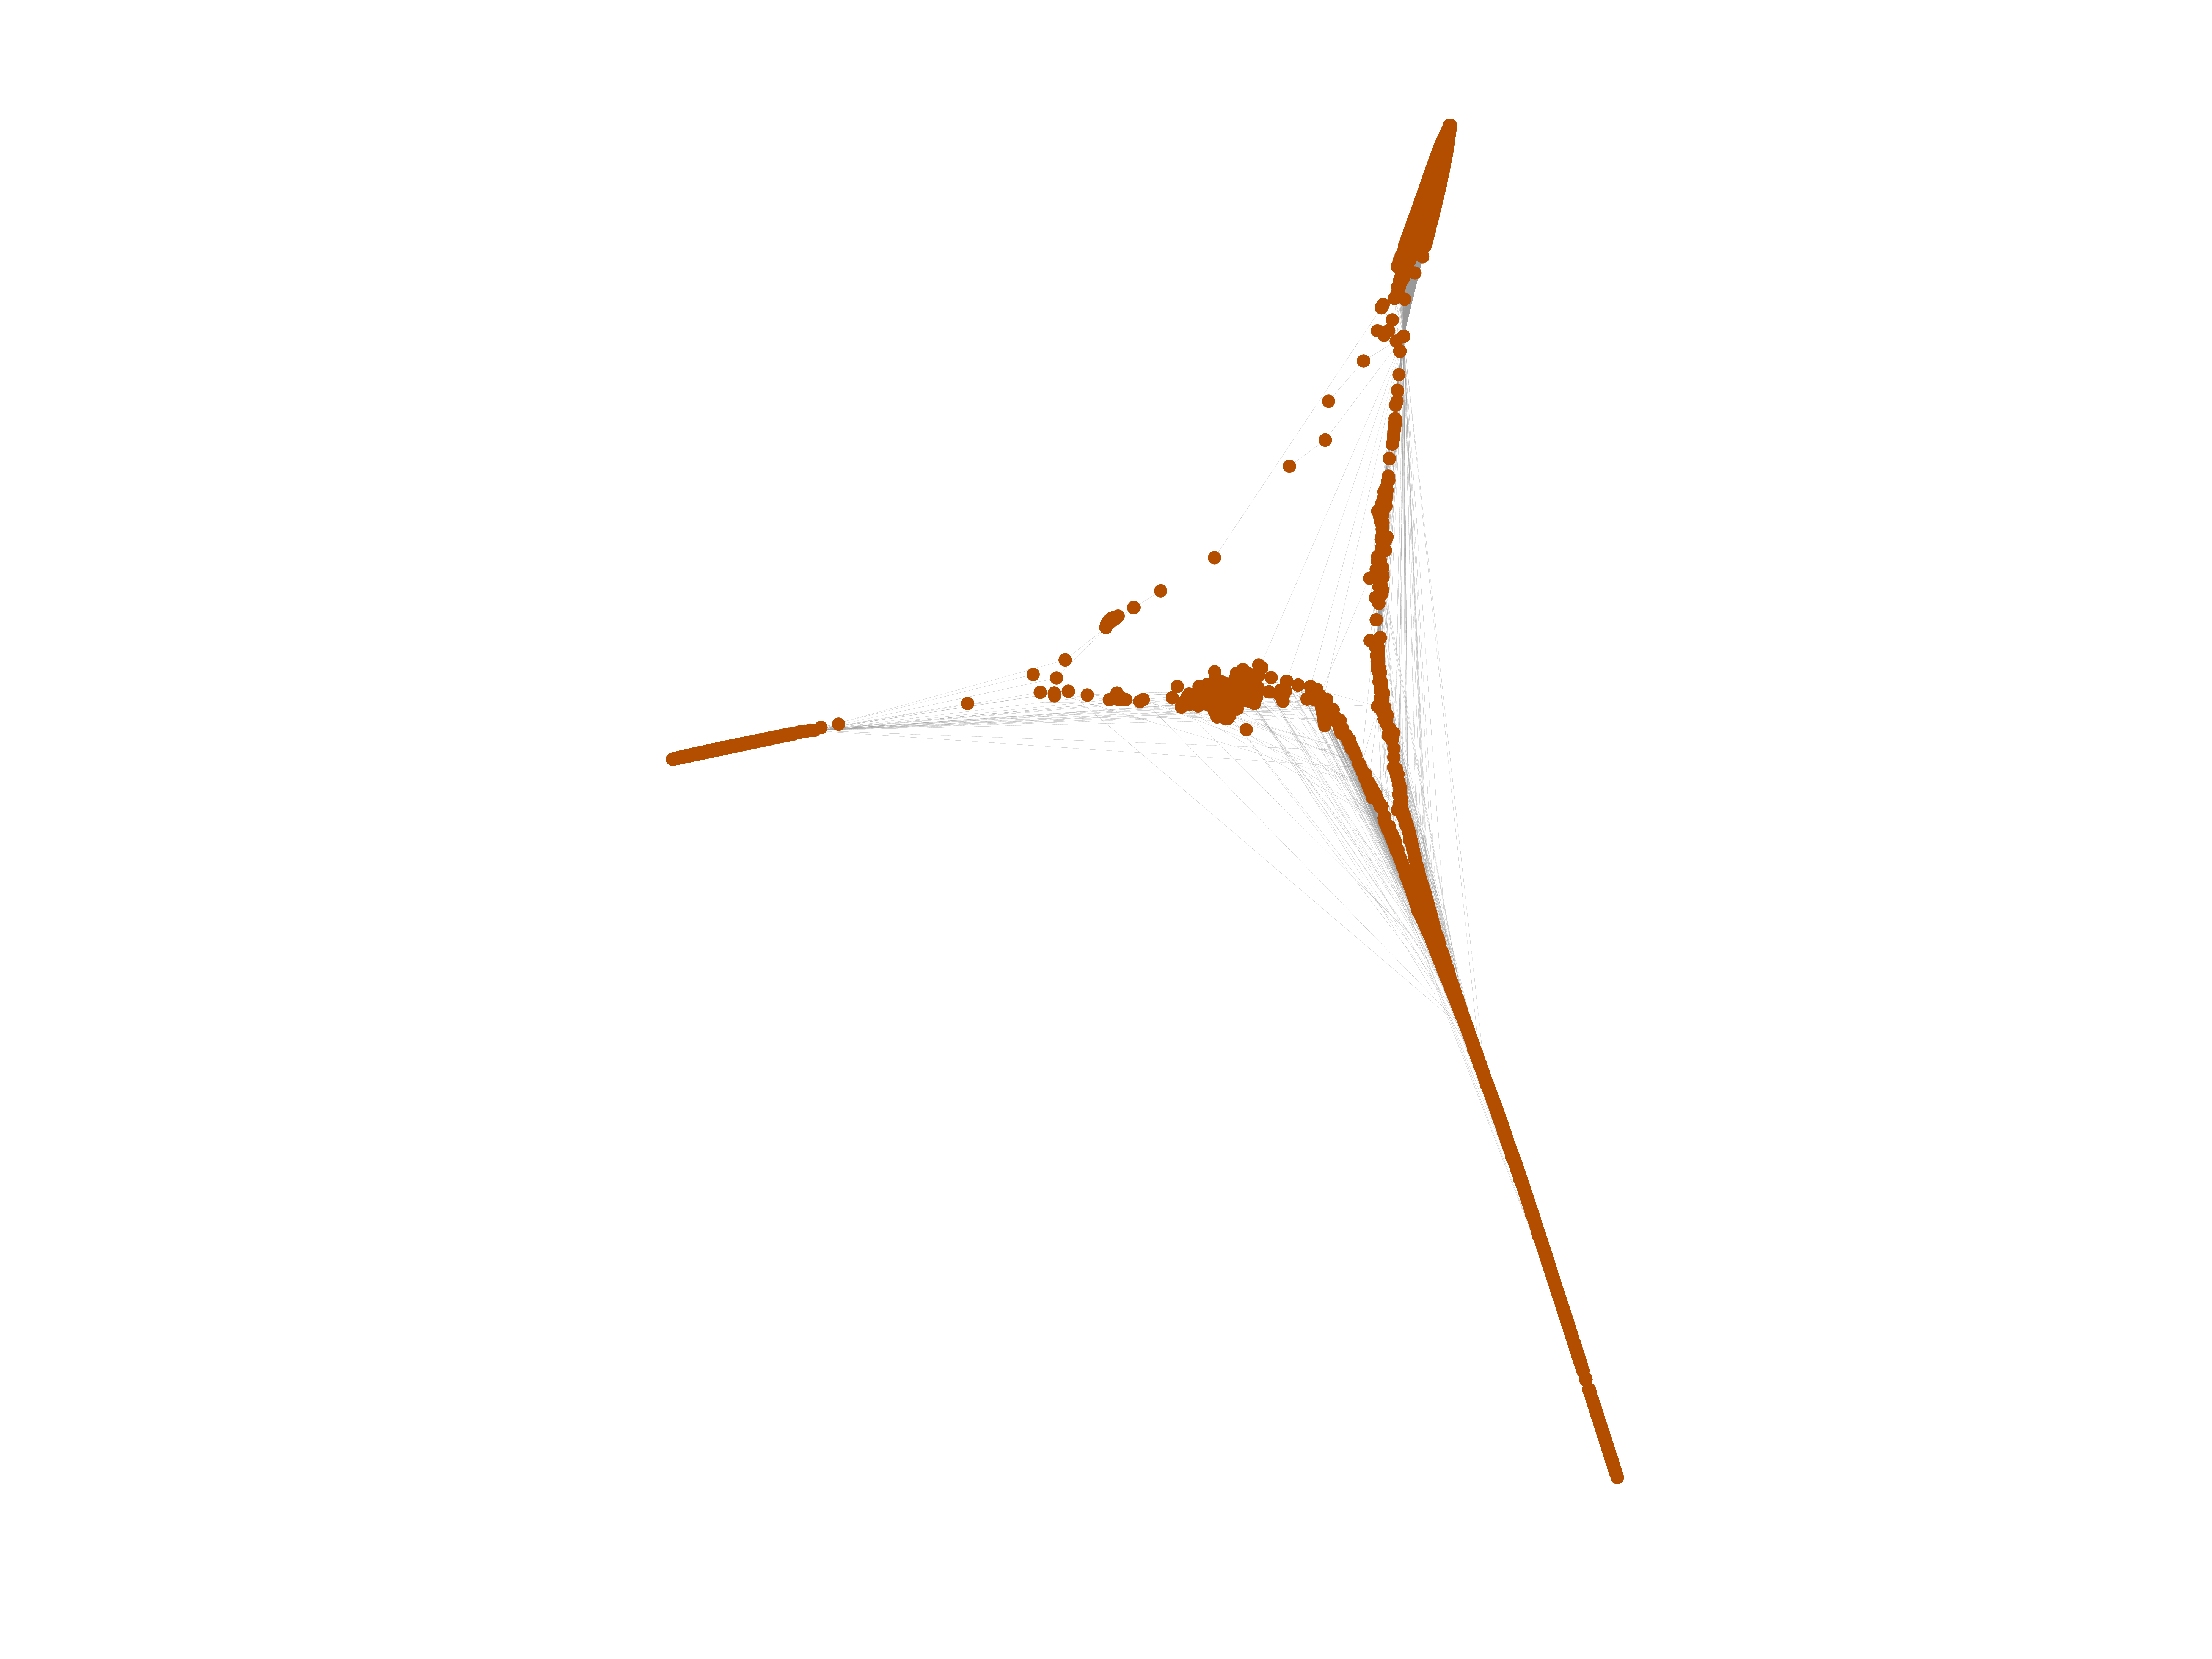
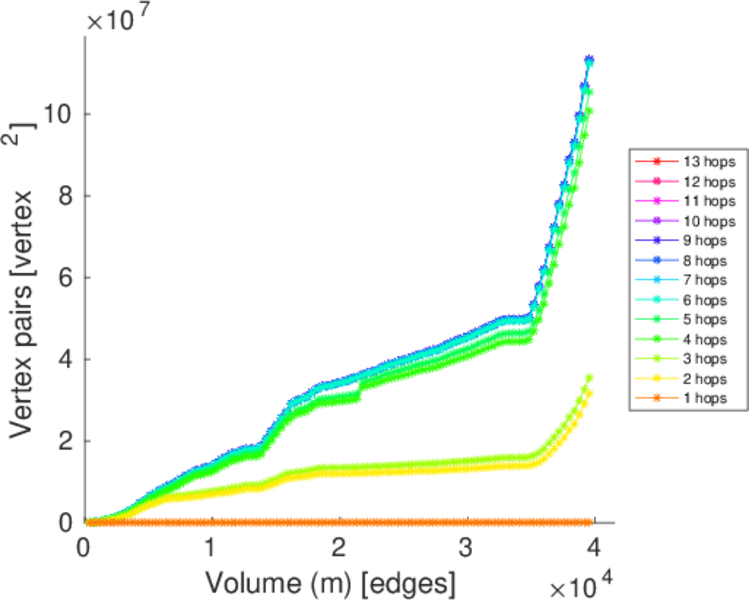
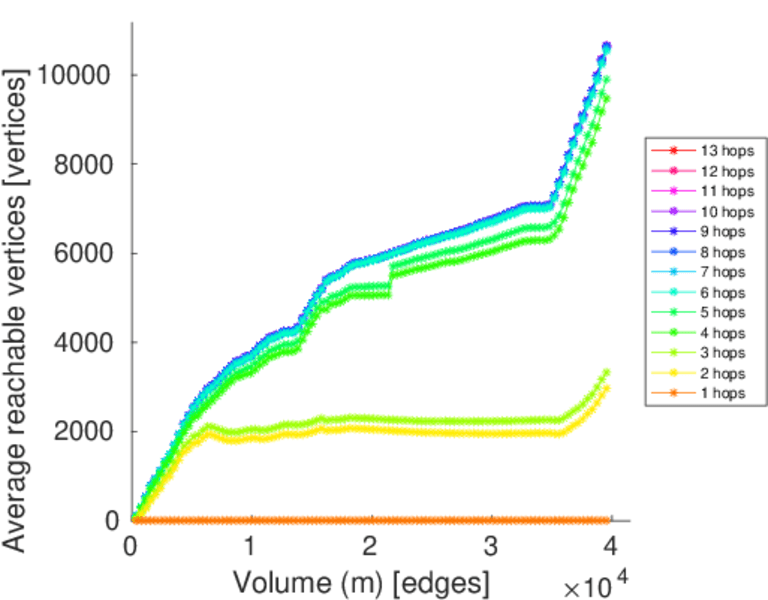
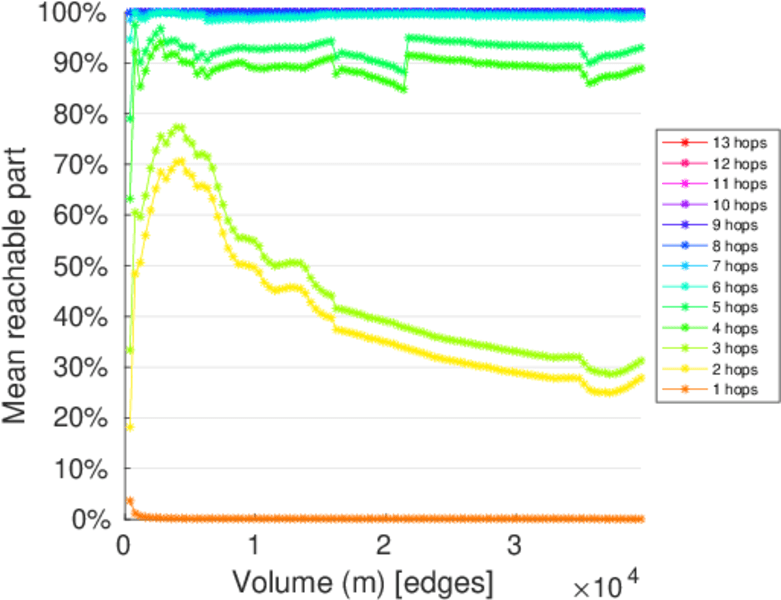
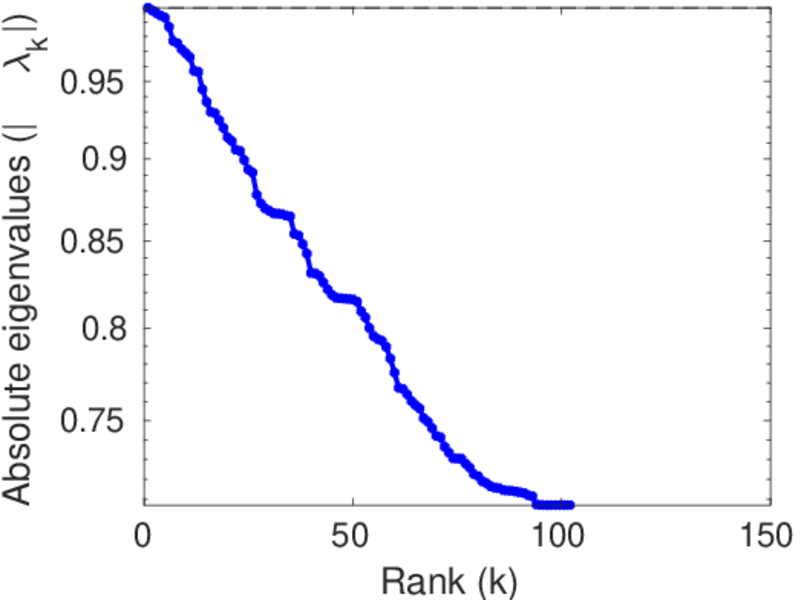
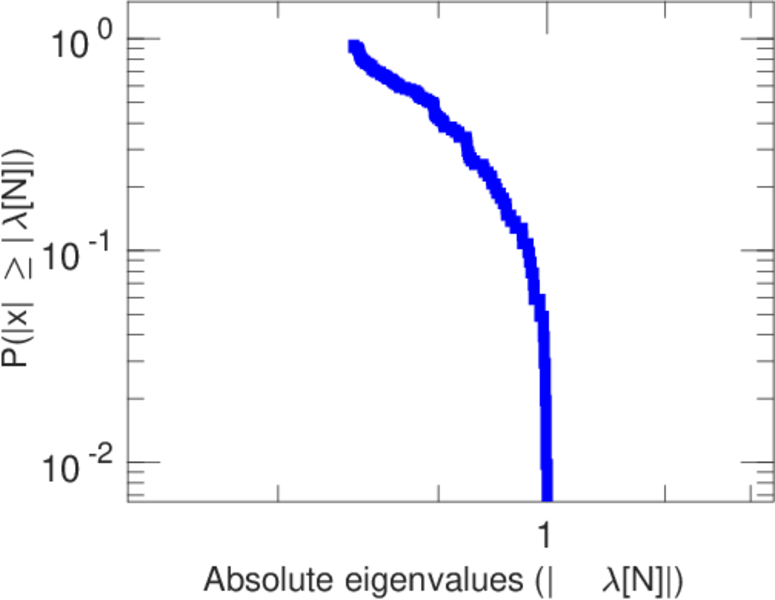
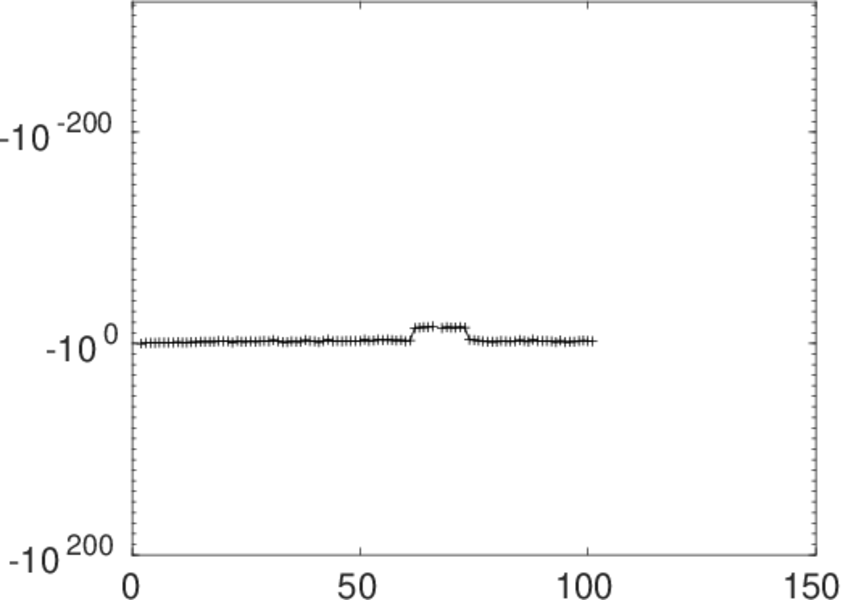
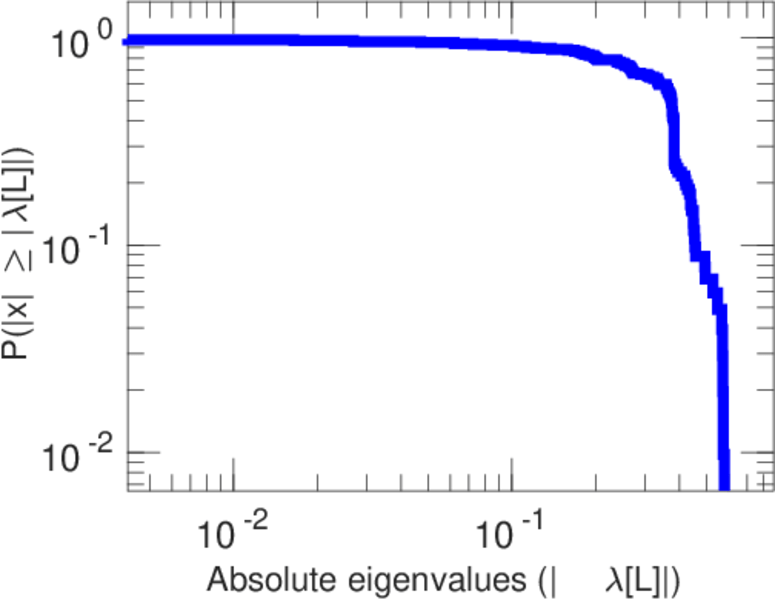
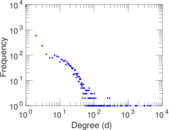
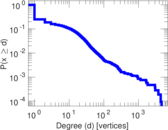
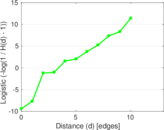
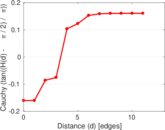
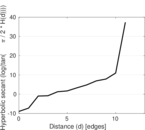
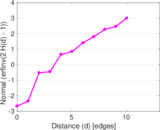
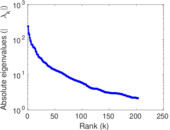
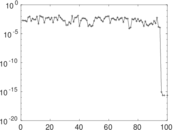
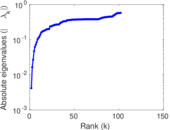
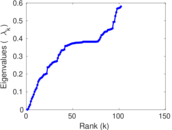
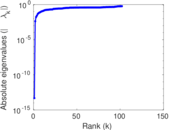
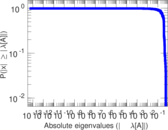
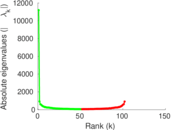
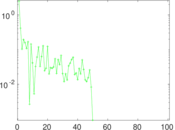
Plots


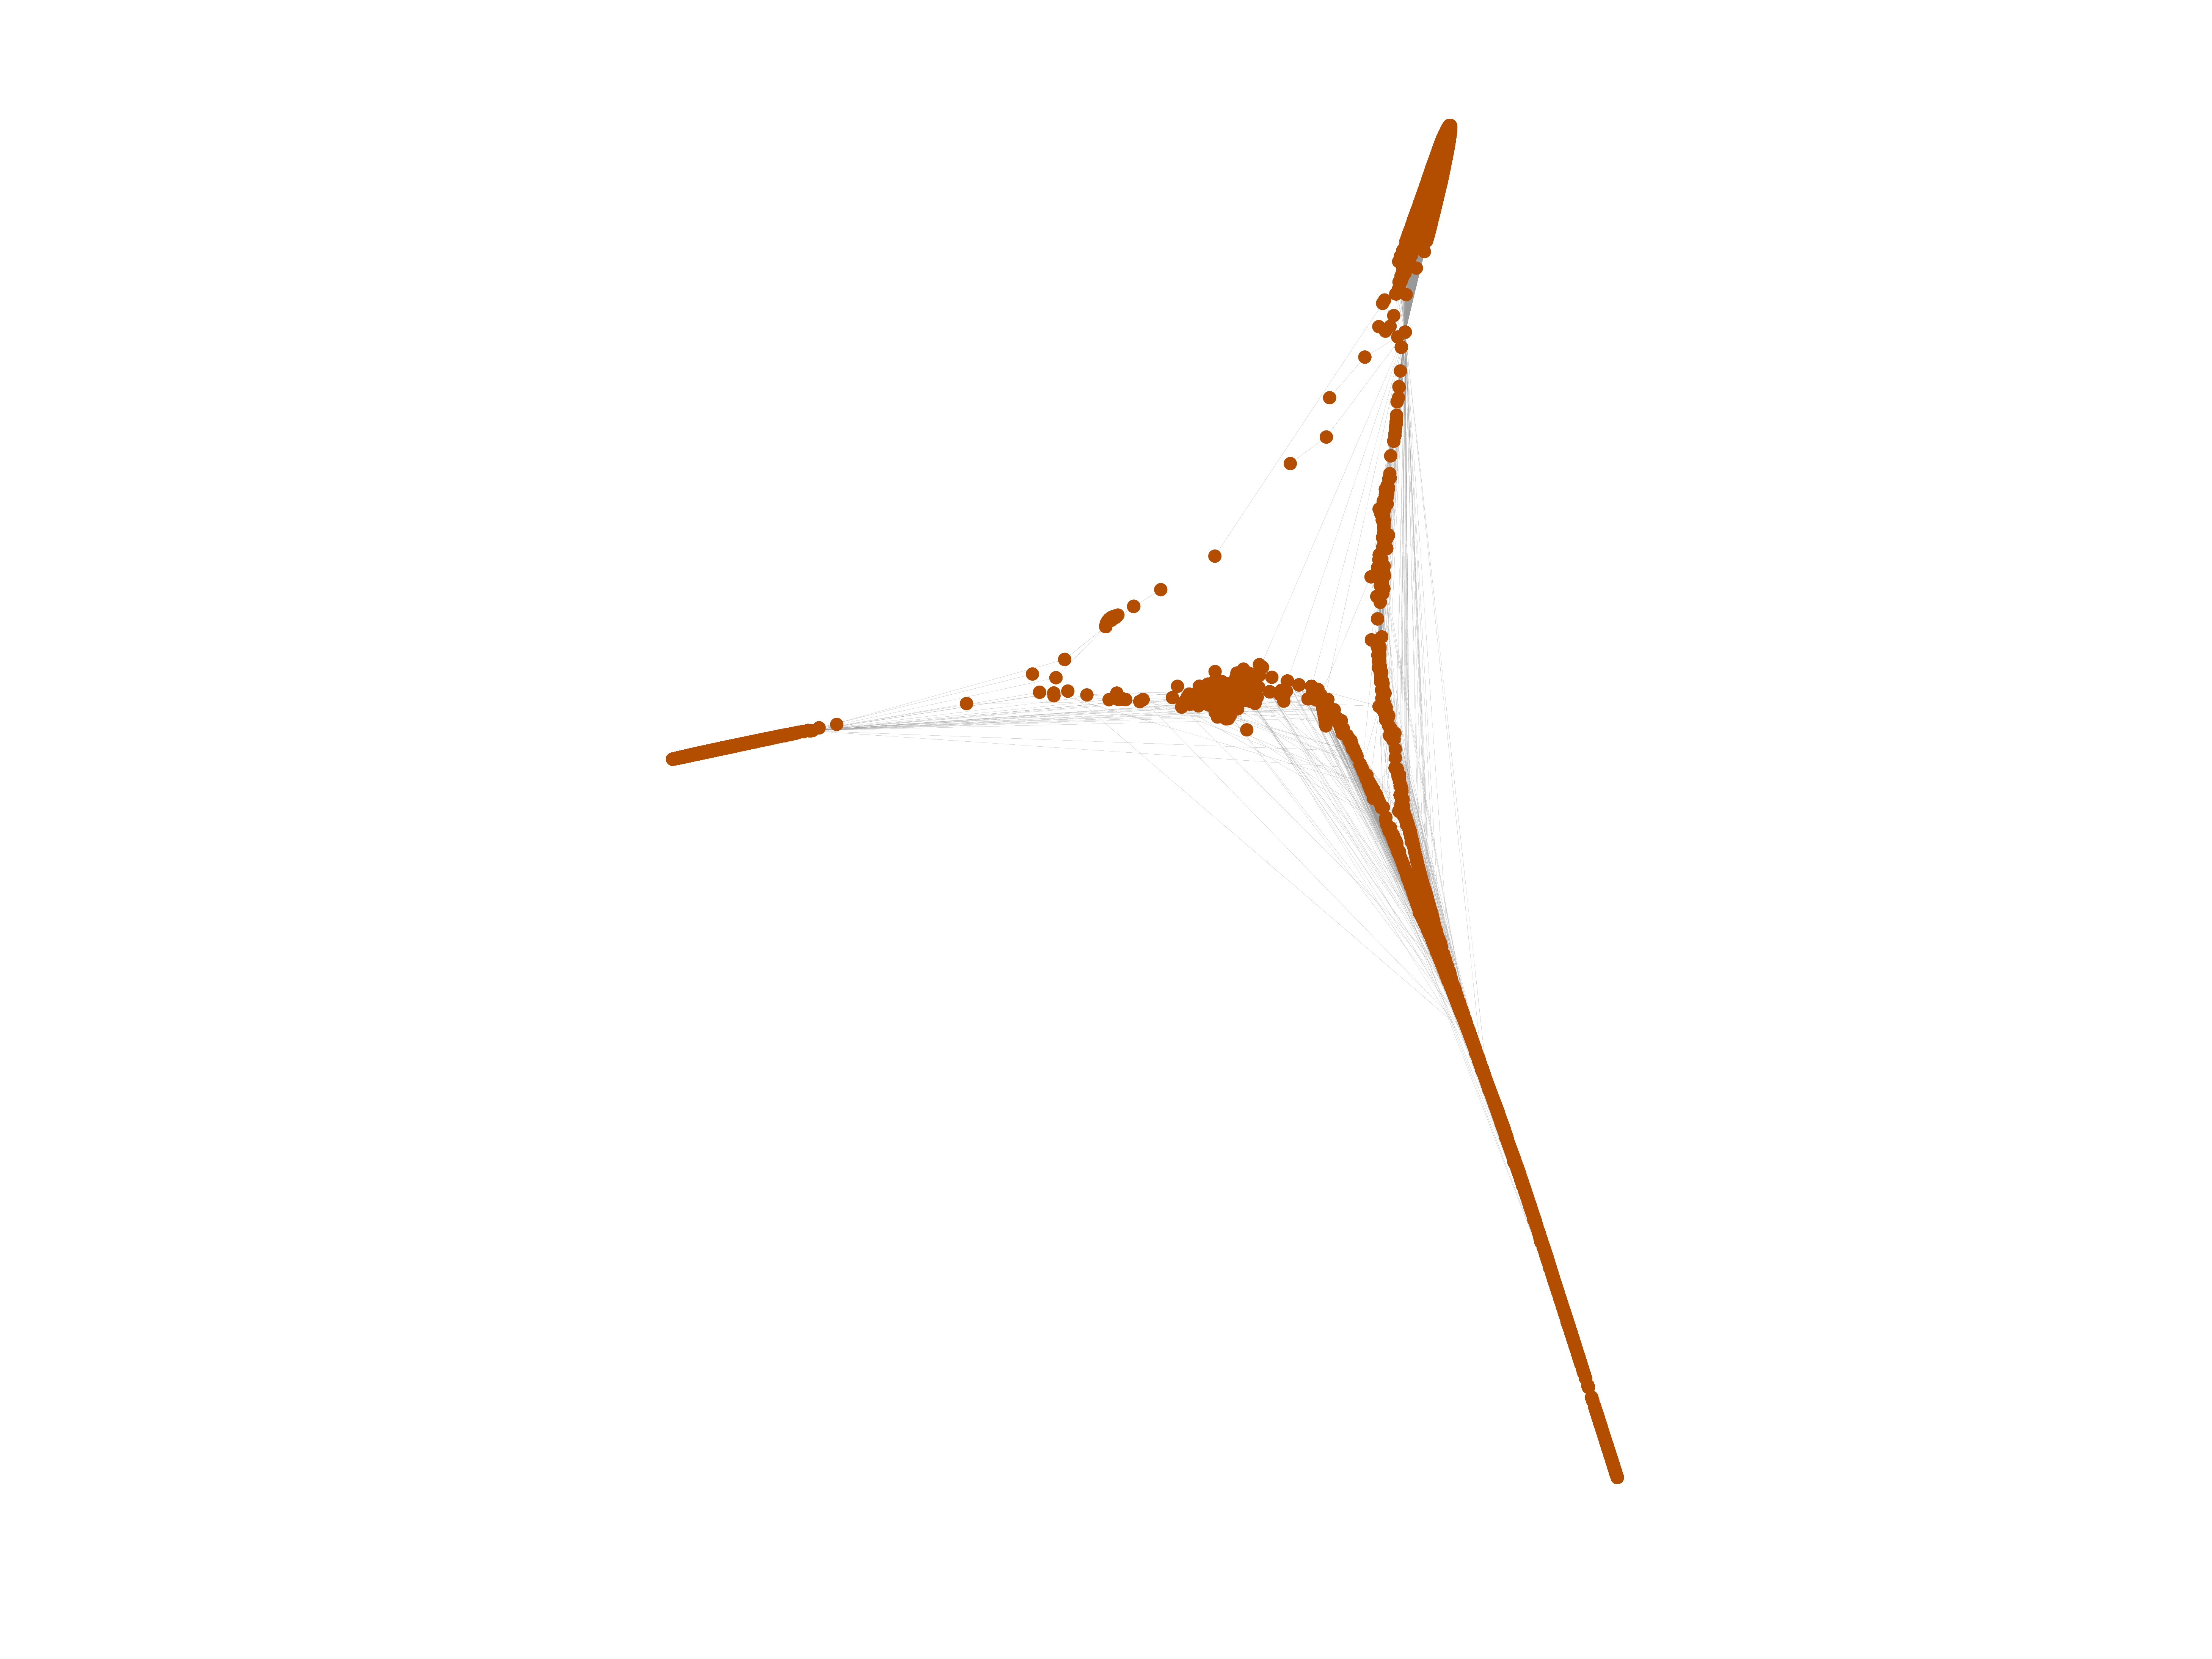
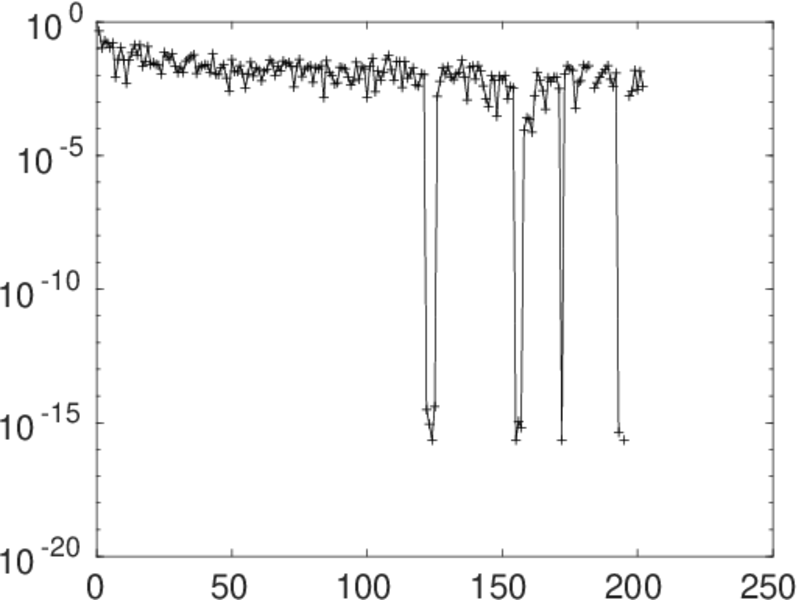
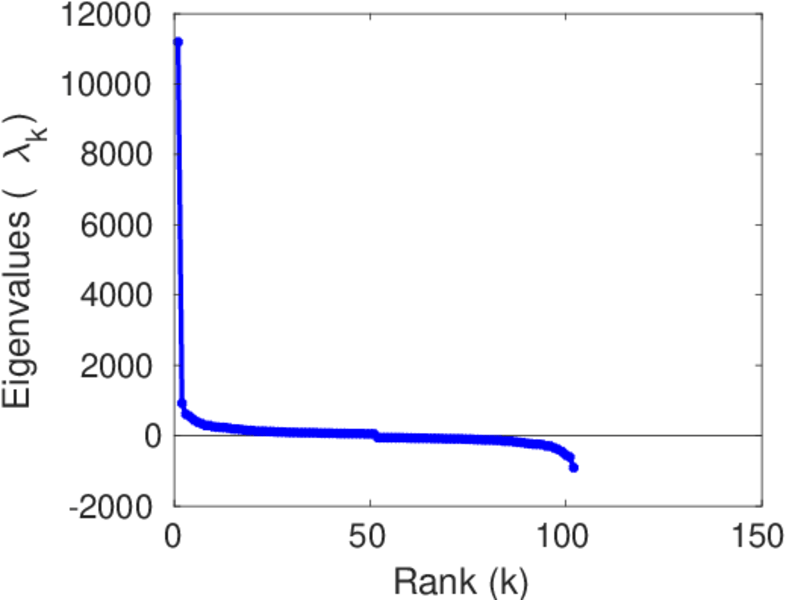
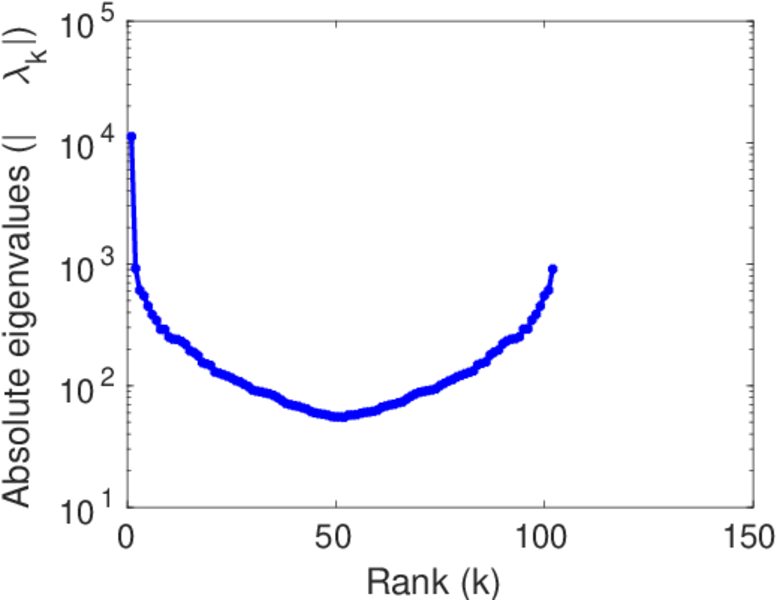
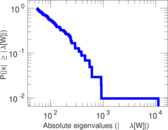
Matrix decompositions plots


Downloads
References
|
[1]
|
Jérôme Kunegis.
KONECT – The Koblenz Network Collection.
In Proc. Int. Conf. on World Wide Web Companion, pages
1343–1350, 2013.
[ http ]
|
|
[2]
|
Wikimedia Foundation.
Wikimedia downloads.
http://dumps.wikimedia.org/, January 2010.
|
 KONECT ‣ Networks ‣
Buy Me a Coffee
KONECT ‣ Networks ‣
Buy Me a Coffee