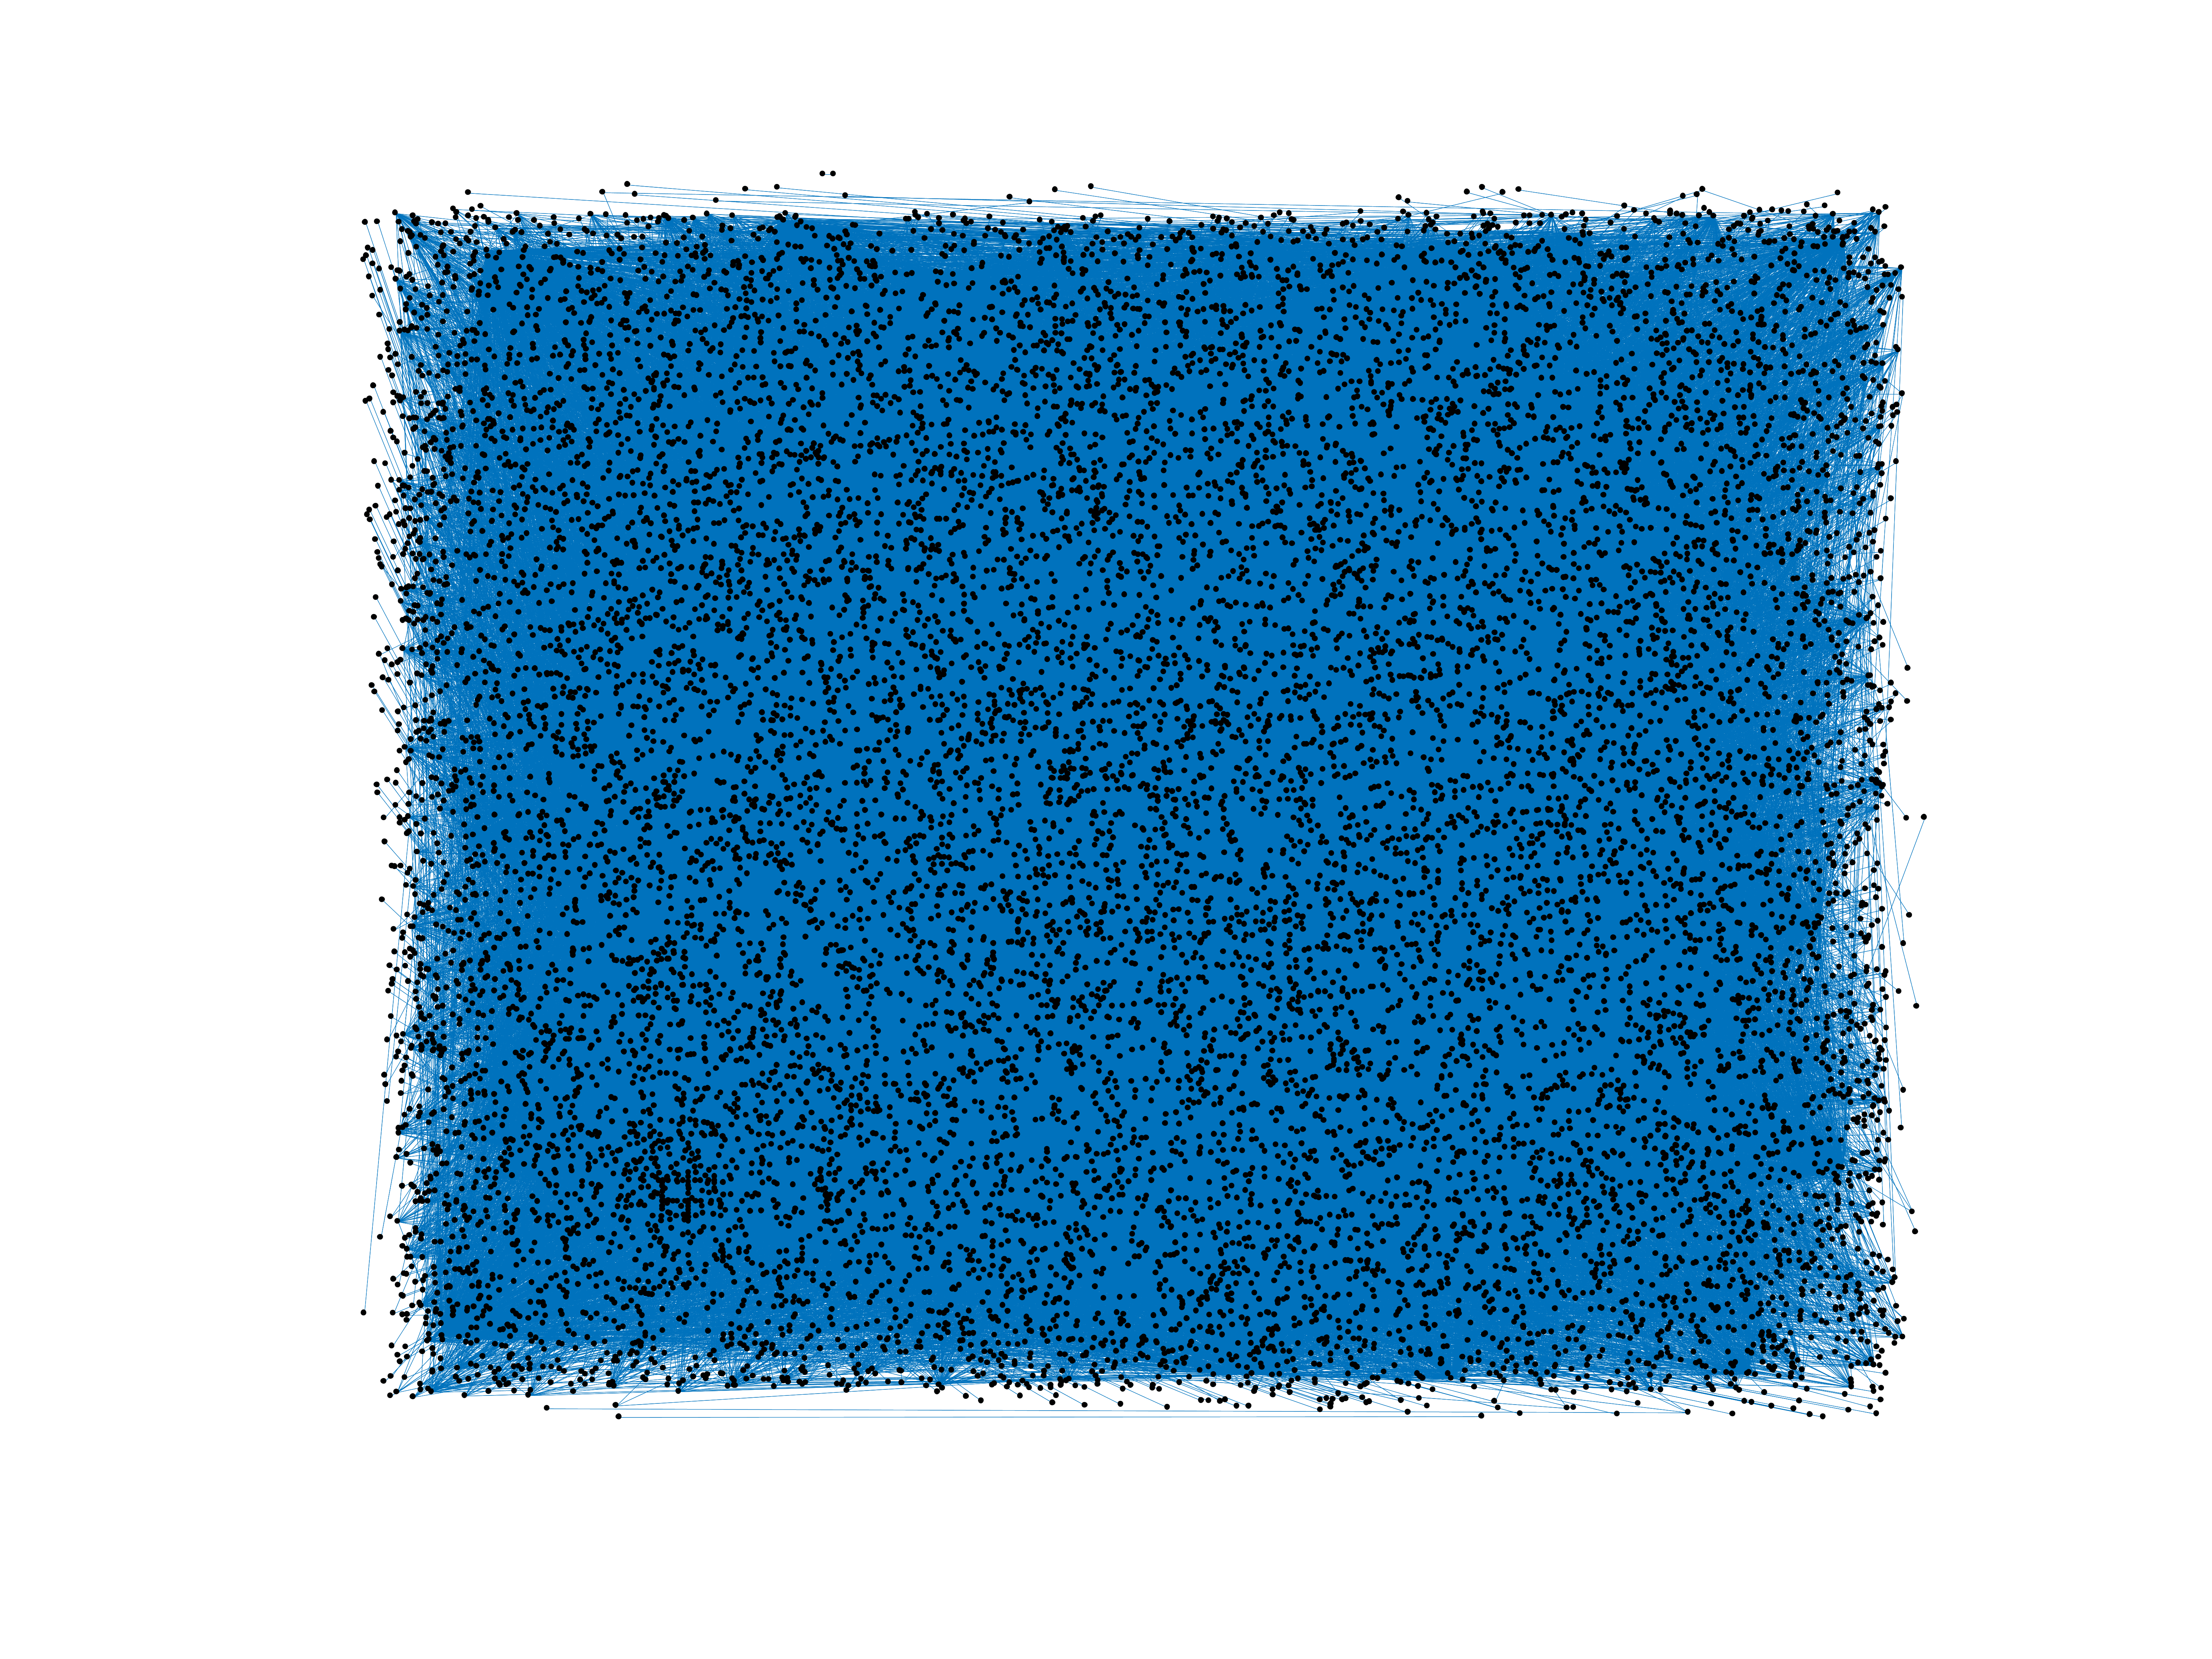
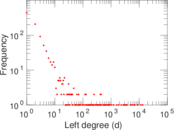
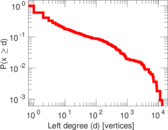
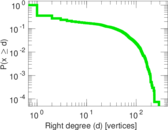
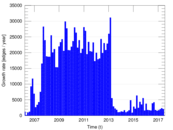
Wikipedia edits (lij)
This is the bipartite edit network of the Ligurian Wikipedia. It contains users
and pages from the Ligurian Wikipedia, connected by edit events. Each edge
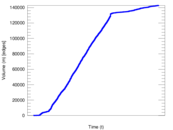
represents an edit. The dataset includes the timestamp of each edit.
Metadata
Statistics
| Size | n = | 14,834
|
| Left size | n1 = | 1,108
|
| Right size | n2 = | 13,726
|
| Volume | m = | 142,783
|
| Unique edge count | m̿ = | 63,120
|
| Wedge count | s = | 54,387,131
|
| Claw count | z = | 68,697,778,743
|
| Cross count | x = | 95,219,973,002,273
|
| Square count | q = | 150,413,093
|
| 4-Tour count | T4 = | 1,420,991,540
|
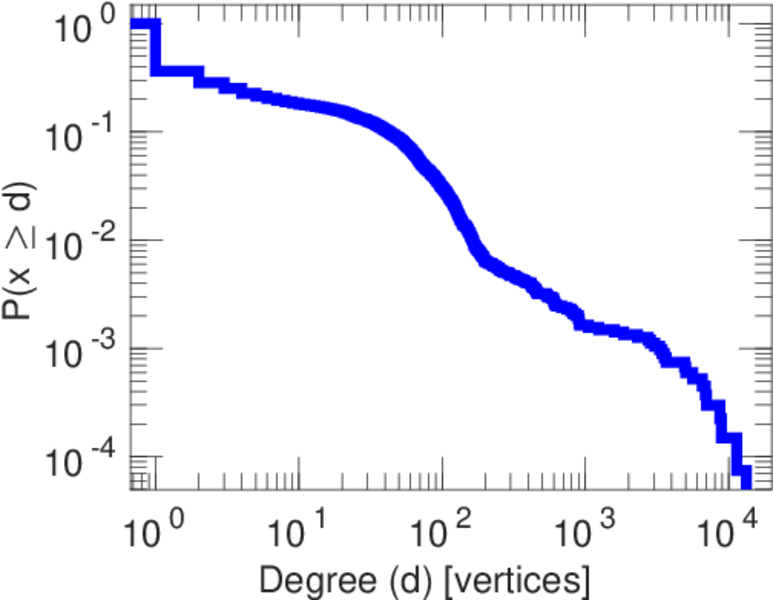
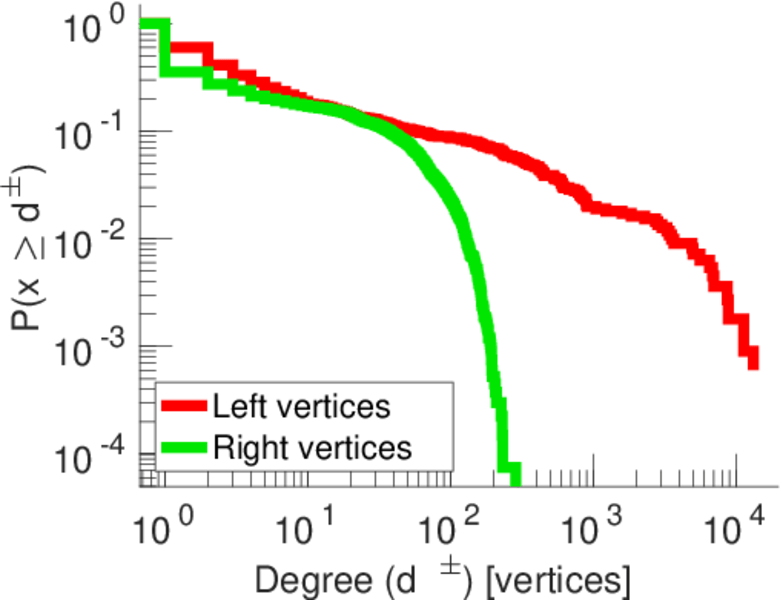
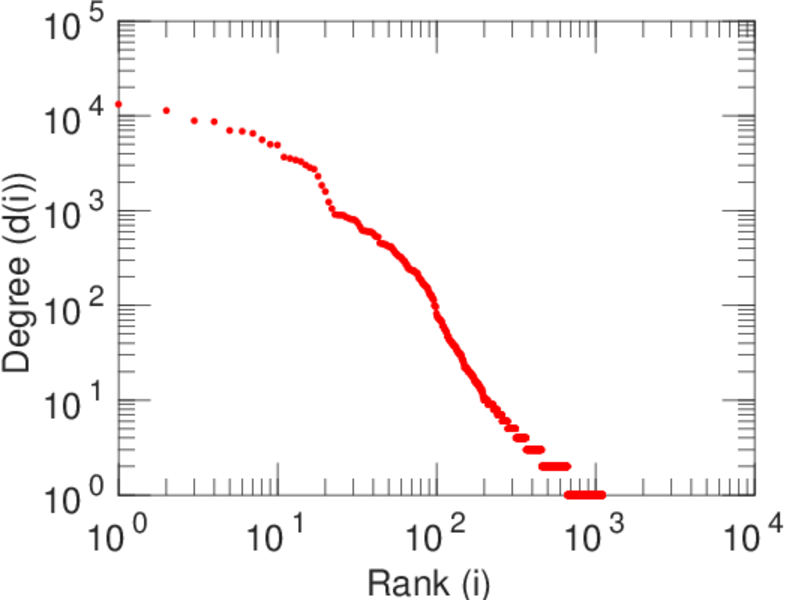
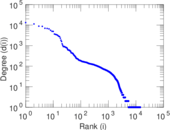
| Maximum degree | dmax = | 13,239
|
| Maximum left degree | d1max = | 13,239
|
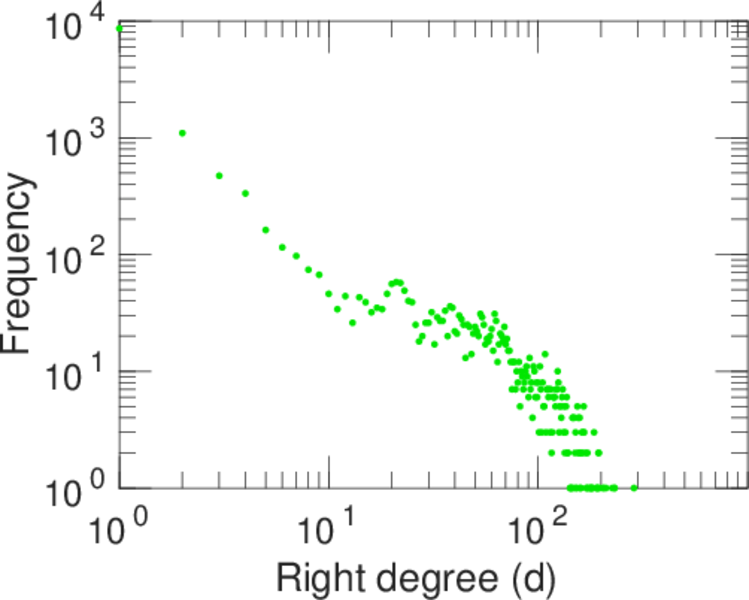
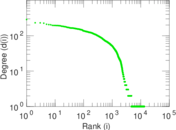
| Maximum right degree | d2max = | 287
|
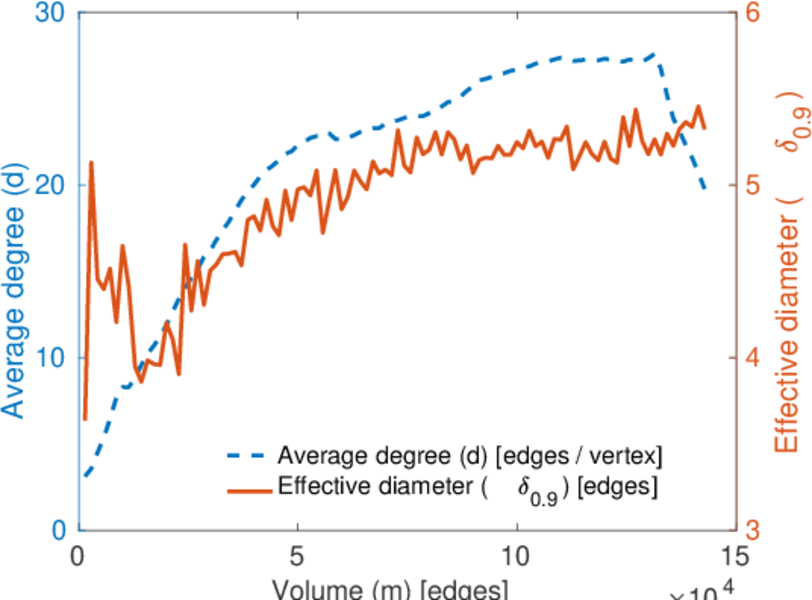
| Average degree | d = | 19.250 8
|
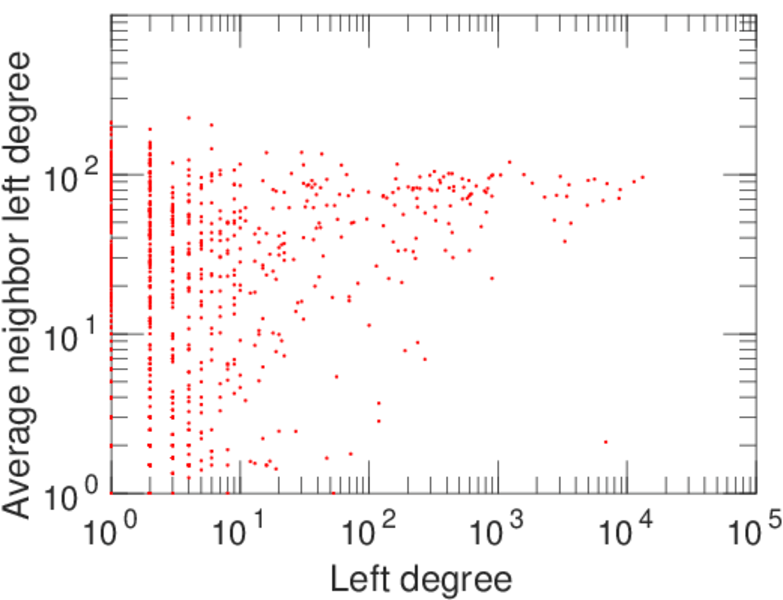
| Average left degree | d1 = | 128.866
|
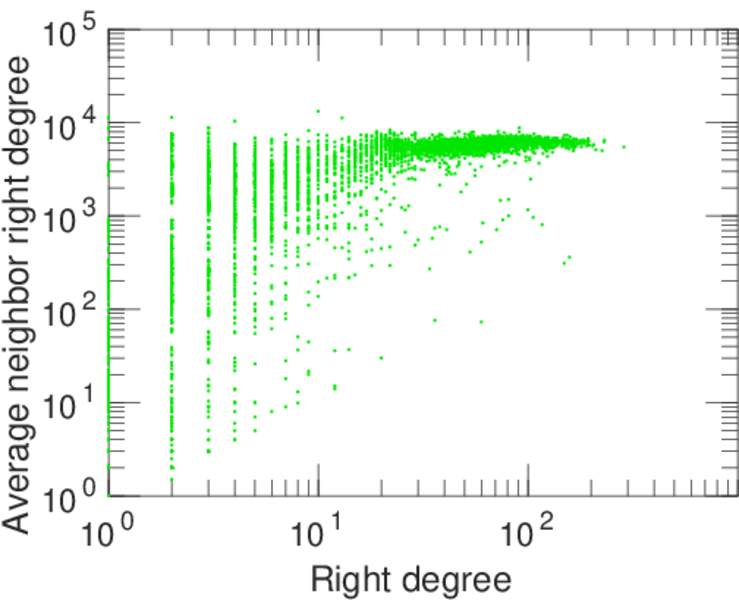
| Average right degree | d2 = | 10.402 4
|
| Fill | p = | 0.004 150 34
|
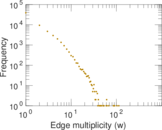
| Average edge multiplicity | m̃ = | 2.262 09
|
| Size of LCC | N = | 13,942
|
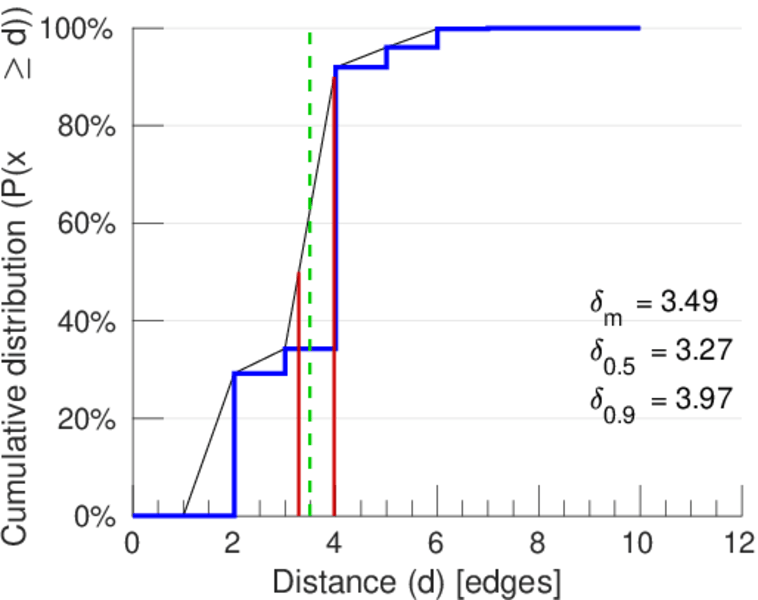
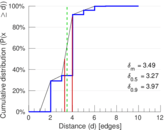
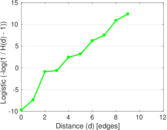
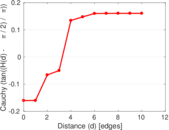
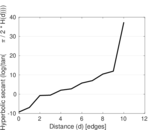
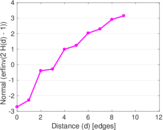
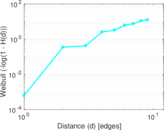
| Diameter | δ = | 11
|
| 50-Percentile effective diameter | δ0.5 = | 3.272 58
|
| 90-Percentile effective diameter | δ0.9 = | 3.966 51
|
| Median distance | δM = | 4
|
| Mean distance | δm = | 3.487 38
|
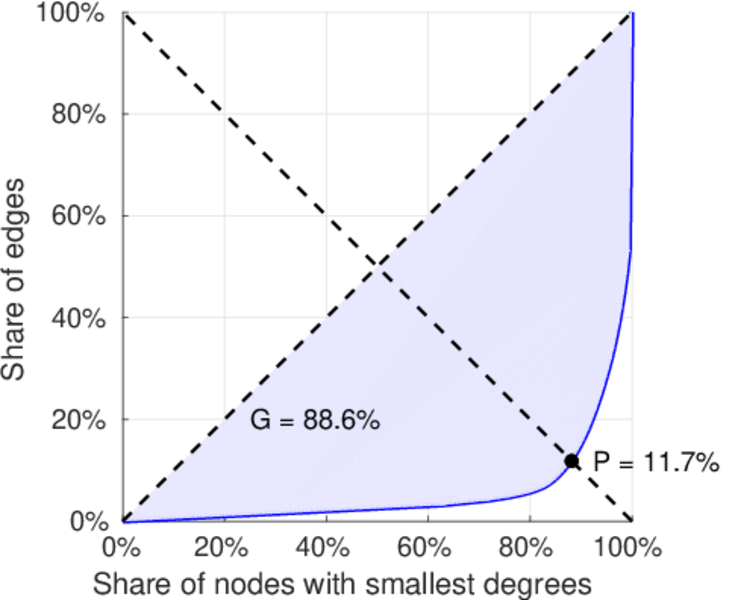
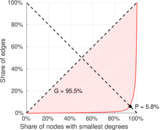
| Gini coefficient | G = | 0.886 592
|
| Balanced inequality ratio | P = | 0.114 678
|
| Left balanced inequality ratio | P1 = | 0.057 667 9
|
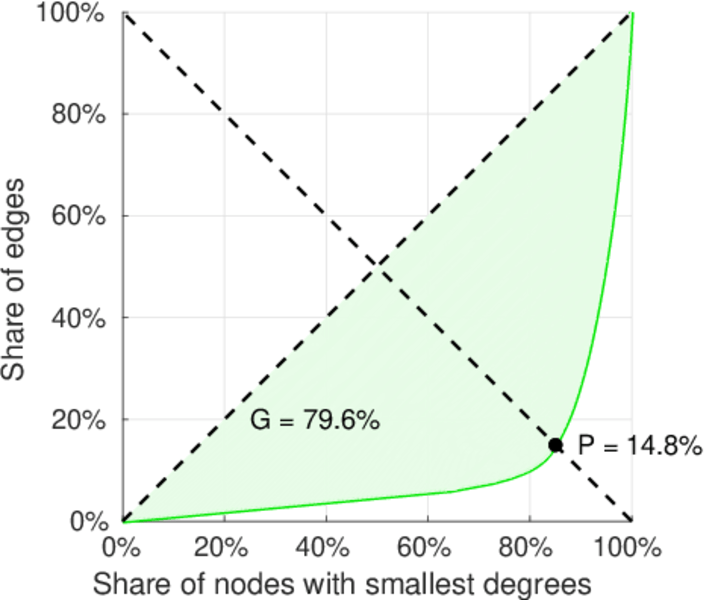
| Right balanced inequality ratio | P2 = | 0.148 260
|
| Relative edge distribution entropy | Her = | 0.744 081
|
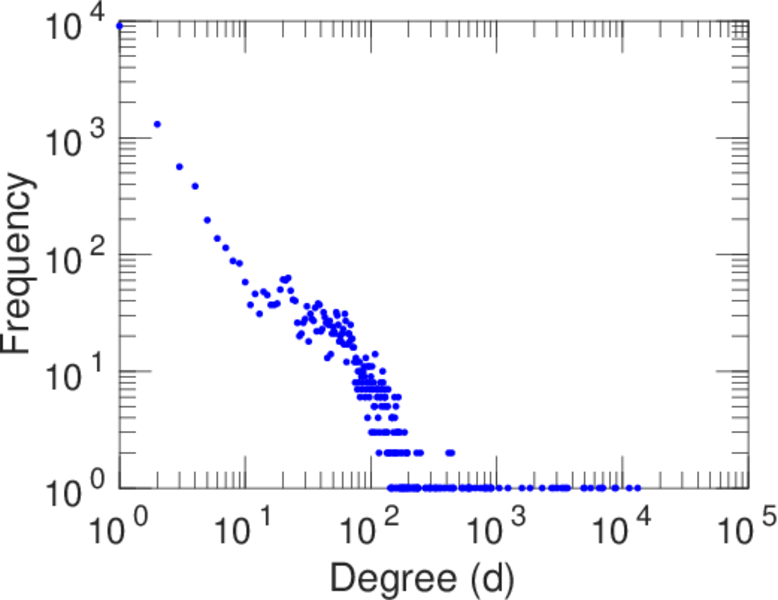
| Power law exponent | γ = | 2.483 44
|
| Tail power law exponent | γt = | 1.891 00
|
| Tail power law exponent with p | γ3 = | 1.891 00
|
| p-value | p = | 0.000 00
|
| Left tail power law exponent with p | γ3,1 = | 1.631 00
|
| Left p-value | p1 = | 0.000 00
|
| Right tail power law exponent with p | γ3,2 = | 8.911 00
|
| Right p-value | p2 = | 0.149 000
|
| Degree assortativity | ρ = | −0.481 782
|
| Degree assortativity p-value | pρ = | 0.000 00
|
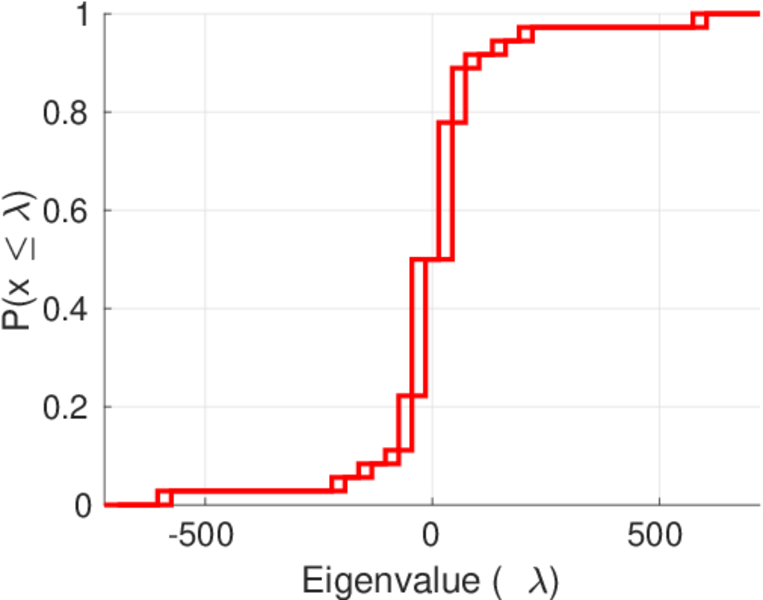
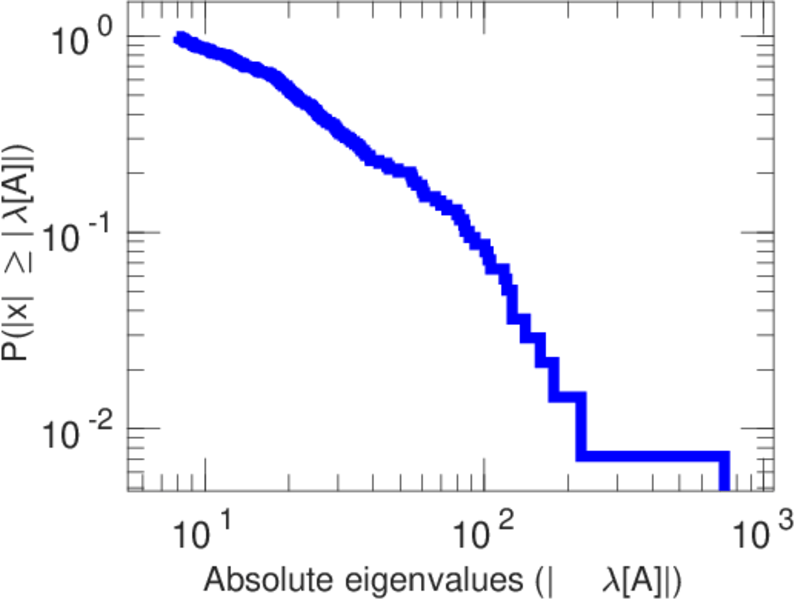
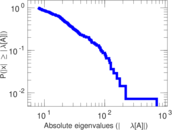
| Spectral norm | α = | 722.125
|
| Algebraic connectivity | a = | 0.021 052 0
|
| Spectral separation | |λ1[A] / λ2[A]| = | 3.253 30
|
| Controllability | C = | 12,354
|
| Relative controllability | Cr = | 0.855 066
|
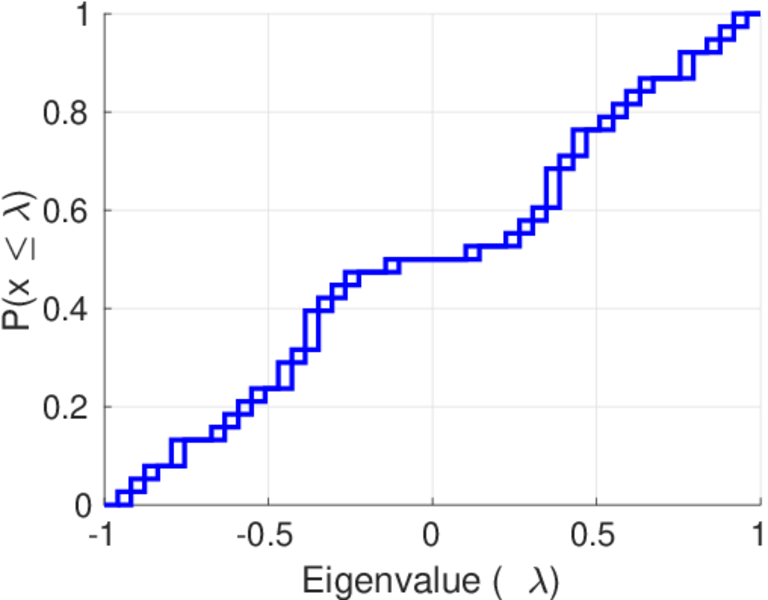
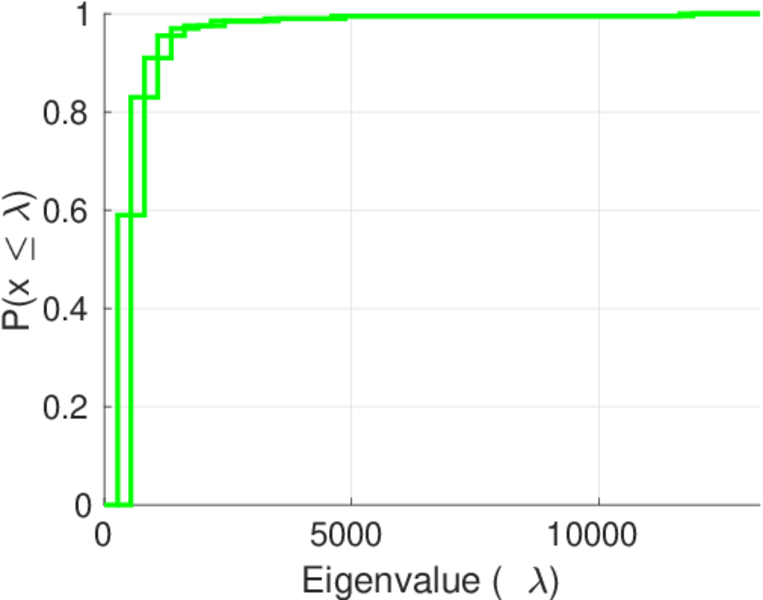
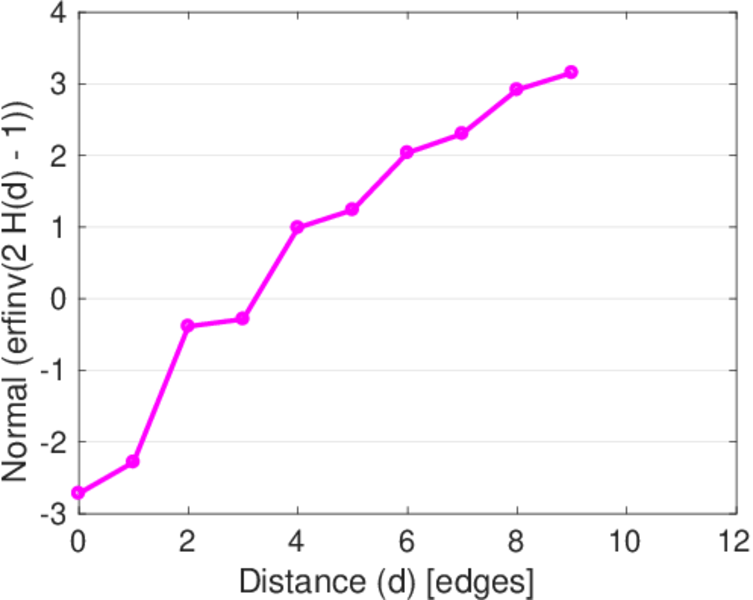
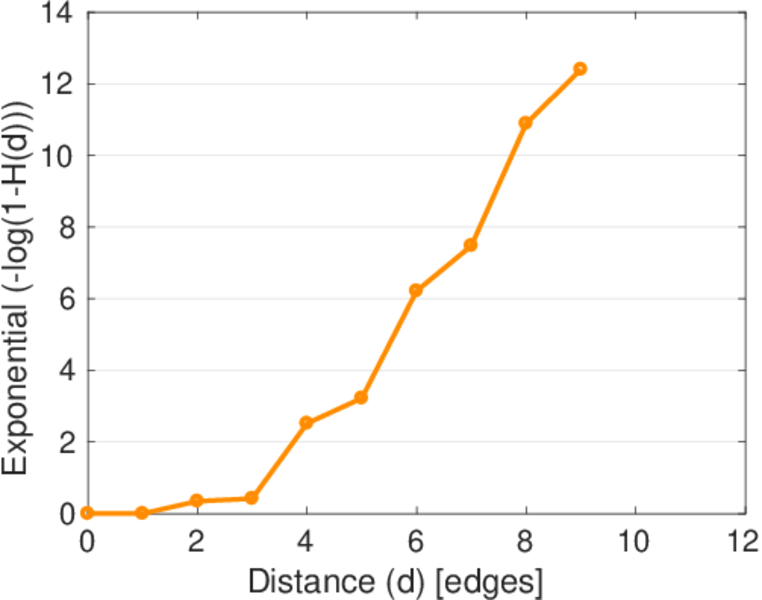
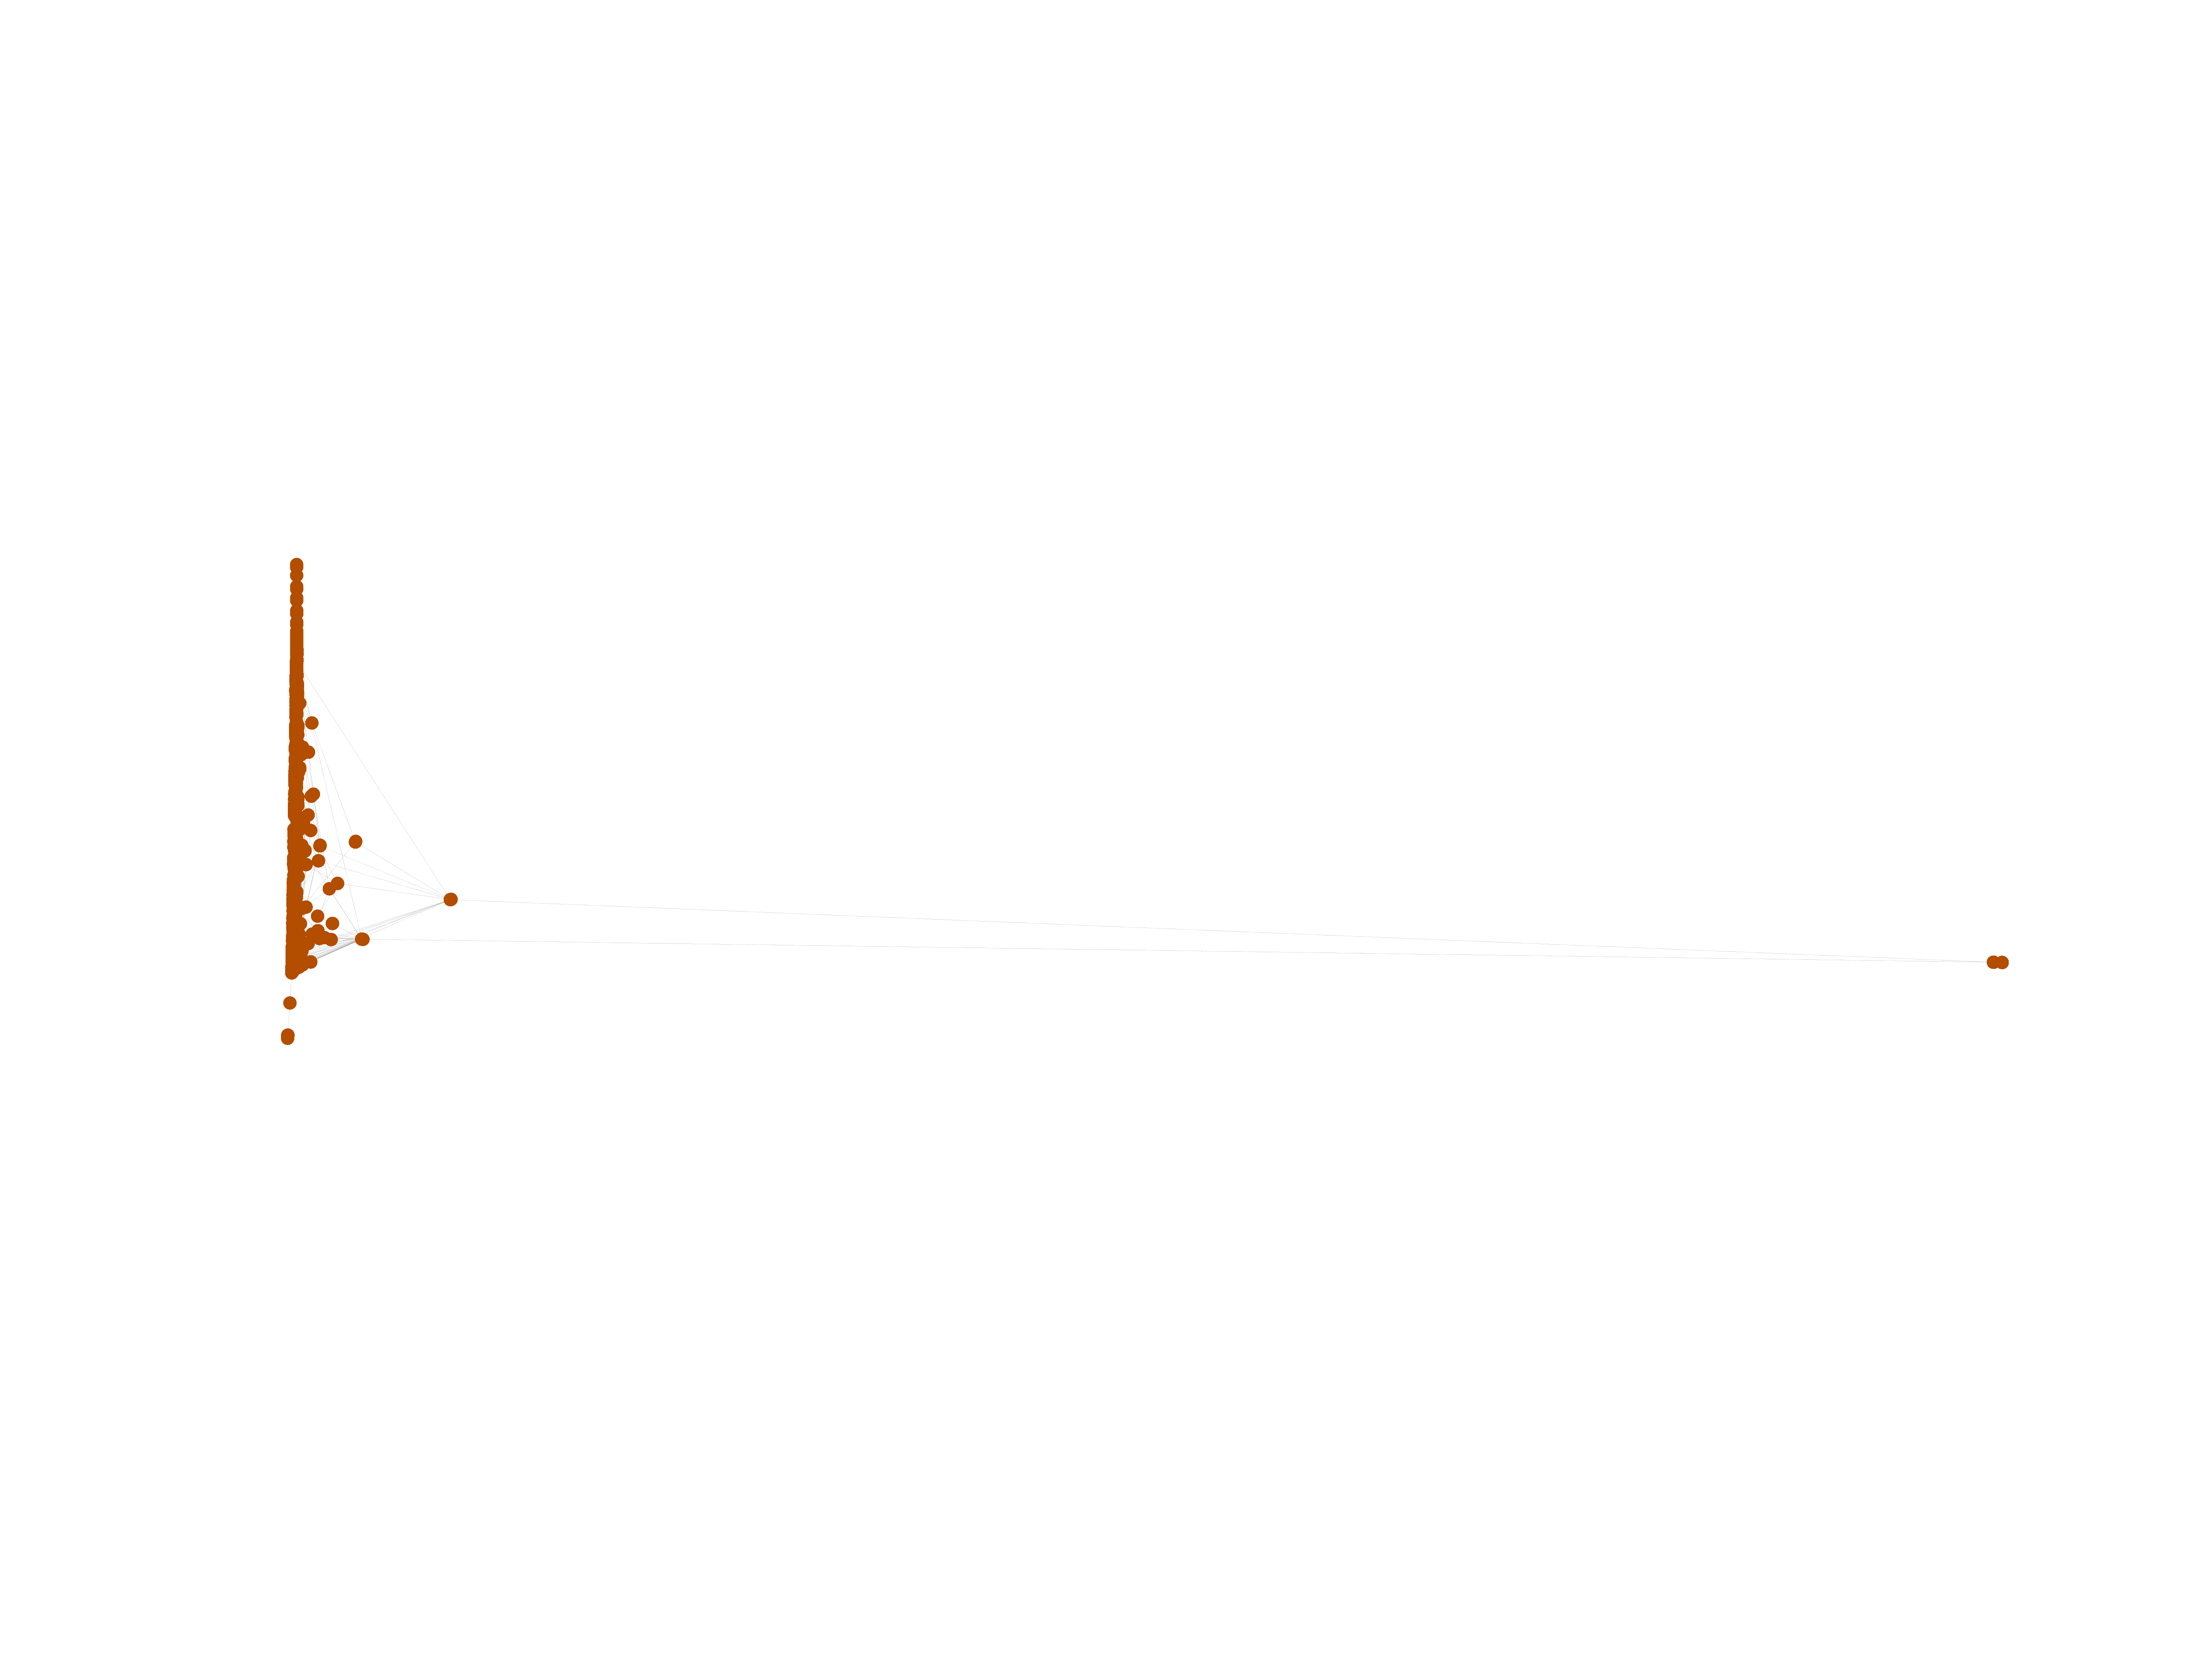
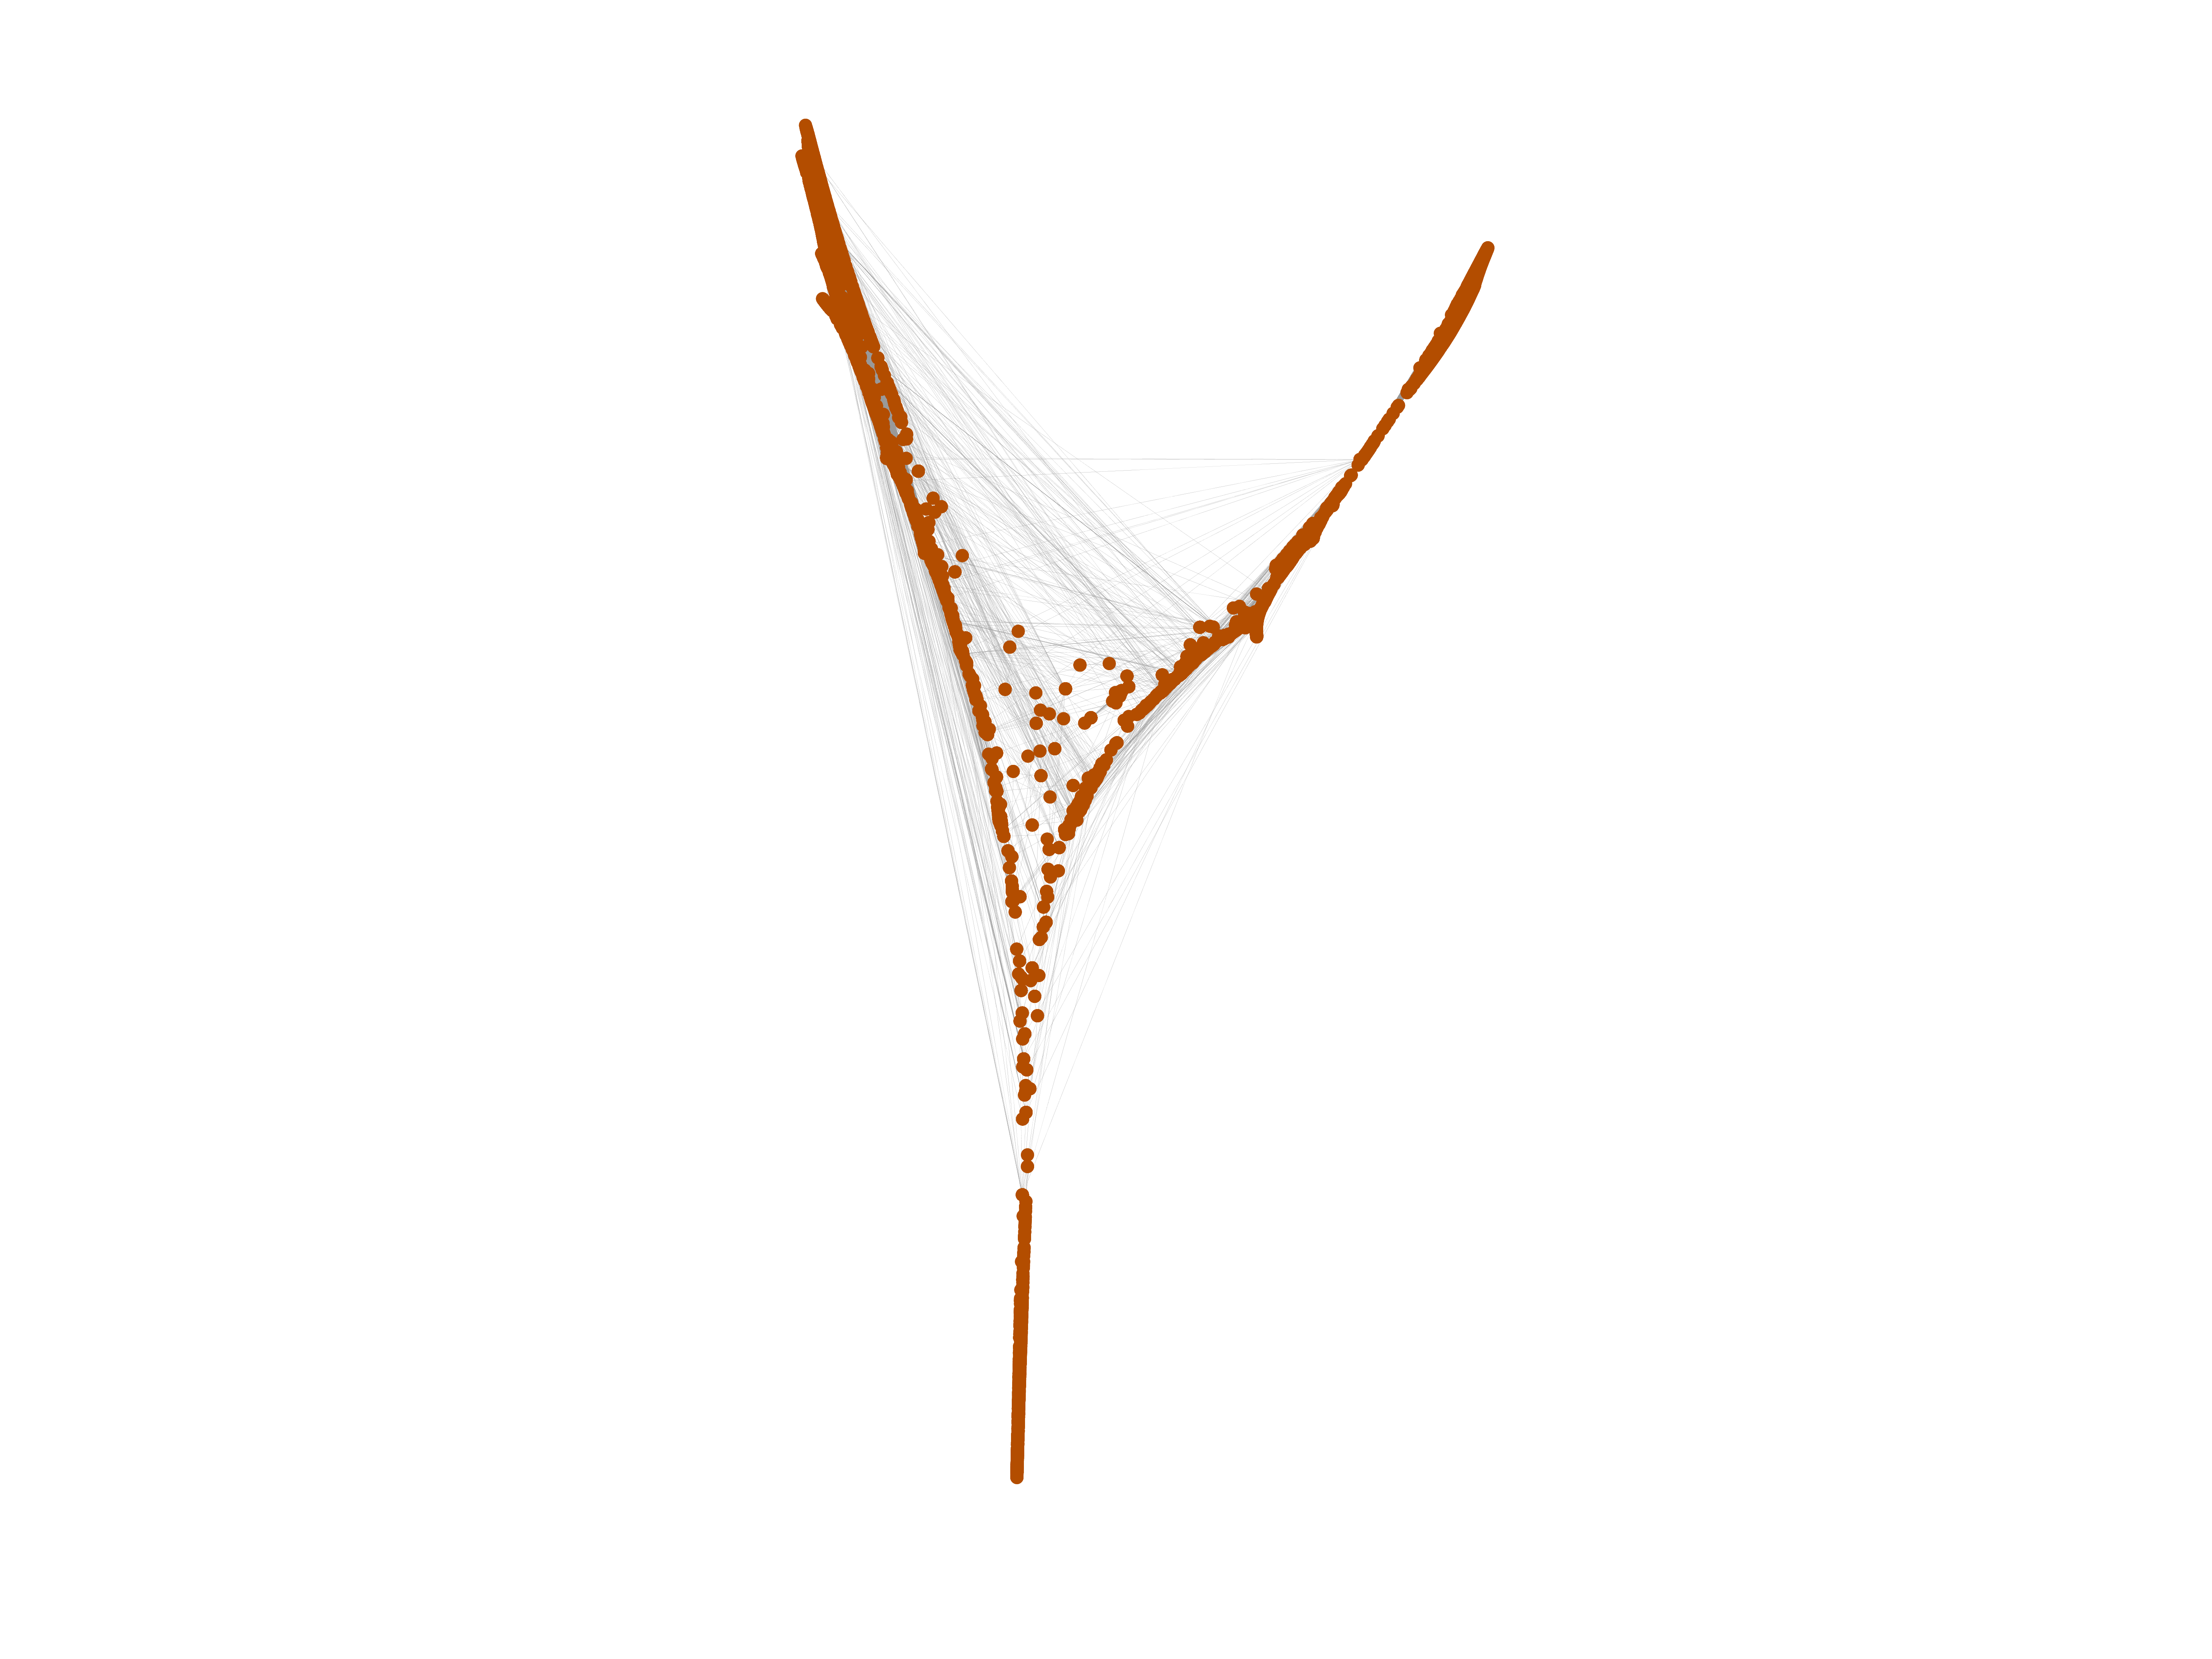
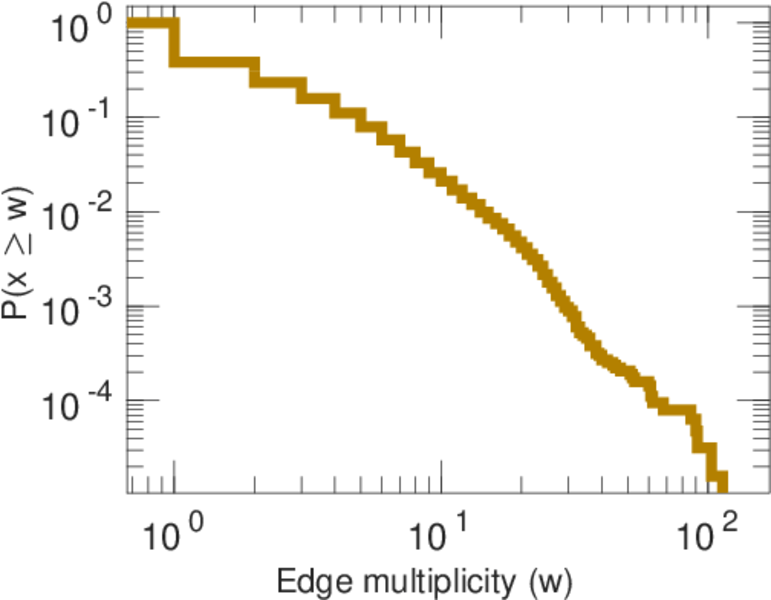
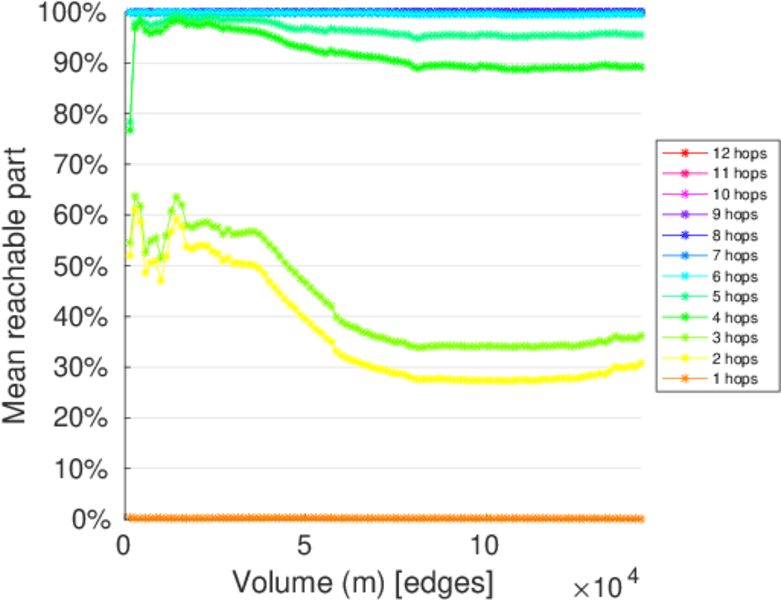
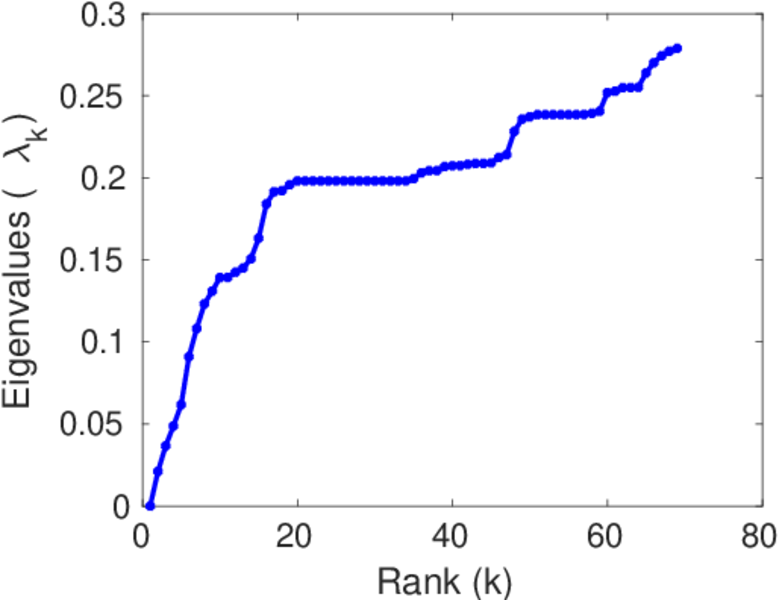
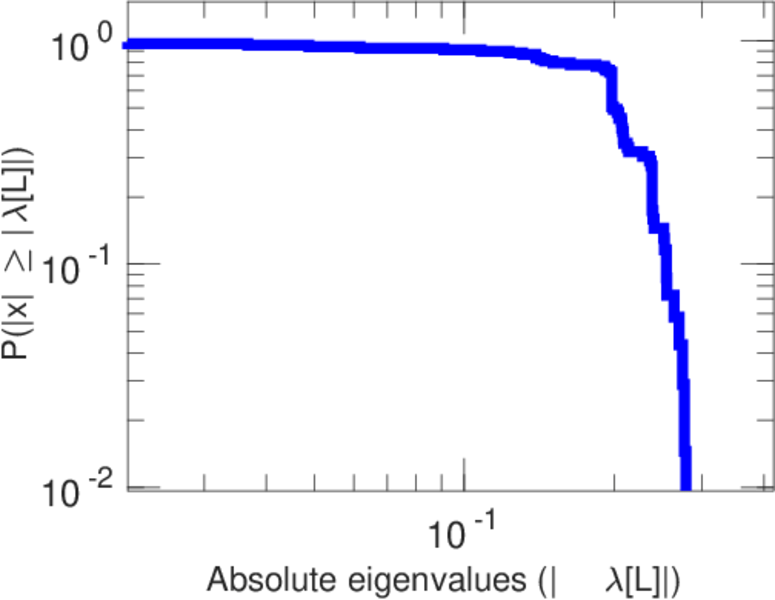
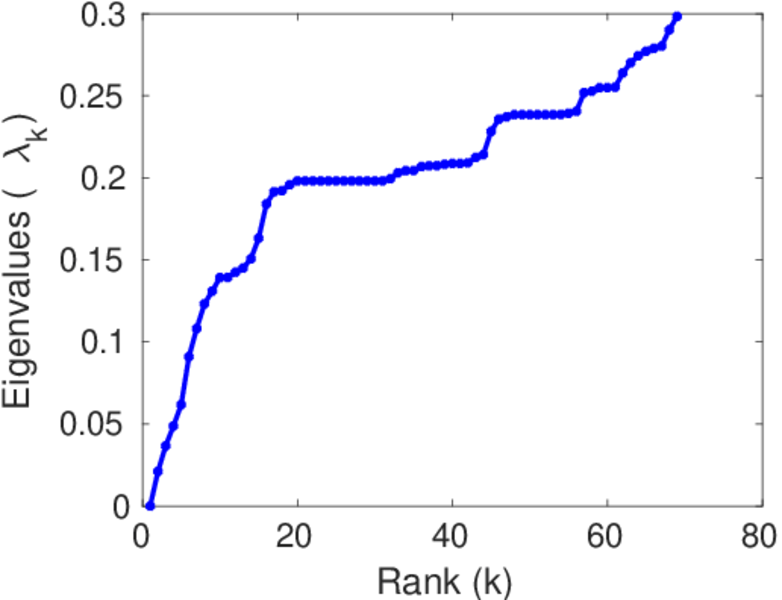
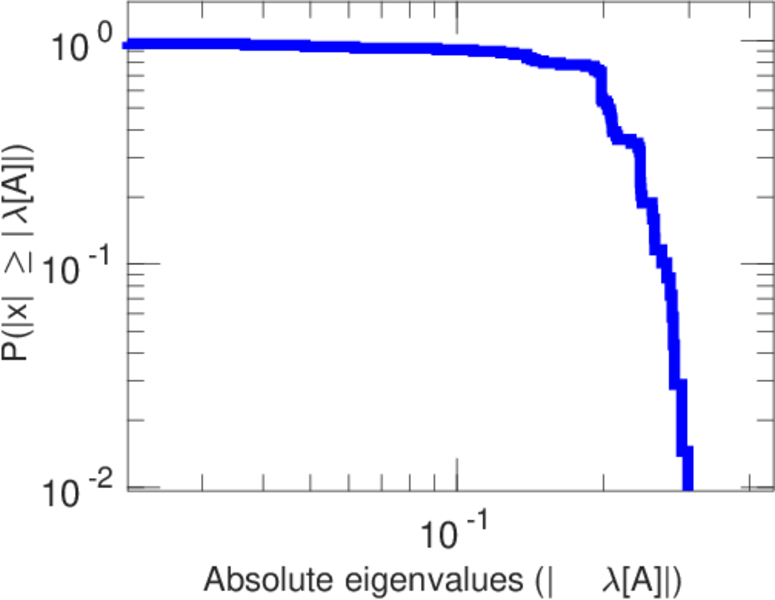
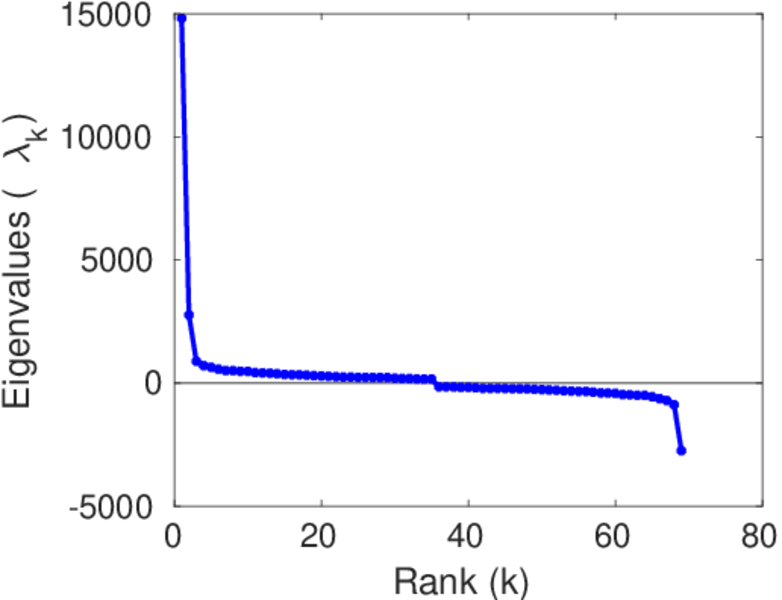
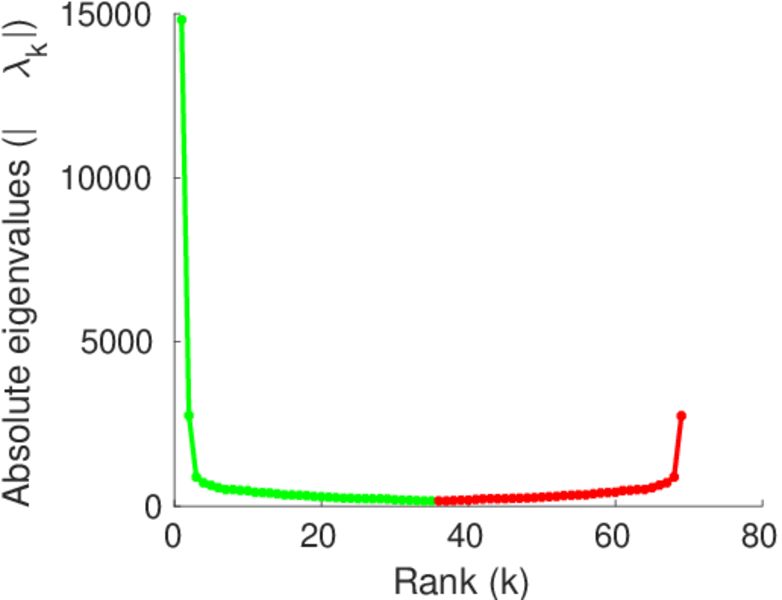
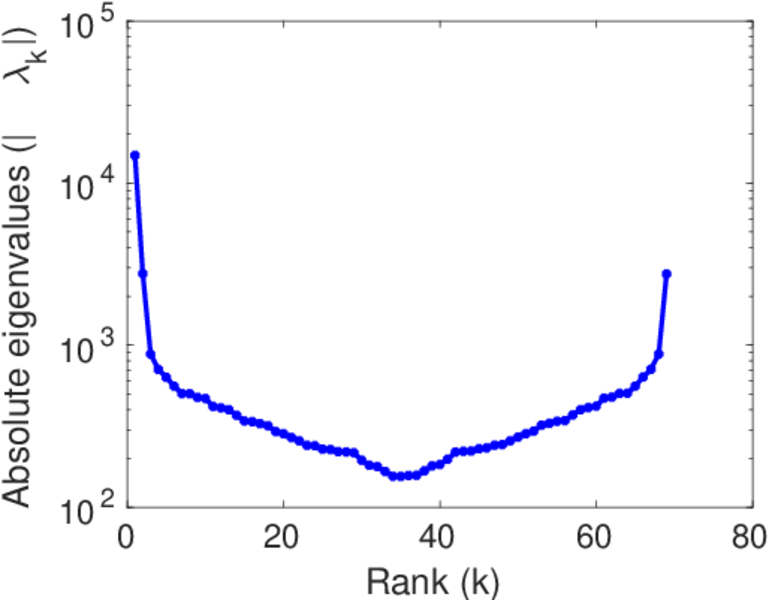
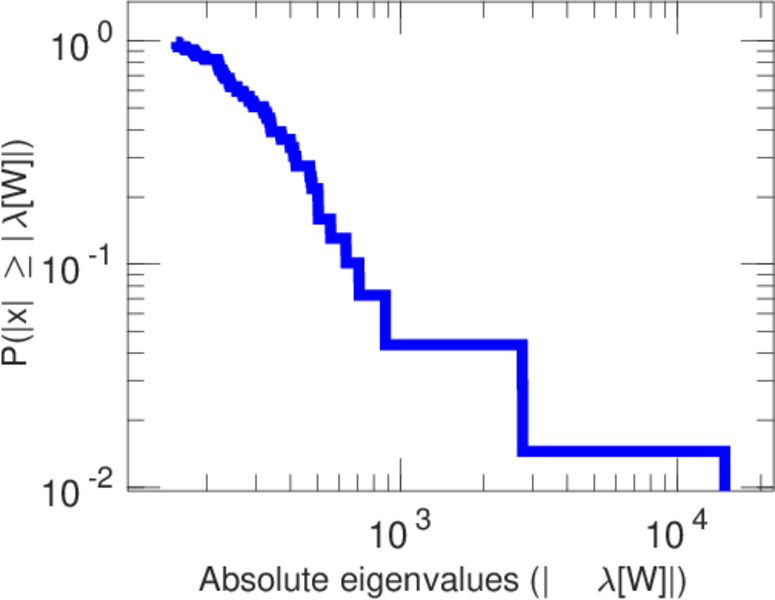
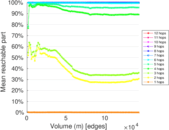
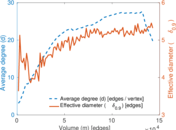
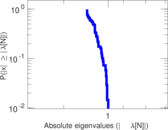
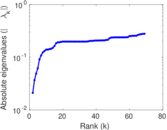
Plots


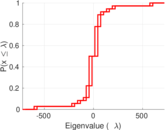
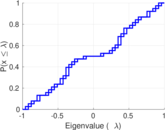
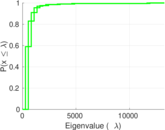
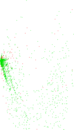


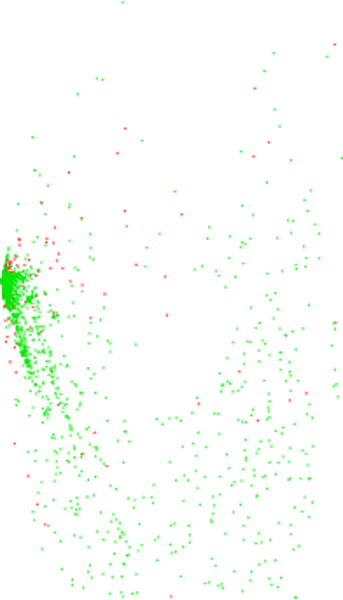
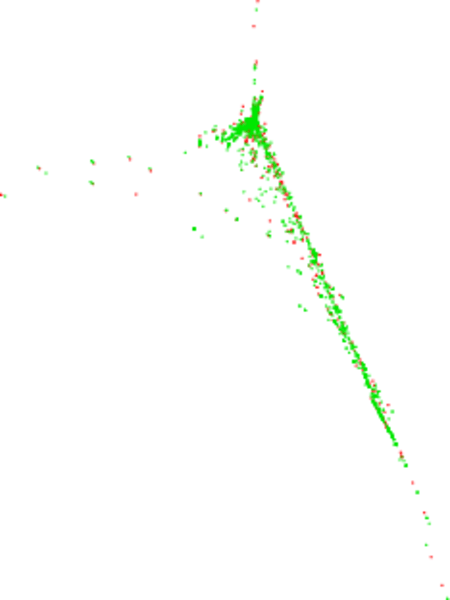
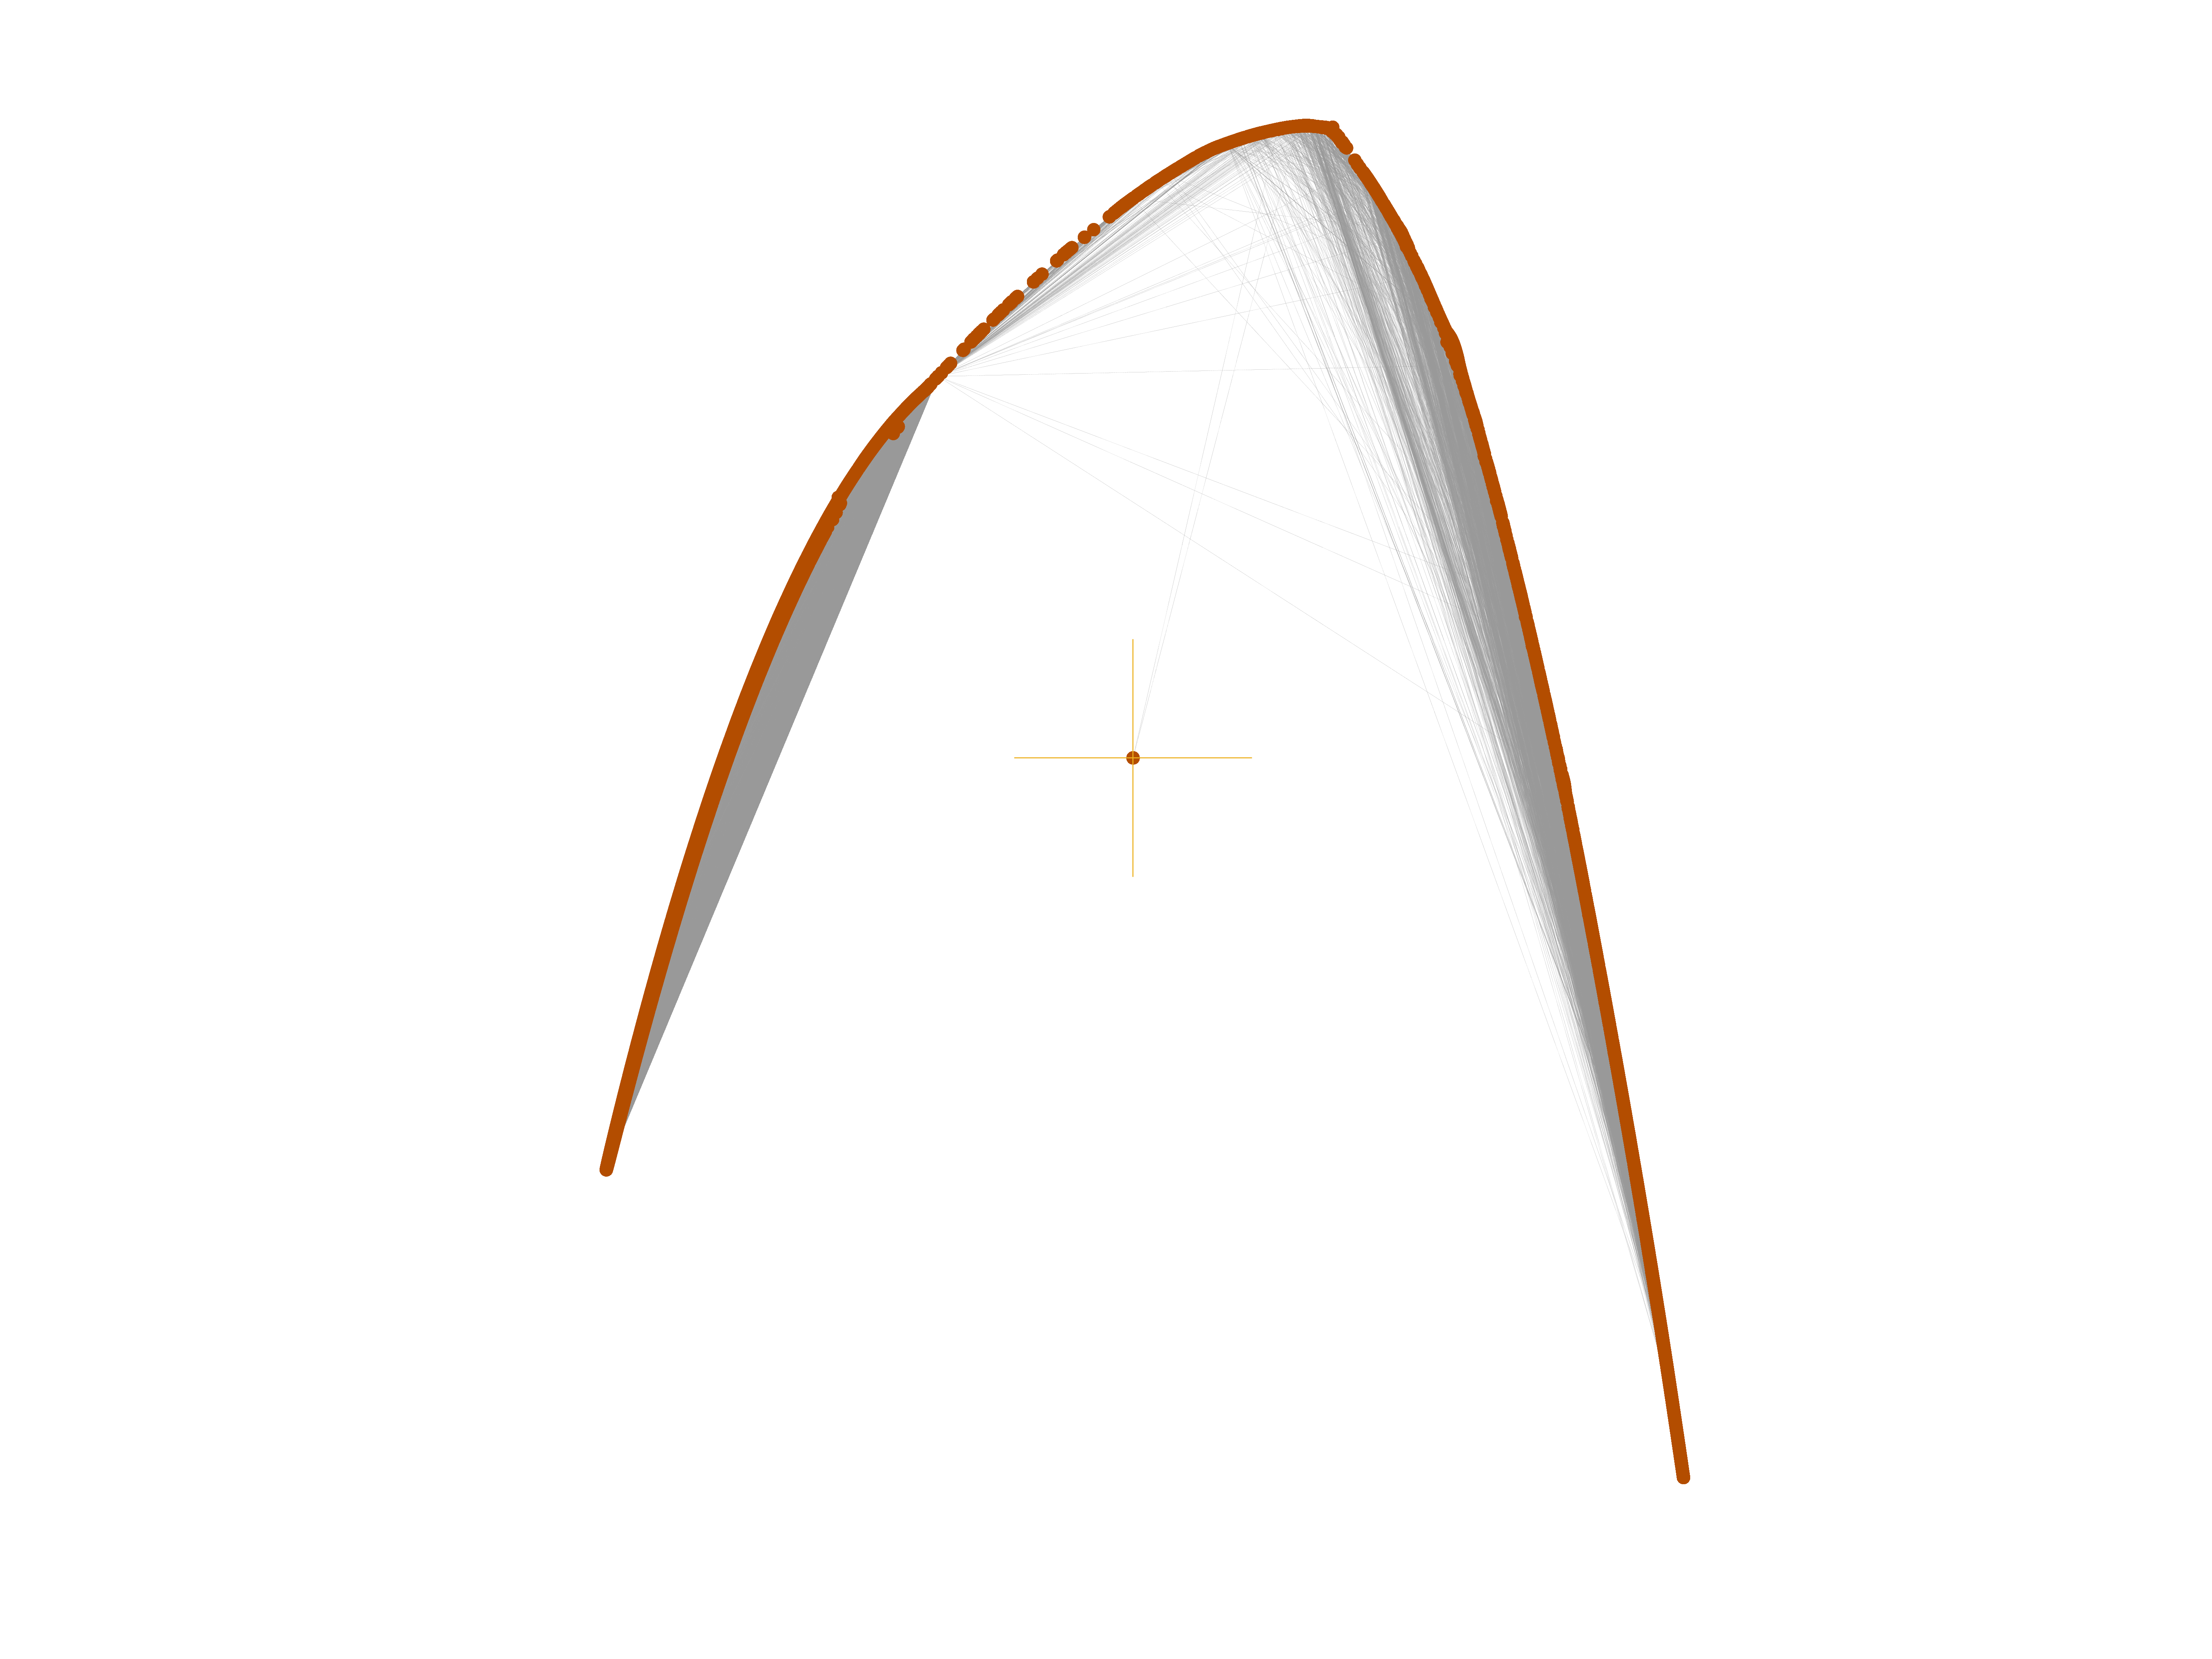
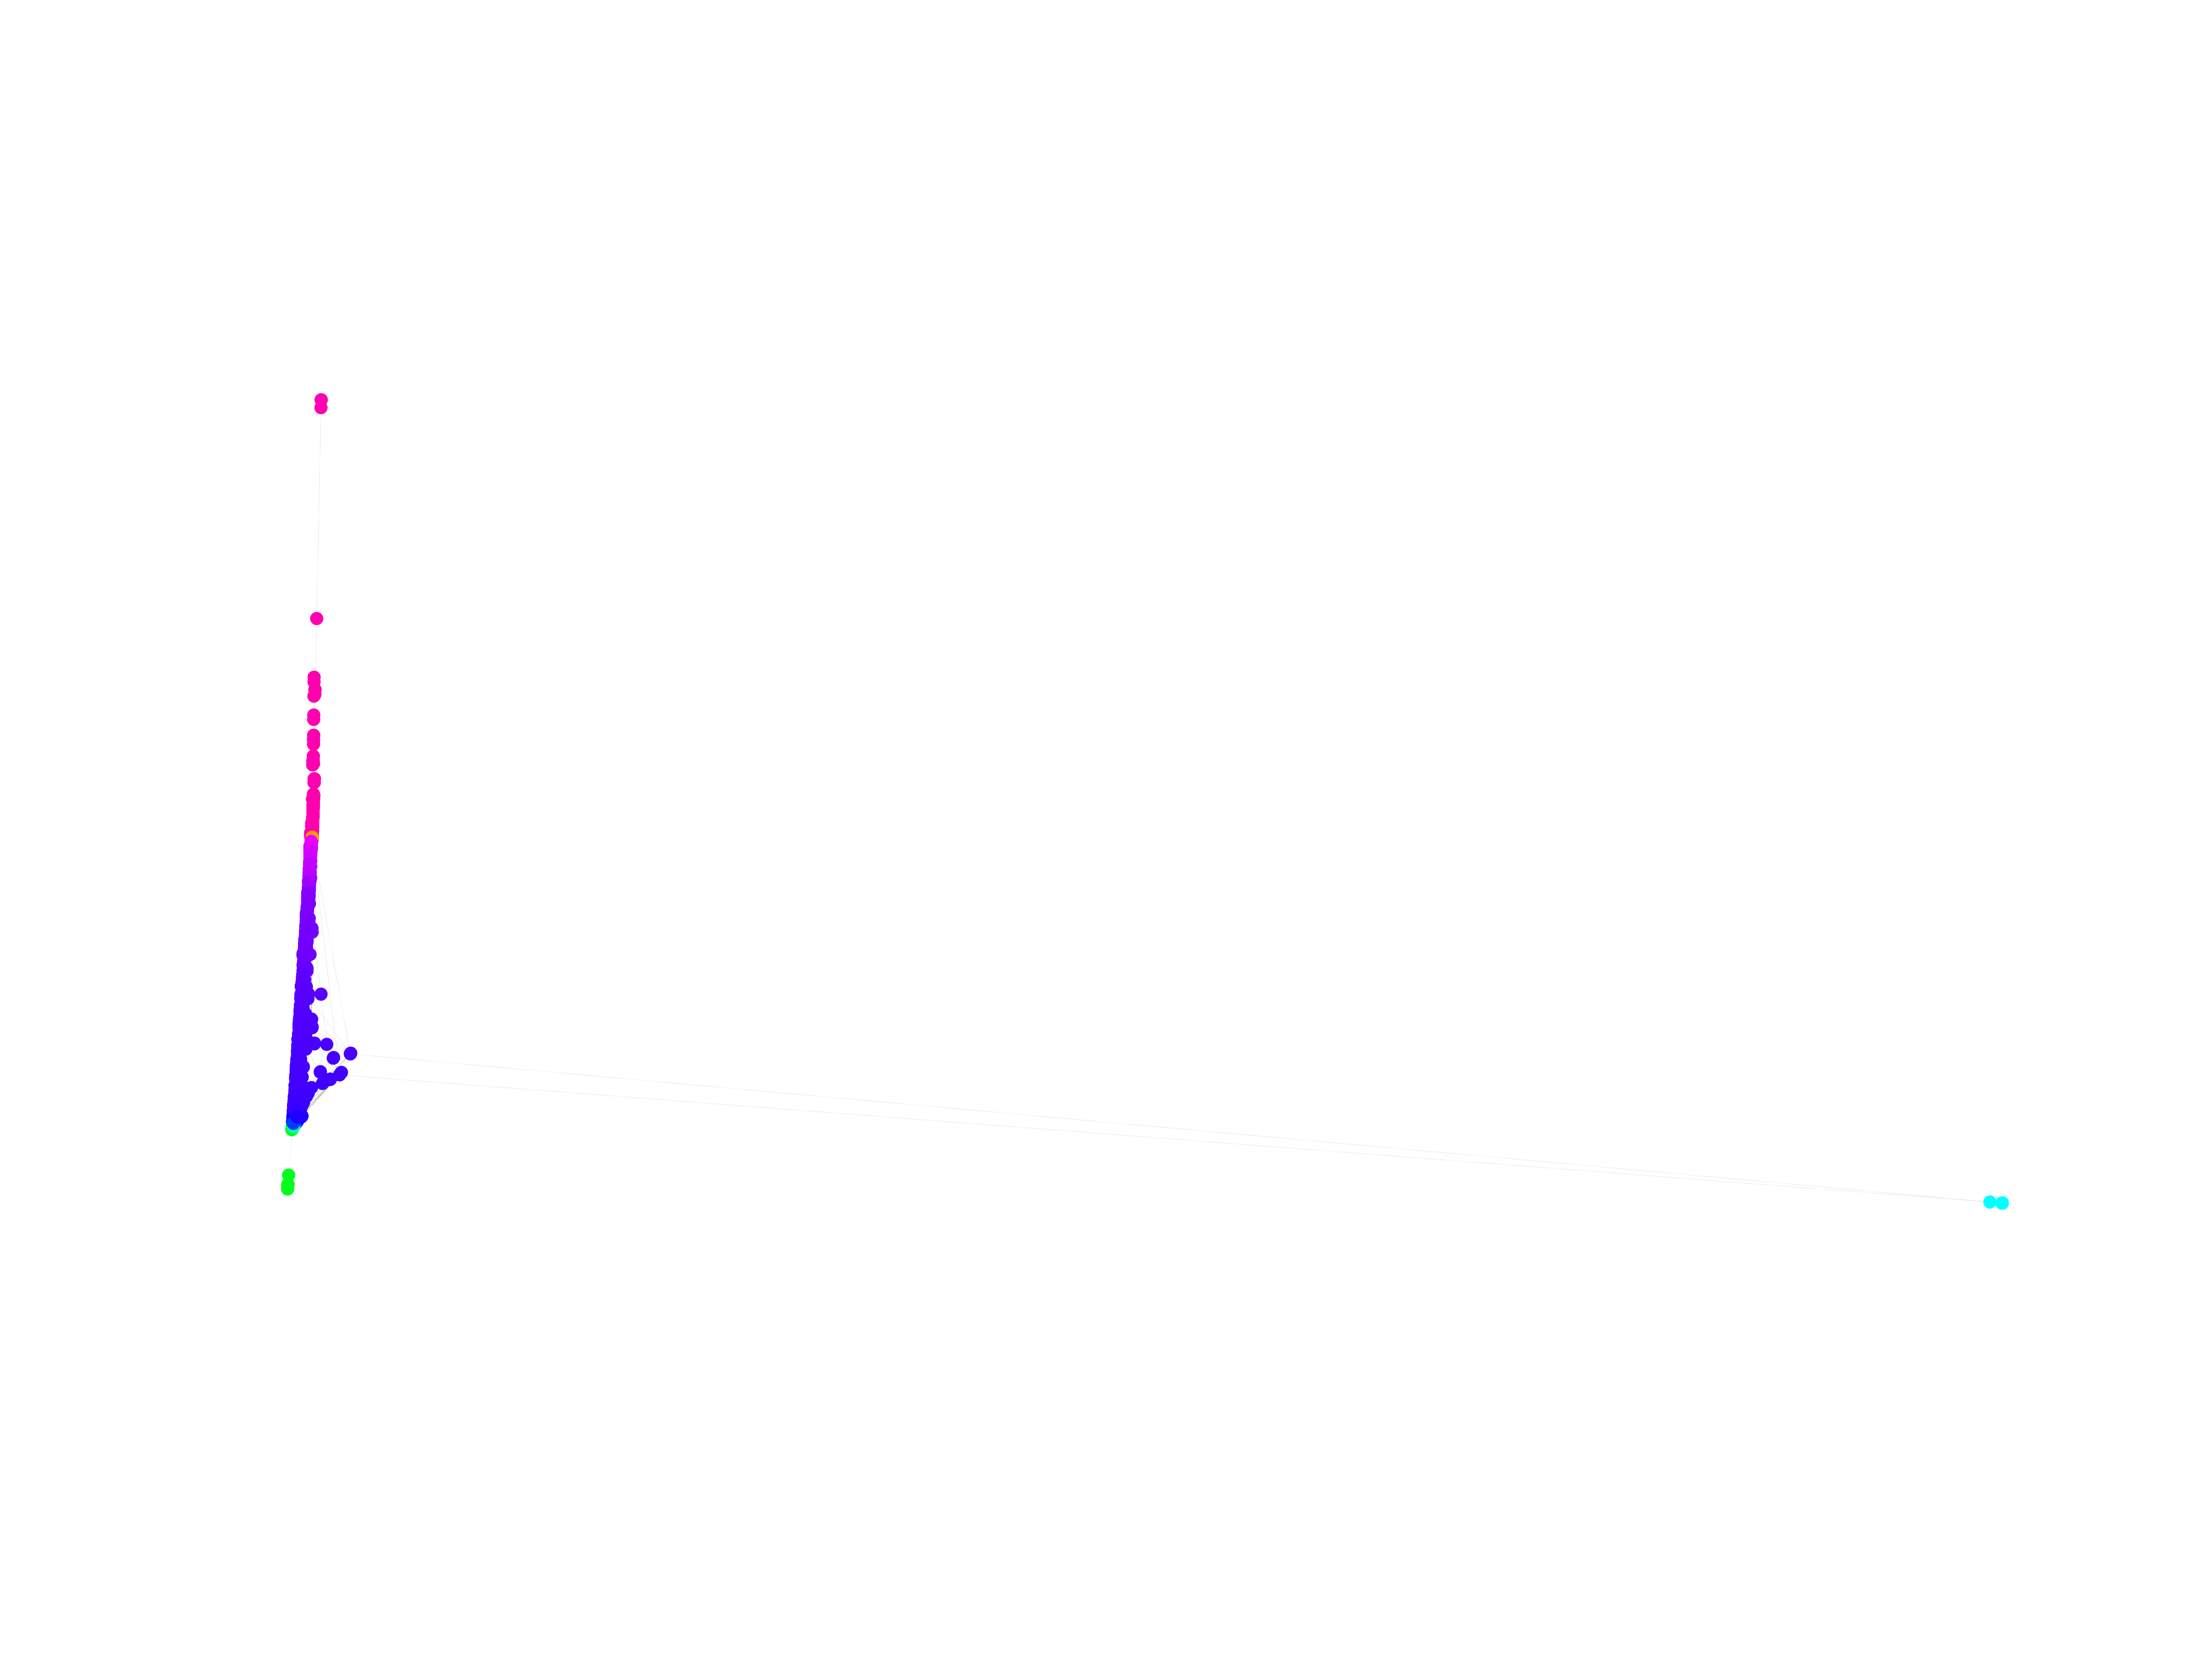
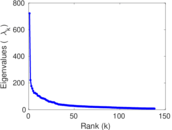
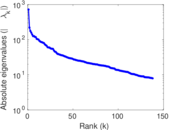
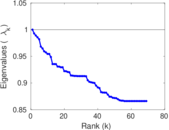
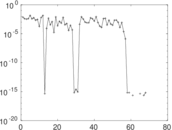
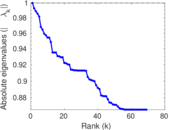
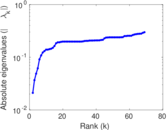
Matrix decompositions plots


Downloads
References
|
[1]
|
Jérôme Kunegis.
KONECT – The Koblenz Network Collection.
In Proc. Int. Conf. on World Wide Web Companion, pages
1343–1350, 2013.
[ http ]
|
|
[2]
|
Wikimedia Foundation.
Wikimedia downloads.
http://dumps.wikimedia.org/, January 2010.
|
 KONECT ‣ Networks ‣
Buy Me a Coffee
KONECT ‣ Networks ‣
Buy Me a Coffee