Wikipedia edits (li)
This is the bipartite edit network of the Limburgish Wikipedia. It contains
users and pages from the Limburgish Wikipedia, connected by edit events. Each
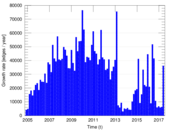
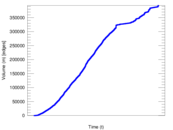
edge represents an edit. The dataset includes the timestamp of each edit.
Metadata
Statistics
| Size | n = | 60,713
|
| Left size | n1 = | 2,059
|
| Right size | n2 = | 58,654
|
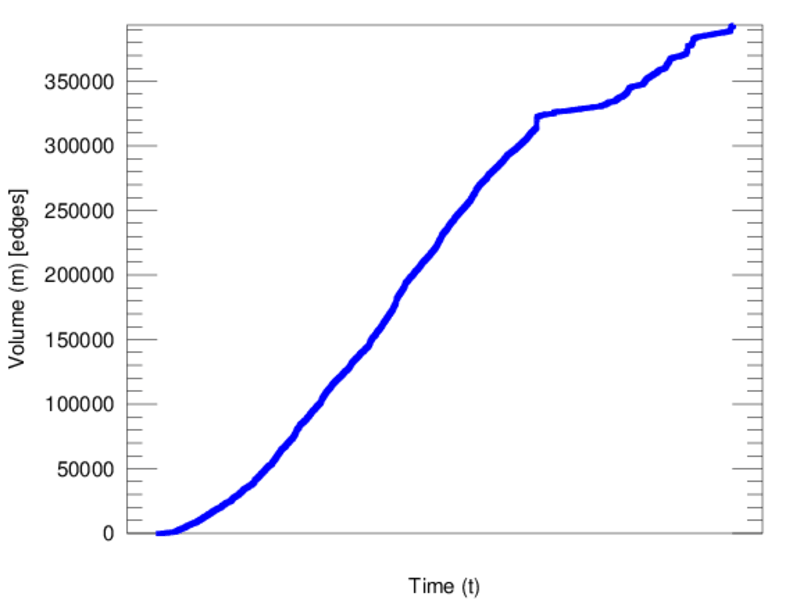
| Volume | m = | 393,573
|
| Unique edge count | m̿ = | 188,489
|
| Wedge count | s = | 593,992,674
|
| Claw count | z = | 2,597,766,790,737
|
| Cross count | x = | 10,826,642,216,437,664
|
| Square count | q = | 582,762,301
|
| 4-Tour count | T4 = | 7,038,584,238
|
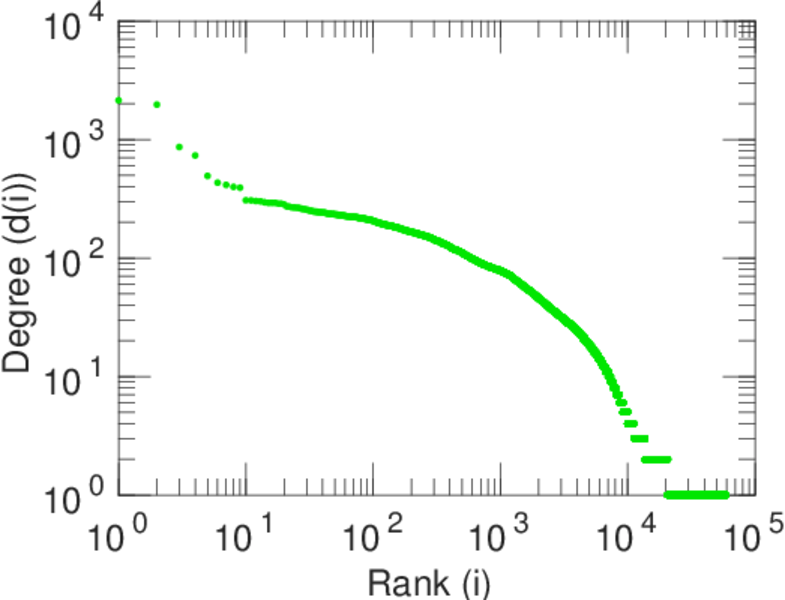
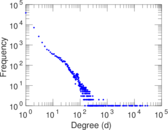
| Maximum degree | dmax = | 30,262
|
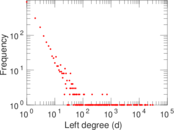
| Maximum left degree | d1max = | 30,262
|
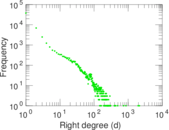
| Maximum right degree | d2max = | 2,140
|
| Average degree | d = | 12.965 0
|
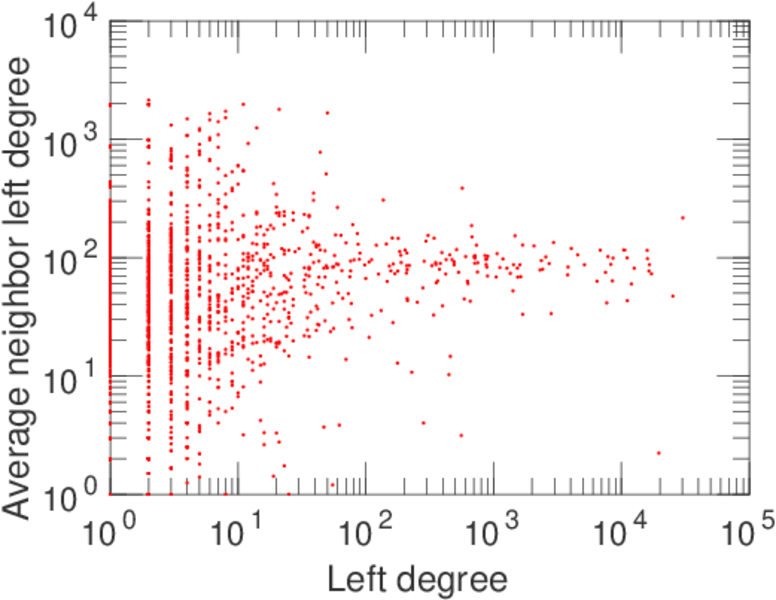
| Average left degree | d1 = | 191.148
|
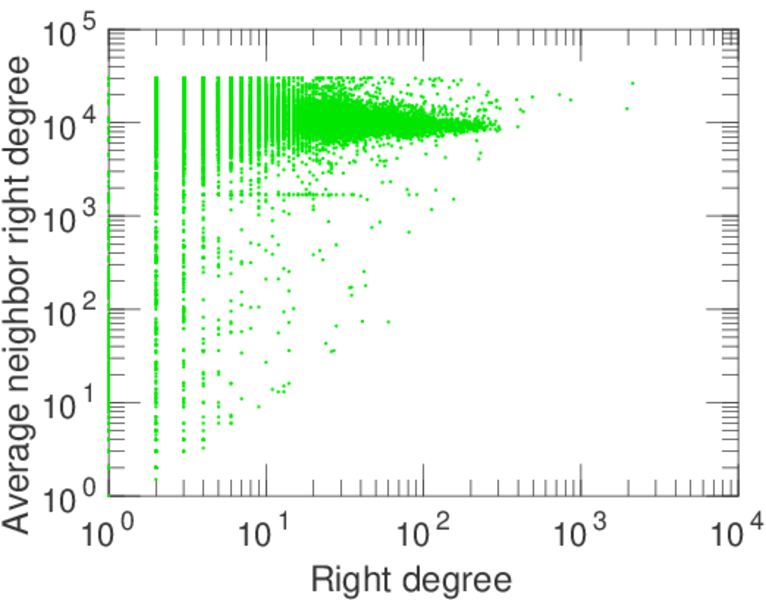
| Average right degree | d2 = | 6.710 08
|
| Fill | p = | 0.001 560 75
|
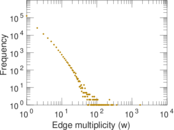
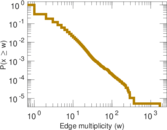
| Average edge multiplicity | m̃ = | 2.088 04
|
| Size of LCC | N = | 60,002
|
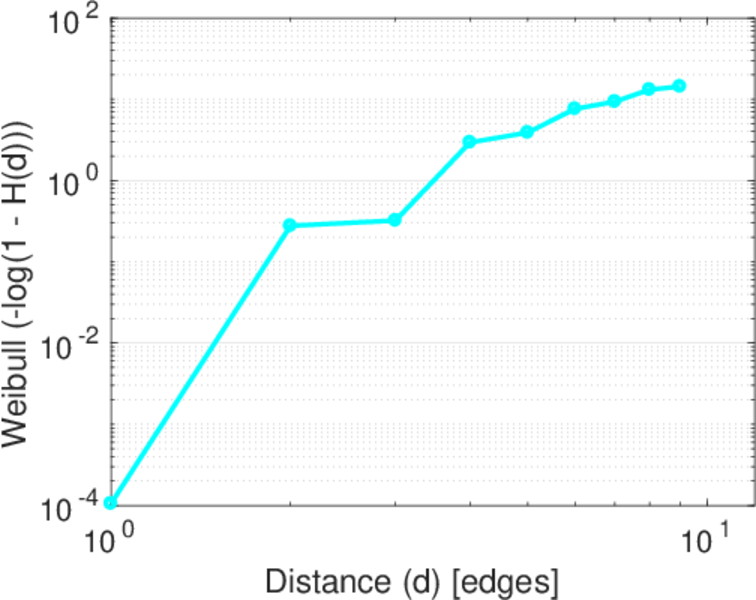
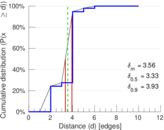
| Diameter | δ = | 10
|
| 50-Percentile effective diameter | δ0.5 = | 3.334 68
|
| 90-Percentile effective diameter | δ0.9 = | 3.929 96
|
| Median distance | δM = | 4
|
| Mean distance | δm = | 3.557 03
|
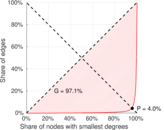
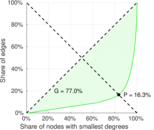
| Gini coefficient | G = | 0.880 865
|
| Balanced inequality ratio | P = | 0.113 021
|
| Left balanced inequality ratio | P1 = | 0.039 756 3
|
| Right balanced inequality ratio | P2 = | 0.163 345
|
| Relative edge distribution entropy | Her = | 0.710 988
|
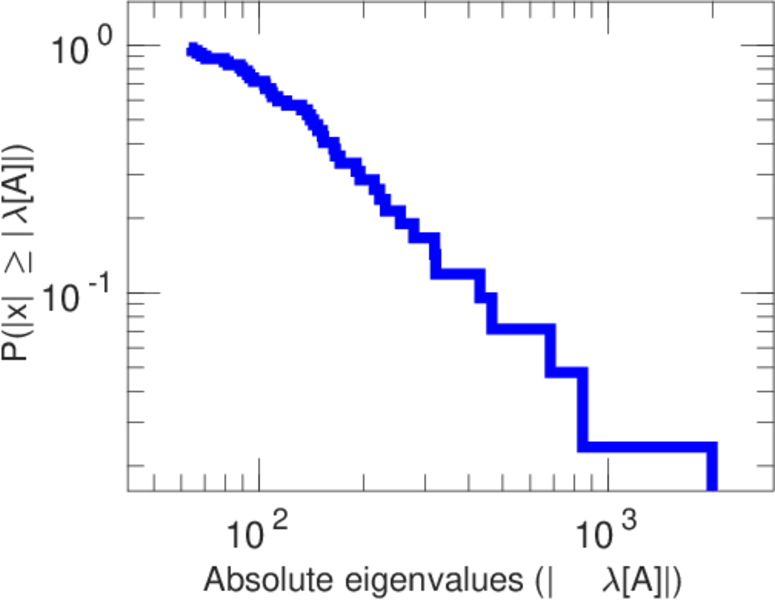
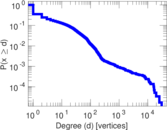
| Power law exponent | γ = | 3.028 49
|
| Tail power law exponent | γt = | 2.101 00
|
| Tail power law exponent with p | γ3 = | 2.101 00
|
| p-value | p = | 0.000 00
|
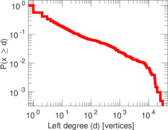
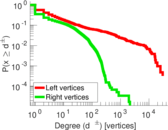
| Left tail power law exponent with p | γ3,1 = | 1.681 00
|
| Left p-value | p1 = | 0.000 00
|
| Right tail power law exponent with p | γ3,2 = | 5.361 00
|
| Right p-value | p2 = | 0.000 00
|
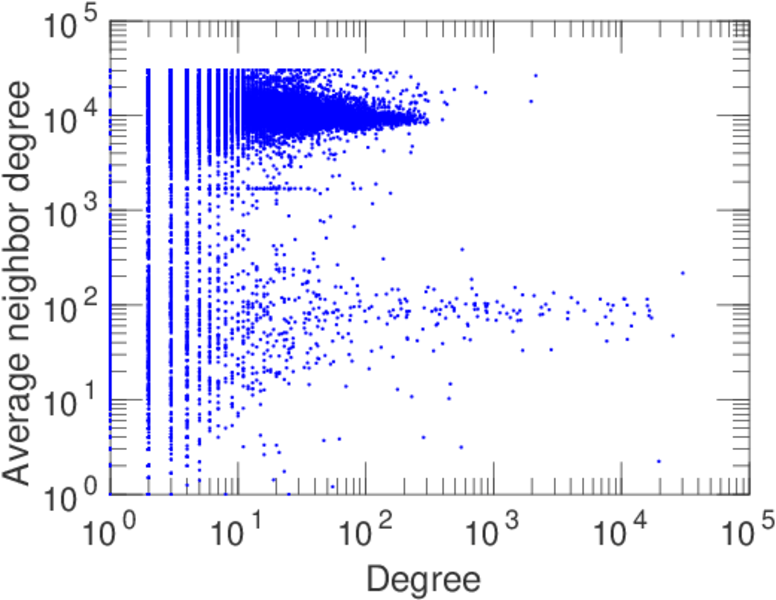
| Degree assortativity | ρ = | −0.520 404
|
| Degree assortativity p-value | pρ = | 0.000 00
|
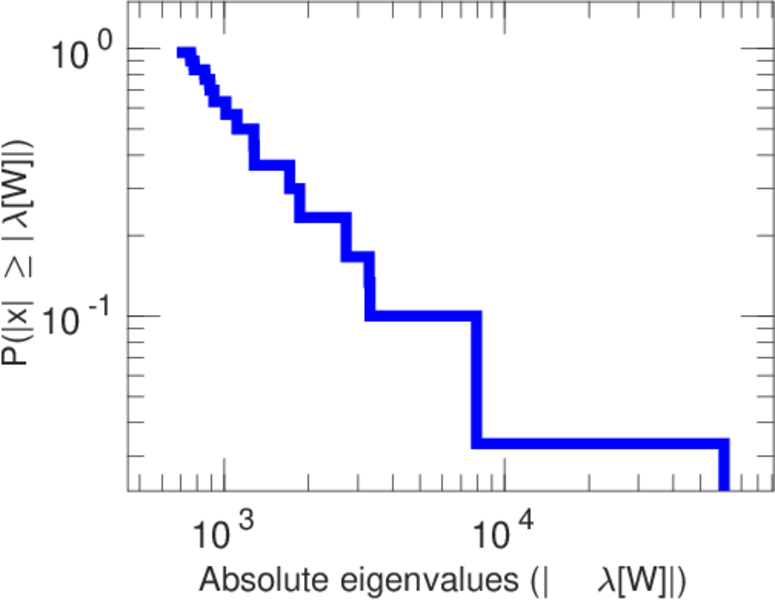
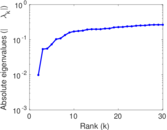
| Spectral norm | α = | 1,988.15
|
| Algebraic connectivity | a = | 0.009 859 09
|
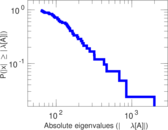
| Spectral separation | |λ1[A] / λ2[A]| = | 2.345 77
|
| Controllability | C = | 56,758
|
| Relative controllability | Cr = | 0.937 080
|
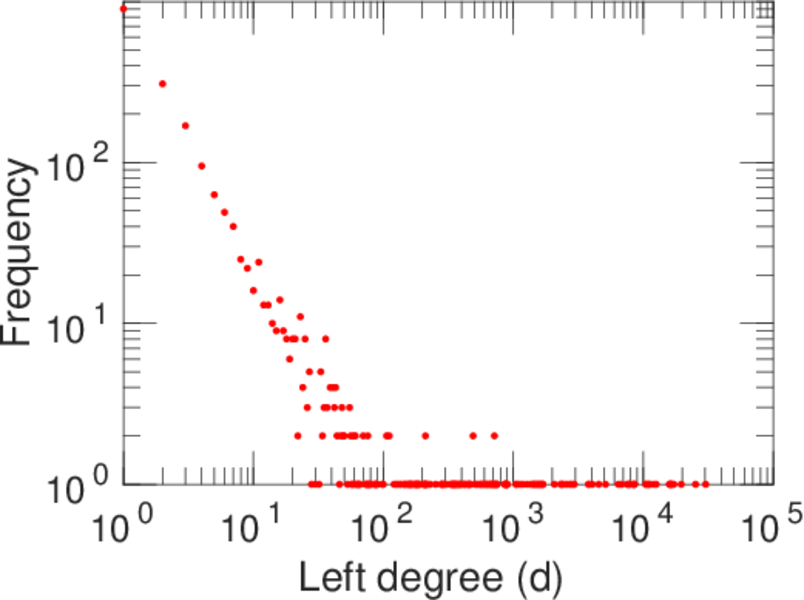
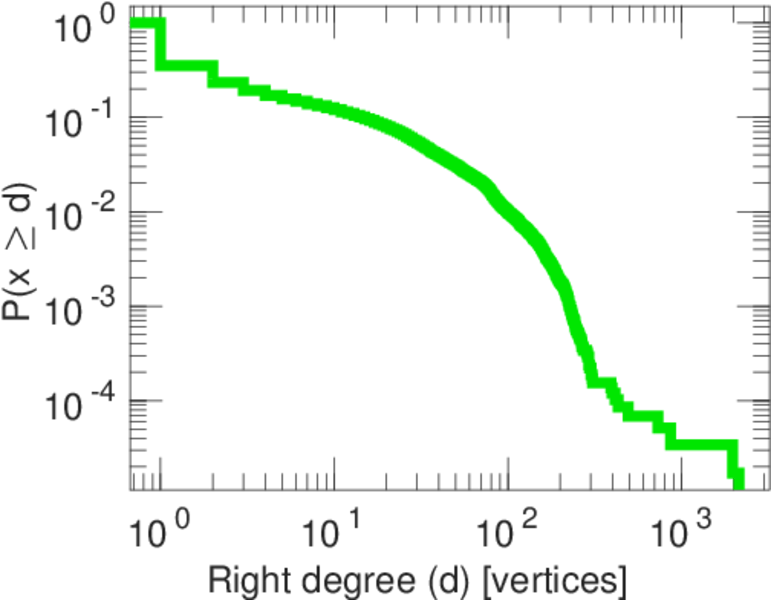
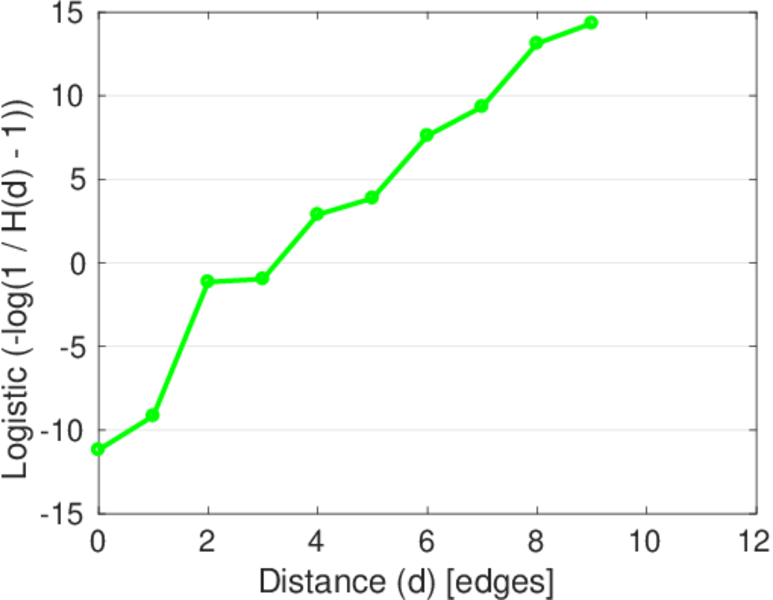
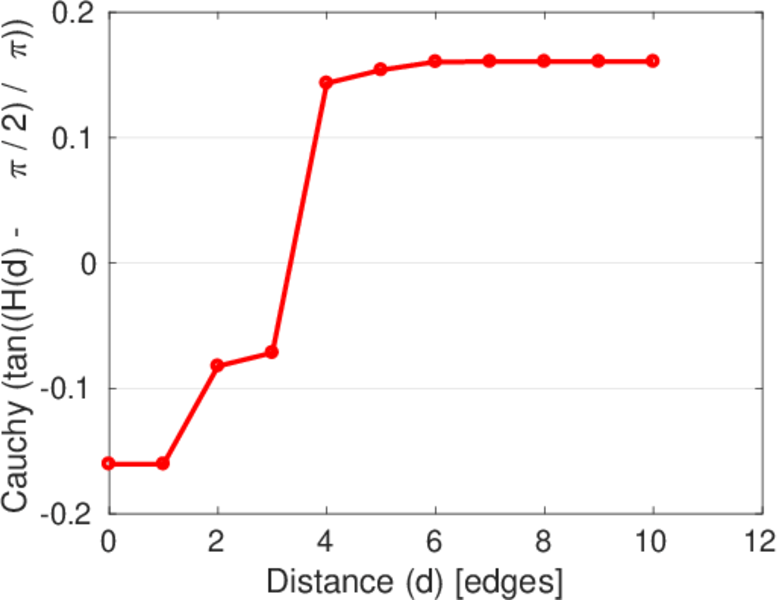
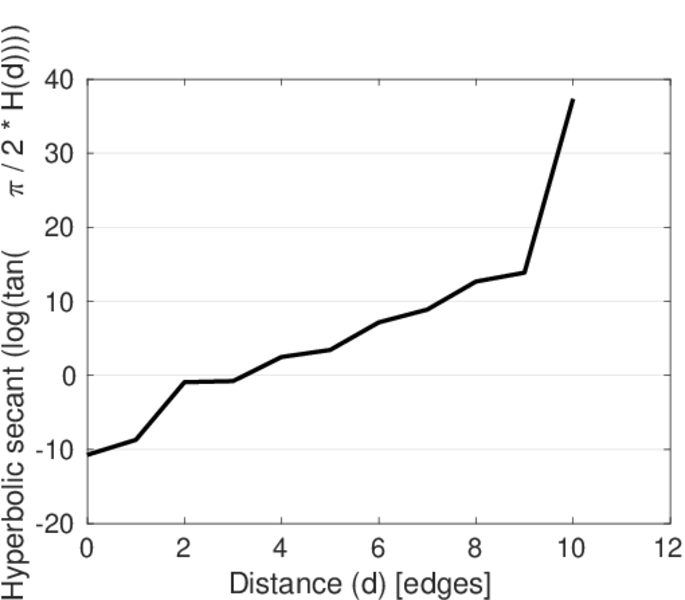
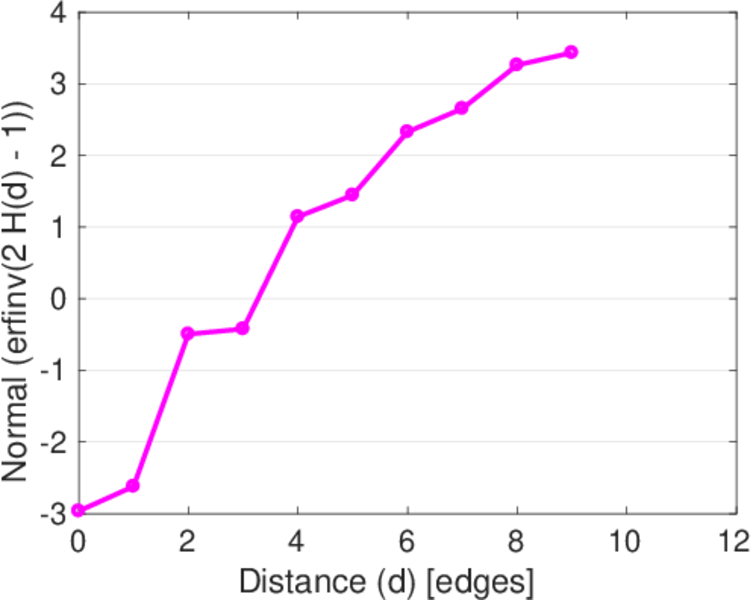
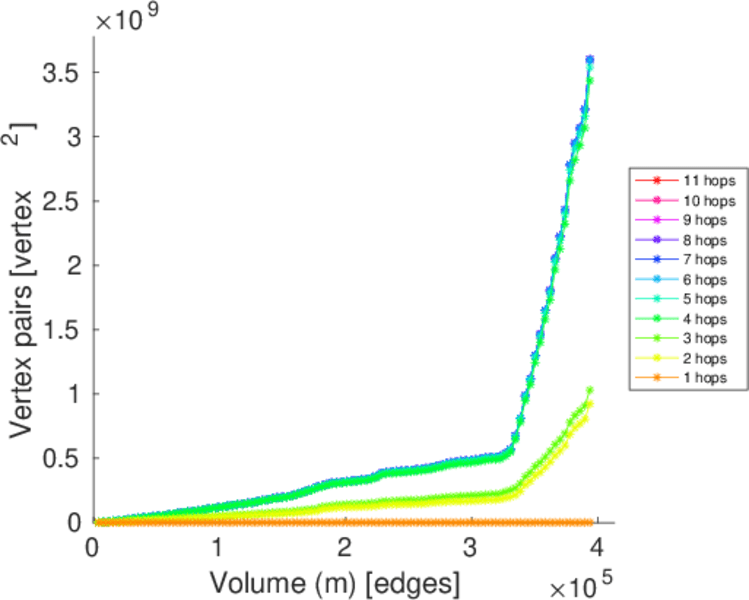
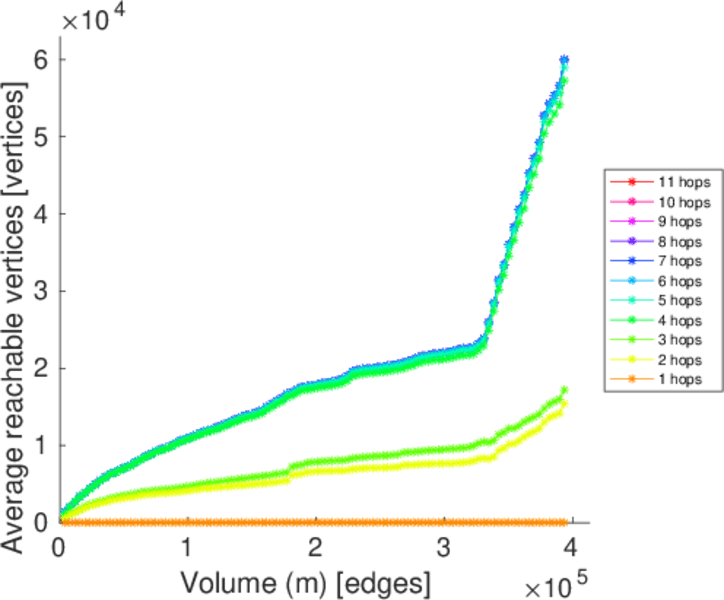
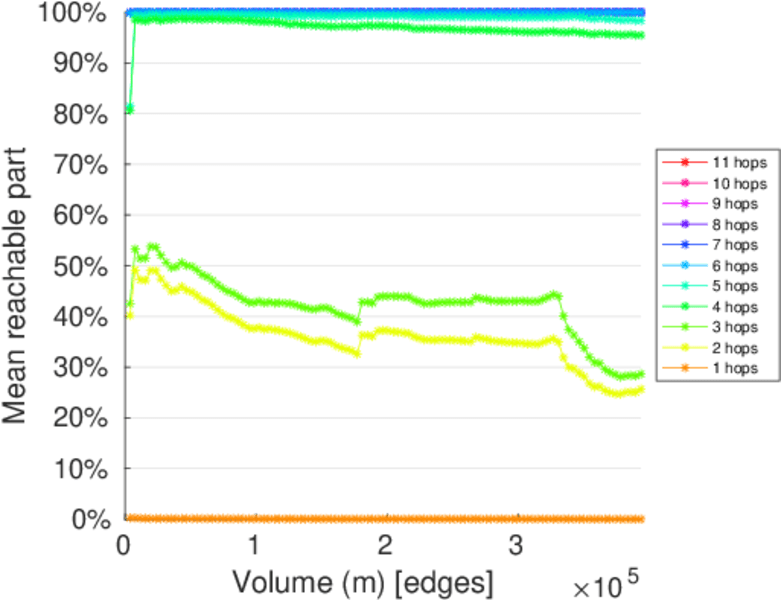
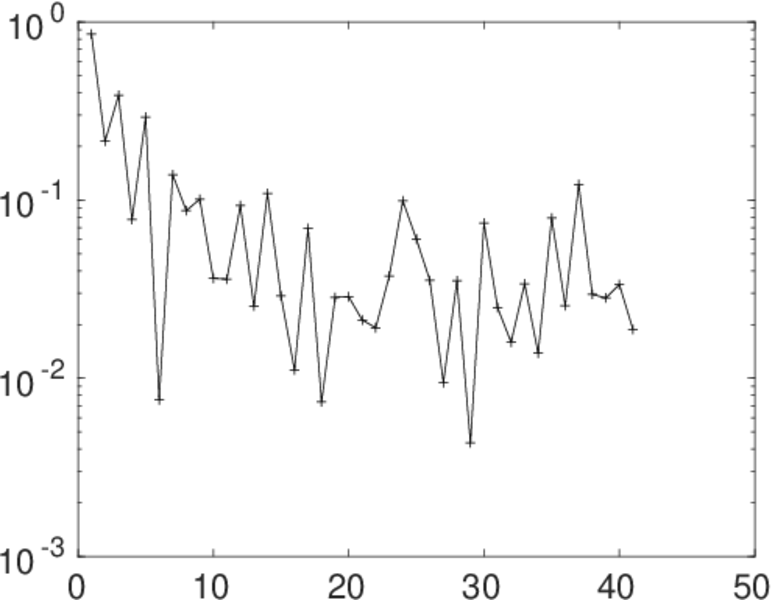
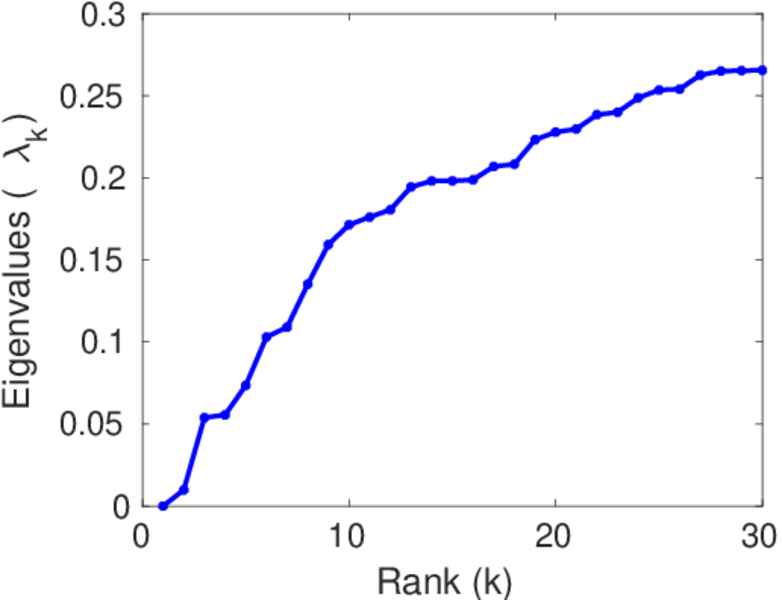
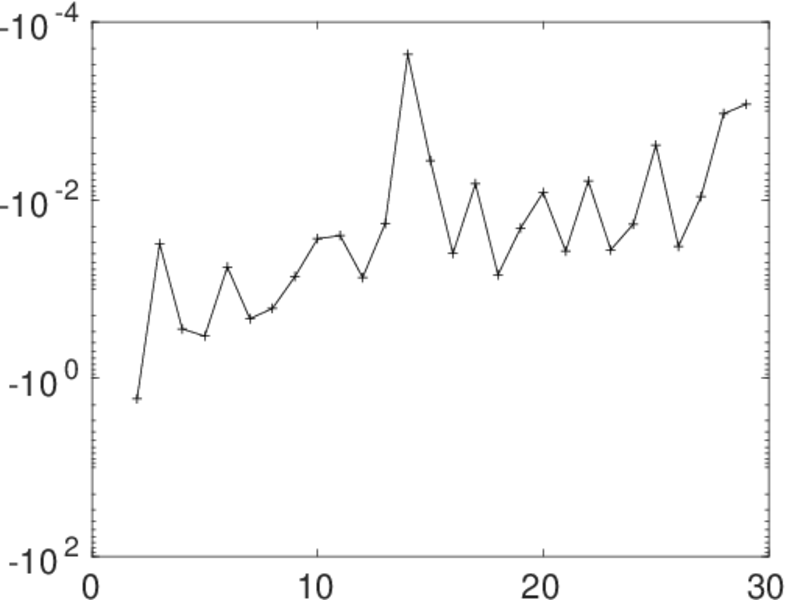
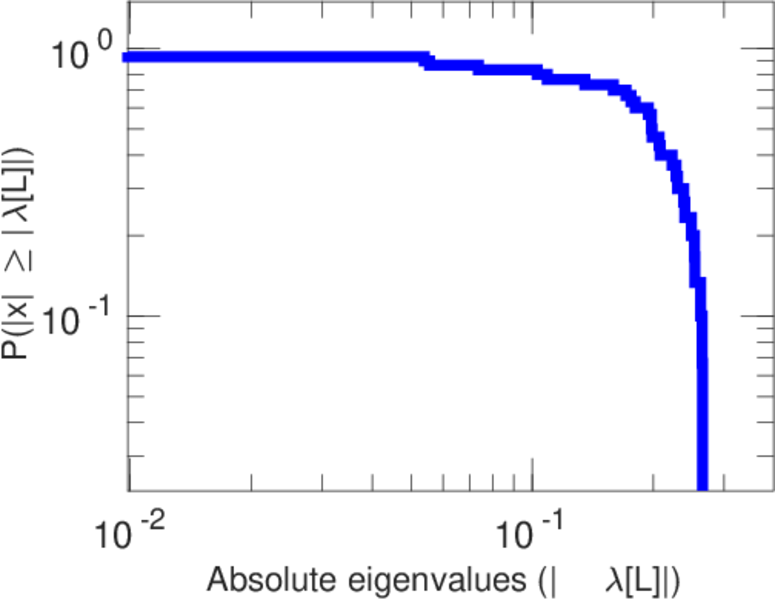
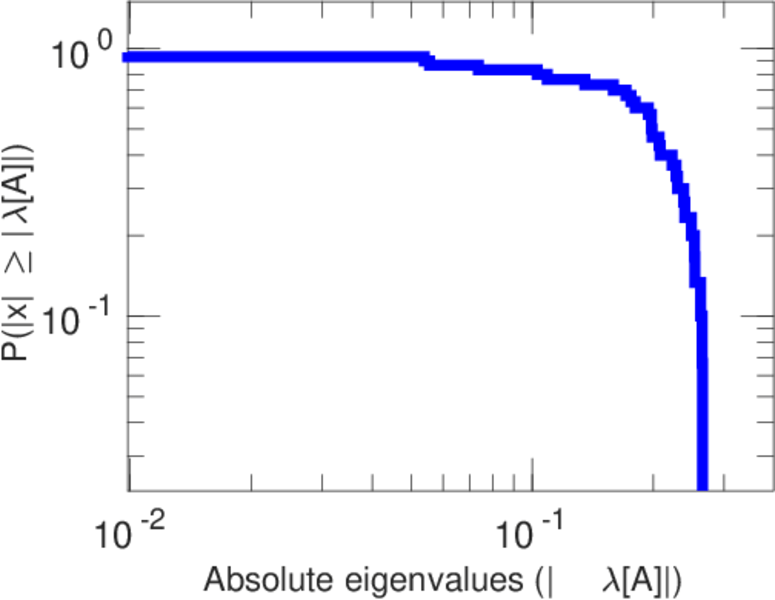
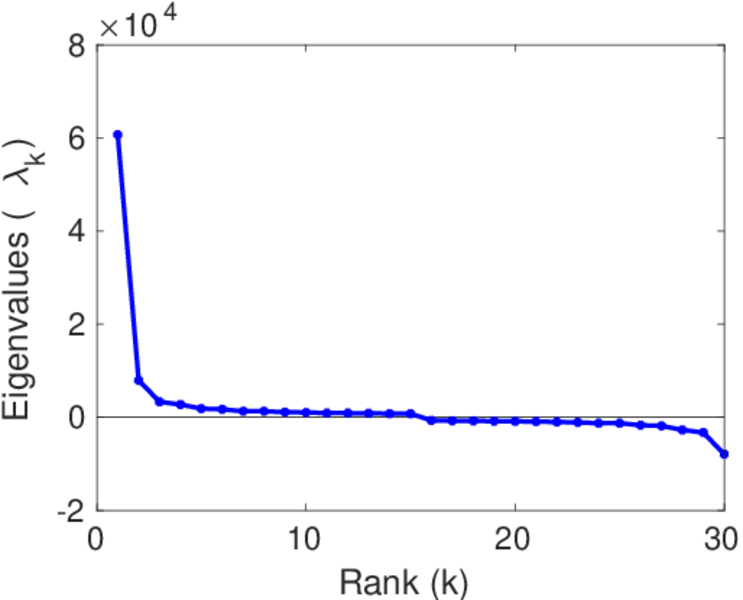
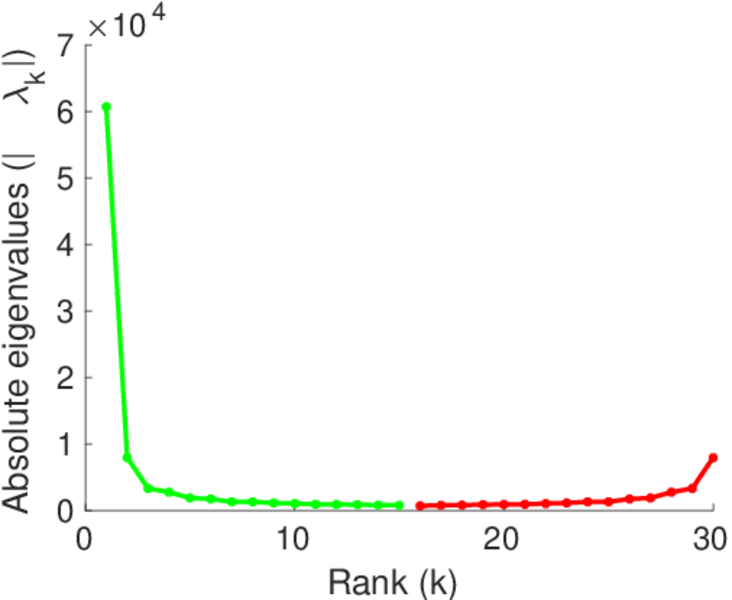
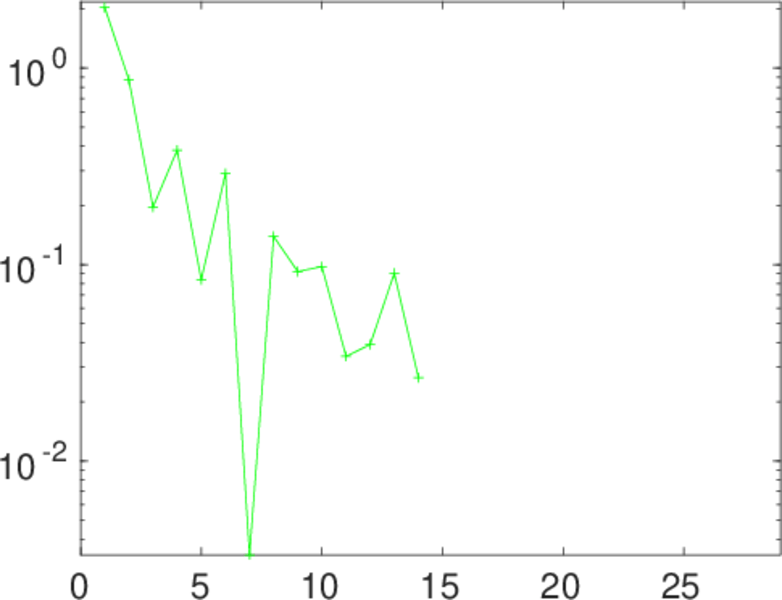
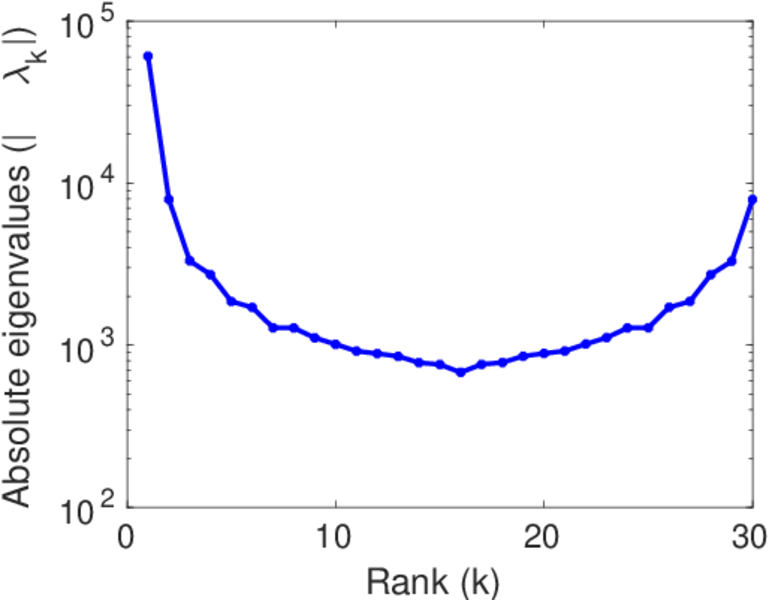
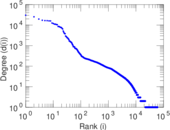
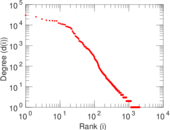
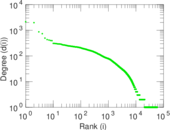
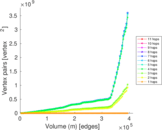
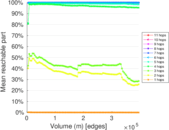
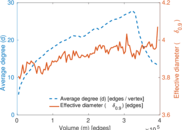
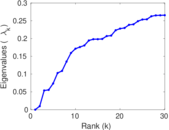
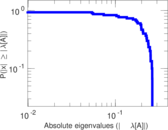
Plots


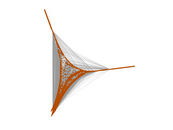

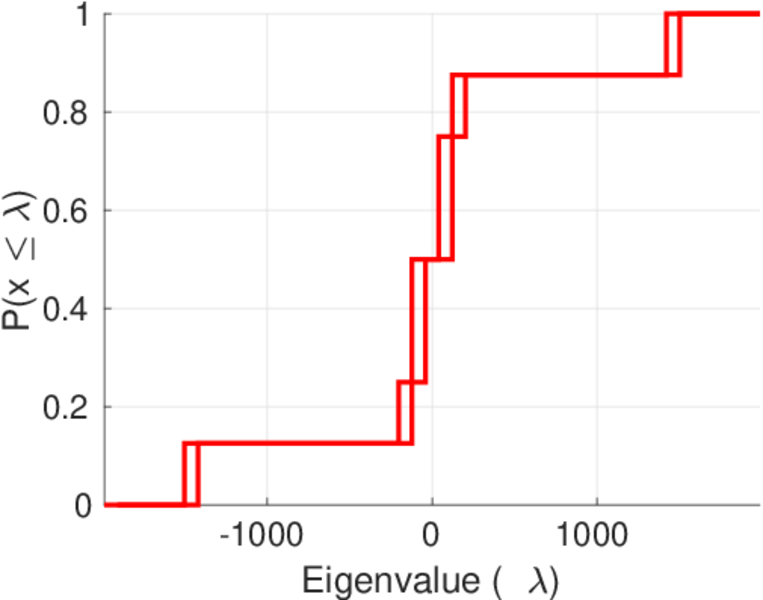
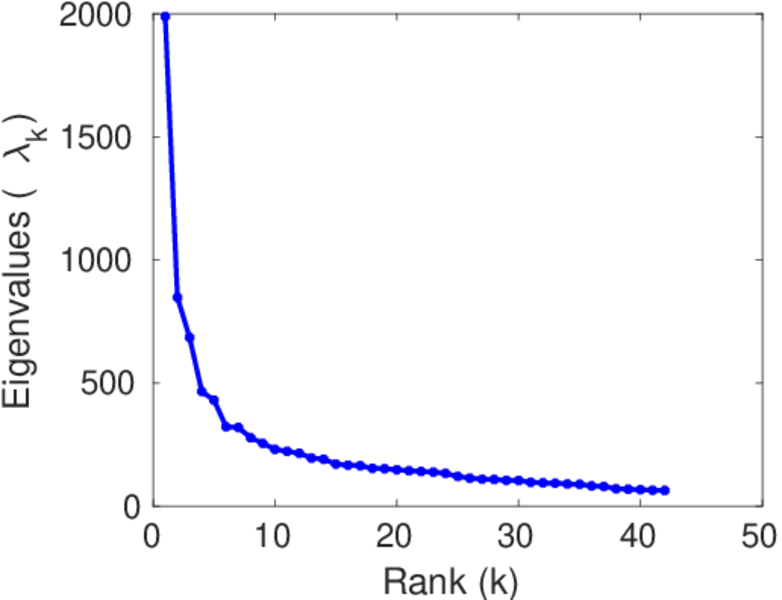
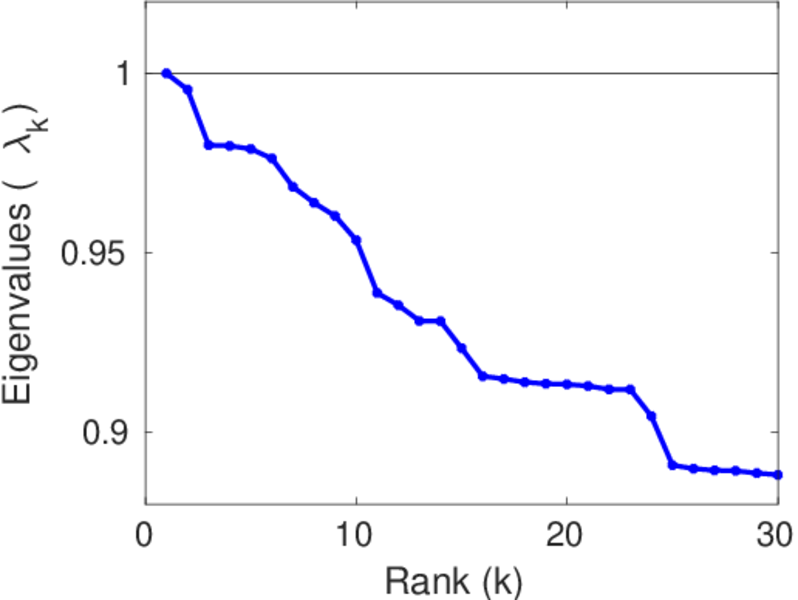
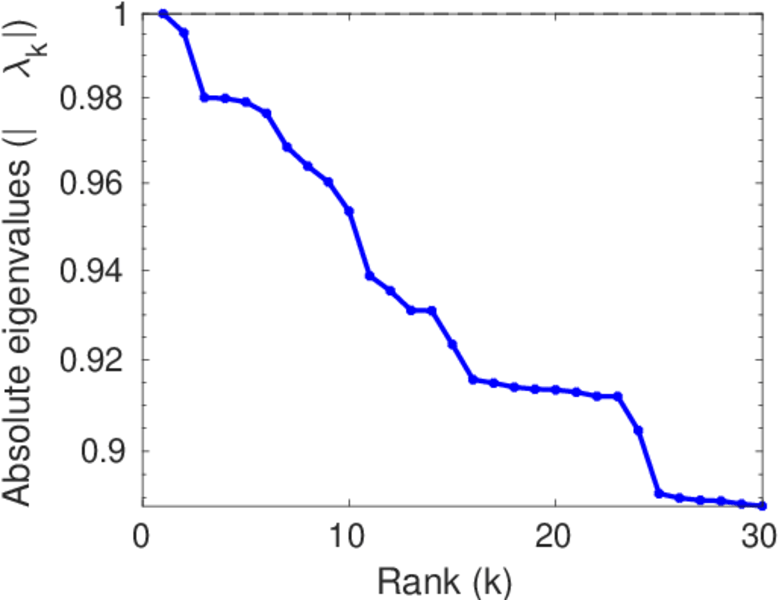
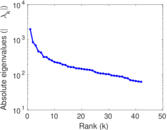
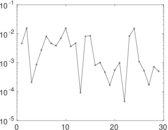
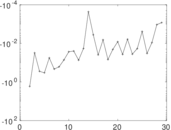
Matrix decompositions plots


Downloads
References
|
[1]
|
Jérôme Kunegis.
KONECT – The Koblenz Network Collection.
In Proc. Int. Conf. on World Wide Web Companion, pages
1343–1350, 2013.
[ http ]
|
|
[2]
|
Wikimedia Foundation.
Wikimedia downloads.
http://dumps.wikimedia.org/, January 2010.
|
 KONECT ‣ Networks ‣
Buy Me a Coffee
KONECT ‣ Networks ‣
Buy Me a Coffee