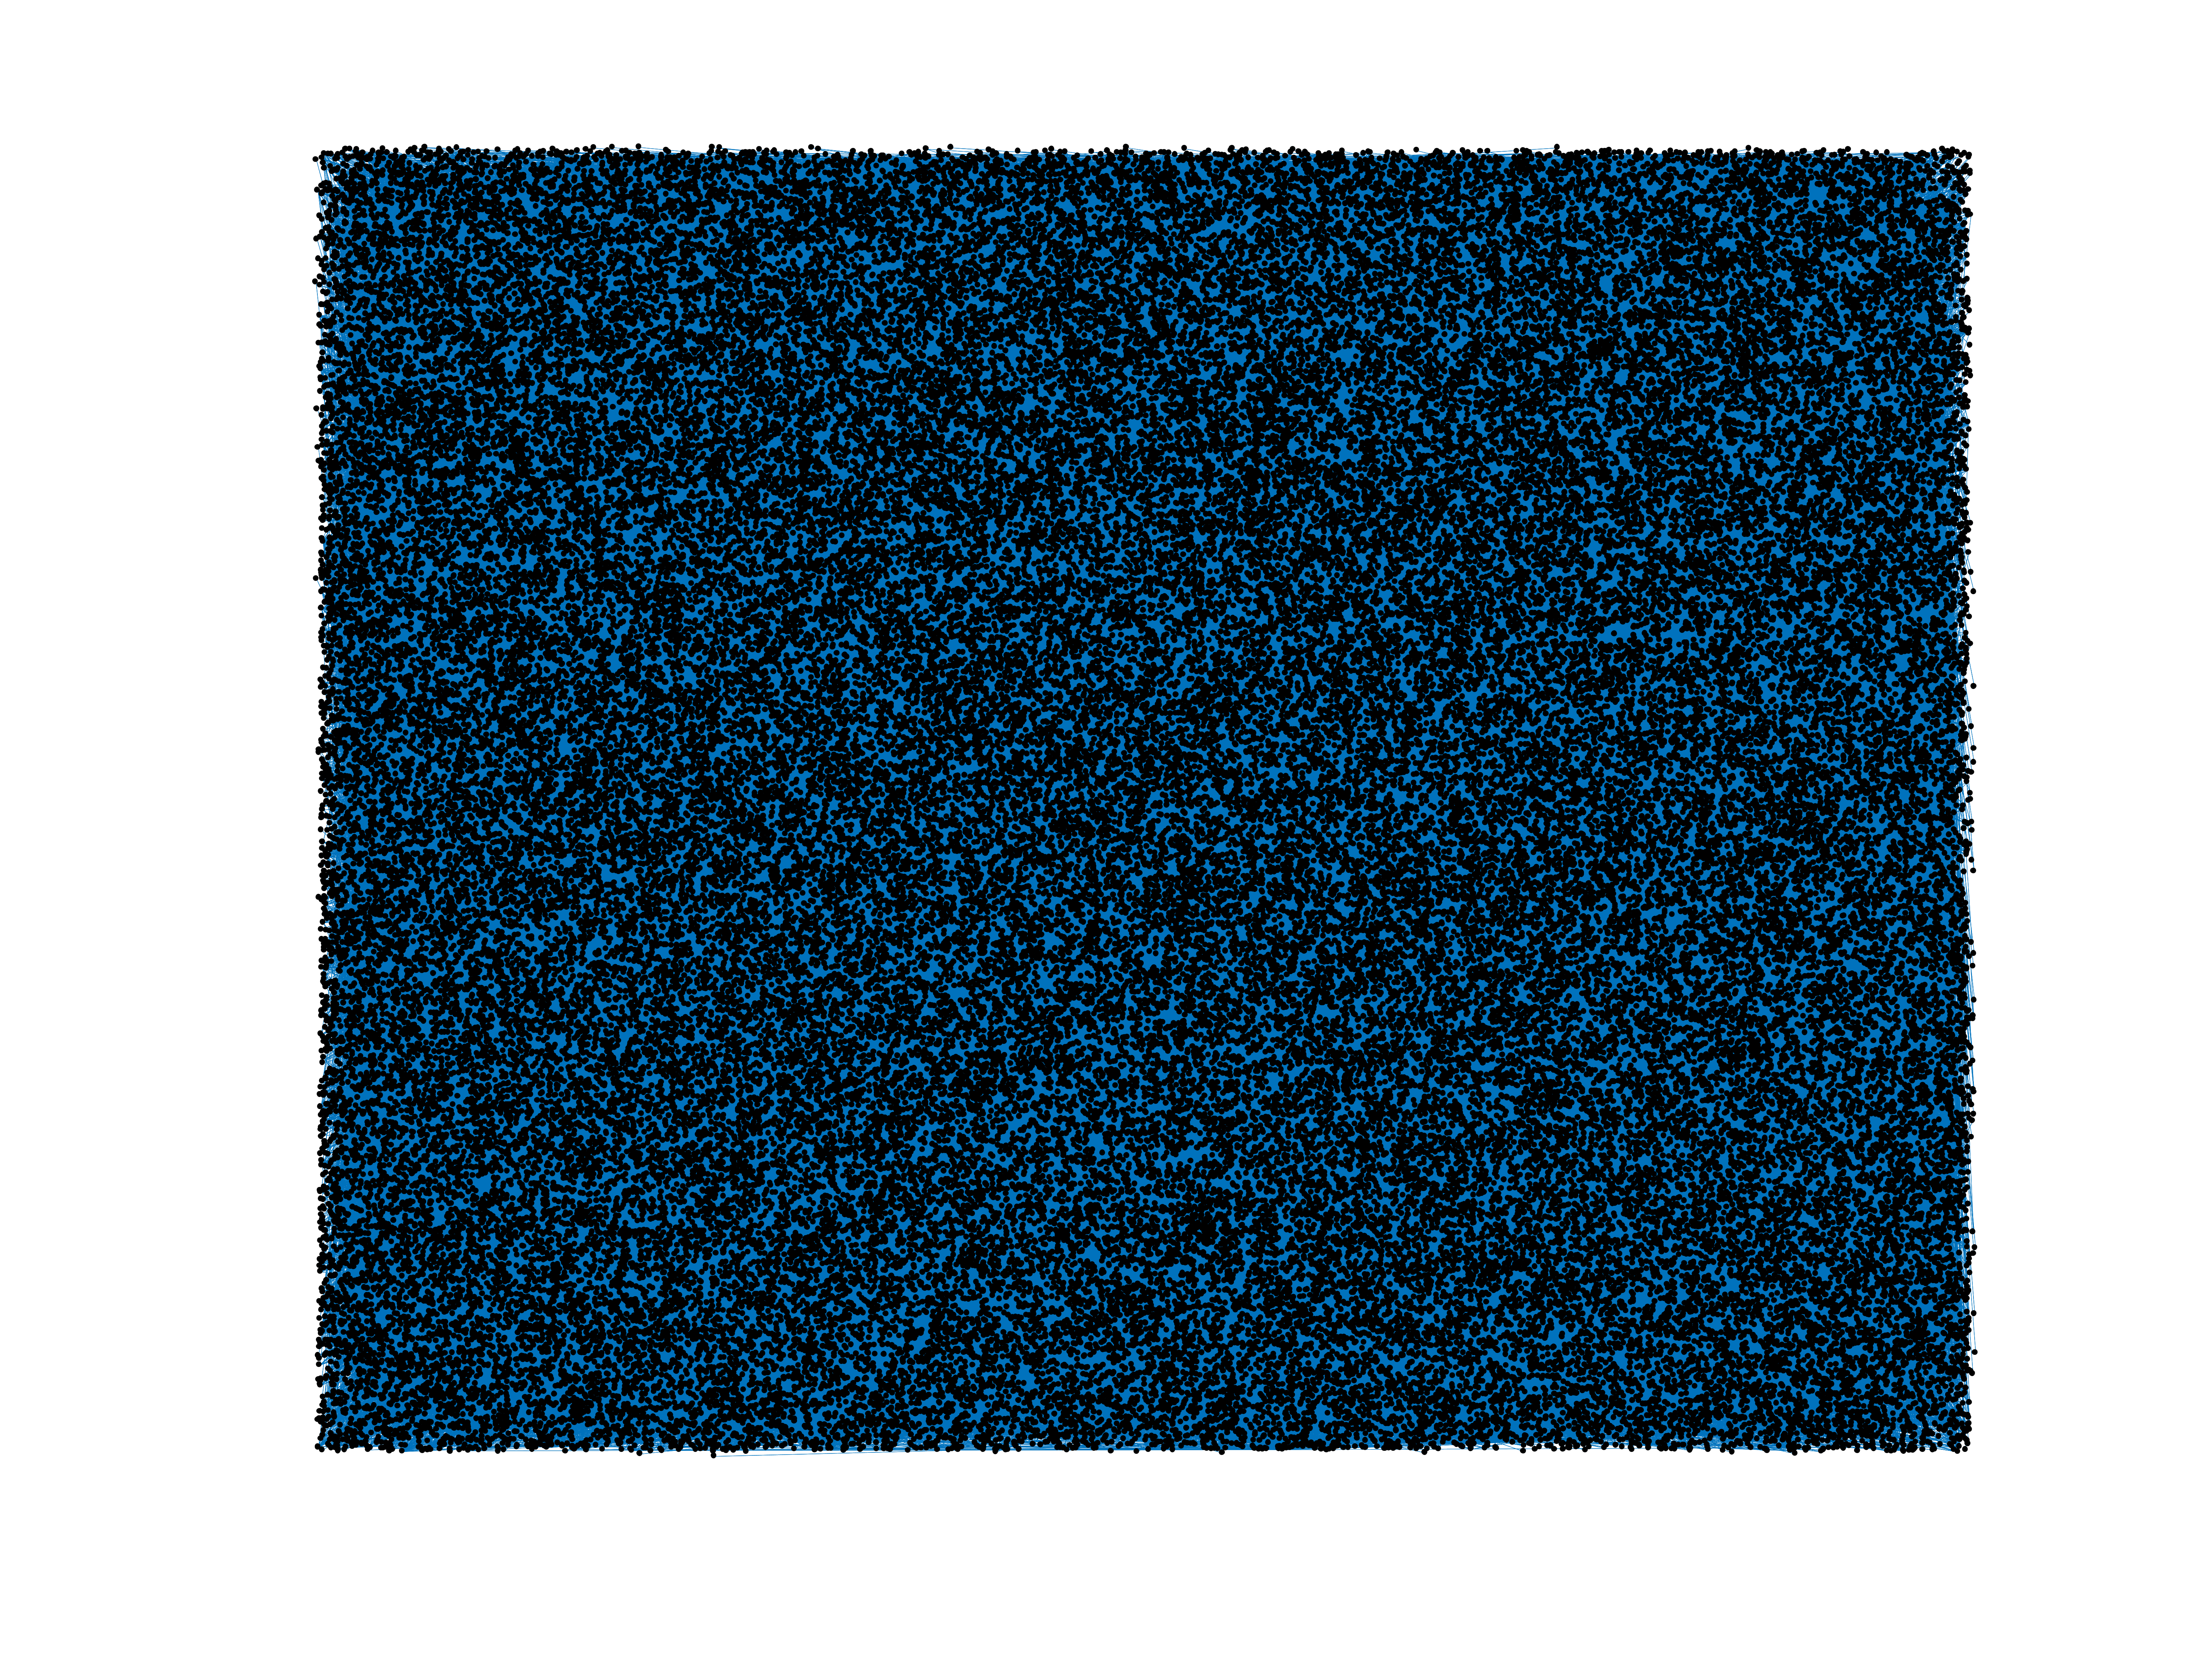
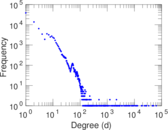
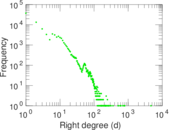
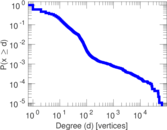
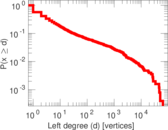
Wikipedia edits (lmo)
This is the bipartite edit network of the Lombard Wikipedia. It contains users
and pages from the Lombard Wikipedia, connected by edit events. Each edge
represents an edit. The dataset includes the timestamp of each edit.
Metadata
Statistics
| Size | n = | 96,949
|
| Left size | n1 = | 2,521
|
| Right size | n2 = | 94,428
|
| Volume | m = | 691,256
|
| Unique edge count | m̿ = | 384,275
|
| Wedge count | s = | 2,530,413,445
|
| Claw count | z = | 18,670,693,670,171
|
| Cross count | x = | 120,740,043,425,763,952
|
| Square count | q = | 2,968,543,994
|
| 4-Tour count | T4 = | 33,870,795,918
|
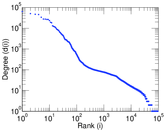
| Maximum degree | dmax = | 63,618
|
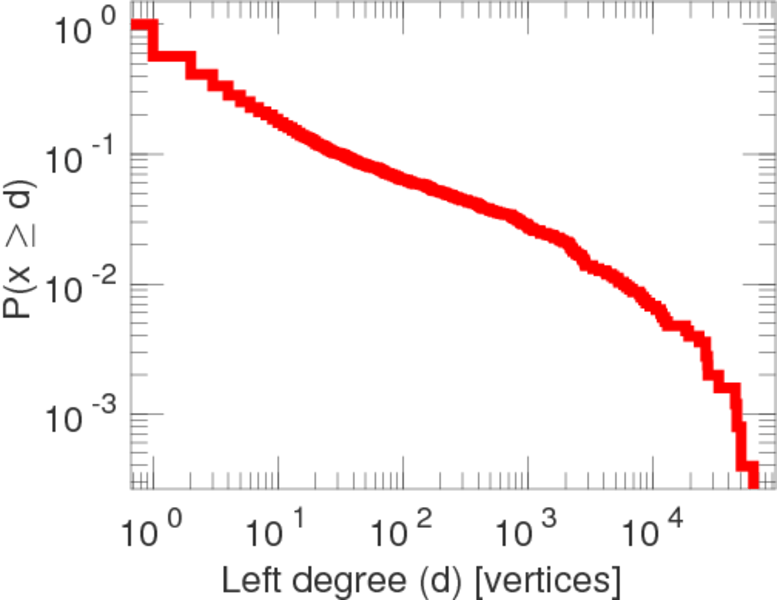
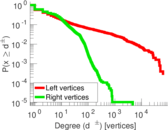
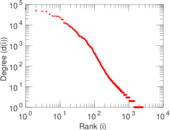
| Maximum left degree | d1max = | 63,618
|
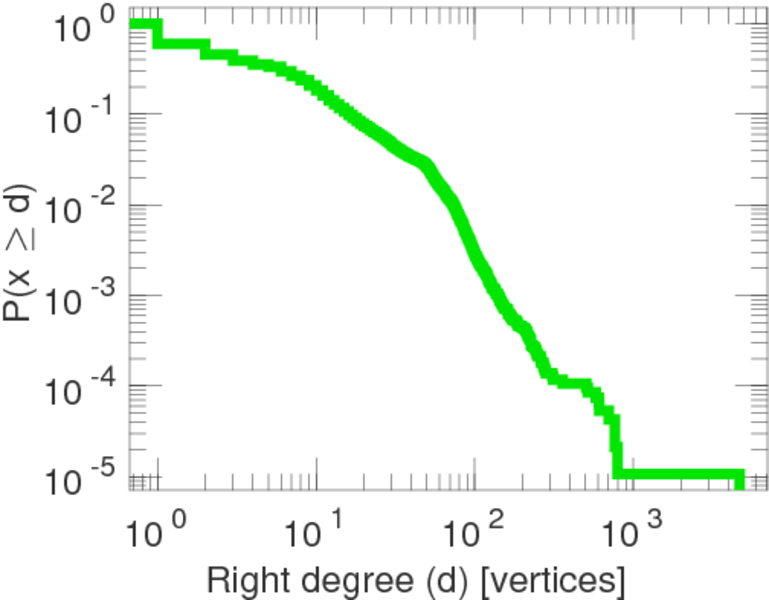
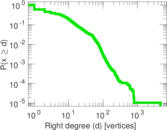
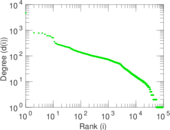
| Maximum right degree | d2max = | 4,694
|
| Average degree | d = | 14.260 2
|
| Average left degree | d1 = | 274.199
|
| Average right degree | d2 = | 7.320 46
|
| Fill | p = | 0.001 614 24
|
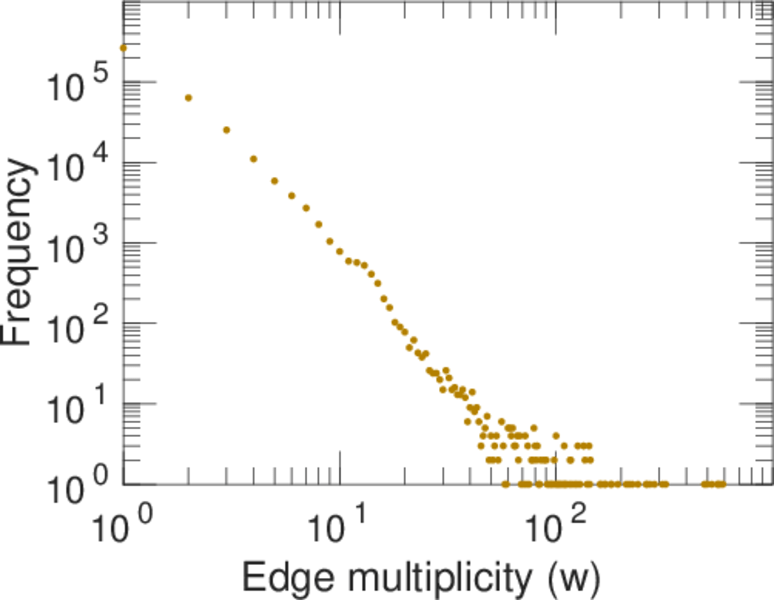
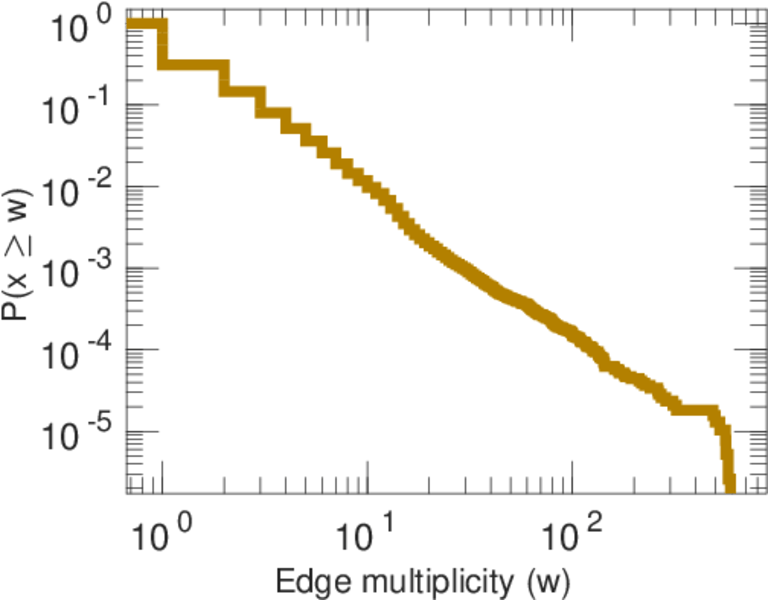
| Average edge multiplicity | m̃ = | 1.798 86
|
| Size of LCC | N = | 95,504
|
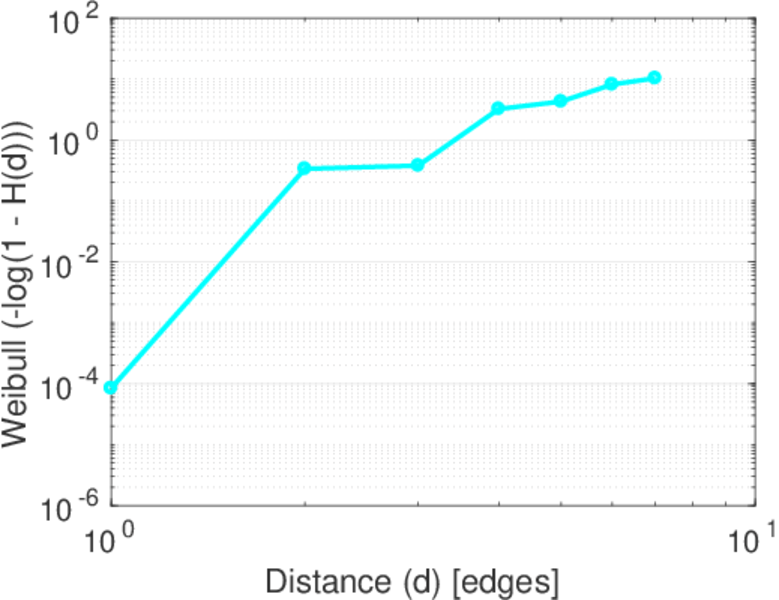
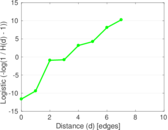
| Diameter | δ = | 11
|
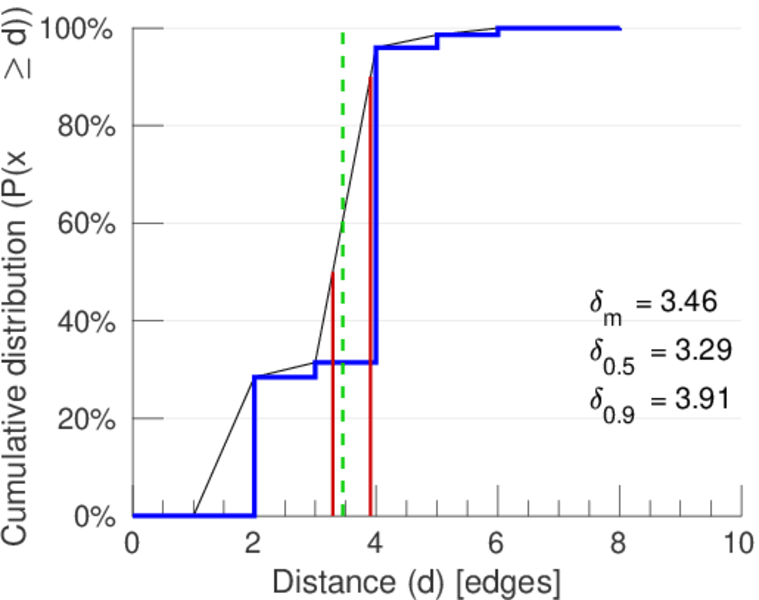
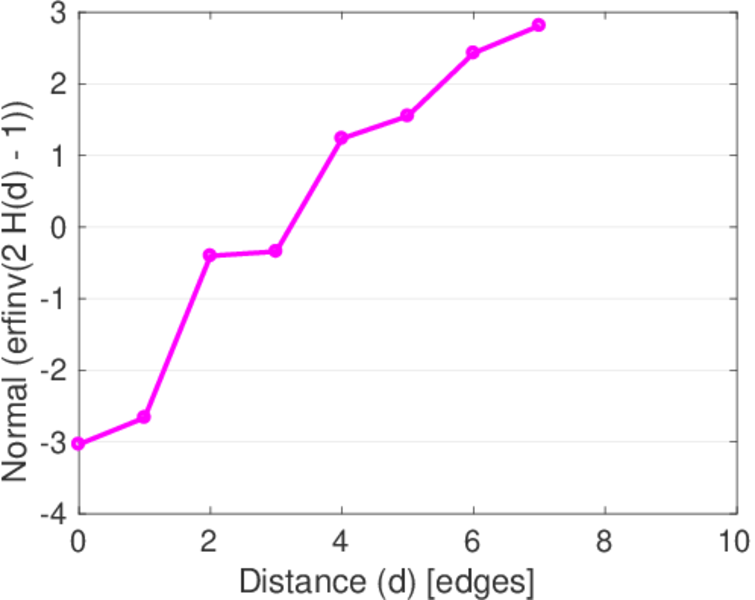
| 50-Percentile effective diameter | δ0.5 = | 3.287 48
|
| 90-Percentile effective diameter | δ0.9 = | 3.907 50
|
| Median distance | δM = | 4
|
| Mean distance | δm = | 3.455 92
|
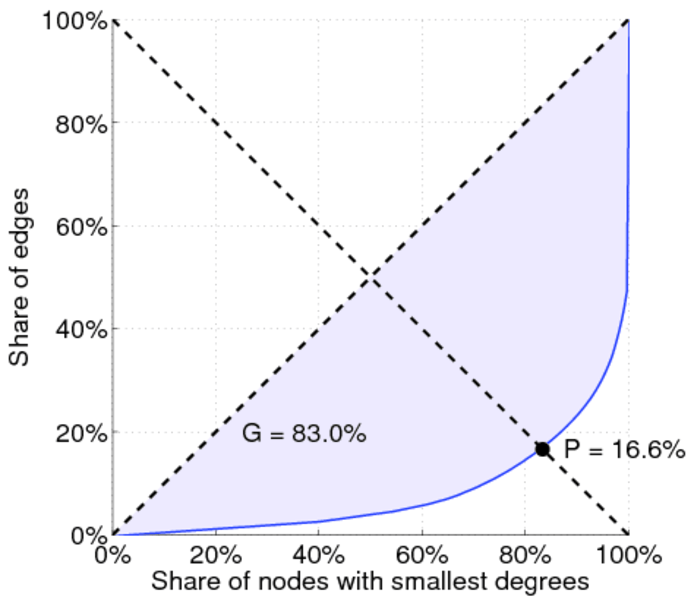
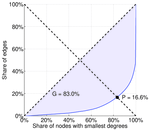
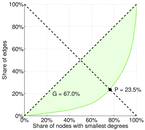
| Gini coefficient | G = | 0.831 631
|
| Balanced inequality ratio | P = | 0.169 127
|
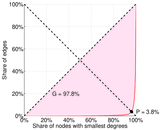
| Left balanced inequality ratio | P1 = | 0.037 991 7
|
| Right balanced inequality ratio | P2 = | 0.235 348
|
| Relative edge distribution entropy | Her = | 0.710 082
|
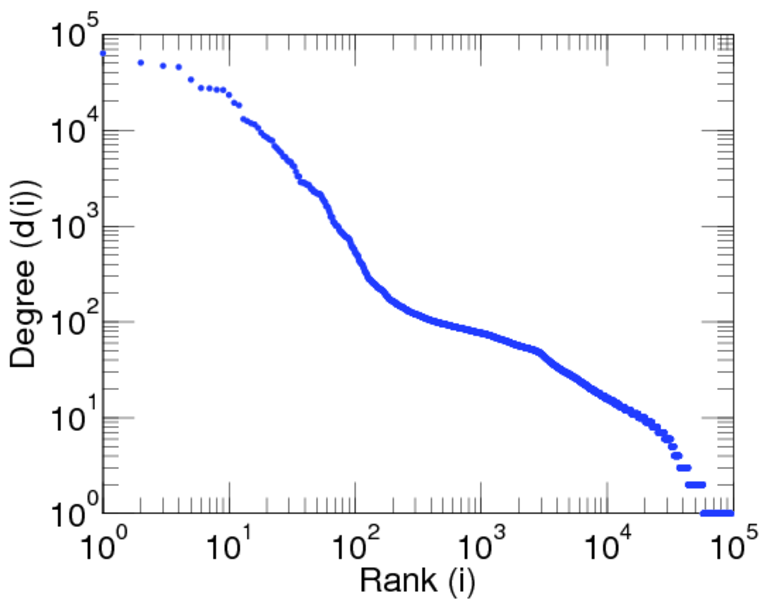
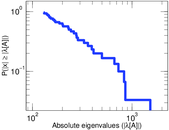
| Power law exponent | γ = | 2.197 45
|
| Tail power law exponent | γt = | 2.761 00
|
| Tail power law exponent with p | γ3 = | 2.761 00
|
| p-value | p = | 0.000 00
|
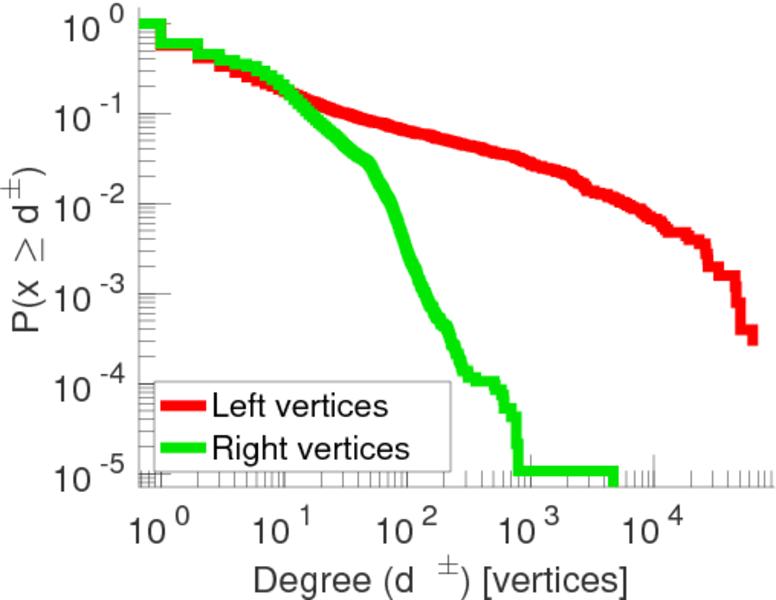
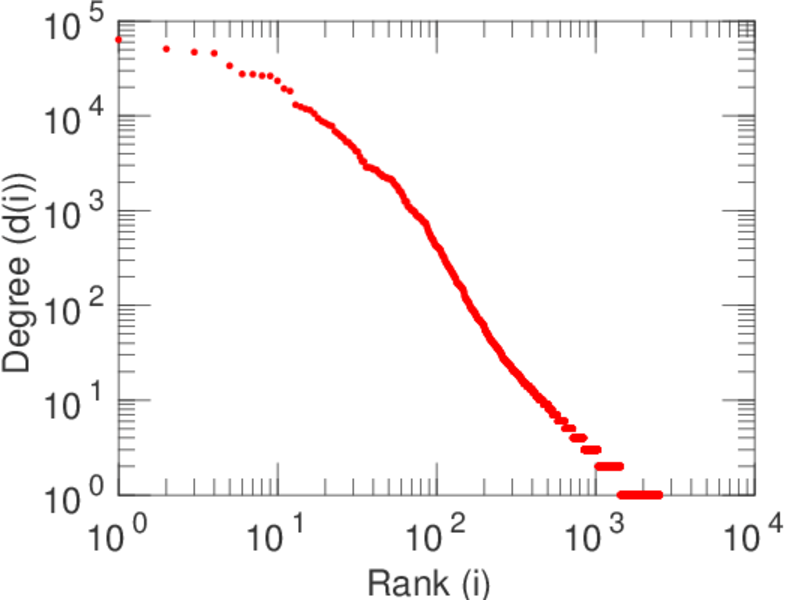
| Left tail power law exponent with p | γ3,1 = | 1.681 00
|
| Left p-value | p1 = | 0.000 00
|
| Right tail power law exponent with p | γ3,2 = | 2.901 00
|
| Right p-value | p2 = | 0.000 00
|
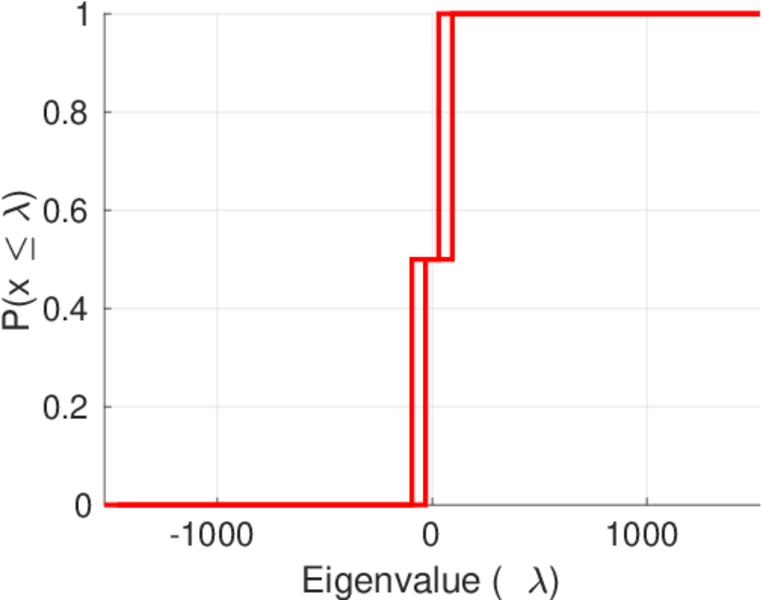
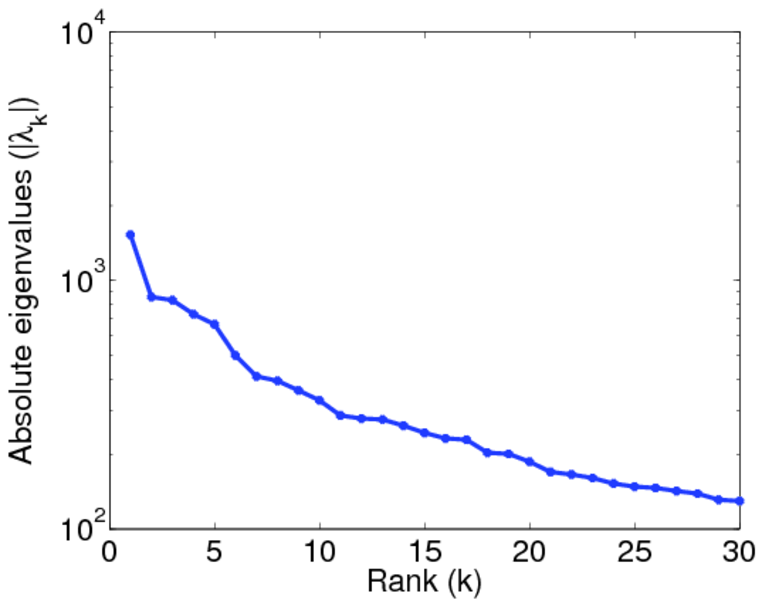
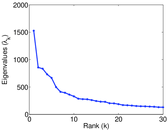
| Spectral norm | α = | 1,526.46
|
| Algebraic connectivity | a = | 0.033 720 2
|
| Controllability | C = | 91,703
|
| Relative controllability | Cr = | 0.953 125
|
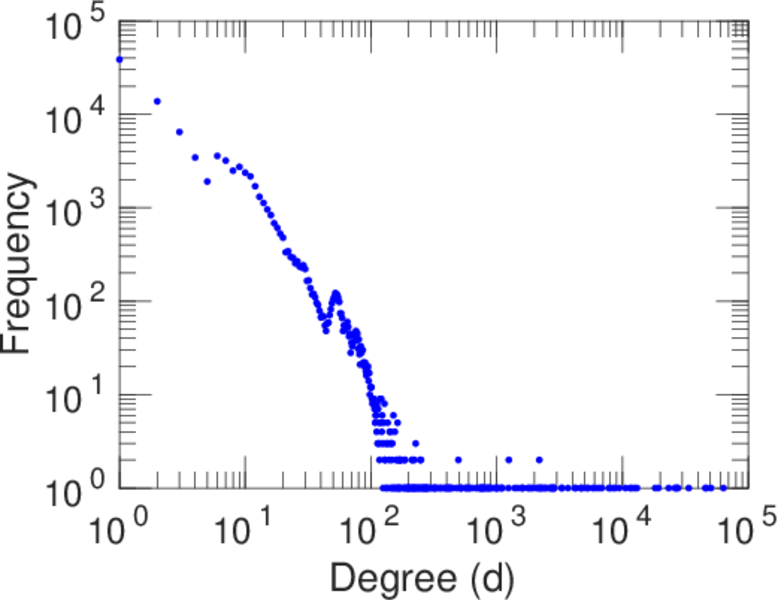
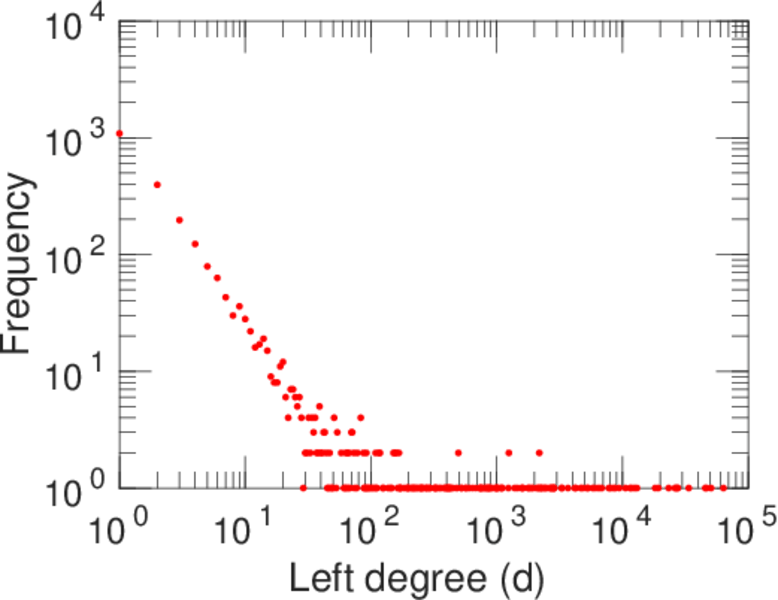
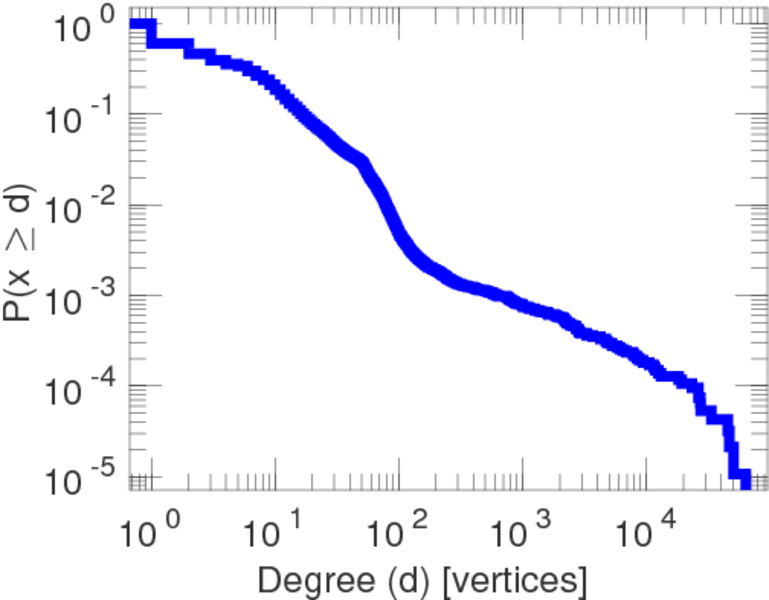
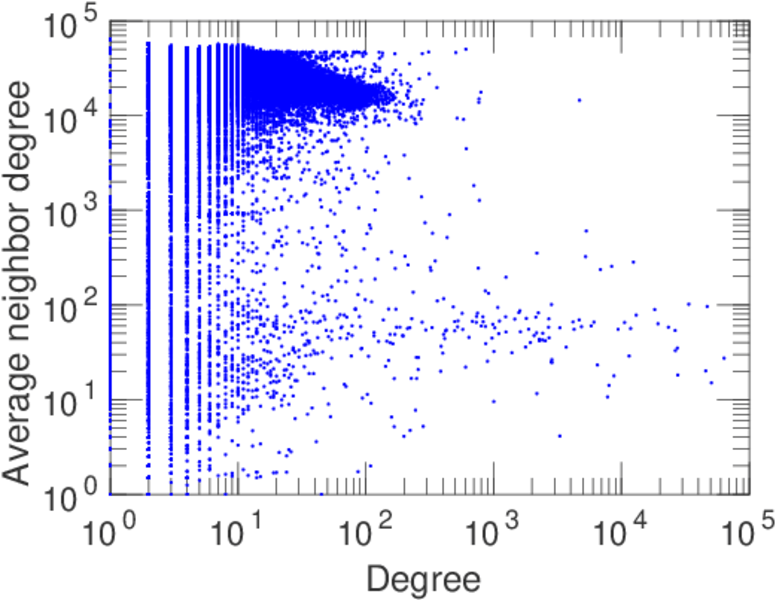
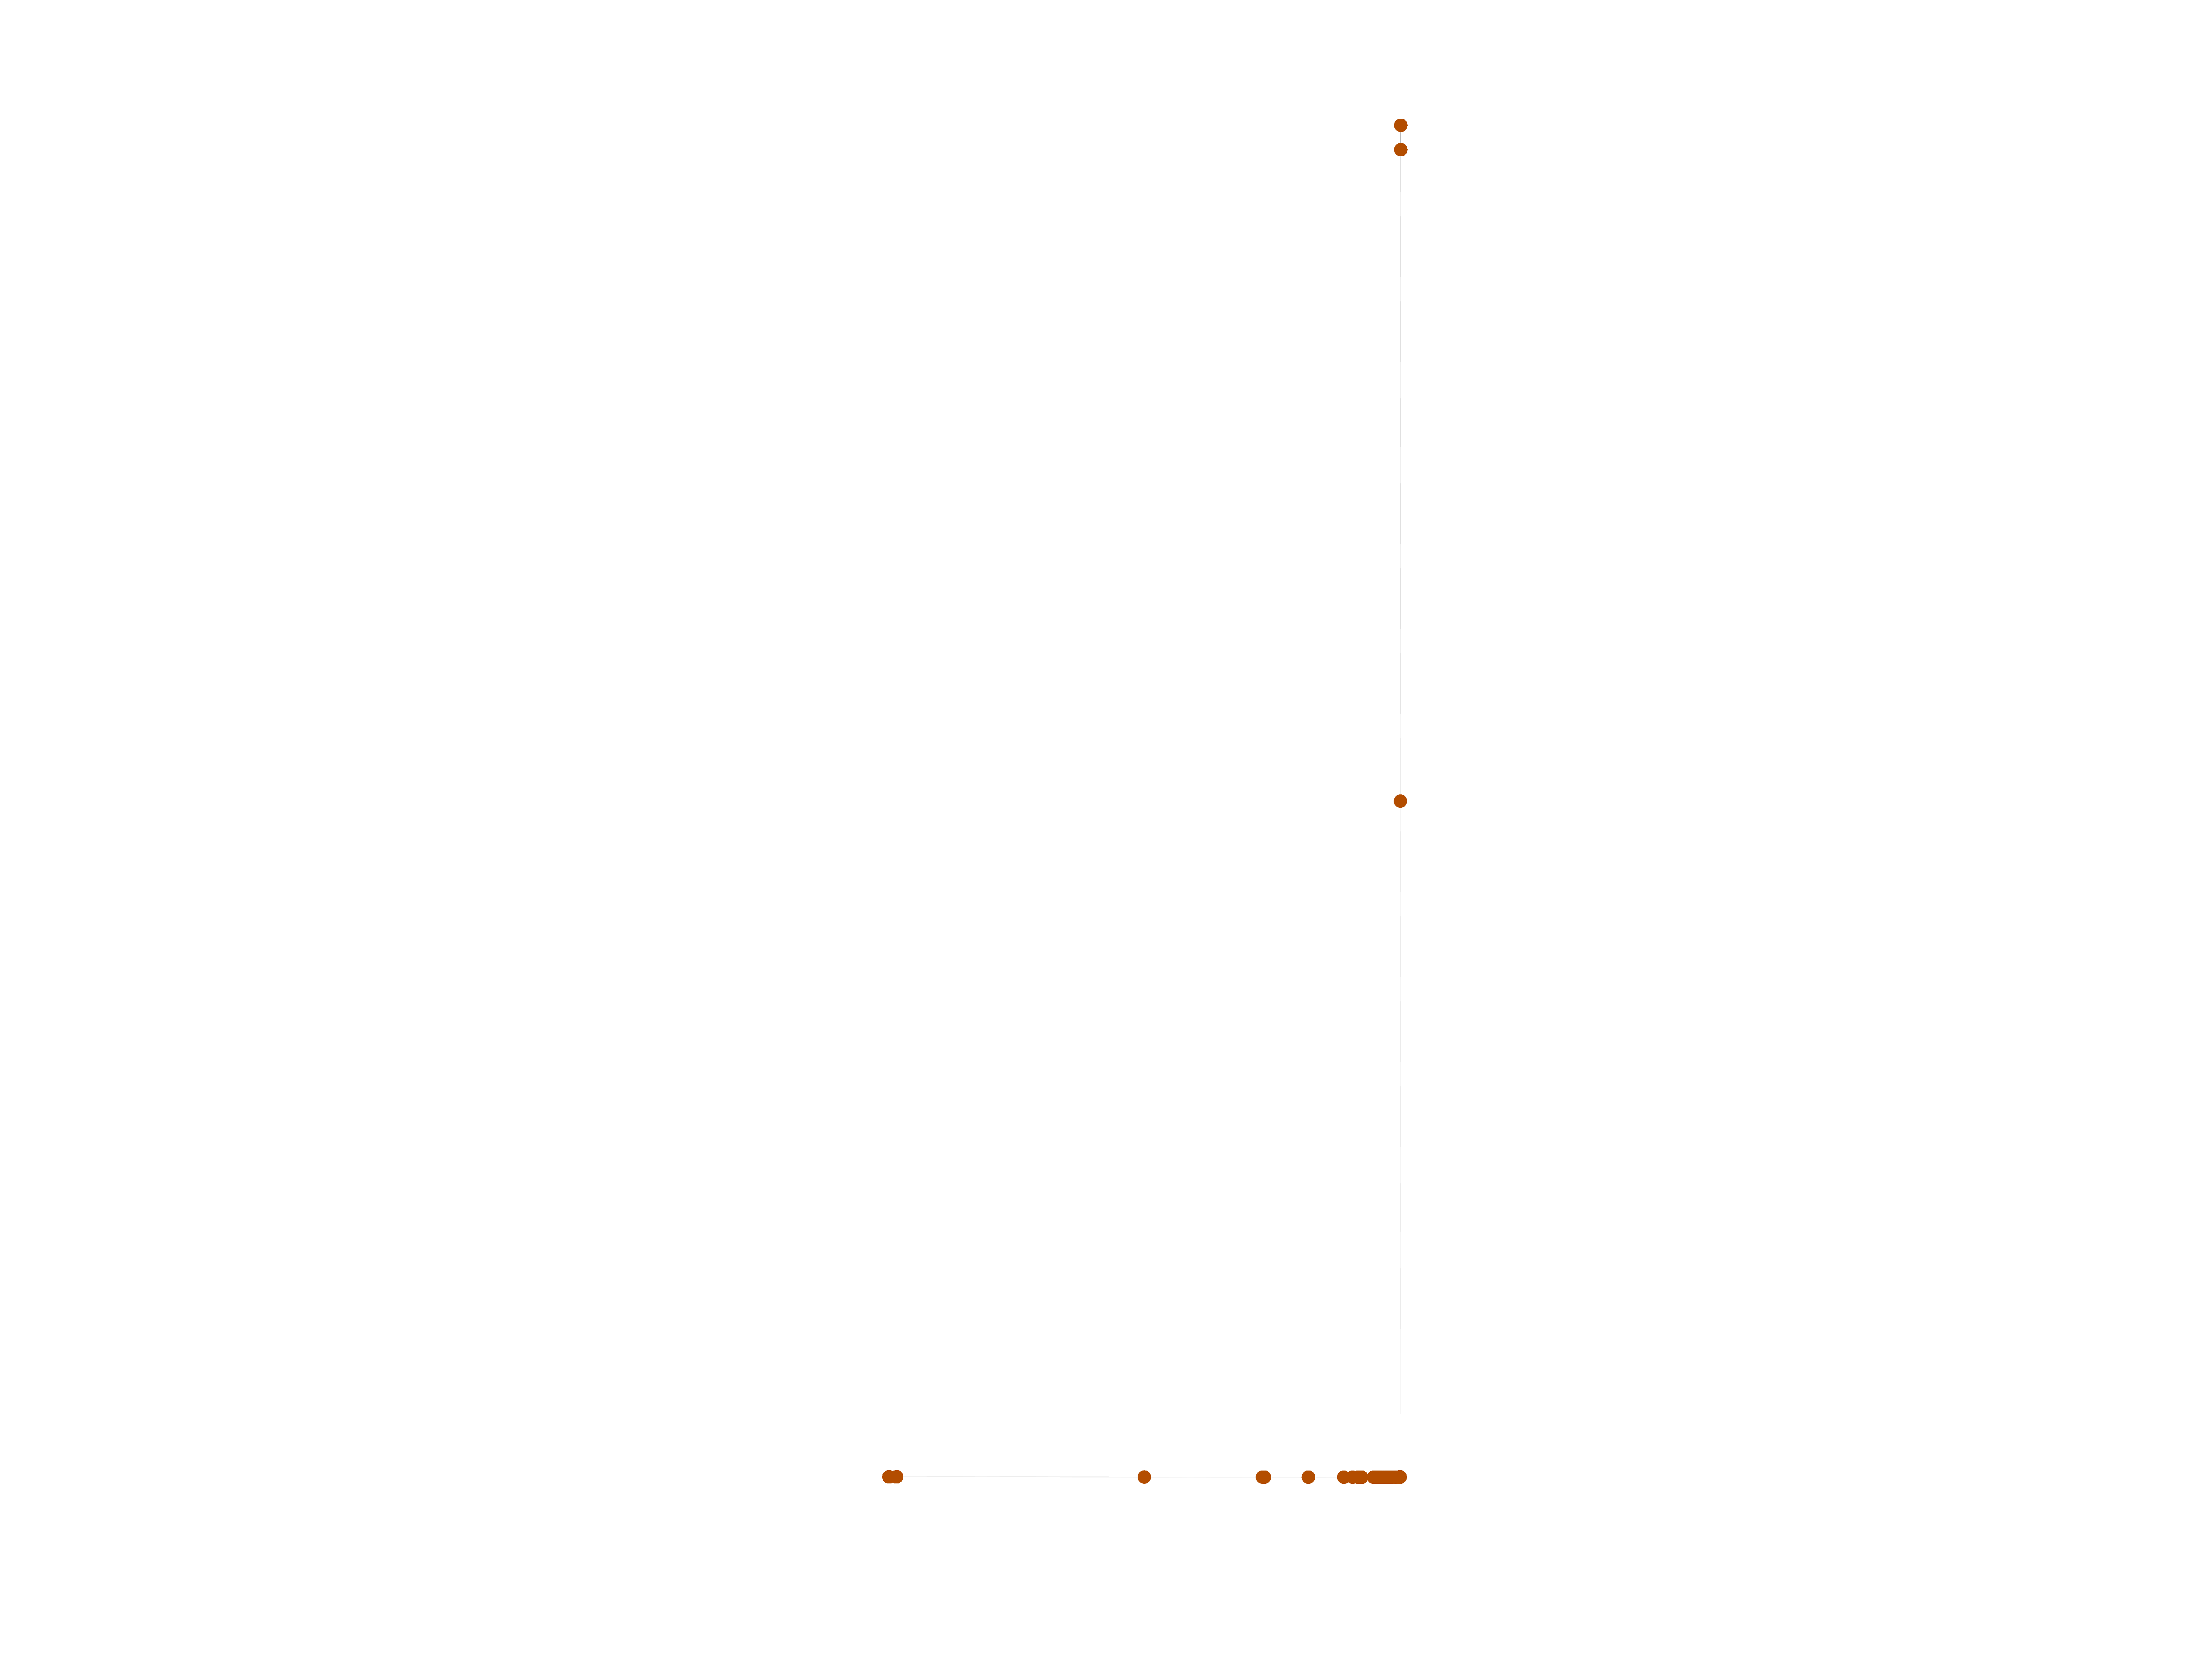
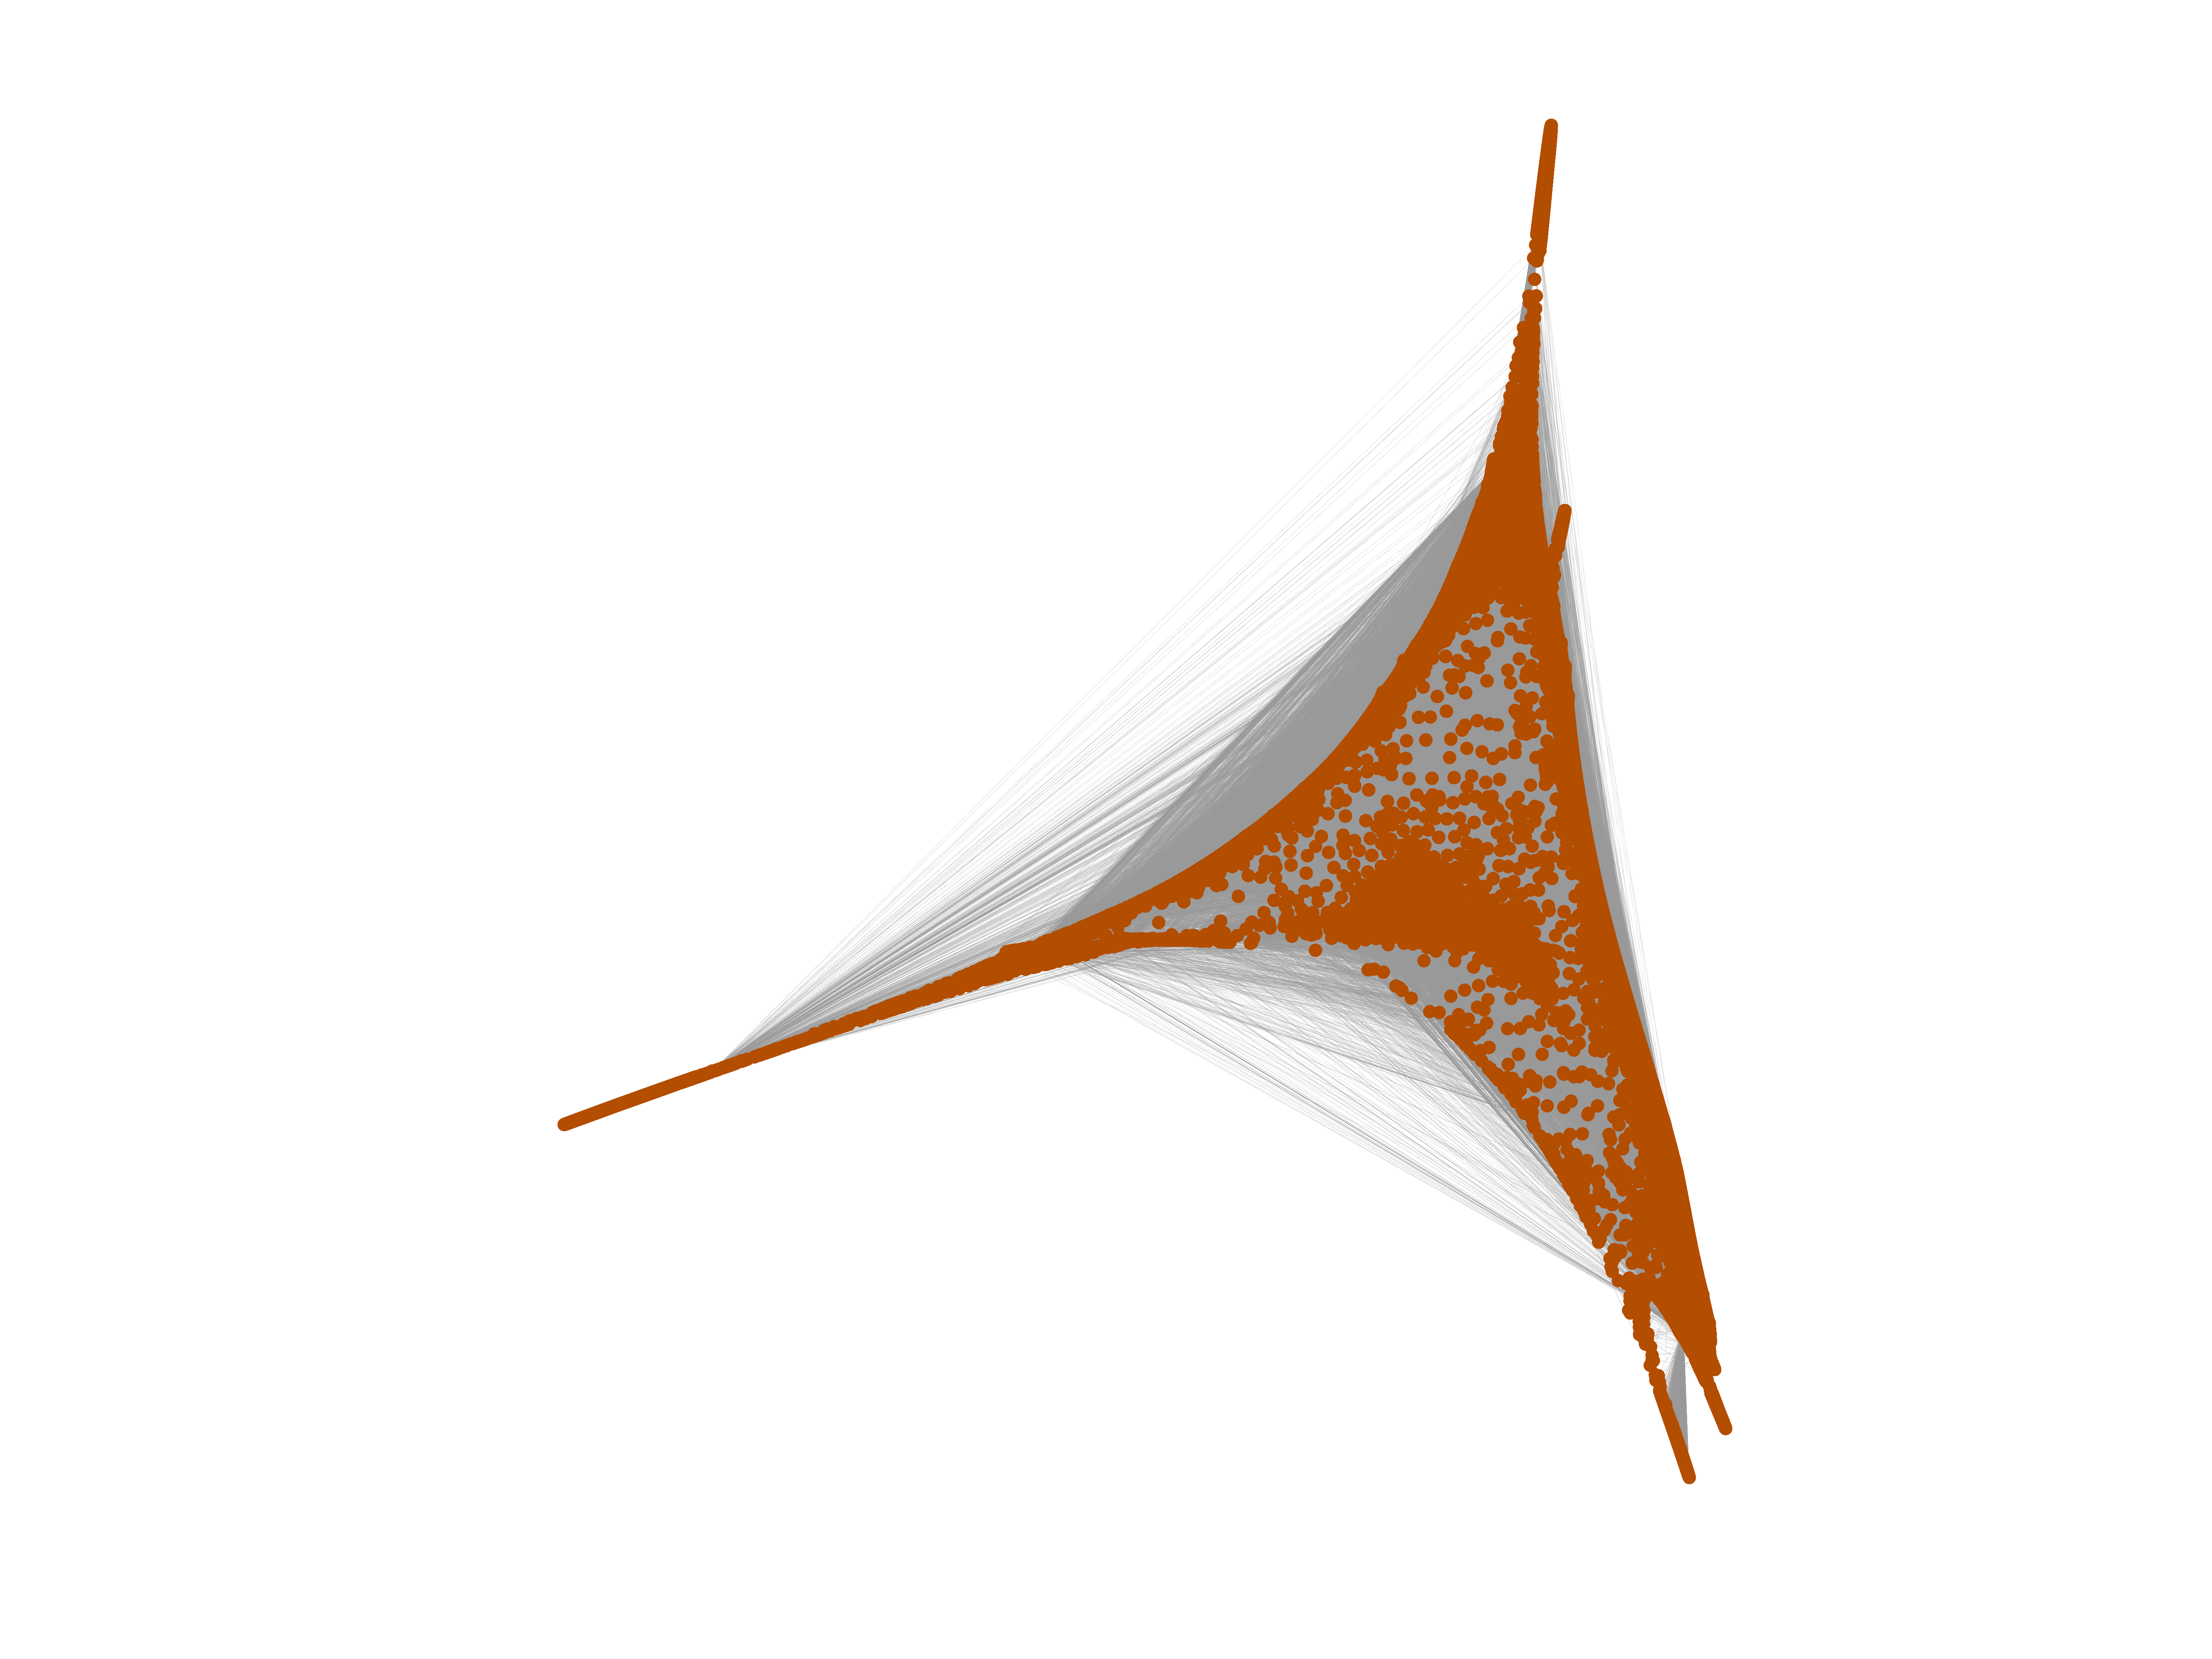
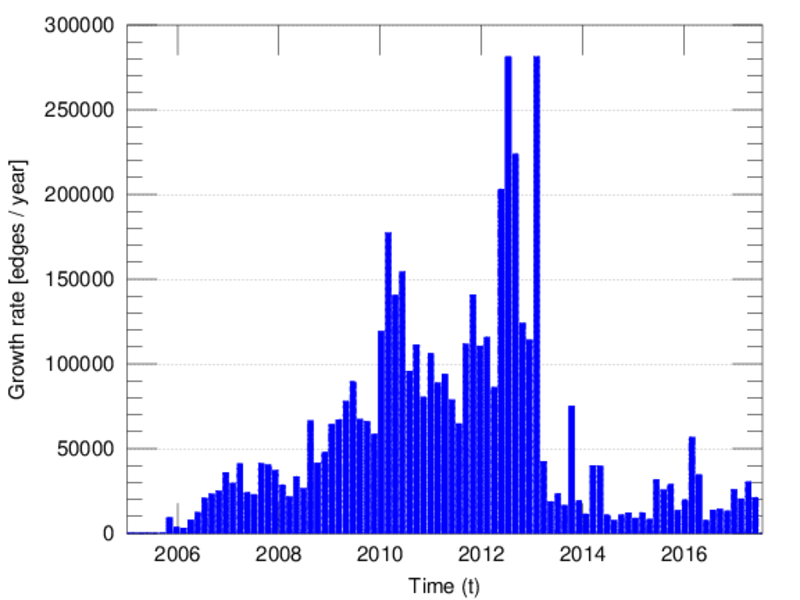
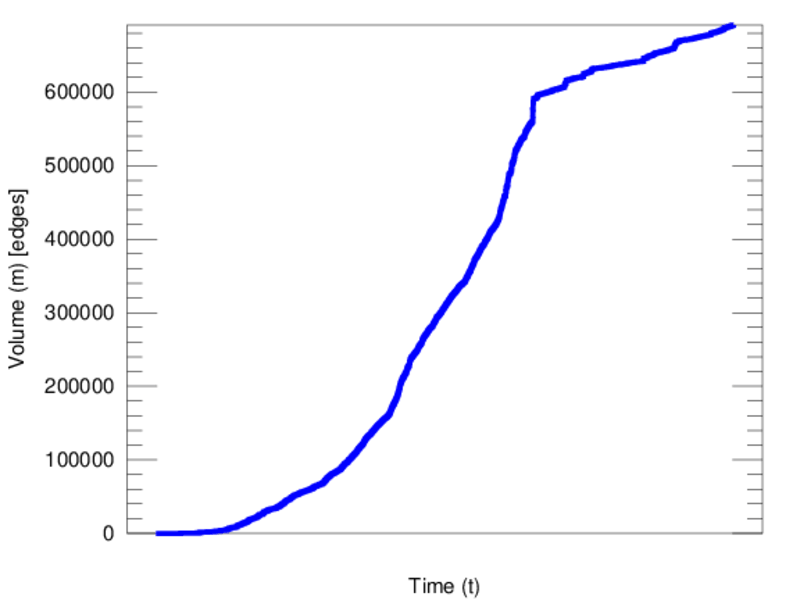
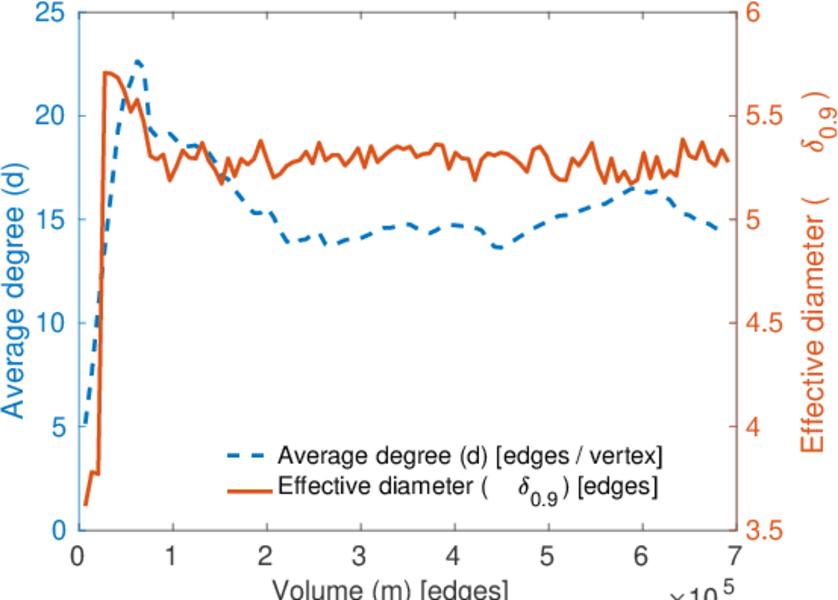
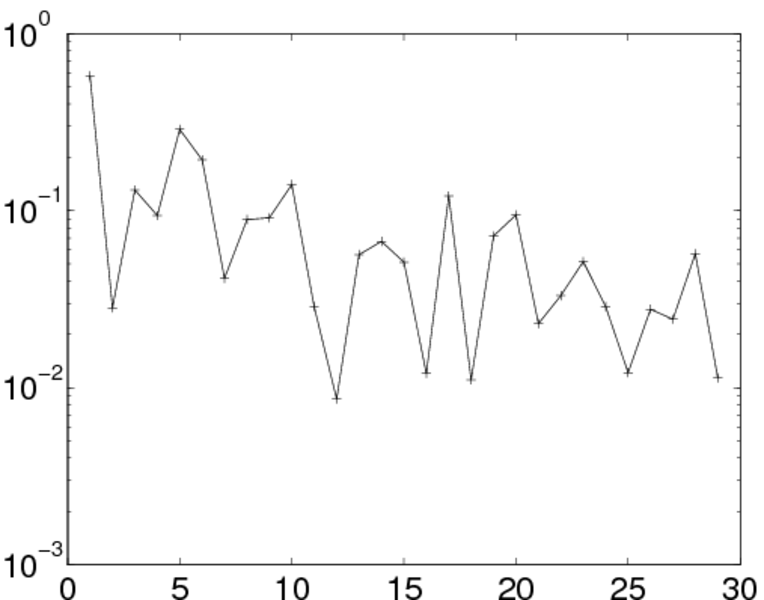
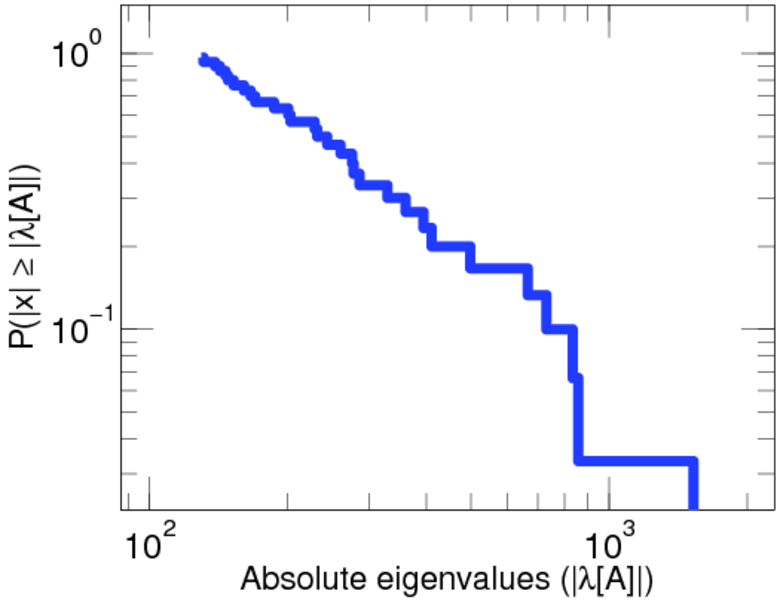
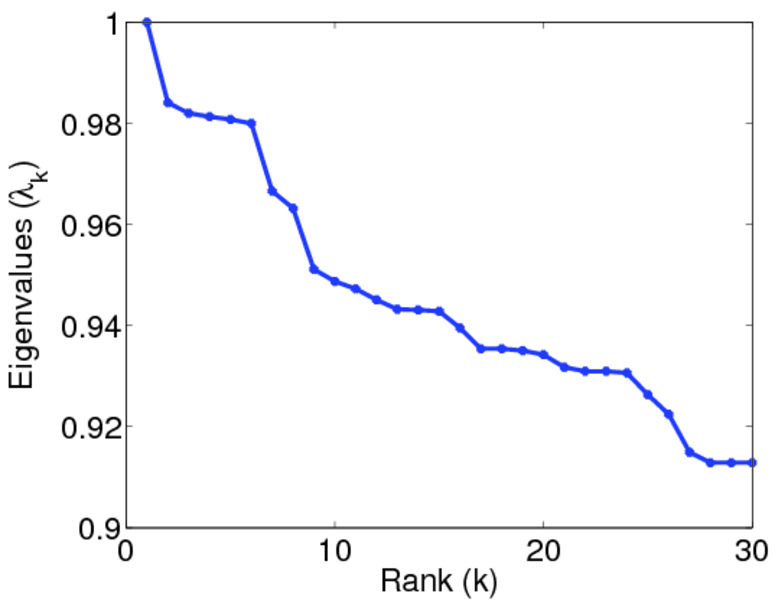
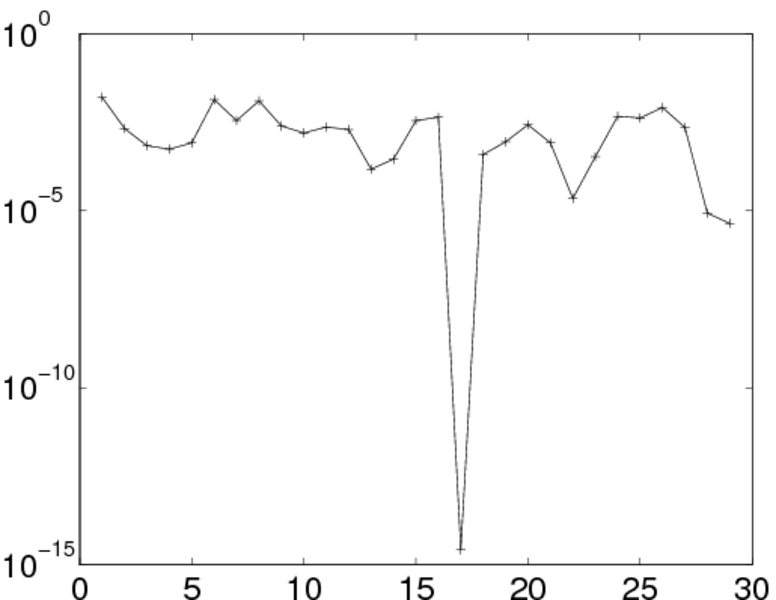
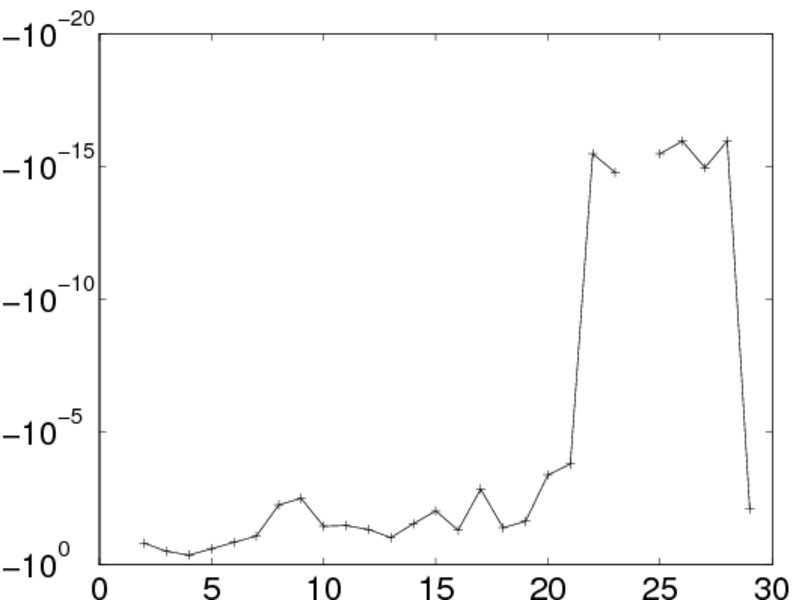
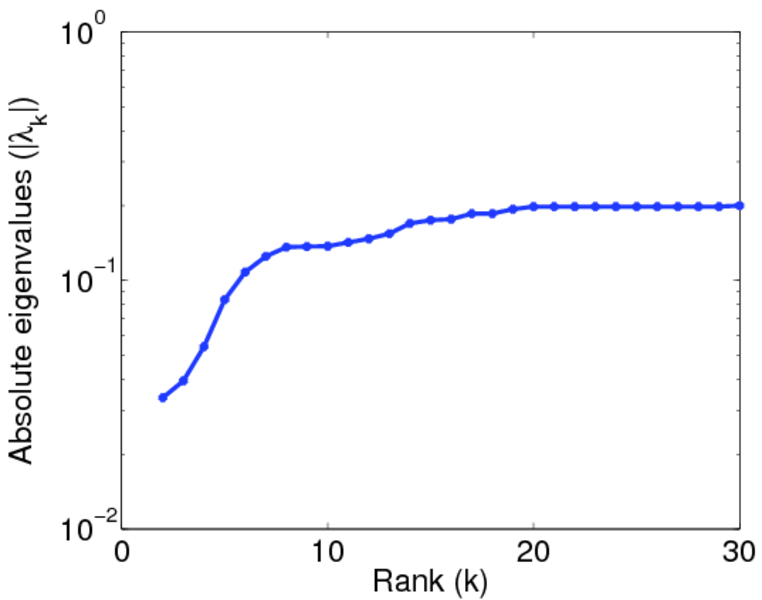
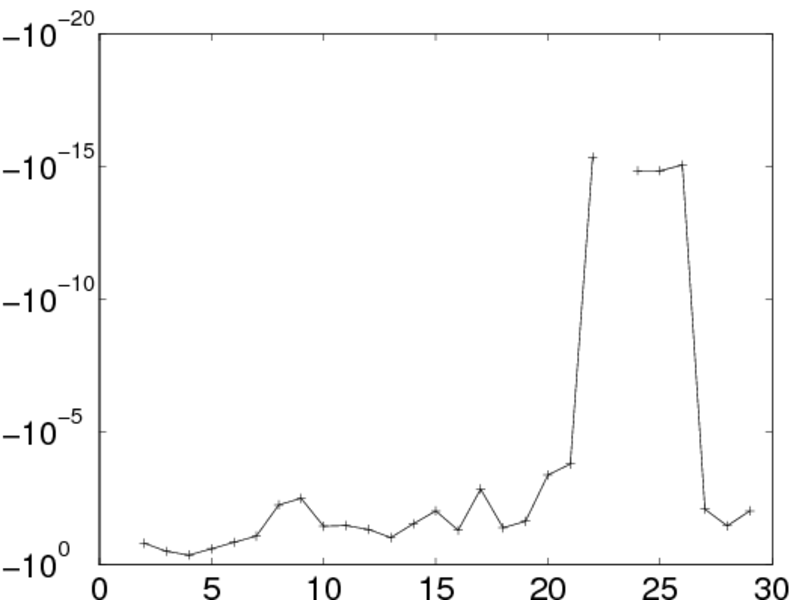
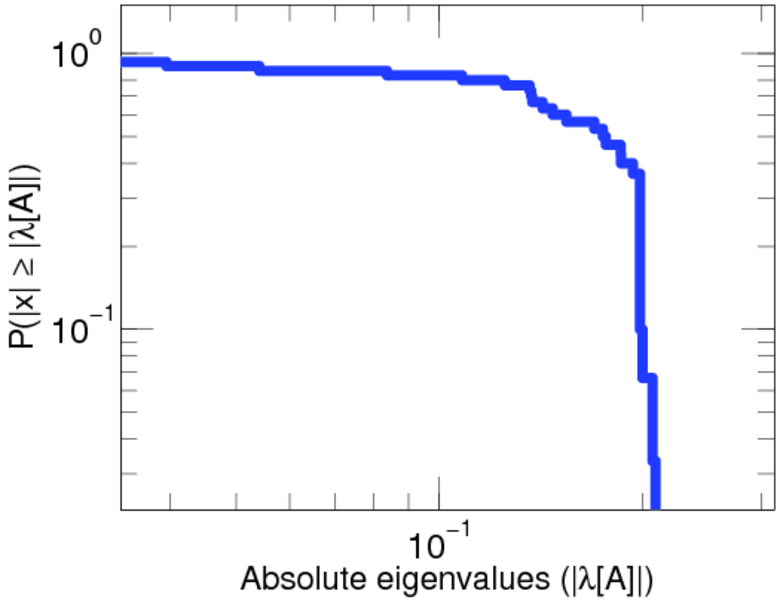
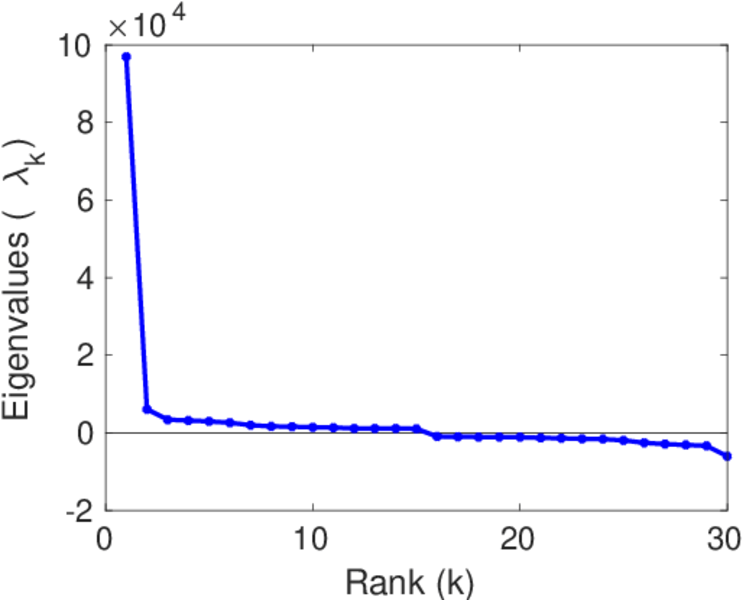
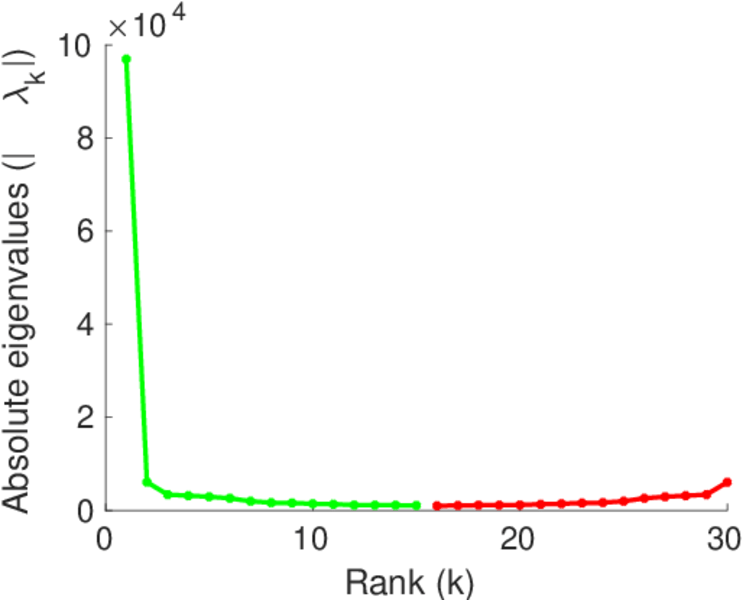
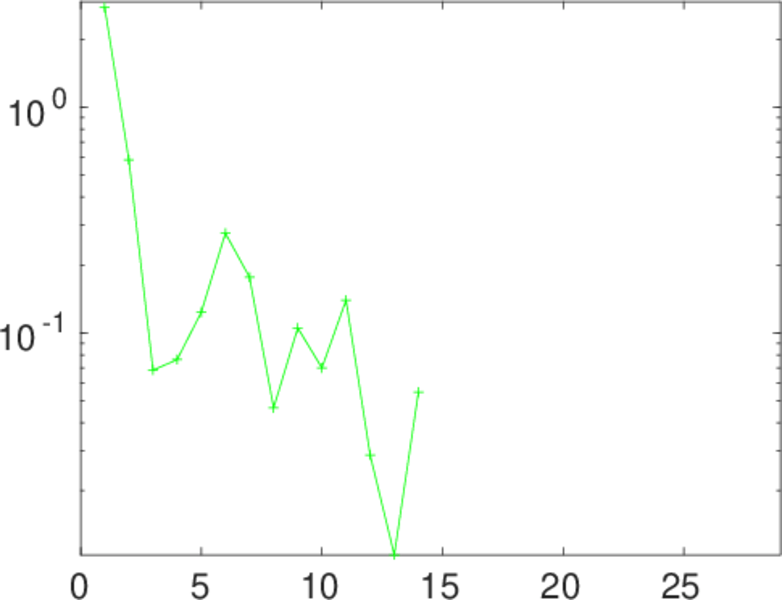
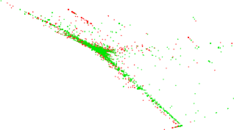
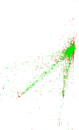
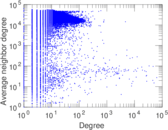
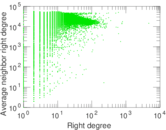
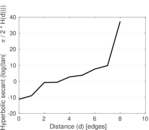
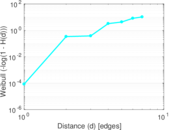
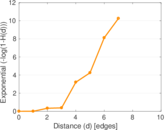
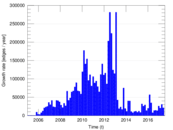
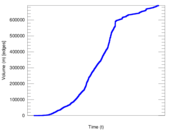
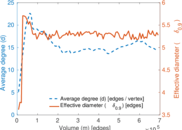
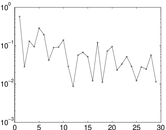
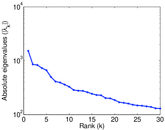
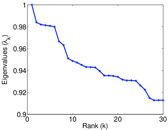
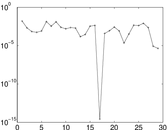
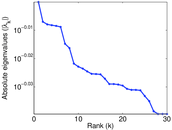
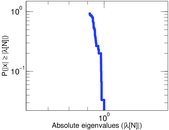
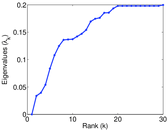
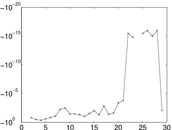
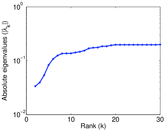
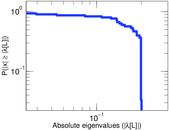
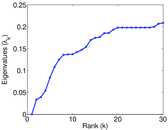
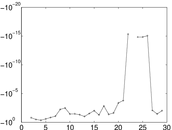
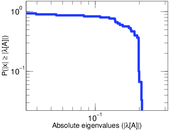
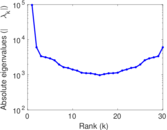
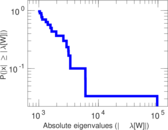
Plots


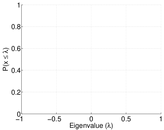
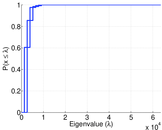
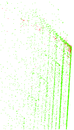


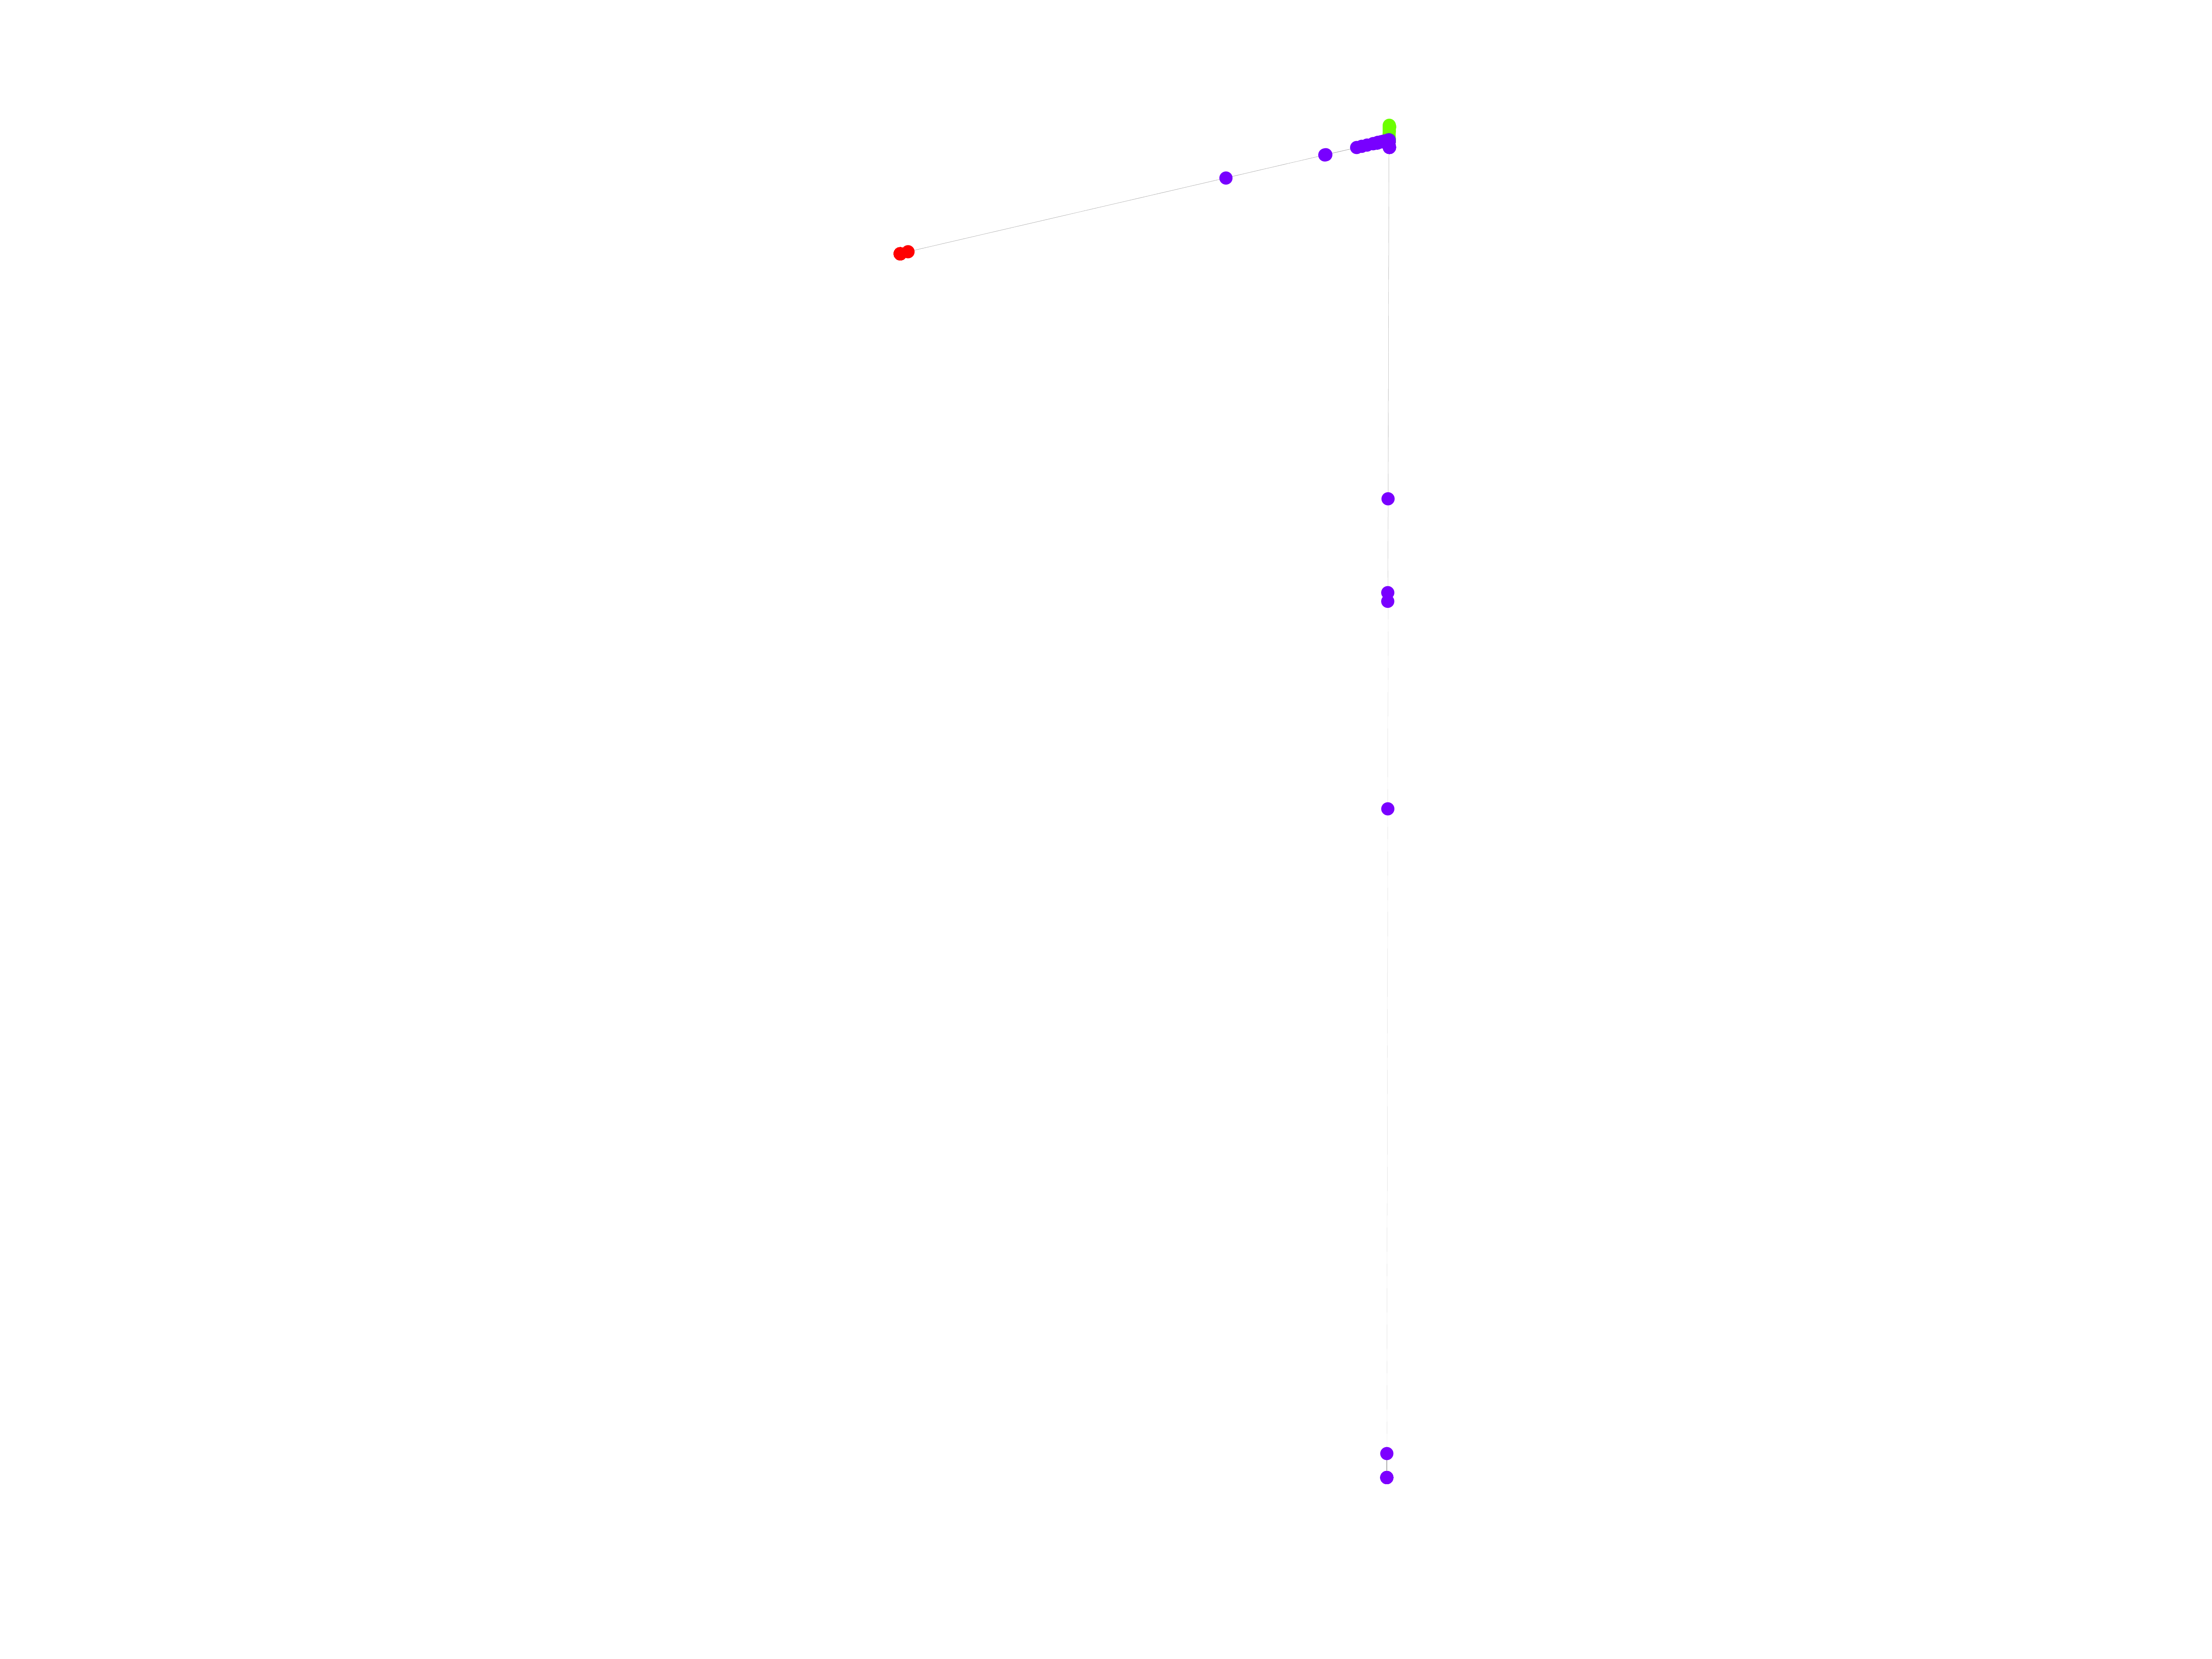
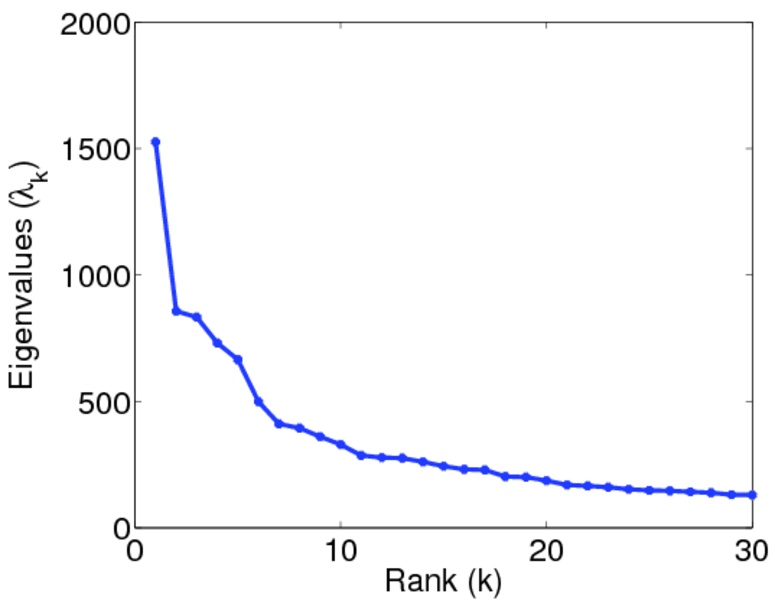
Matrix decompositions plots


Downloads
References
|
[1]
|
Jérôme Kunegis.
KONECT – The Koblenz Network Collection.
In Proc. Int. Conf. on World Wide Web Companion, pages
1343–1350, 2013.
[ http ]
|
|
[2]
|
Wikimedia Foundation.
Wikimedia downloads.
http://dumps.wikimedia.org/, January 2010.
|
 KONECT ‣ Networks ‣
Buy Me a Coffee
KONECT ‣ Networks ‣
Buy Me a Coffee