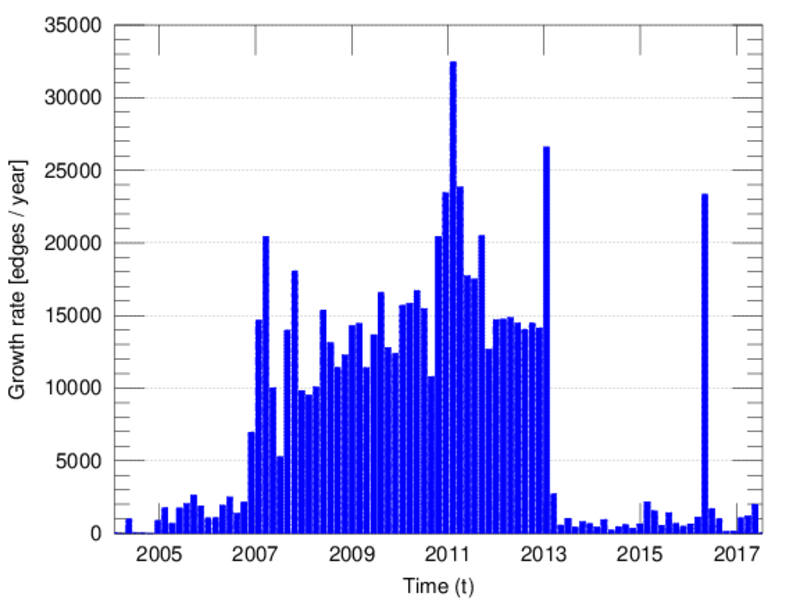
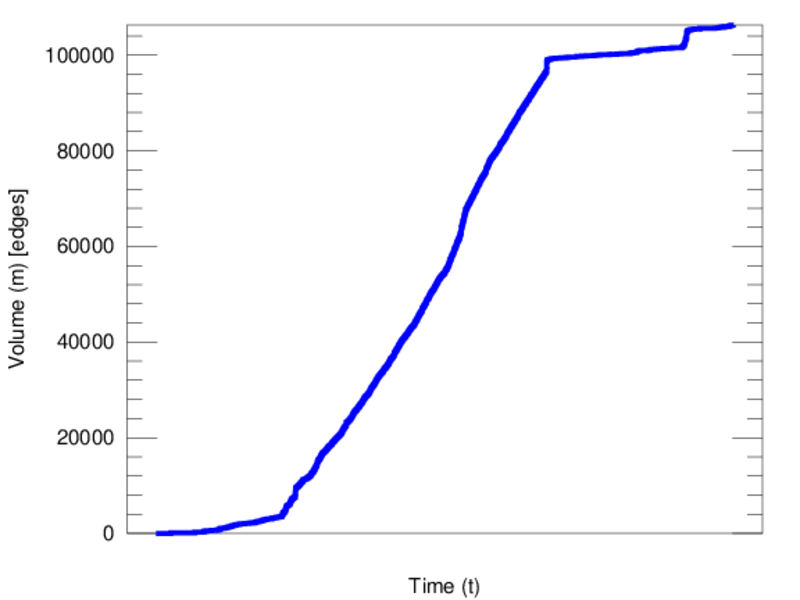
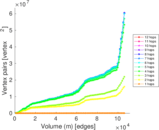
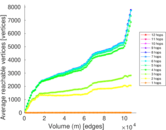
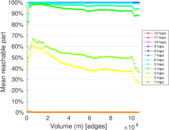
Wikipedia edits (ln)
This is the bipartite edit network of the Lingala Wikipedia. It contains users
and pages from the Lingala Wikipedia, connected by edit events. Each edge
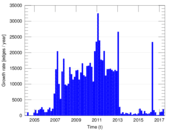
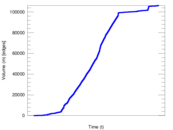
represents an edit. The dataset includes the timestamp of each edit.
Metadata
Statistics
| Size | n = | 8,637
|
| Left size | n1 = | 896
|
| Right size | n2 = | 7,741
|
| Volume | m = | 106,315
|
| Unique edge count | m̿ = | 43,628
|
| Wedge count | s = | 19,917,786
|
| Claw count | z = | 9,504,013,447
|
| Cross count | x = | 4,321,159,564,178
|
| Square count | q = | 66,194,449
|
| 4-Tour count | T4 = | 609,331,516
|
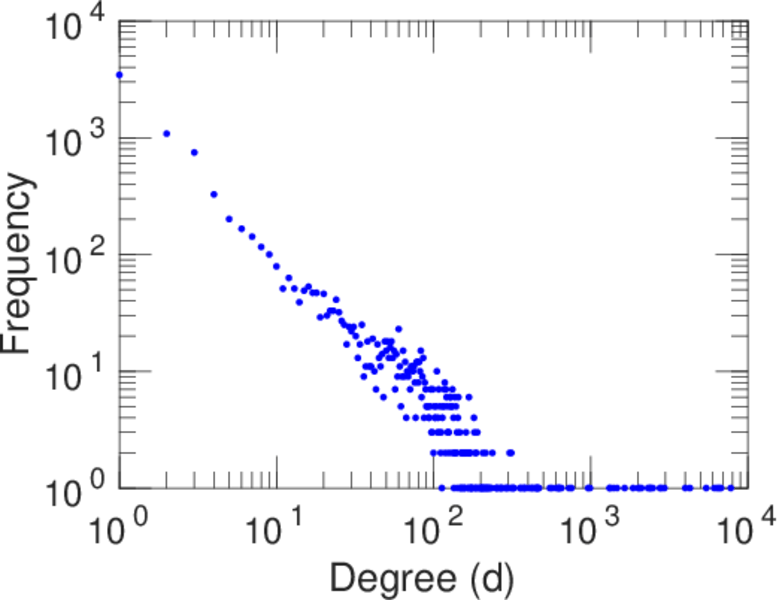
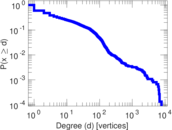
| Maximum degree | dmax = | 7,809
|
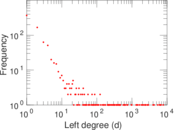
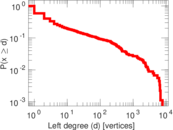
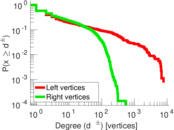
| Maximum left degree | d1max = | 7,809
|
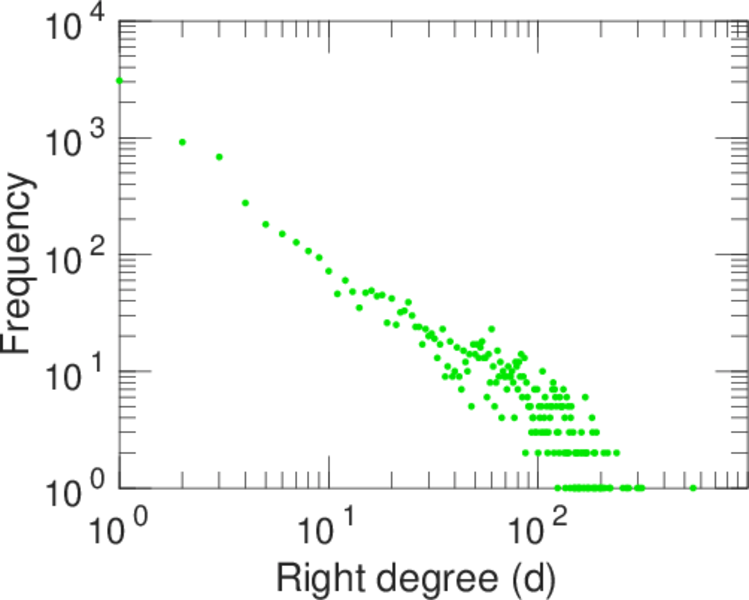
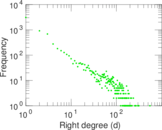
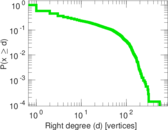
| Maximum right degree | d2max = | 550
|
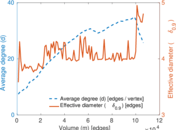
| Average degree | d = | 24.618 5
|
| Average left degree | d1 = | 118.655
|
| Average right degree | d2 = | 13.734 0
|
| Fill | p = | 0.006 290 14
|
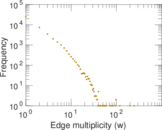
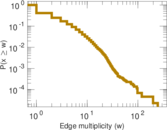
| Average edge multiplicity | m̃ = | 2.436 85
|
| Size of LCC | N = | 7,775
|
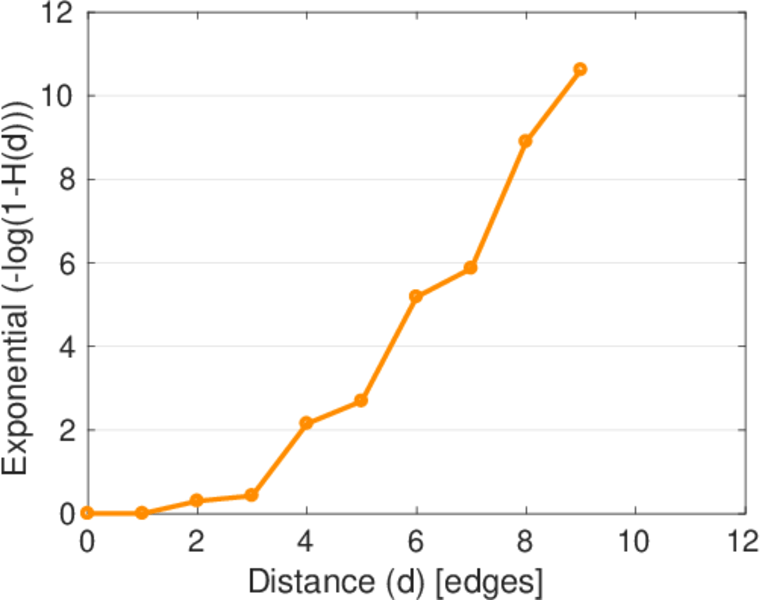
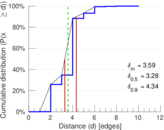
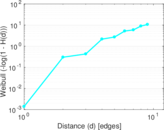
| Diameter | δ = | 12
|
| 50-Percentile effective diameter | δ0.5 = | 3.284 85
|
| 90-Percentile effective diameter | δ0.9 = | 4.336 03
|
| Median distance | δM = | 4
|
| Mean distance | δm = | 3.585 36
|
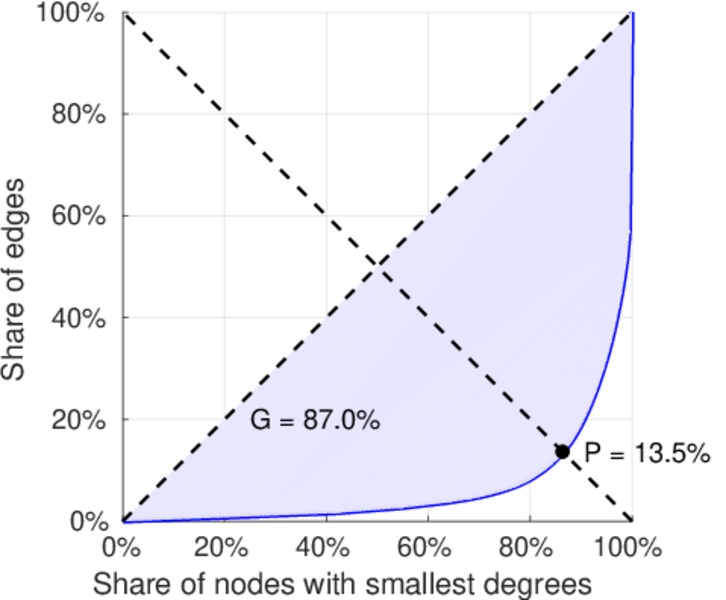
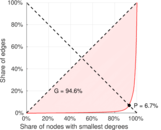
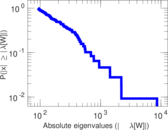
| Gini coefficient | G = | 0.869 518
|
| Balanced inequality ratio | P = | 0.135 108
|
| Left balanced inequality ratio | P1 = | 0.066 613 4
|
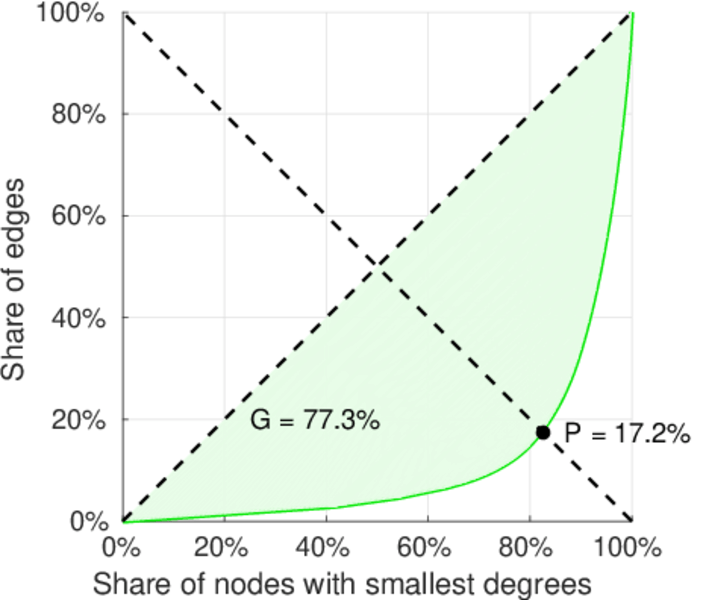
| Right balanced inequality ratio | P2 = | 0.172 459
|
| Relative edge distribution entropy | Her = | 0.768 388
|
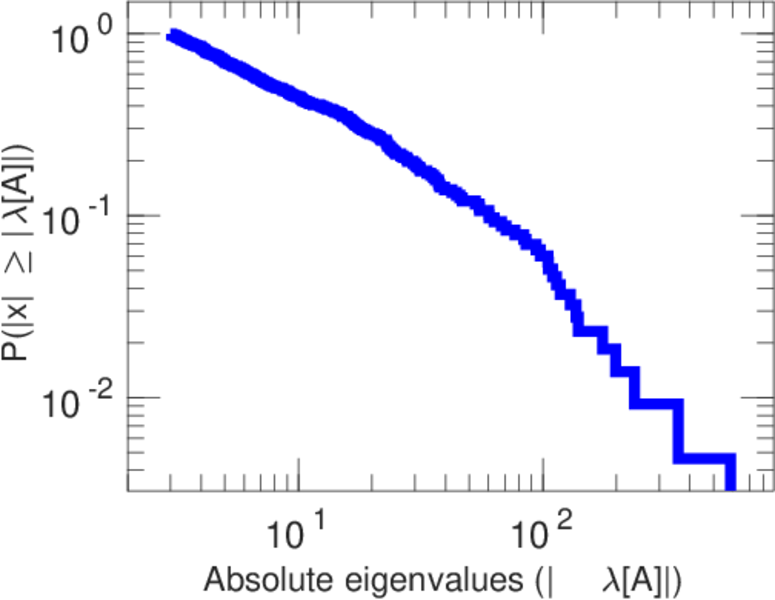
| Power law exponent | γ = | 2.088 59
|
| Tail power law exponent | γt = | 1.721 00
|
| Tail power law exponent with p | γ3 = | 1.721 00
|
| p-value | p = | 0.000 00
|
| Left tail power law exponent with p | γ3,1 = | 1.611 00
|
| Left p-value | p1 = | 0.000 00
|
| Right tail power law exponent with p | γ3,2 = | 8.911 00
|
| Right p-value | p2 = | 0.640 000
|
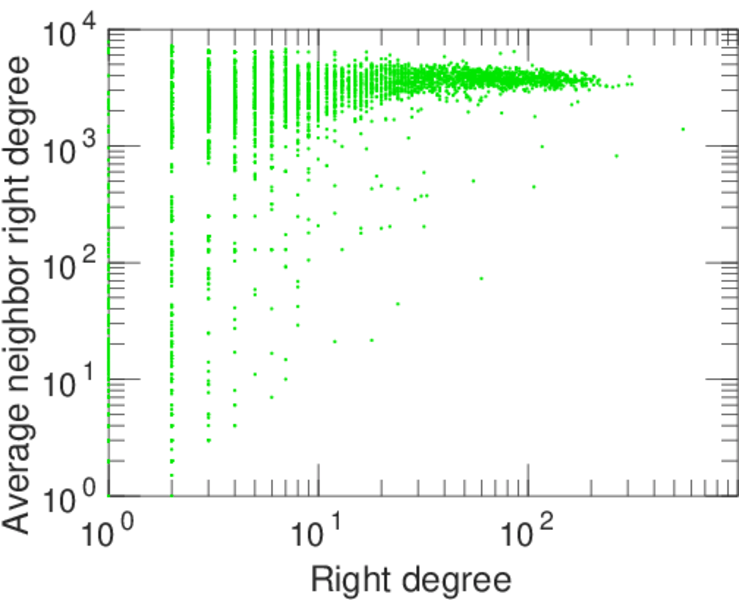
| Degree assortativity | ρ = | −0.304 071
|
| Degree assortativity p-value | pρ = | 0.000 00
|
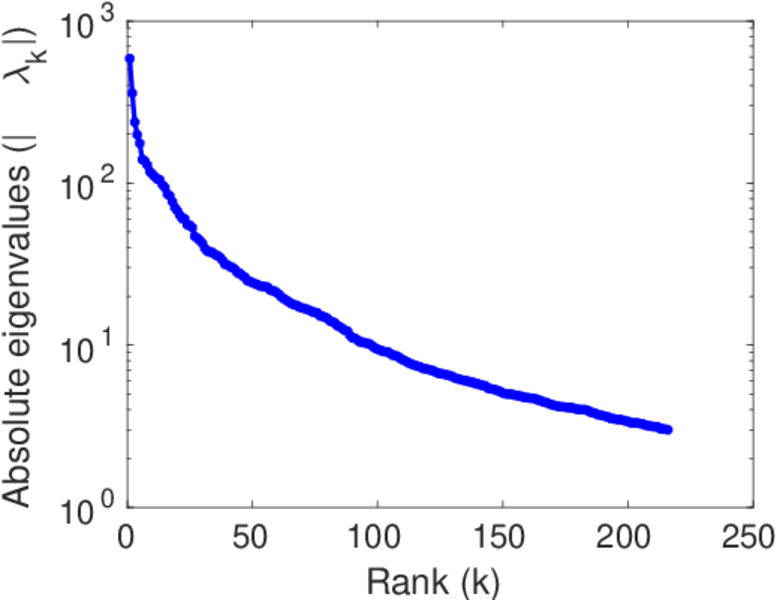
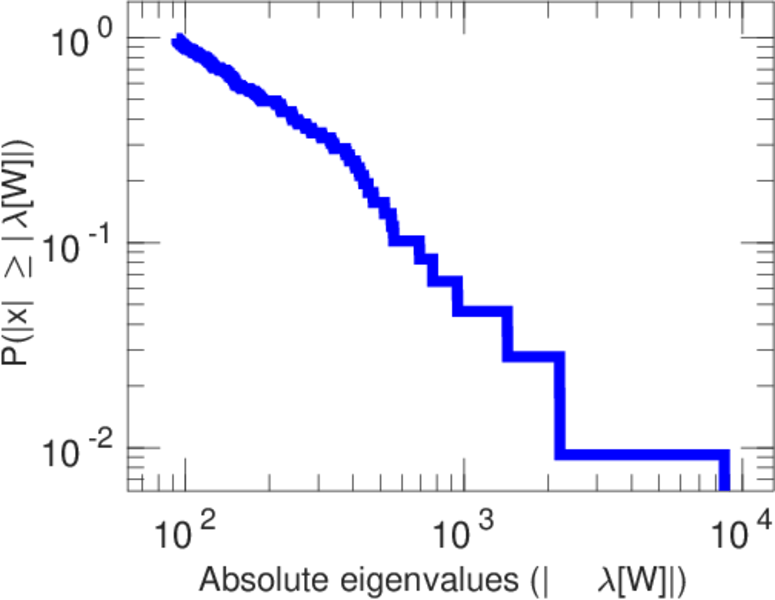
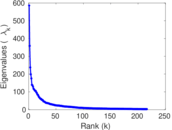
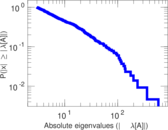
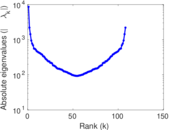
| Spectral norm | α = | 585.851
|
| Algebraic connectivity | a = | 0.056 005 0
|
| Spectral separation | |λ1[A] / λ2[A]| = | 1.633 55
|
| Controllability | C = | 6,625
|
| Relative controllability | Cr = | 0.800 991
|
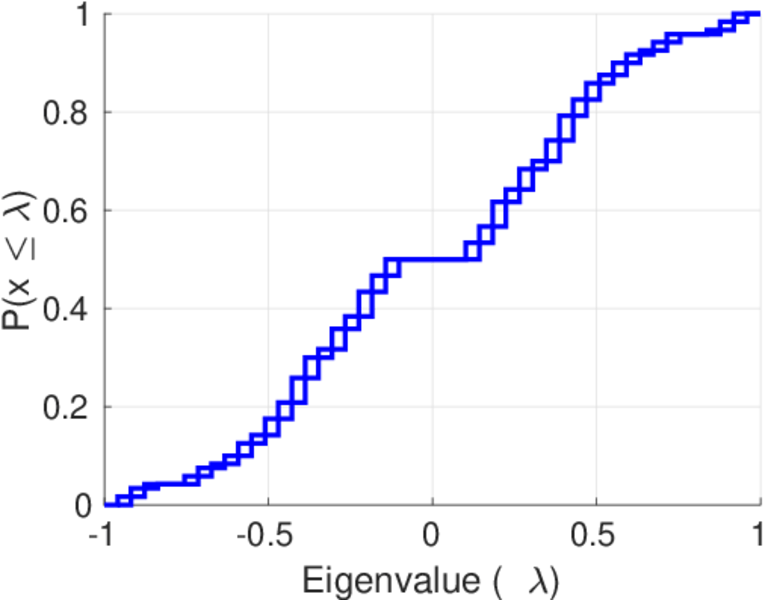
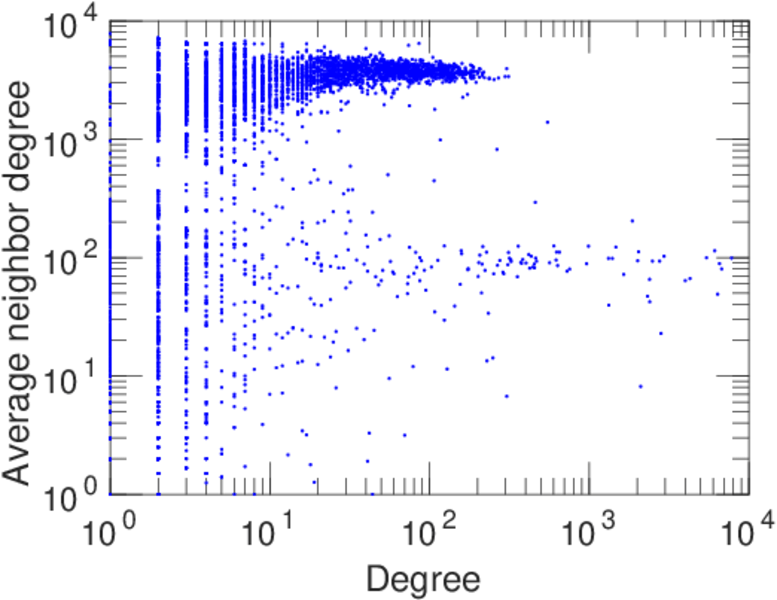
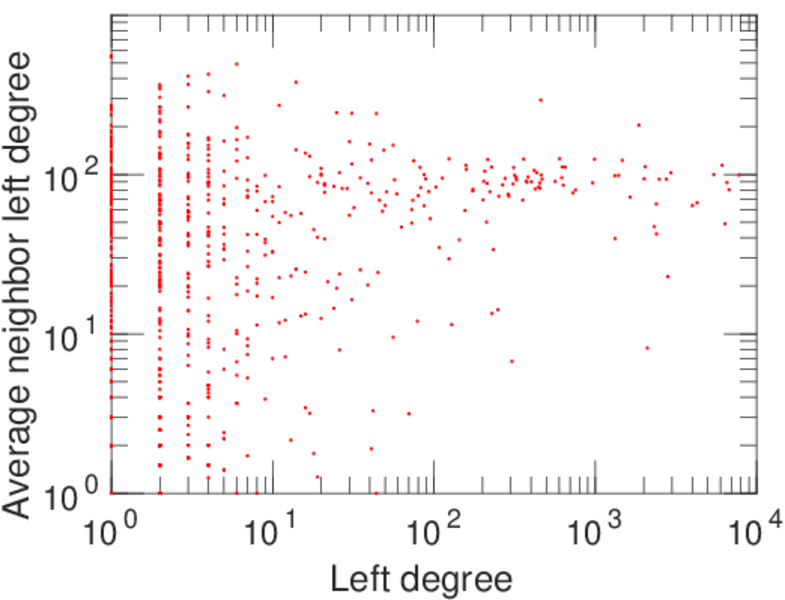
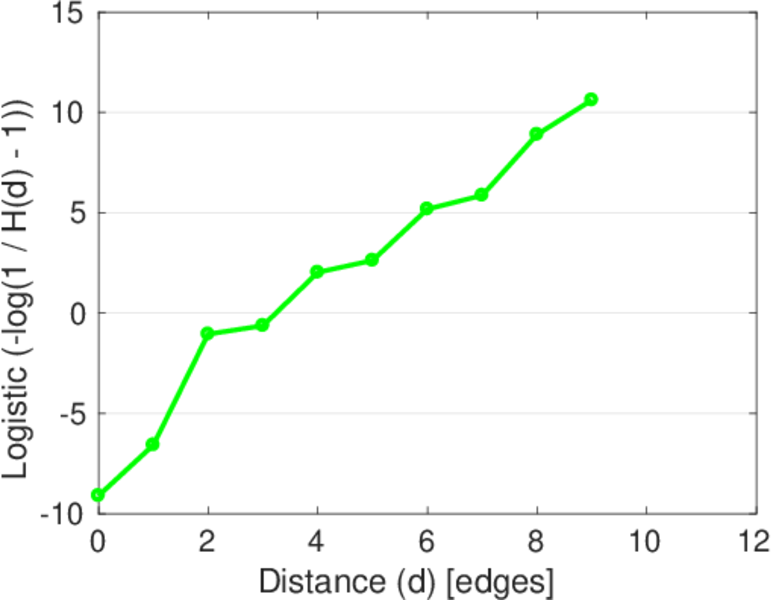
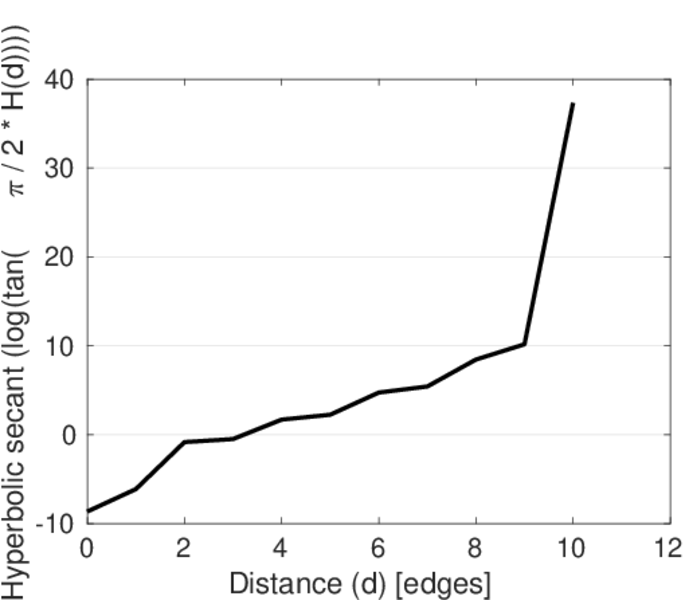
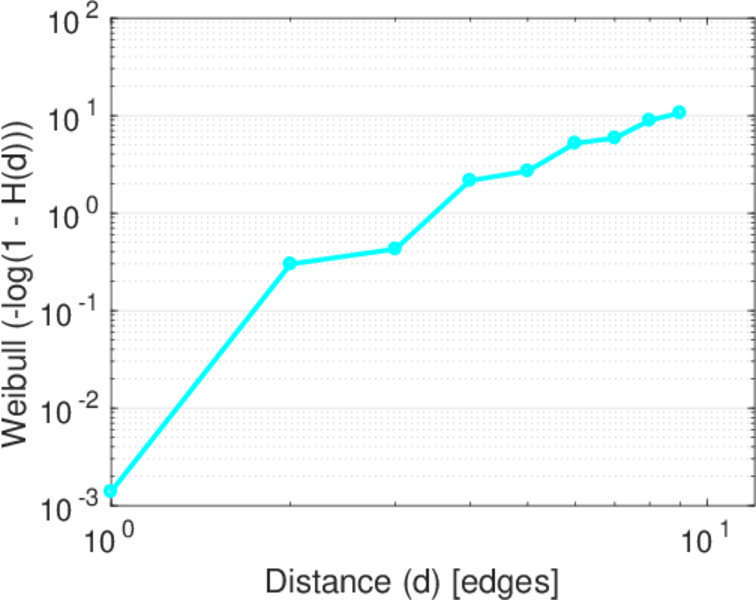
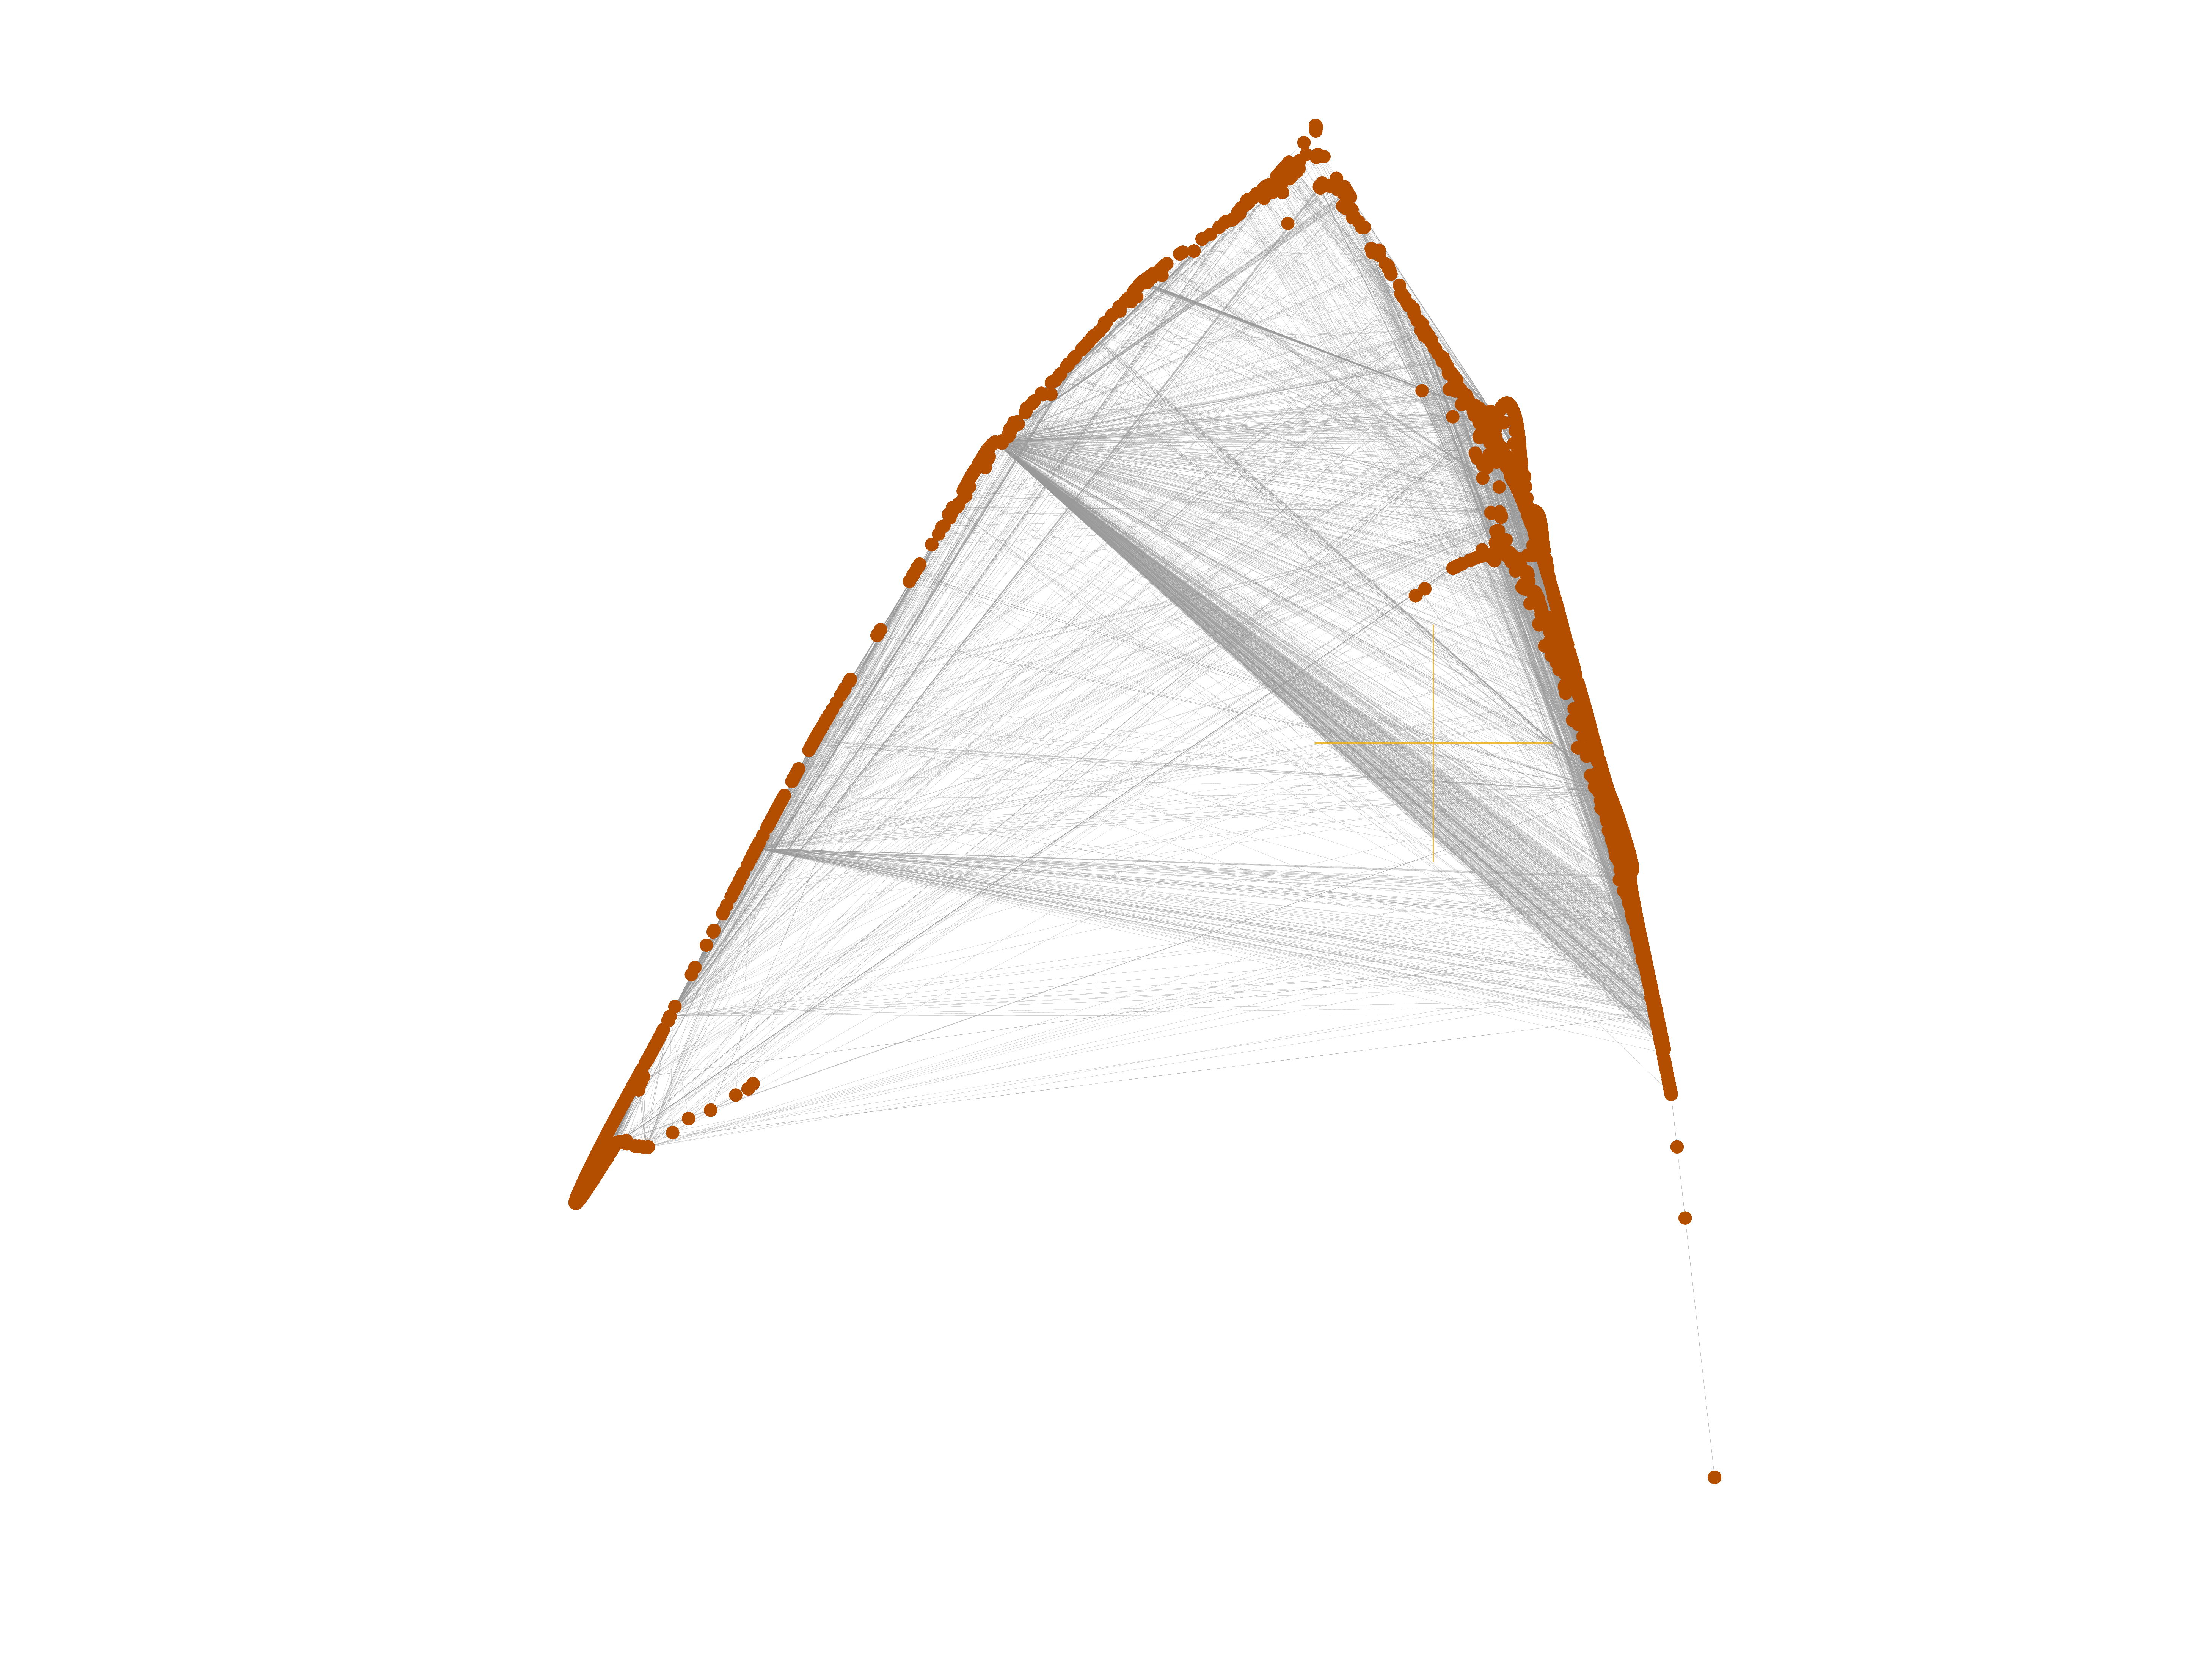
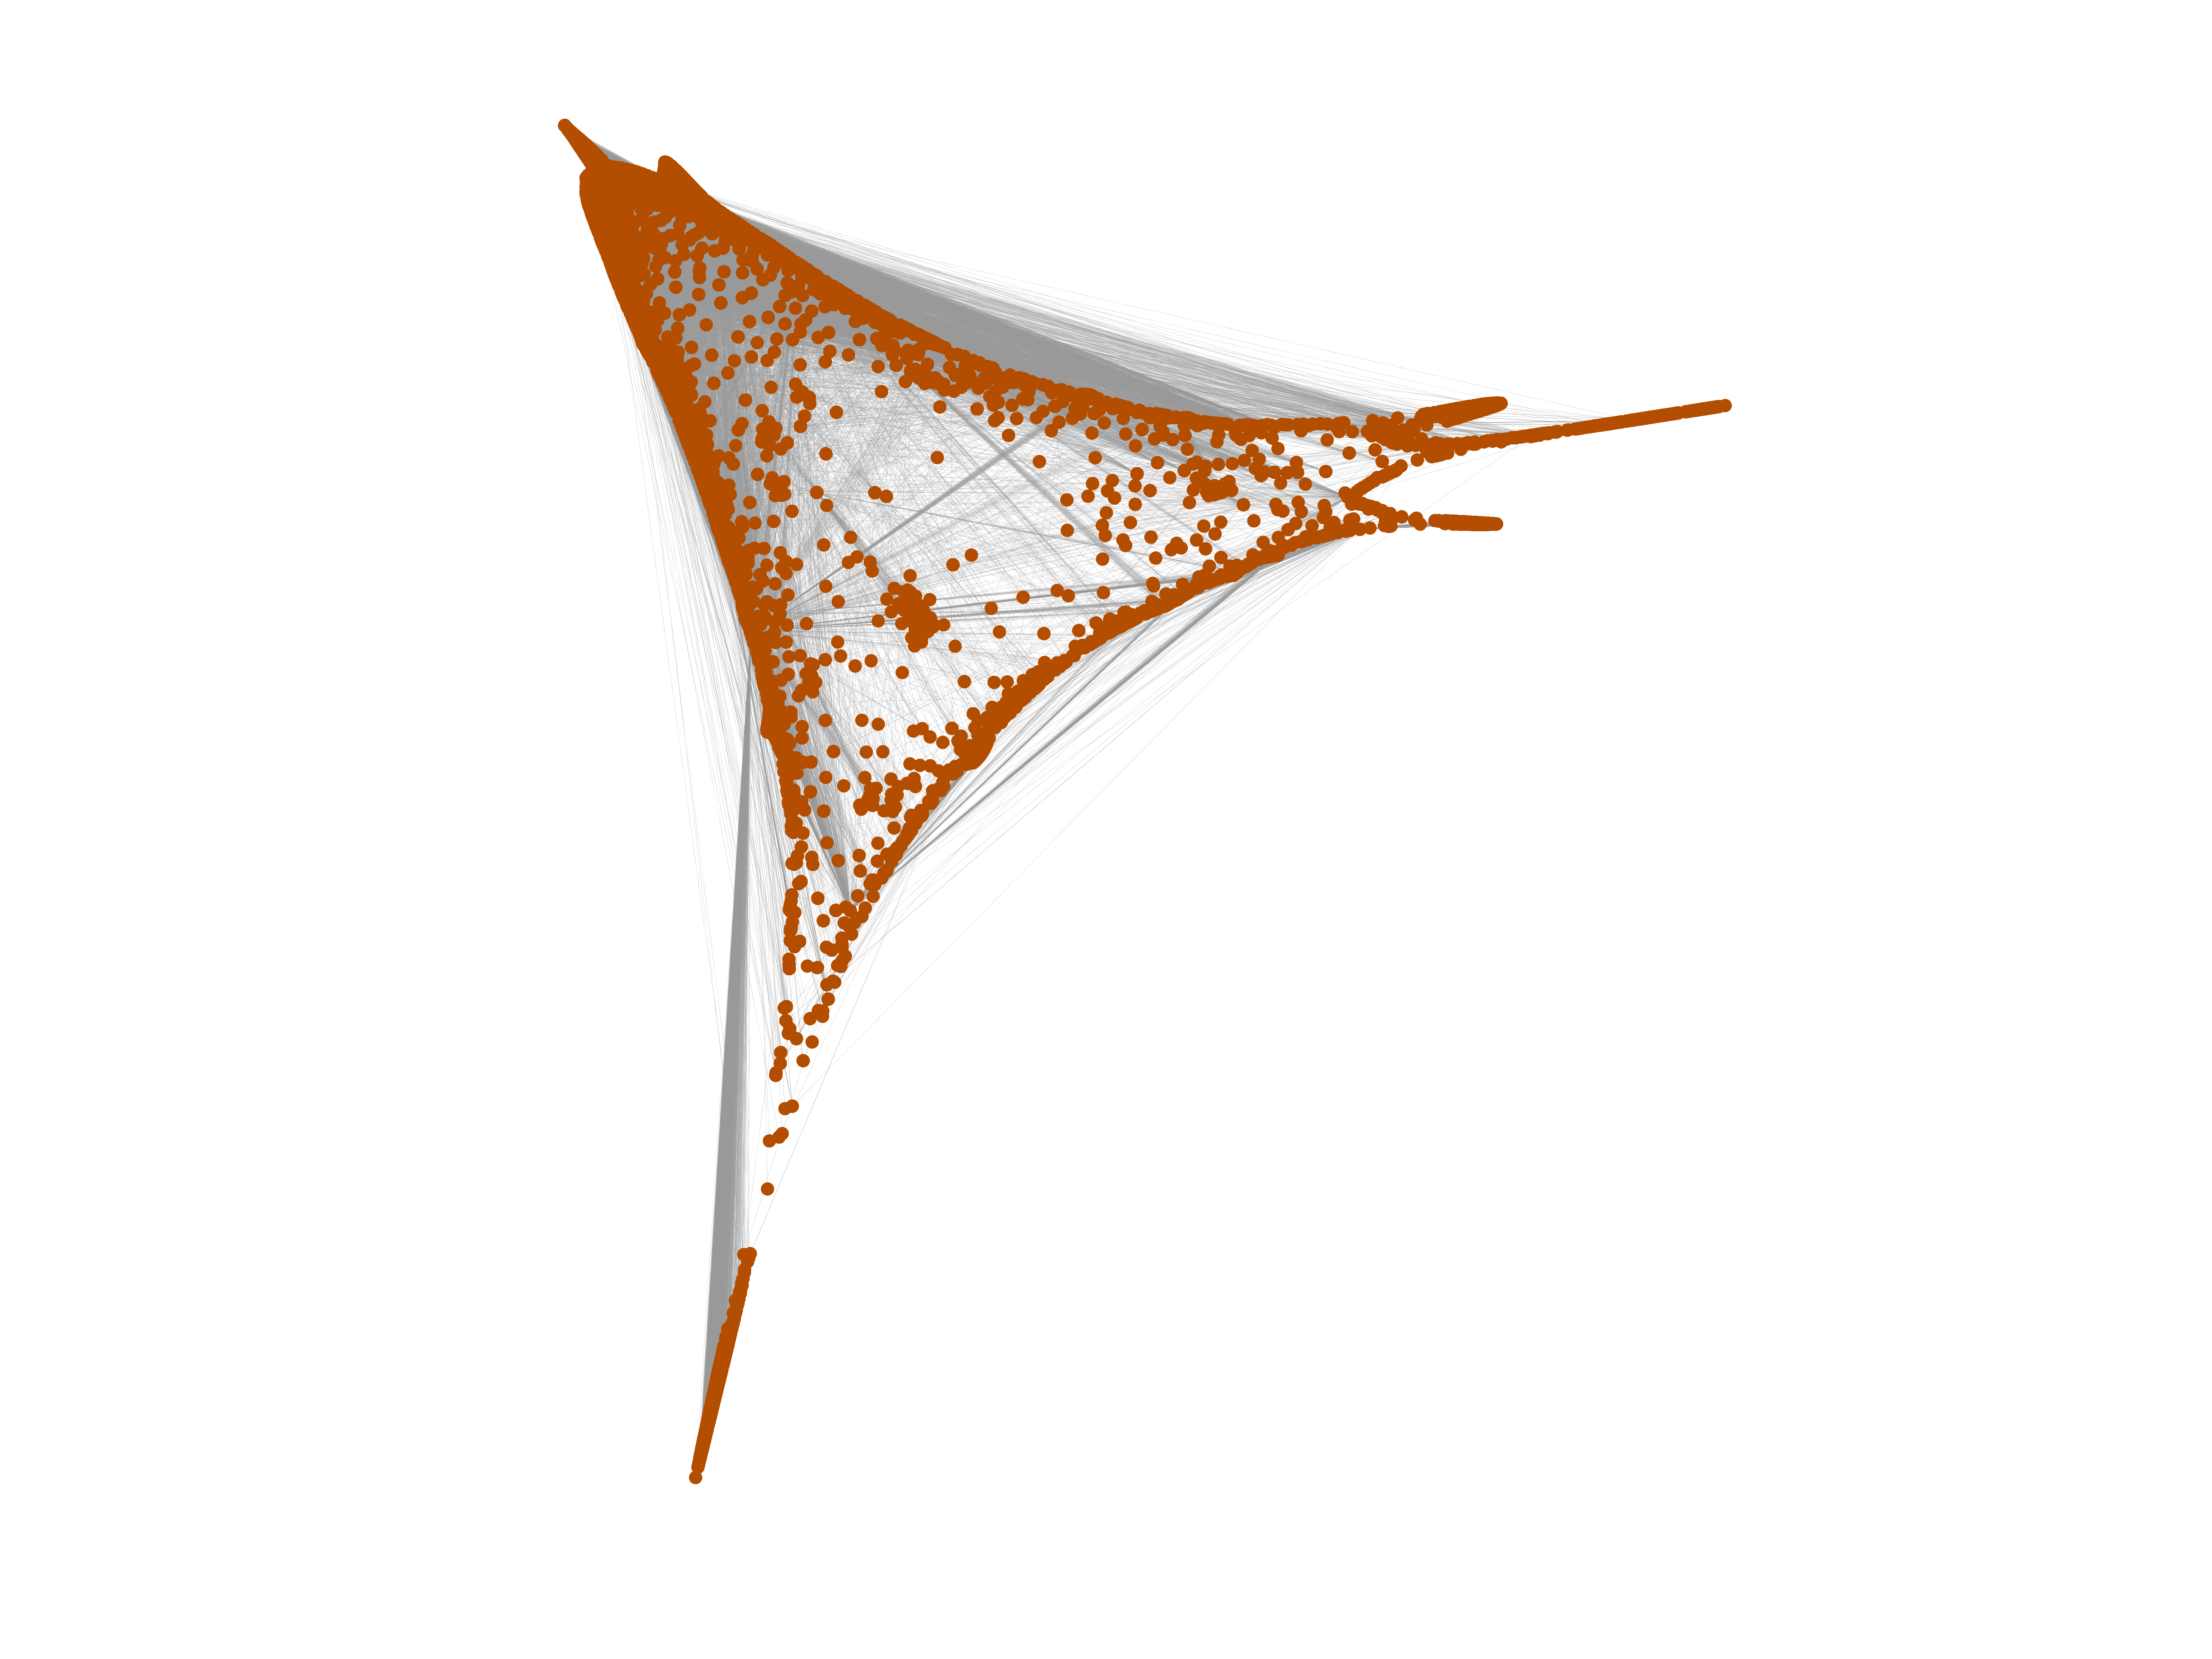
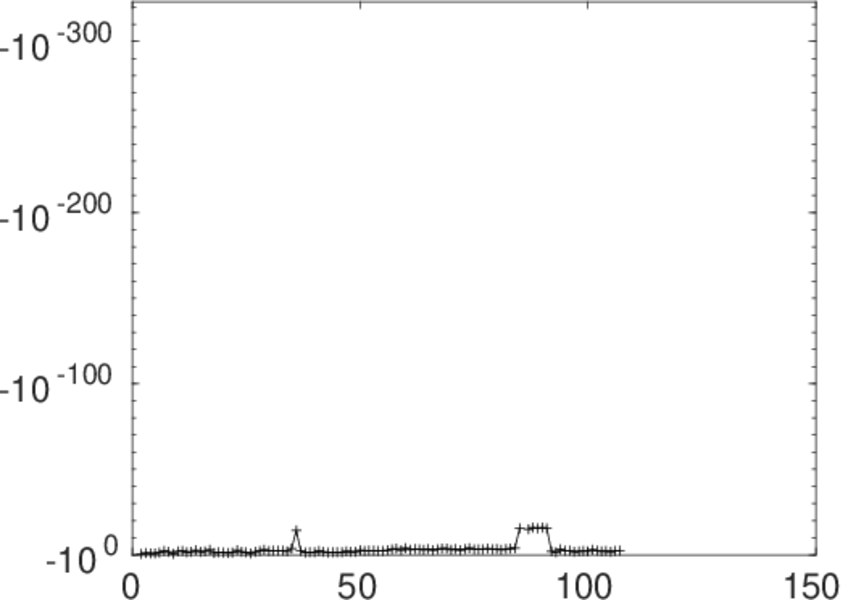
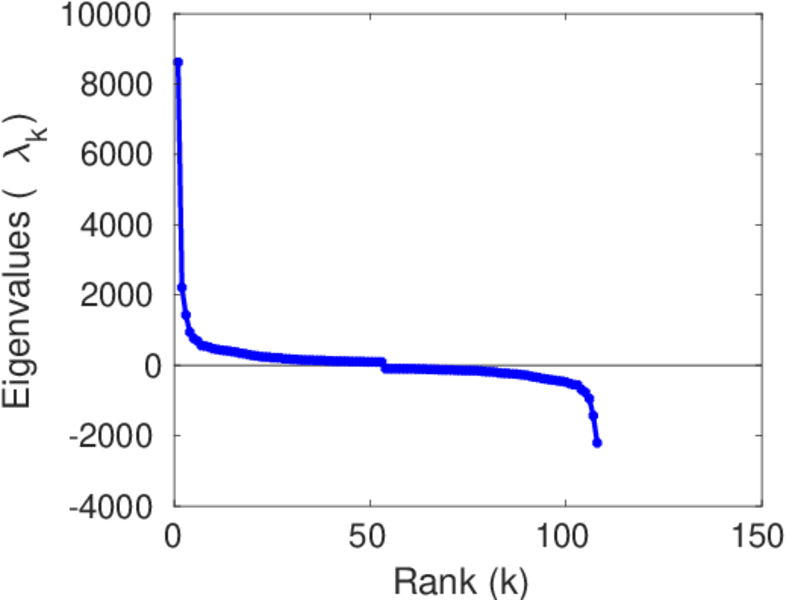
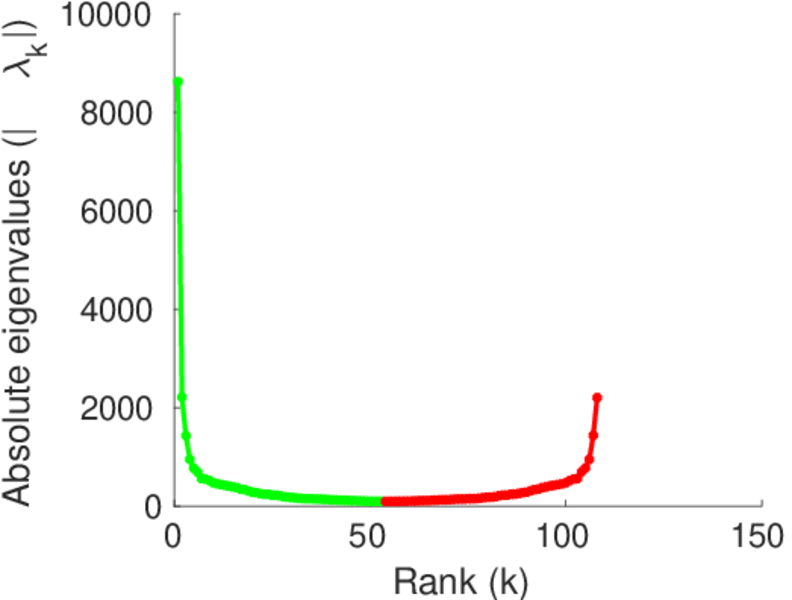
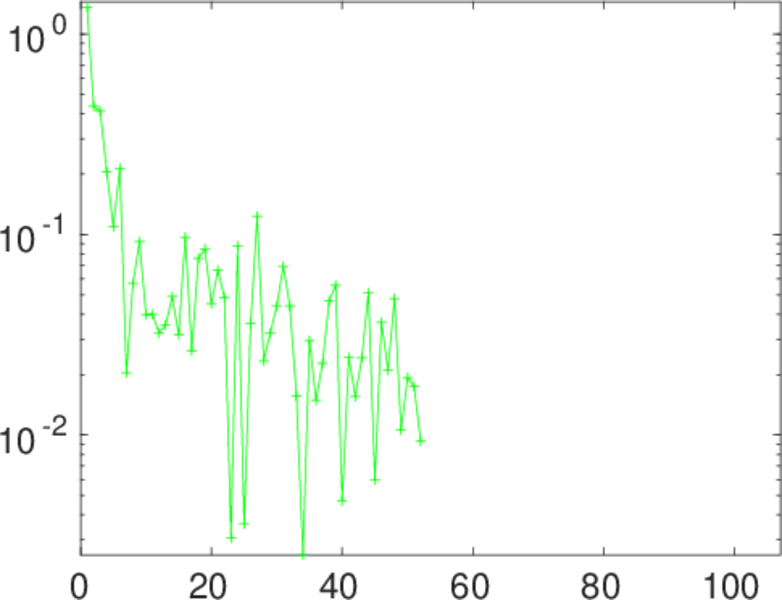
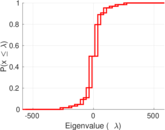
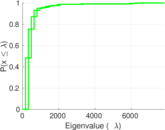
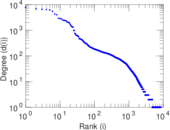
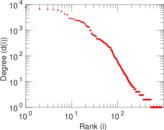
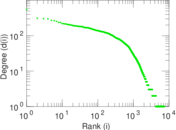
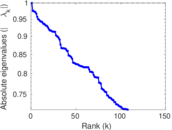
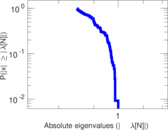
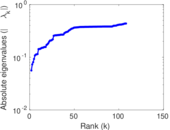
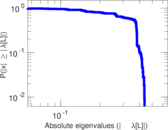
Plots


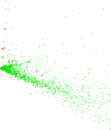
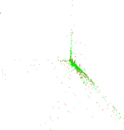


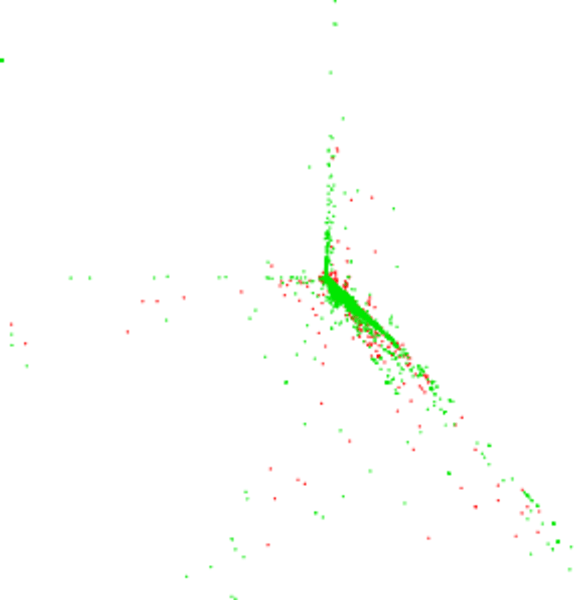
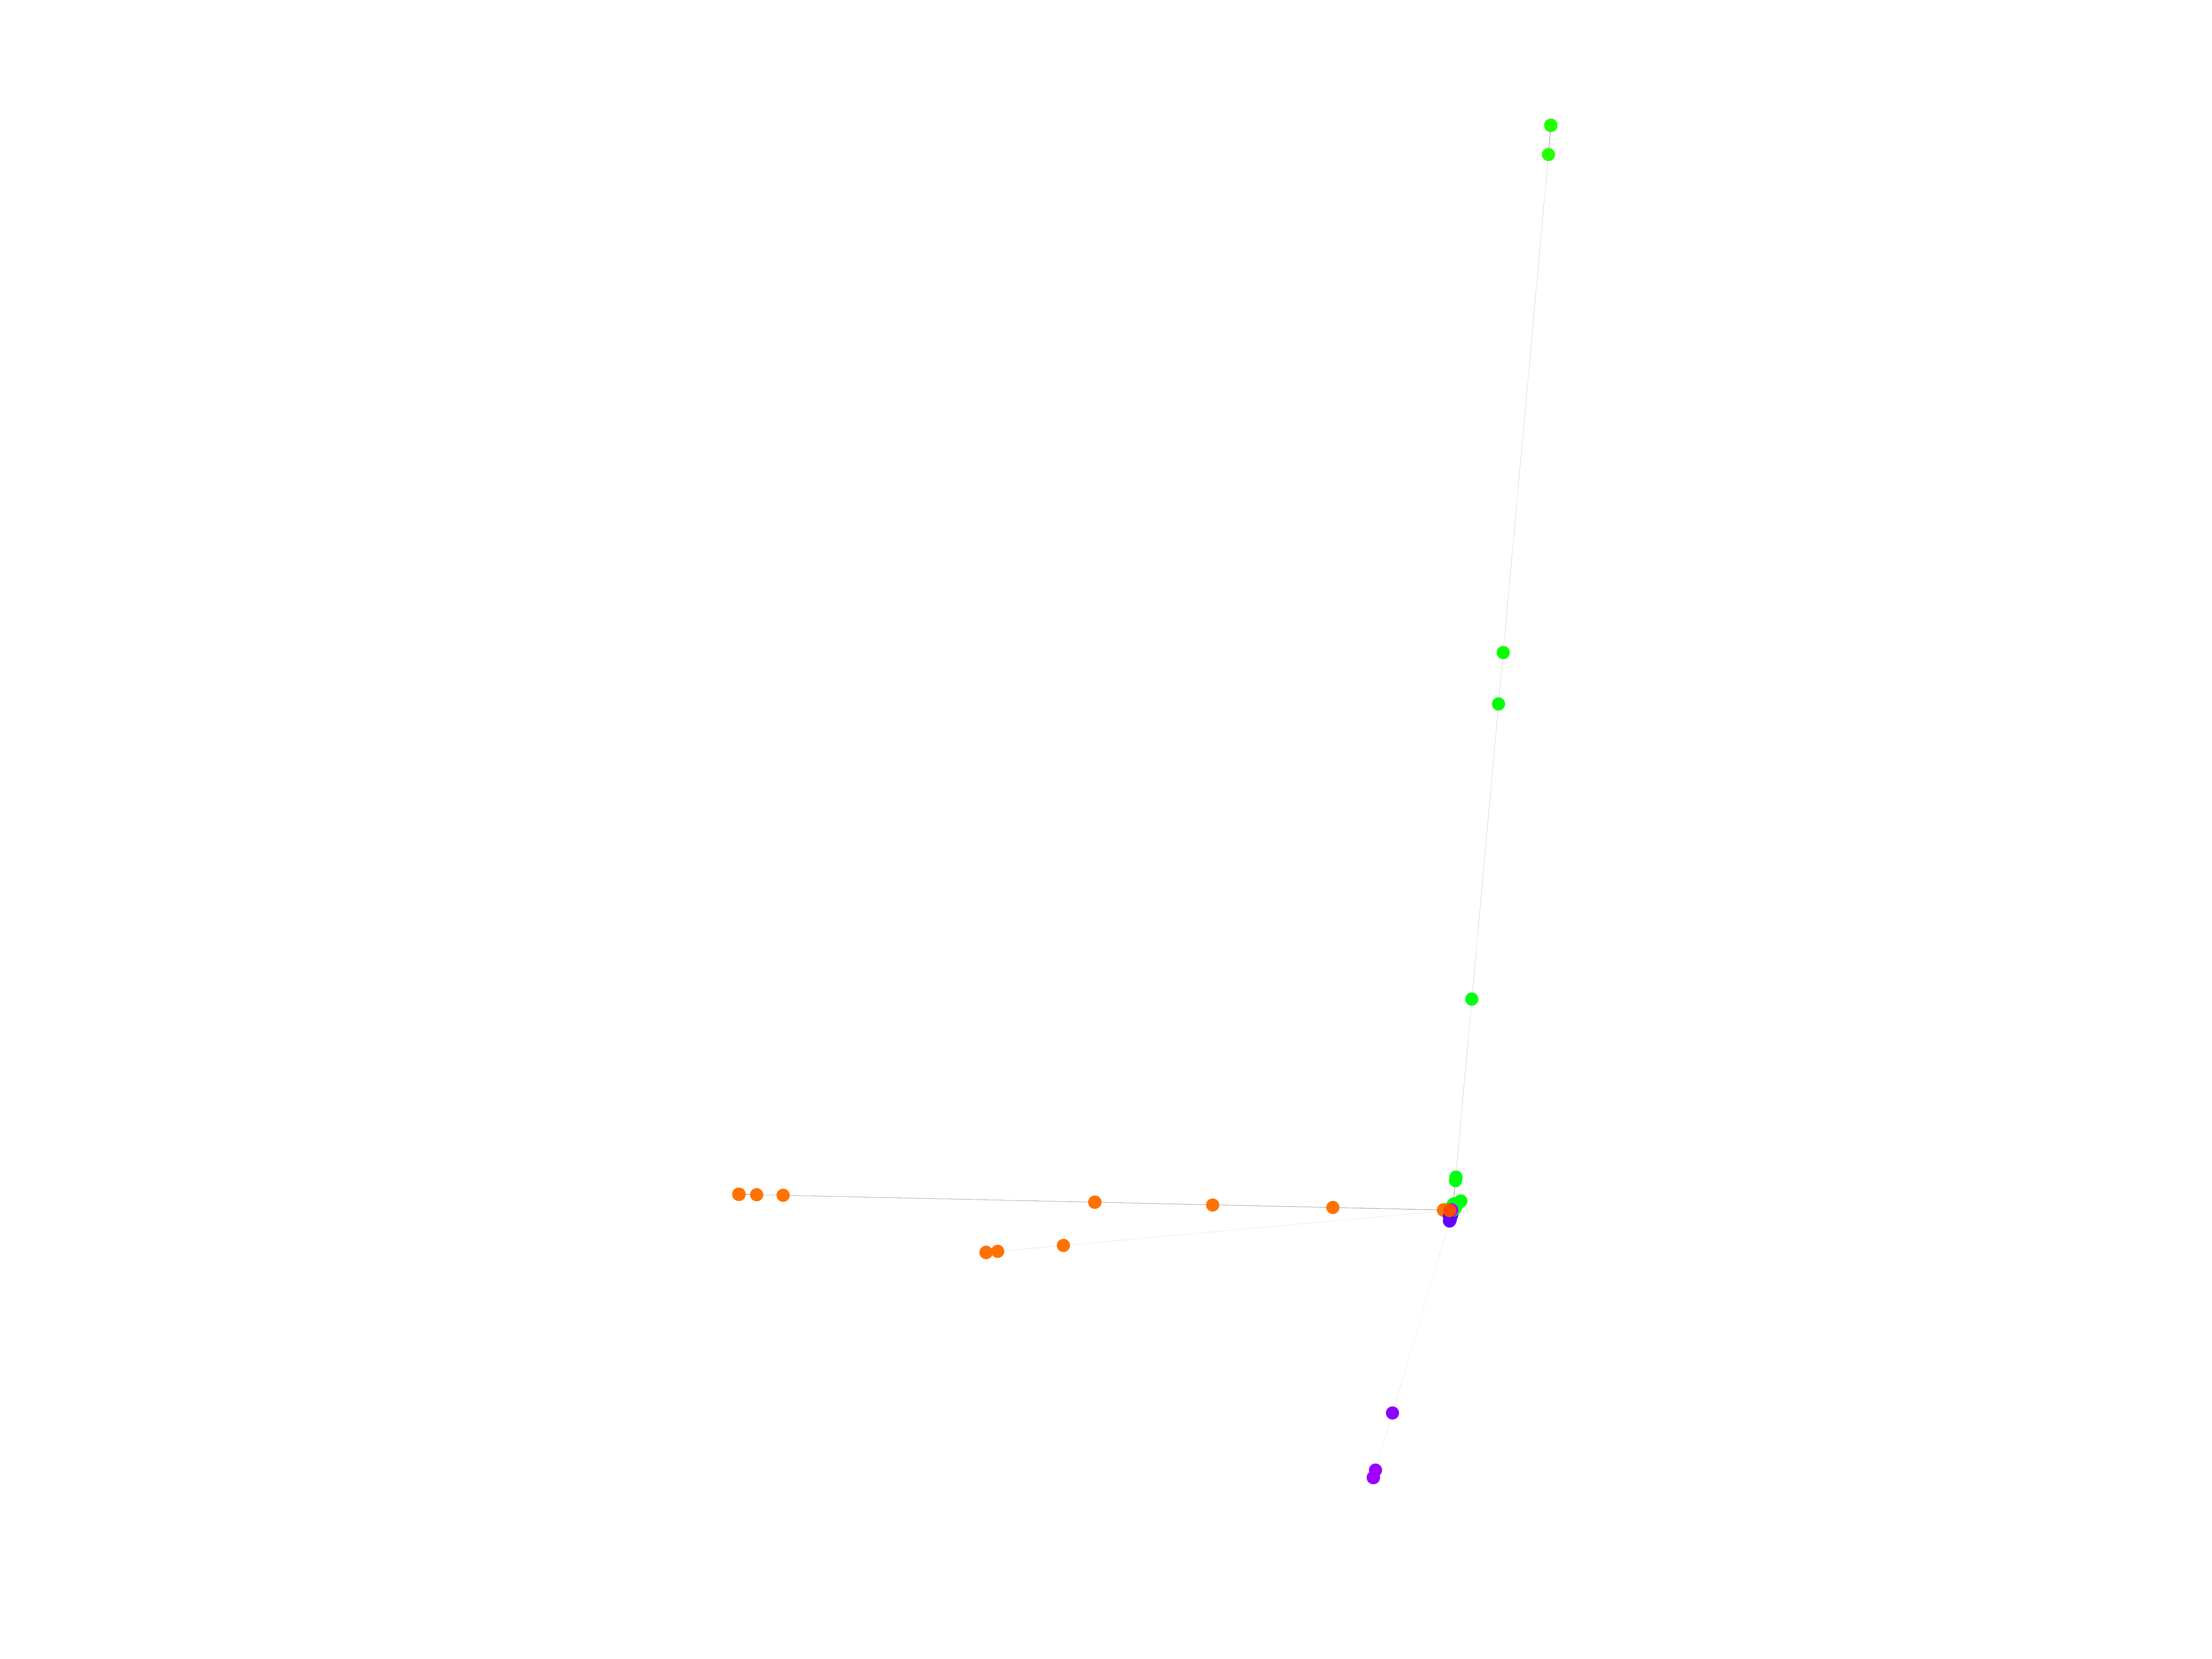
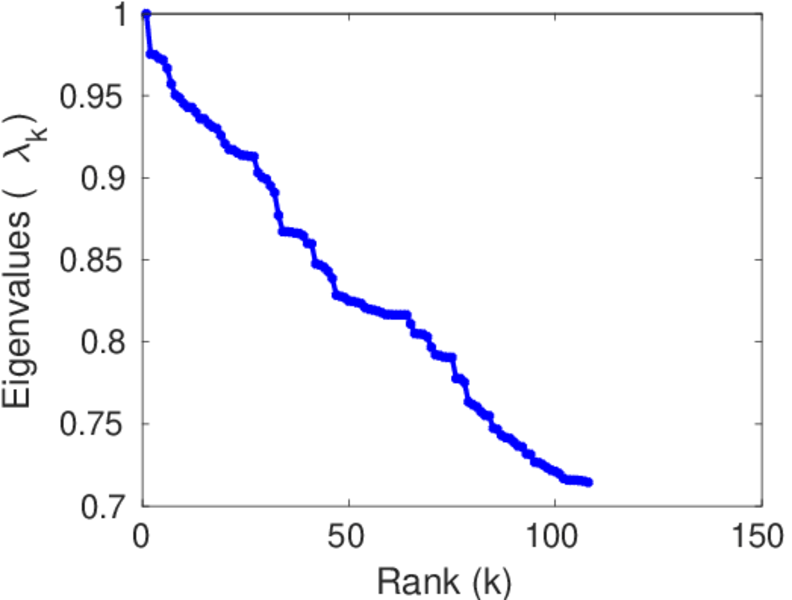
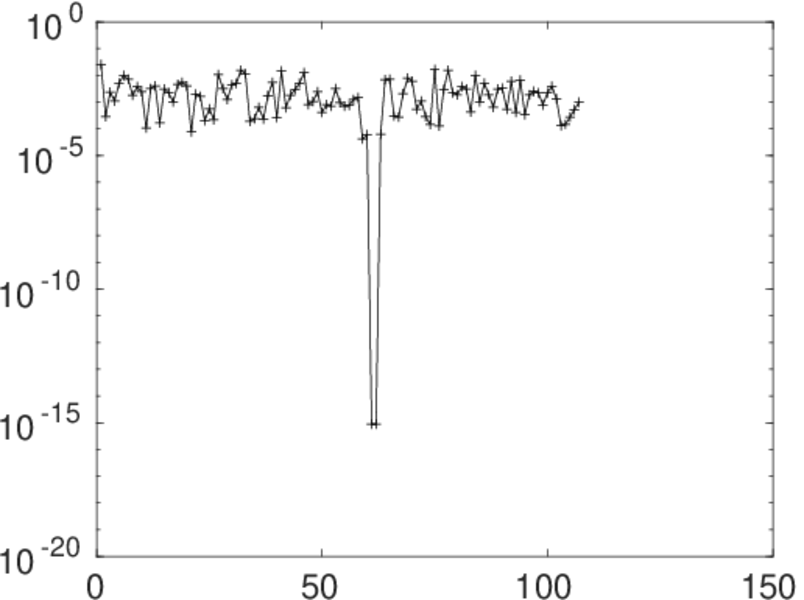
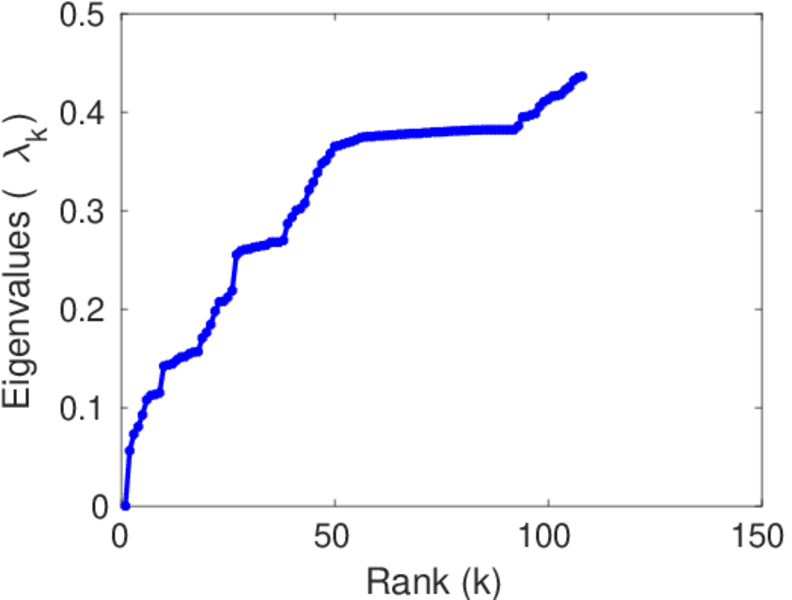
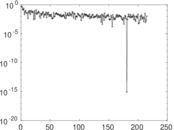
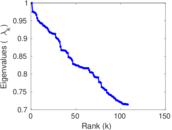
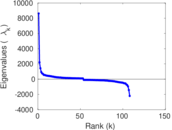
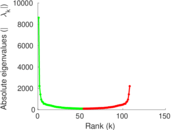
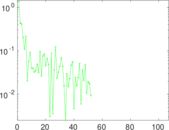
Matrix decompositions plots


Downloads
References
|
[1]
|
Jérôme Kunegis.
KONECT – The Koblenz Network Collection.
In Proc. Int. Conf. on World Wide Web Companion, pages
1343–1350, 2013.
[ http ]
|
|
[2]
|
Wikimedia Foundation.
Wikimedia downloads.
http://dumps.wikimedia.org/, January 2010.
|
 KONECT ‣ Networks ‣
Buy Me a Coffee
KONECT ‣ Networks ‣
Buy Me a Coffee