Wiktionary edits (ln)
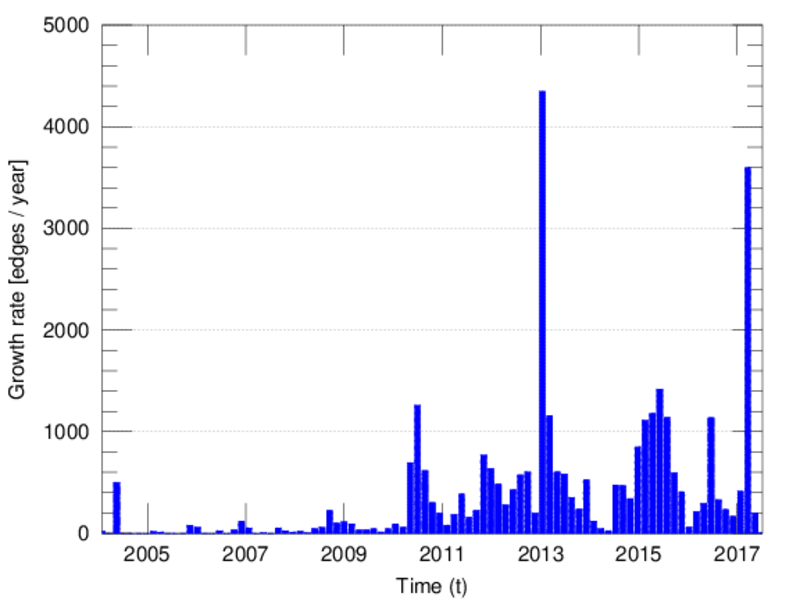
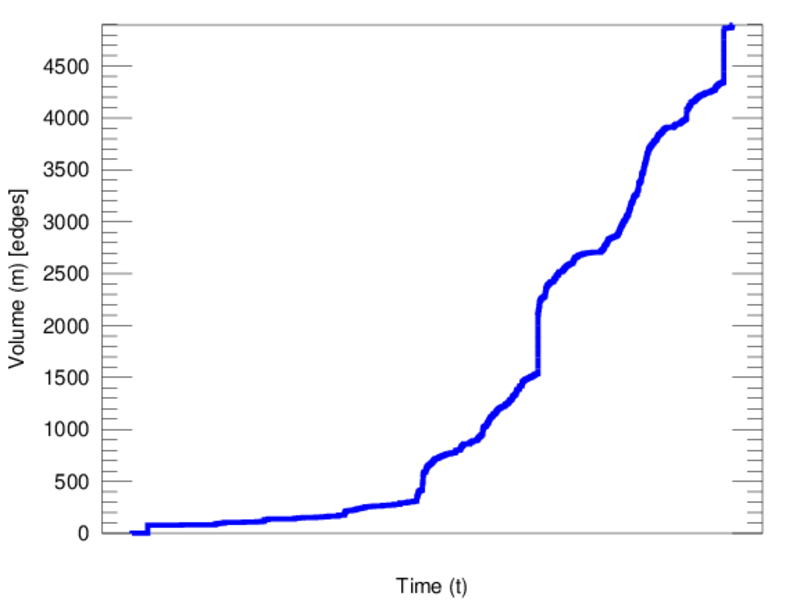
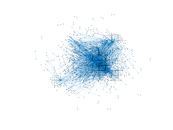
This is the bipartite edit network of the Lingala Wiktionary. It contains users
and pages from the Lingala Wiktionary, connected by edit events. Each edge
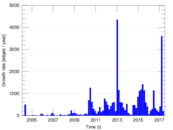
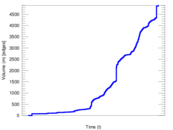
represents an edit. The dataset includes the timestamp of each edit.
Metadata
Statistics
| Size | n = | 1,449
|
| Left size | n1 = | 176
|
| Right size | n2 = | 1,273
|
| Volume | m = | 4,895
|
| Unique edge count | m̿ = | 2,880
|
| Wedge count | s = | 448,600
|
| Claw count | z = | 69,974,774
|
| Cross count | x = | 8,902,741,461
|
| Square count | q = | 302,872
|
| 4-Tour count | T4 = | 4,223,444
|
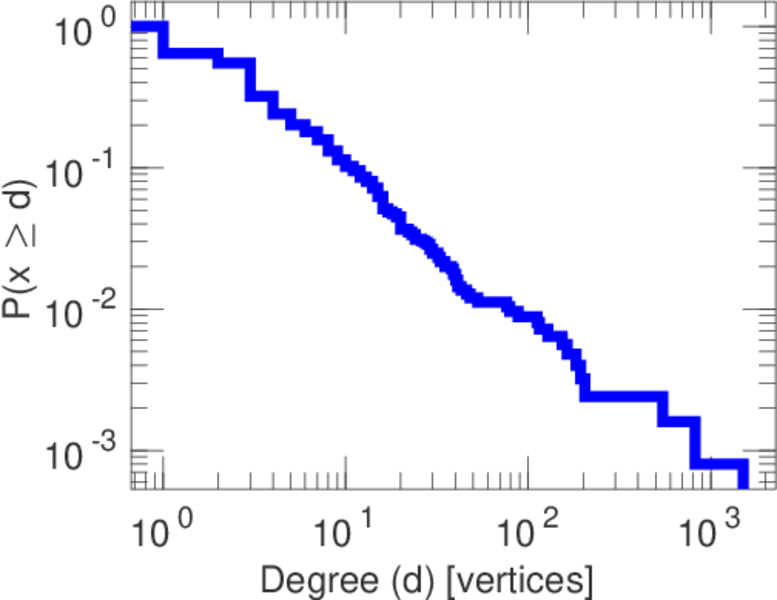
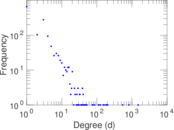
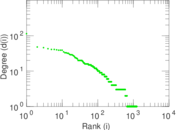
| Maximum degree | dmax = | 1,507
|
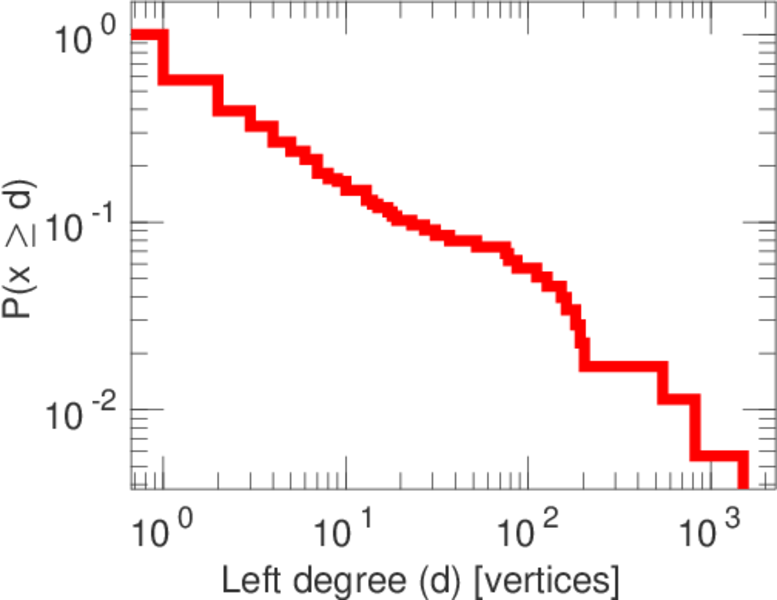
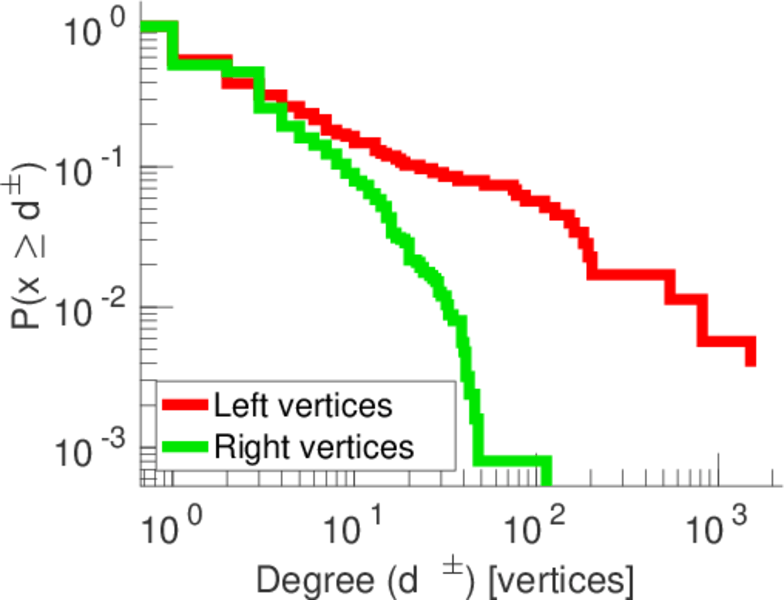
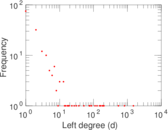
| Maximum left degree | d1max = | 1,507
|
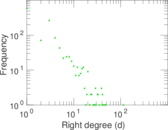
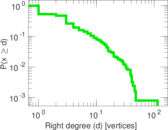
| Maximum right degree | d2max = | 114
|
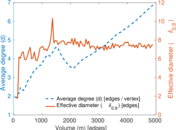
| Average degree | d = | 6.756 38
|
| Average left degree | d1 = | 27.812 5
|
| Average right degree | d2 = | 3.845 25
|
| Fill | p = | 0.012 854 4
|
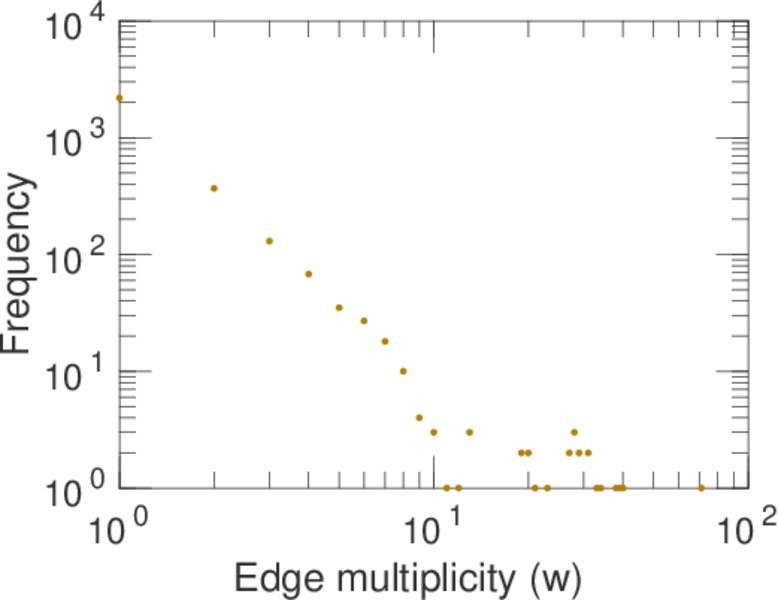
| Average edge multiplicity | m̃ = | 1.699 65
|
| Size of LCC | N = | 1,097
|
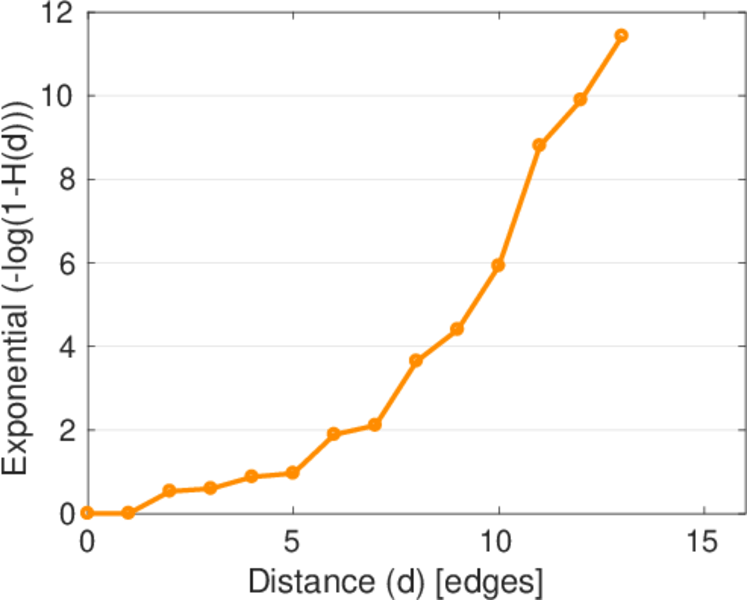
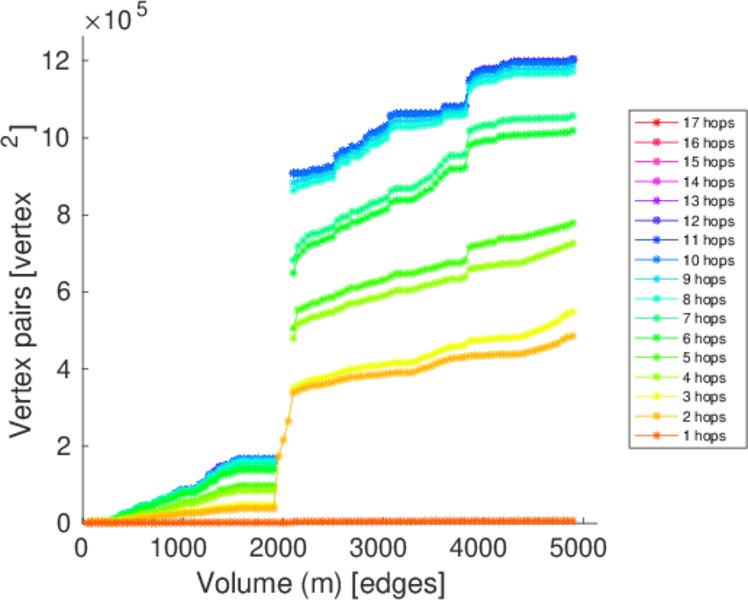
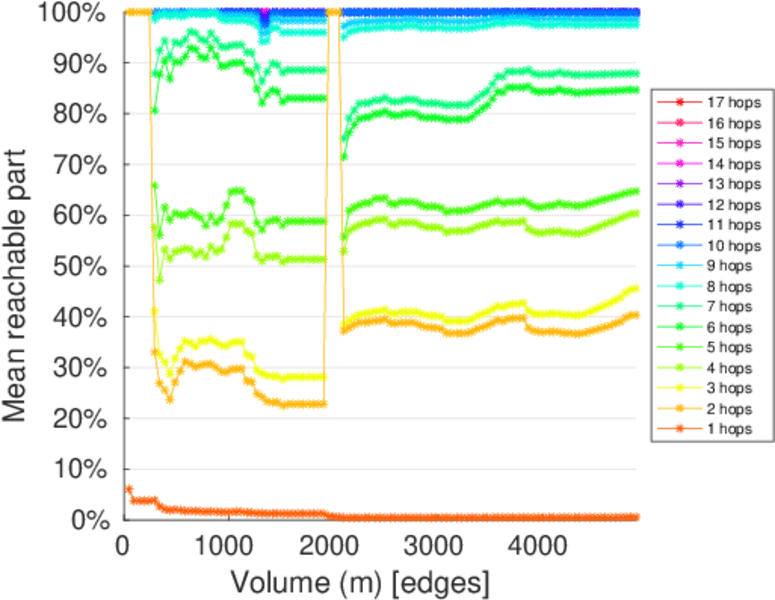
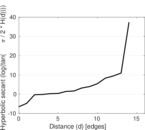
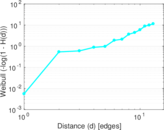
| Diameter | δ = | 14
|
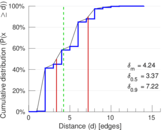
| 50-Percentile effective diameter | δ0.5 = | 3.374 29
|
| 90-Percentile effective diameter | δ0.9 = | 7.222 56
|
| Median distance | δM = | 4
|
| Mean distance | δm = | 4.241 24
|
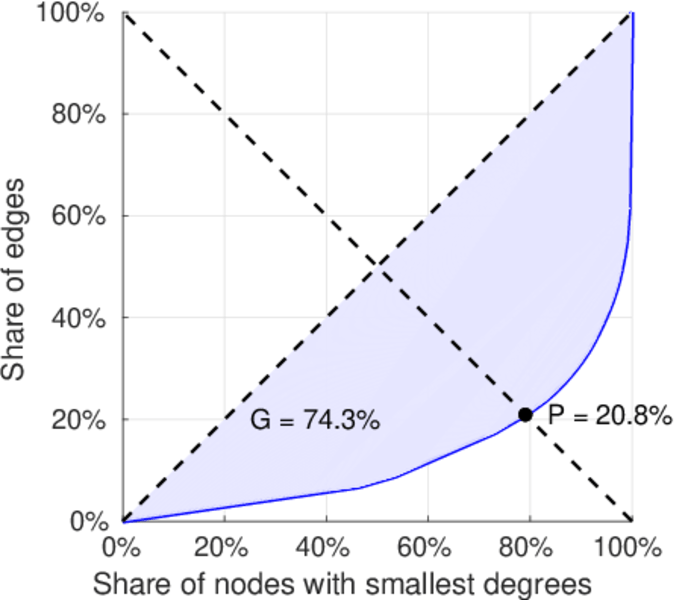
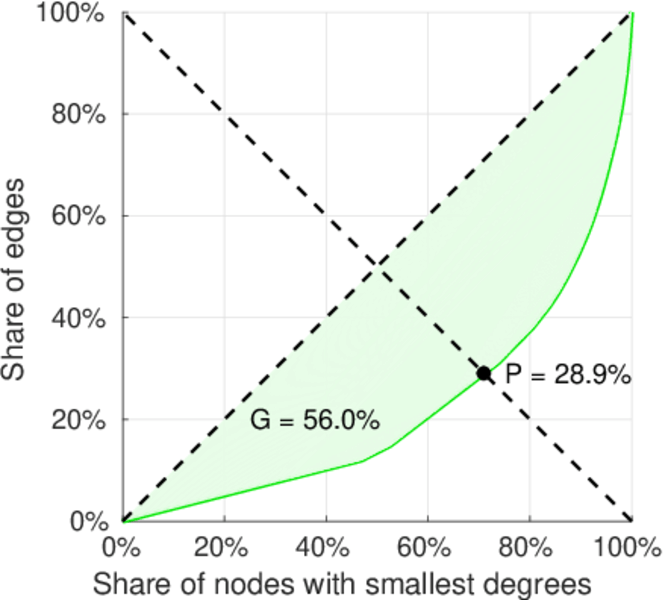
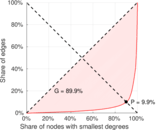
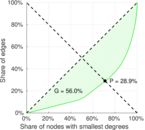
| Gini coefficient | G = | 0.733 832
|
| Balanced inequality ratio | P = | 0.214 096
|
| Left balanced inequality ratio | P1 = | 0.098 672 1
|
| Right balanced inequality ratio | P2 = | 0.289 070
|
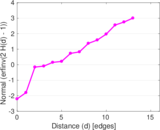
| Relative edge distribution entropy | Her = | 0.774 279
|
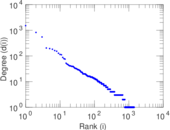
| Power law exponent | γ = | 2.566 70
|
| Tail power law exponent | γt = | 3.051 00
|
| Tail power law exponent with p | γ3 = | 3.051 00
|
| p-value | p = | 0.000 00
|
| Left tail power law exponent with p | γ3,1 = | 1.721 00
|
| Left p-value | p1 = | 0.276 000
|
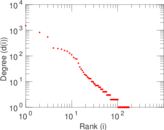
| Right tail power law exponent with p | γ3,2 = | 3.681 00
|
| Right p-value | p2 = | 0.002 000 00
|
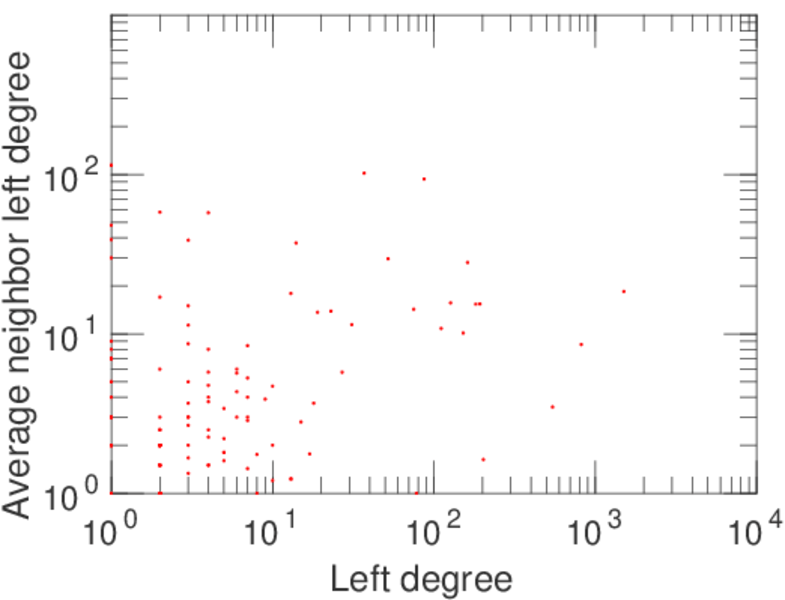
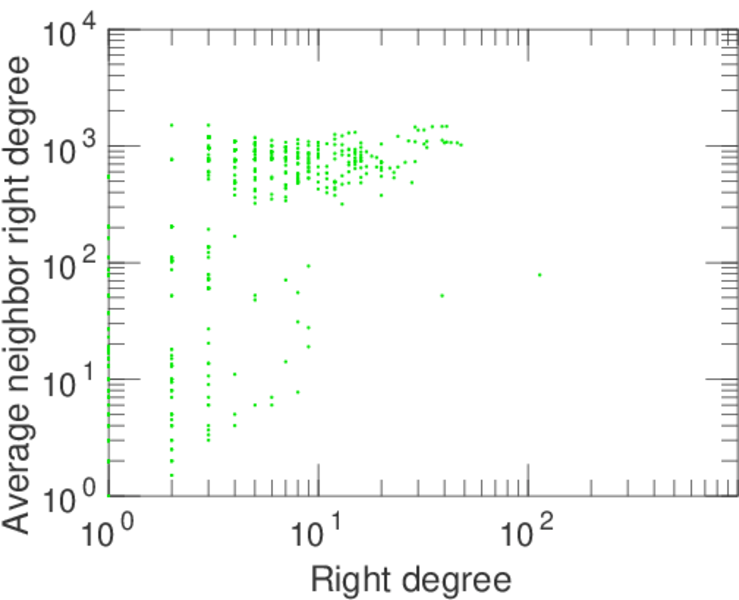
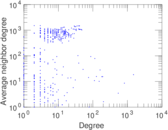
| Degree assortativity | ρ = | −0.067 128 7
|
| Degree assortativity p-value | pρ = | 0.000 312 146
|
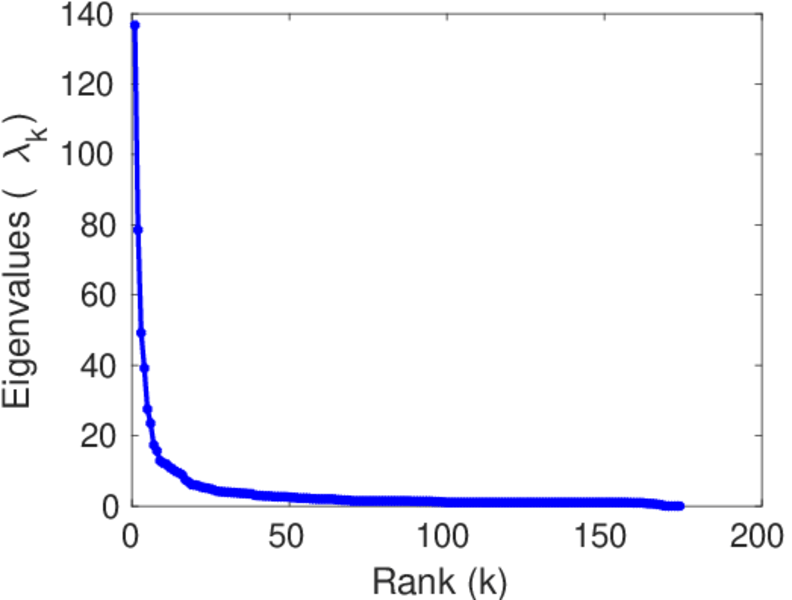
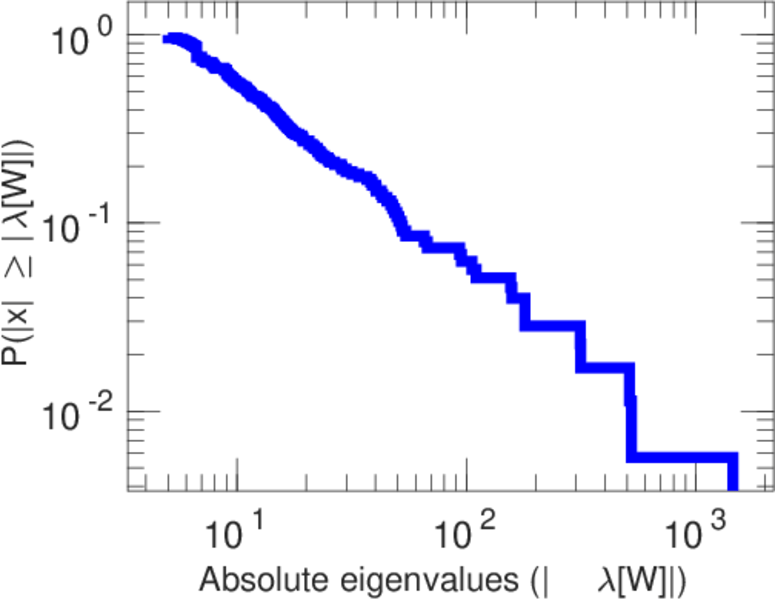
| Spectral norm | α = | 136.716
|
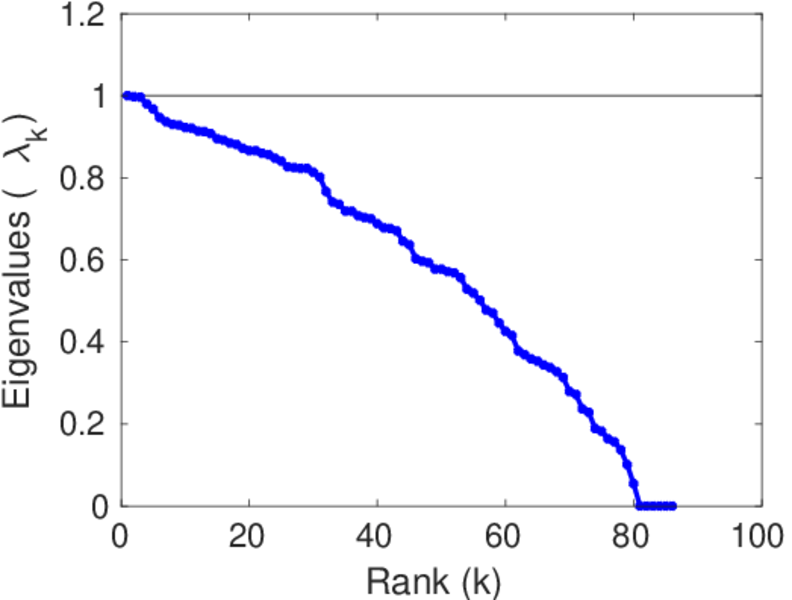
| Algebraic connectivity | a = | 0.007 927 18
|
| Spectral separation | |λ1[A] / λ2[A]| = | 1.741 08
|
| Controllability | C = | 1,087
|
| Relative controllability | Cr = | 0.762 807
|
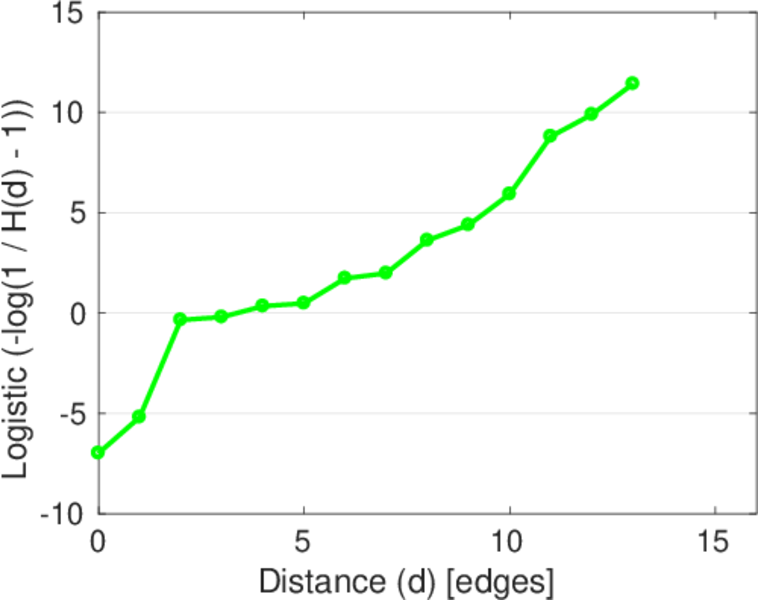
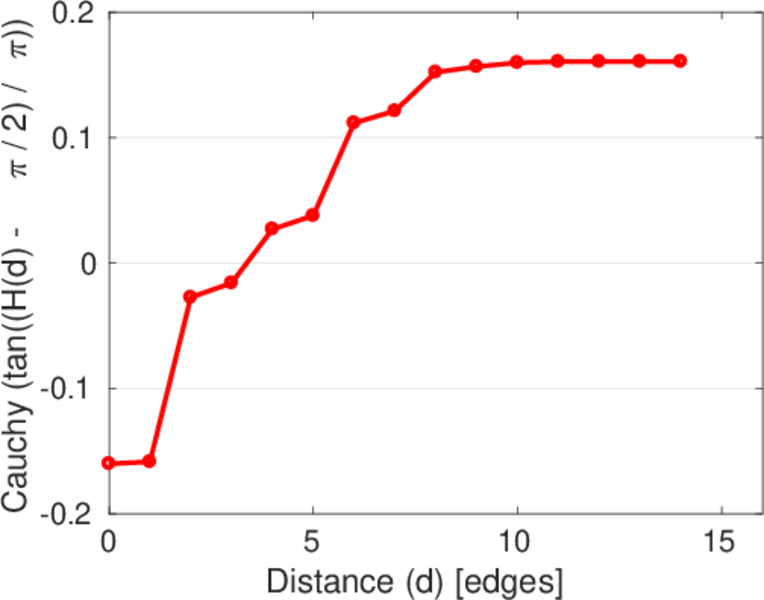
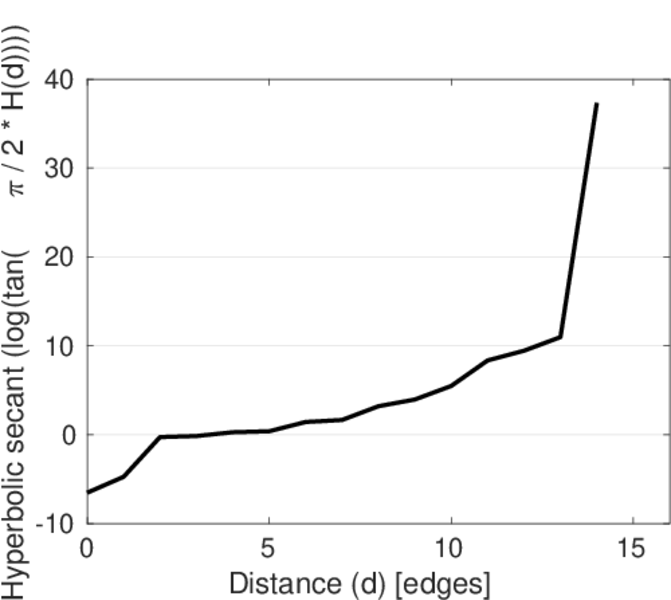
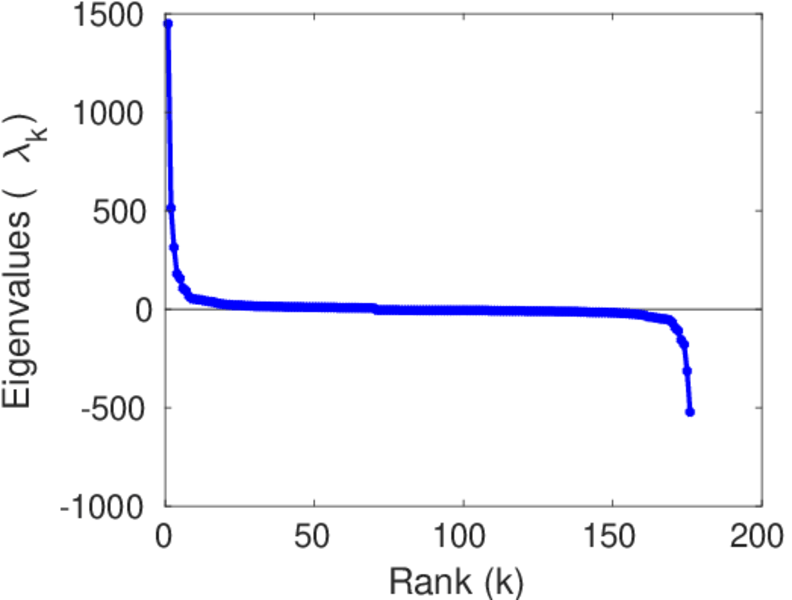
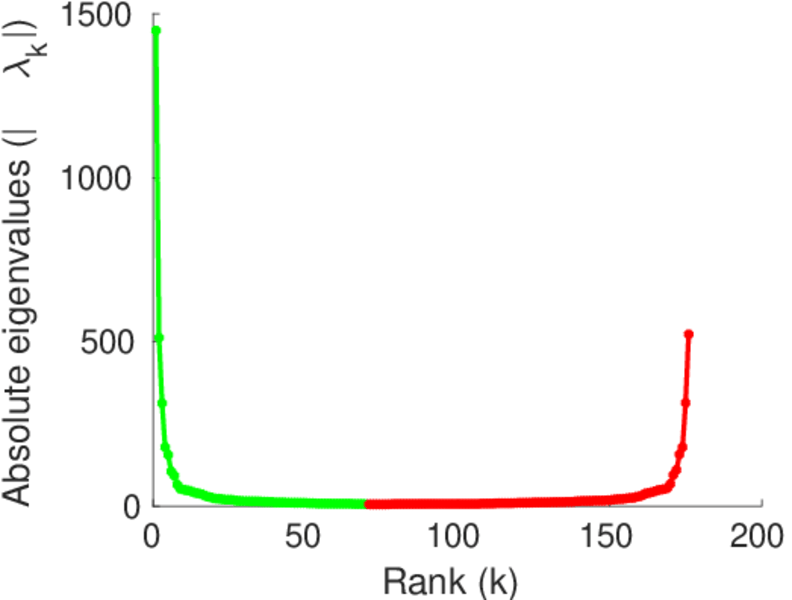
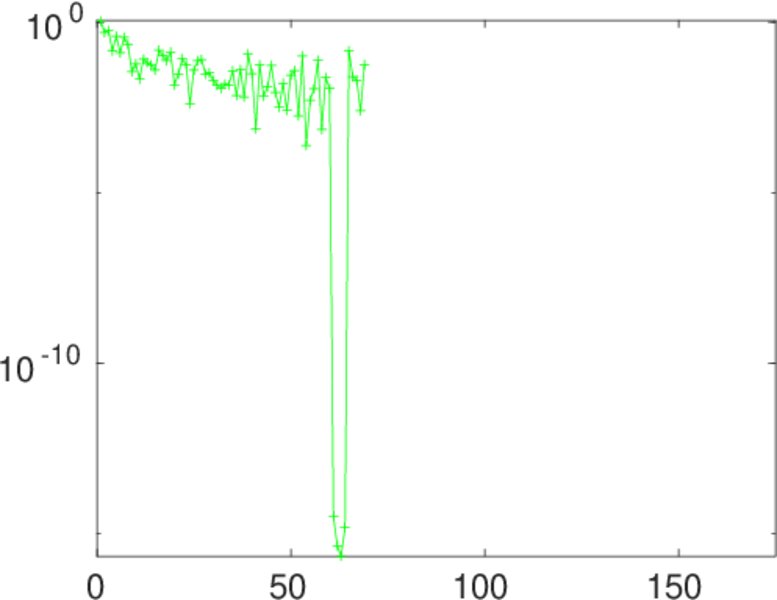
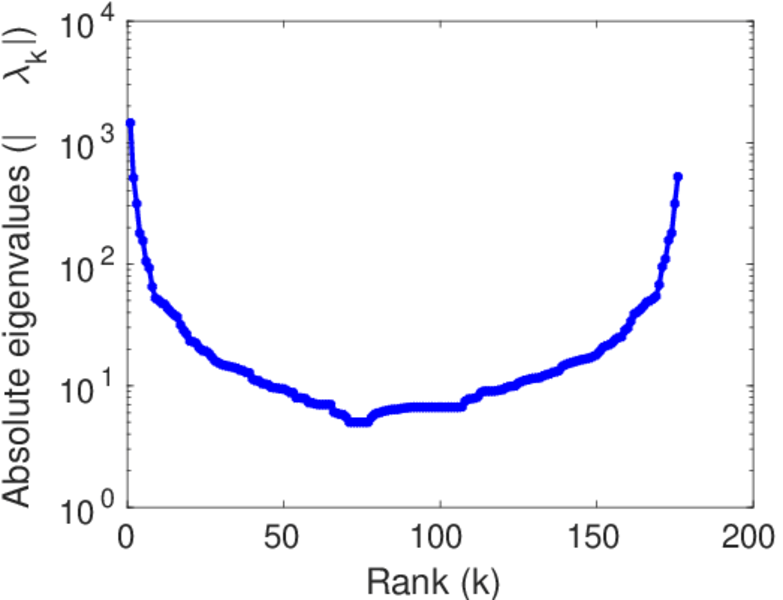
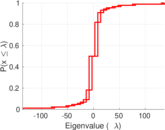
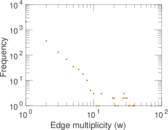
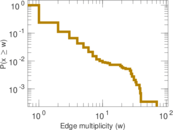
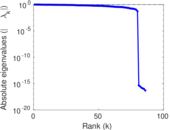
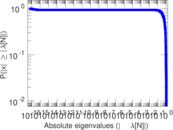
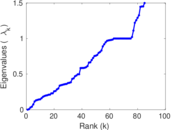
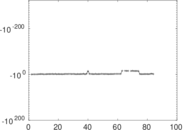
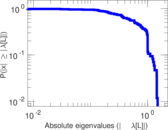
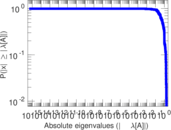
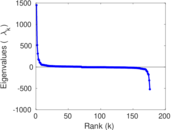
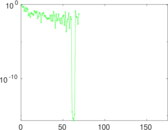
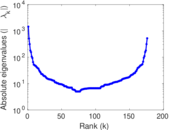
Plots


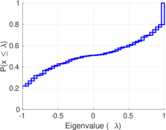
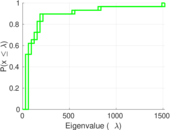


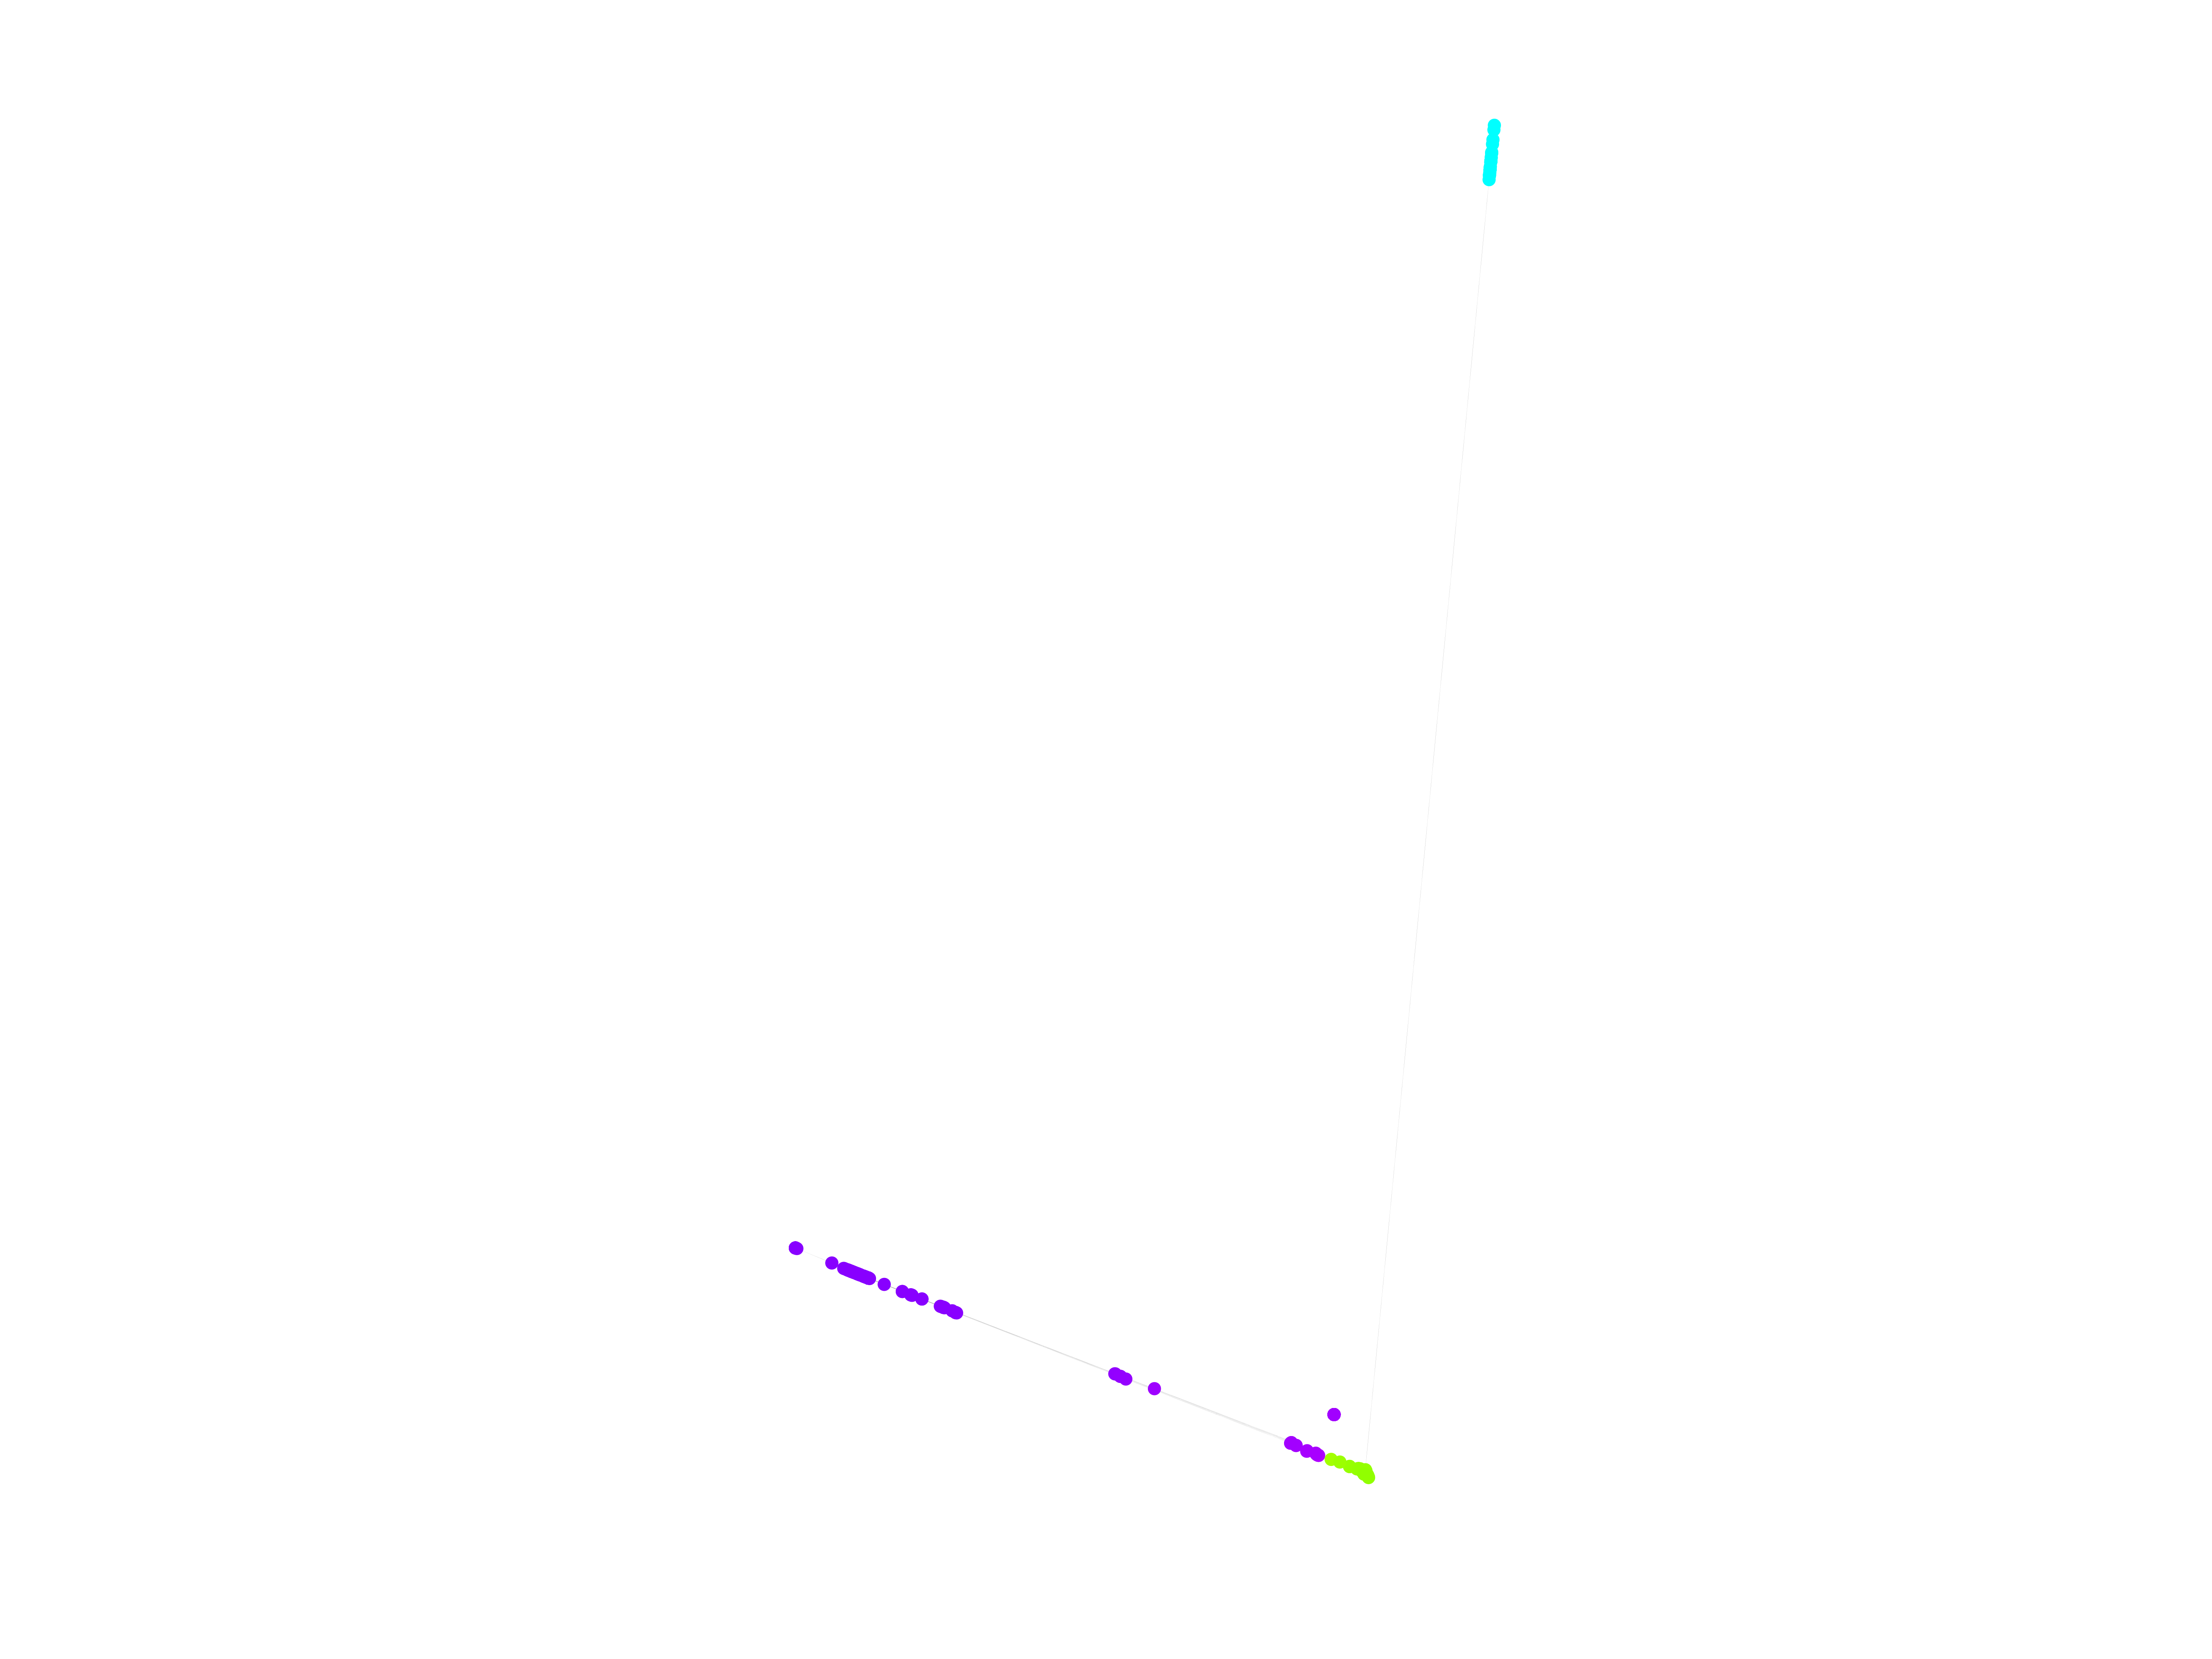
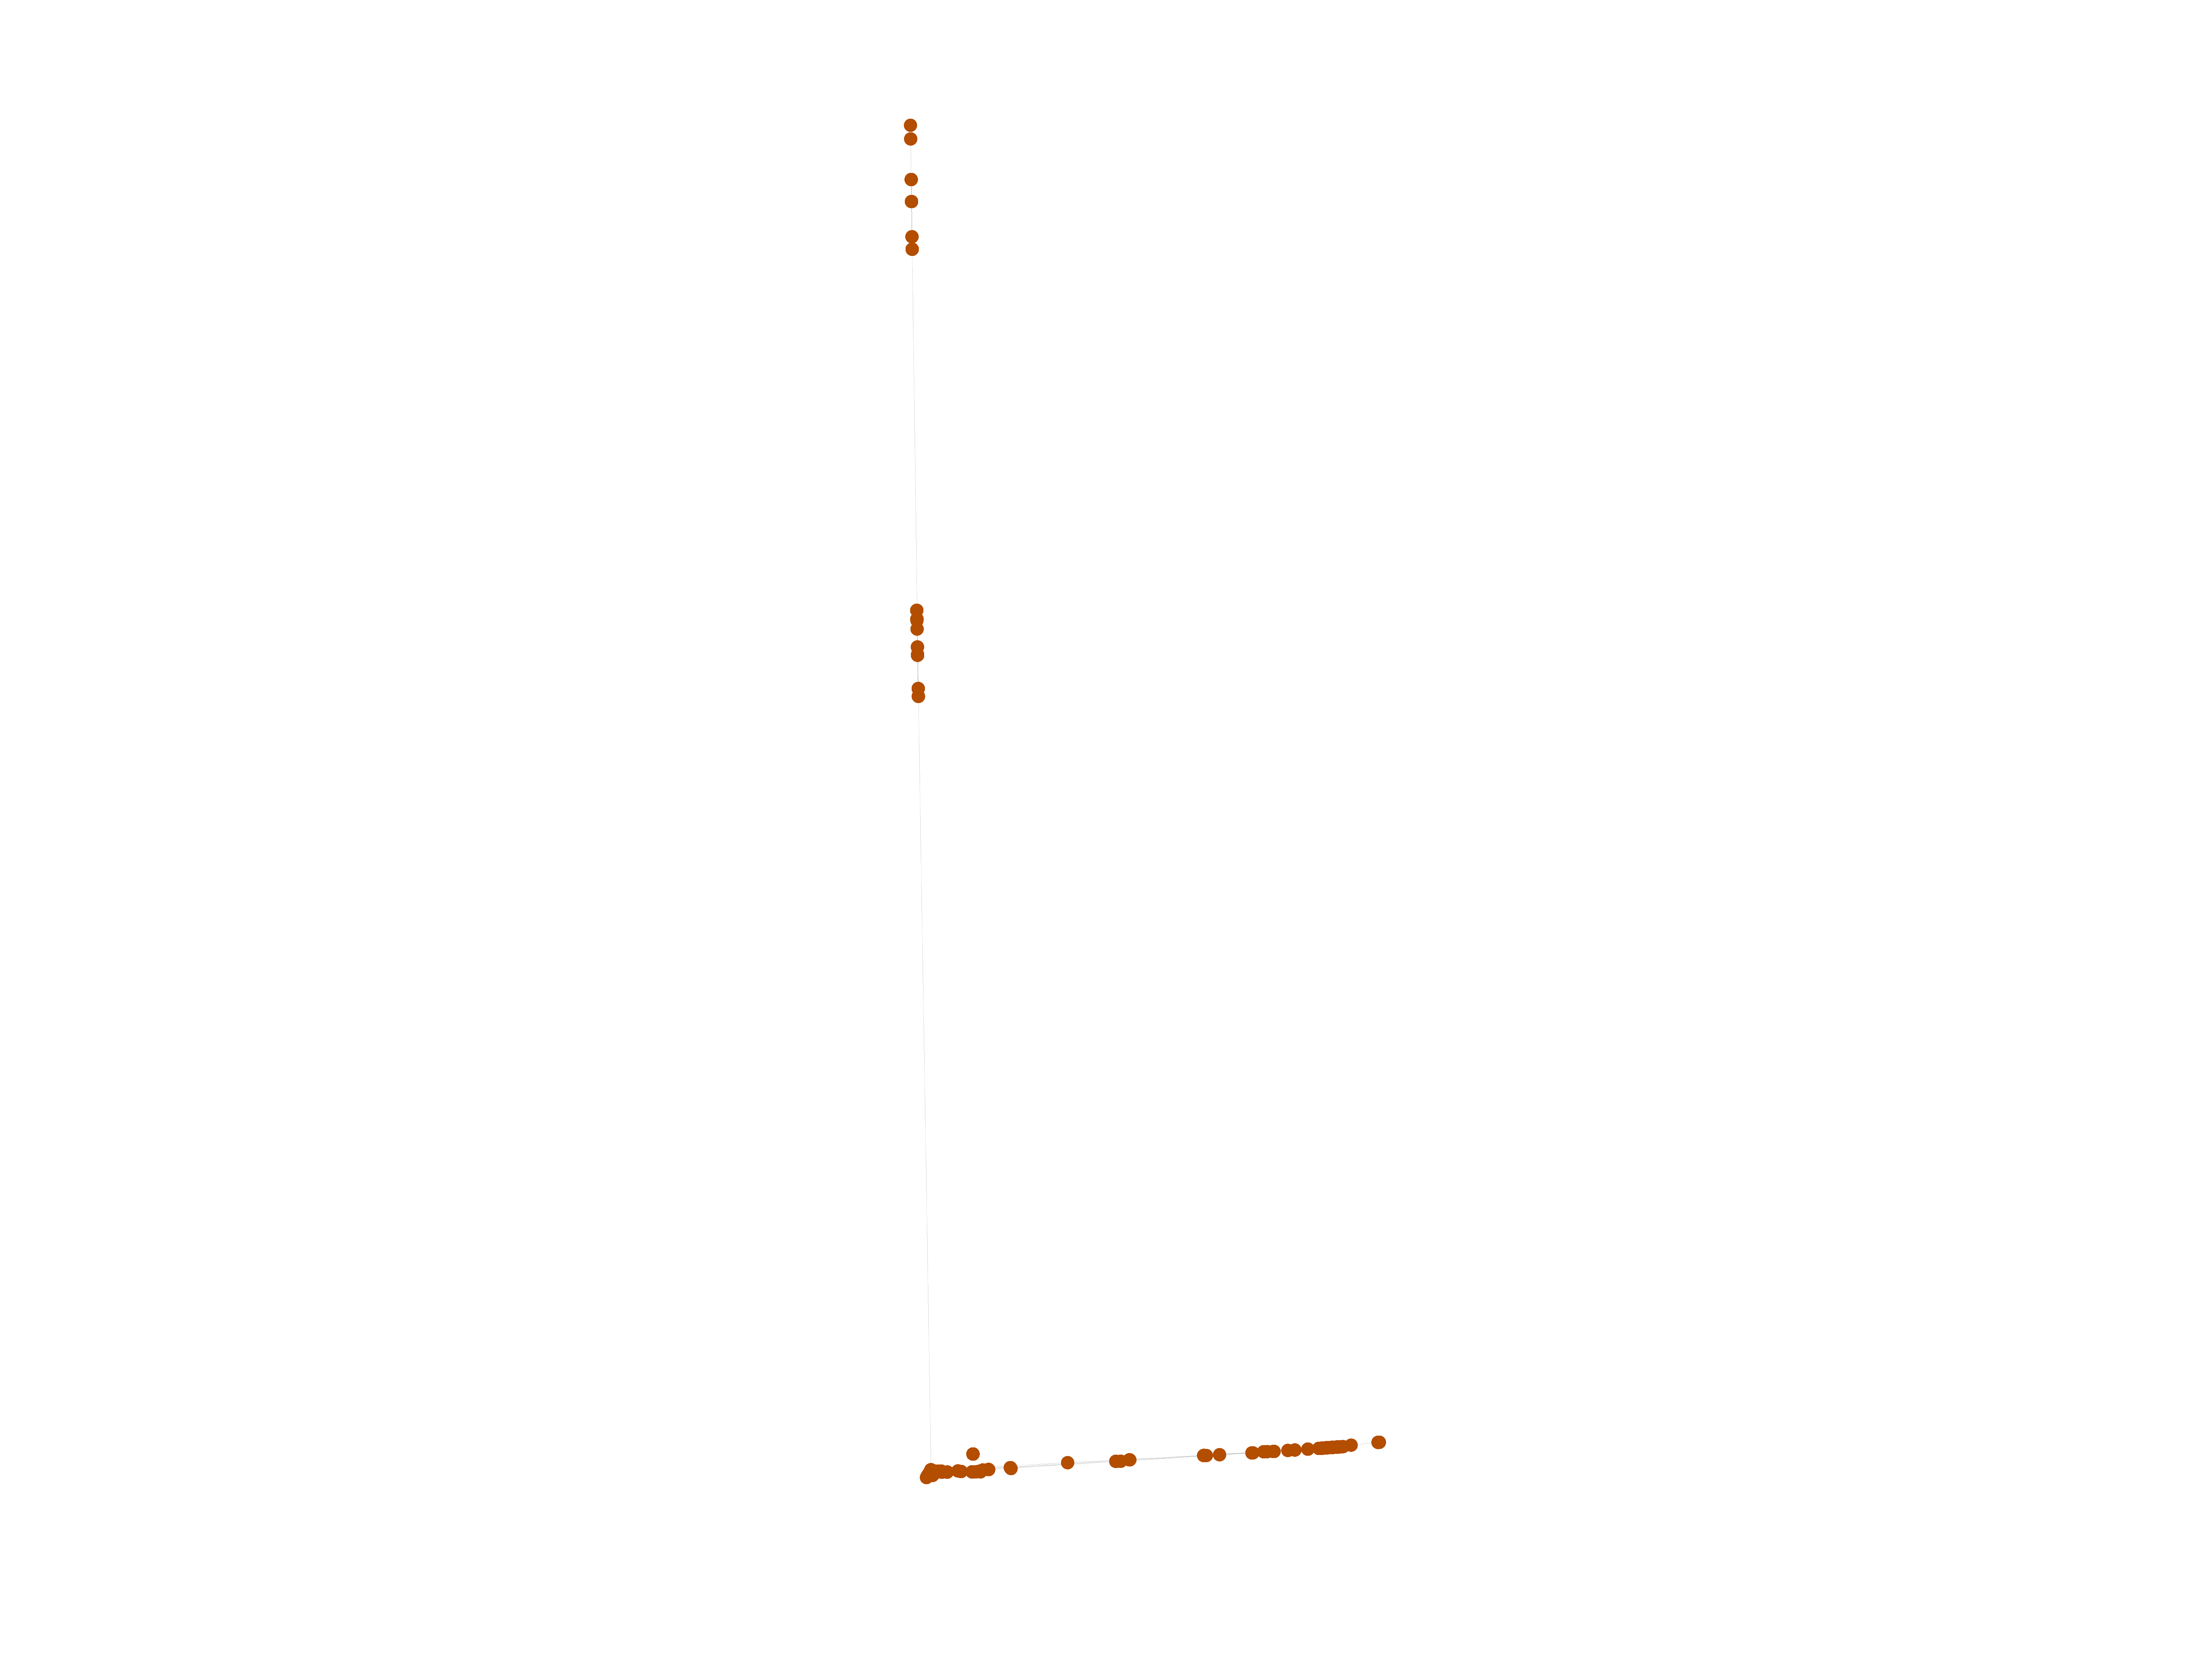
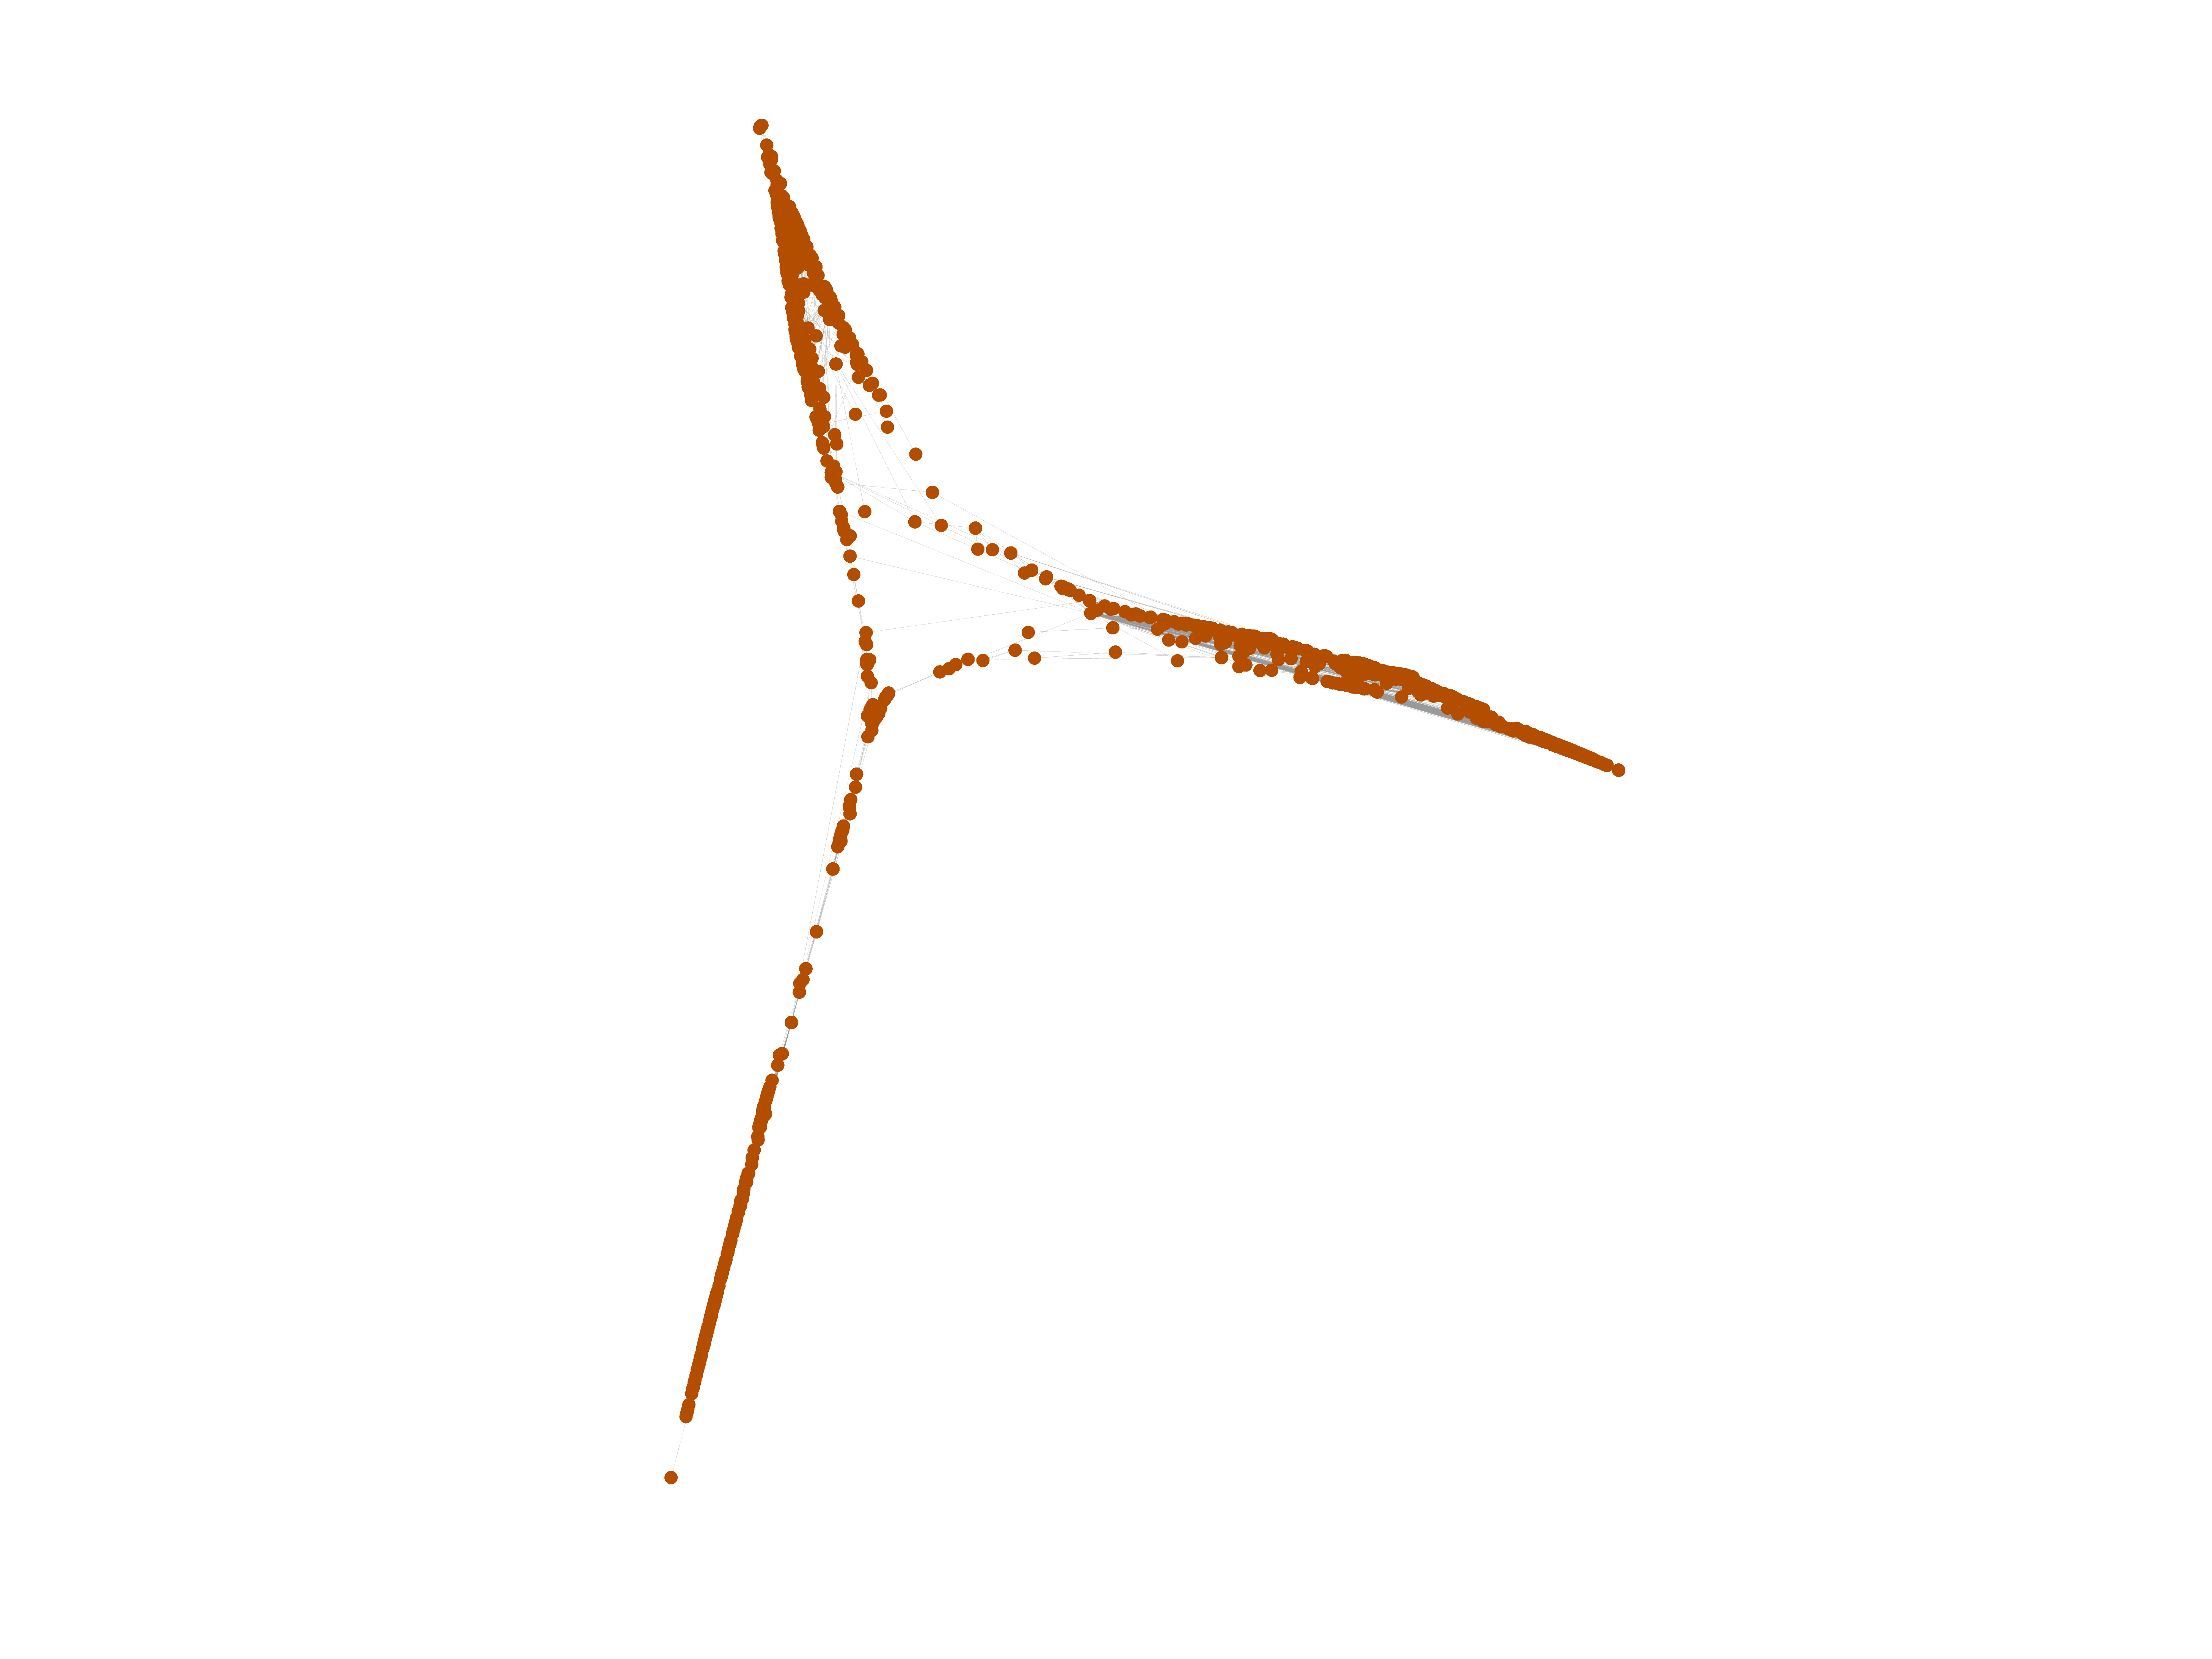
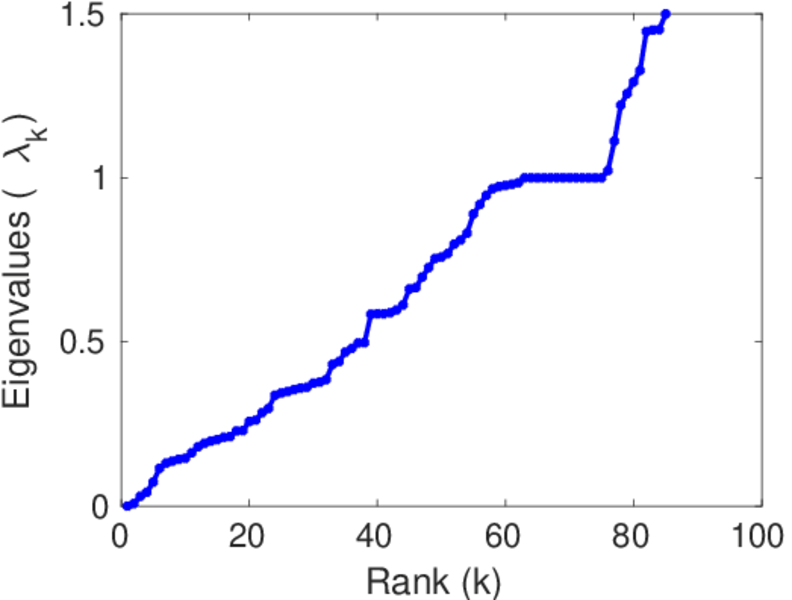
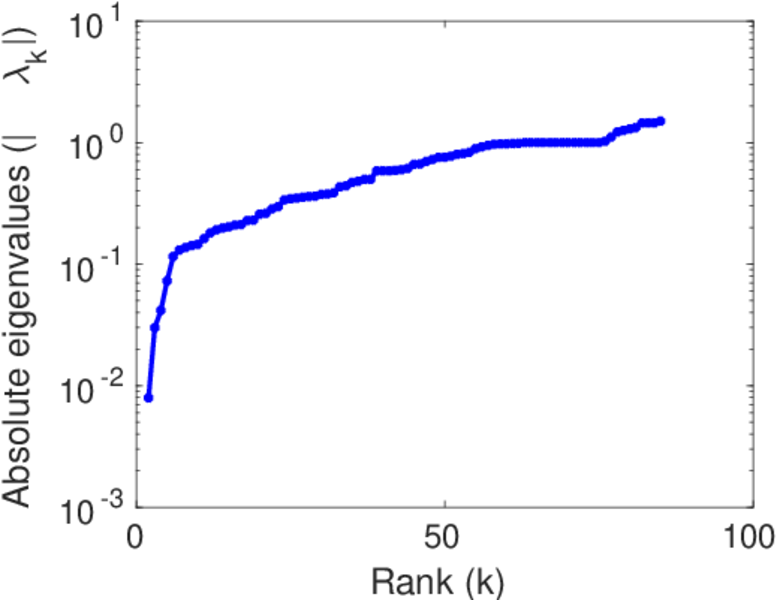
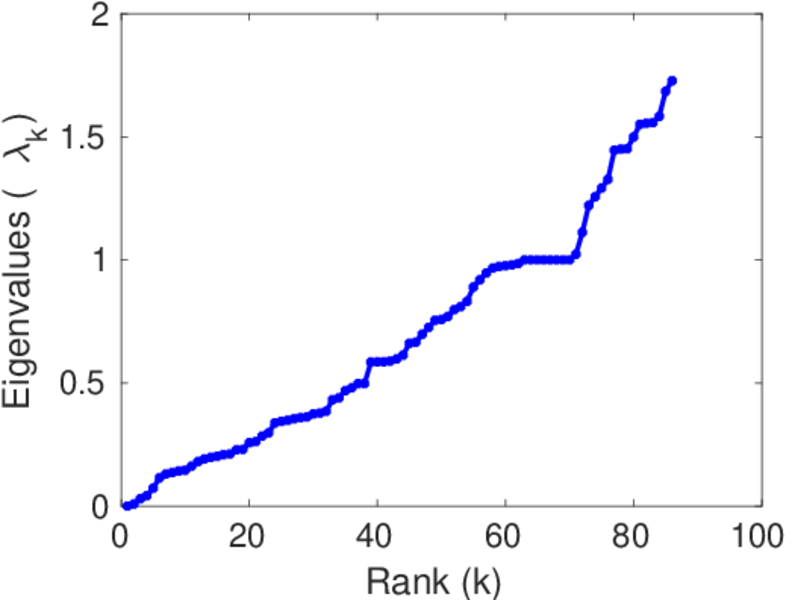
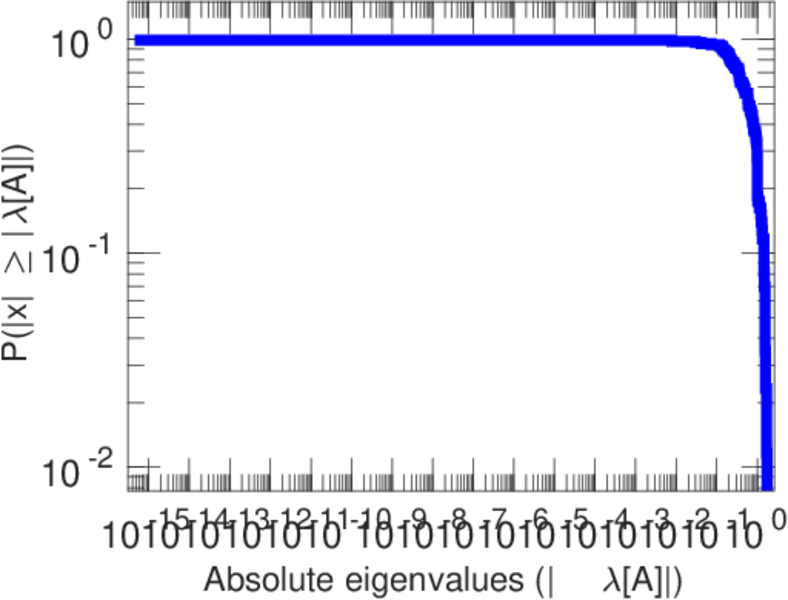
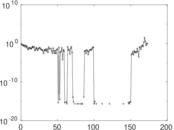
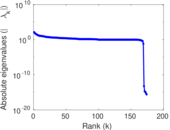
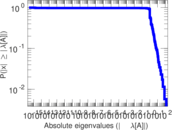
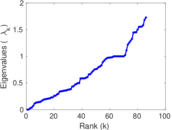
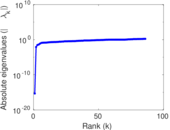
Matrix decompositions plots


Downloads
References
|
[1]
|
Jérôme Kunegis.
KONECT – The Koblenz Network Collection.
In Proc. Int. Conf. on World Wide Web Companion, pages
1343–1350, 2013.
[ http ]
|
|
[2]
|
Wikimedia Foundation.
Wikimedia downloads.
http://dumps.wikimedia.org/, January 2010.
|
 KONECT ‣ Networks ‣
Buy Me a Coffee
KONECT ‣ Networks ‣
Buy Me a Coffee